Article

Bilateral Carotid Calcification Correlates with Regional Cerebral Glucose Metabolism: Insights from PET/CT Imaging of Patients with Cardiovascular Risk Factors

1
Department of Radiology, Hospital of the University of Pennsylvania, Philadelphia, PA 19104, USA
2
Sidney Kimmel Medical College, Thomas Jefferson University, Philadelphia, PA 19107, USA
3
Department of Integrative Medicine and Nutritional Sciences, Jefferson University Hospitals, Thomas Jefferson University, Philadelphia, PA 19107, USA
4
Department of Nuclear Medicine, Odense University Hospital, 5000 Odense, Denmark
*
Author to whom correspondence should be addressed.
These authors contributed equally to this work.
J. Vasc. Dis. 2024, 3(2), 112-126; https://doi.org/10.3390/jvd3020010
Submission received: 25 November 2023 / Revised: 31 December 2023 / Accepted: 4 March 2024 / Published: 1 April 2024
(This article belongs to the Section Cardiovascular Diseases)

Abstract

:
Background: Cardiovascular disease is a leading cause of illness and death globally, primarily due to atherosclerosis. This disease reduces blood flow and oxygen delivery to organs, and when it affects the carotid arteries, it can lead to cognitive impairment and dementia. In a population of 104 individuals, comprising both healthy controls and individuals at elevated risk for developing cardiovascular diseases (CVD) due to identified risk factors, we used PET imaging with 18F-fluorodeoxyglucose (FDG) to assess cerebral glucose metabolism and 18F-sodium fluoride (NaF) to detect atherosclerotic calcification. Our statistical analysis revealed significant differences in metabolic activity between healthy and at-risk individuals in specific brain regions. 18F-FDG uptake in the brain varied inversely with respect to the clinical assessment of cardiovascular risk in regions such as the cuneus (β = −0.030, SE = 0.014, p = 0.035), middle occipital gyrus (β = −0.032, SE = 0.011, p = 0.005), and posterior cingulate gyrus (β = −0.032, SE = 0.015, p = 0.044). In contrast, areas including the basis pontis (β = 0.025, SE = 0.012, p = 0.038) and the pons (β = 0.034, SE = 0.013, p = 0.008) exhibited direct correlations. Notably, carotid 18F-NaF uptake had inverse associations with 18F-FDG uptake in the cerebellum (β = −0.825, SE = 0.354, p = 0.021), medulla (β = −0.888, SE = 0.405, p = 0.029), and posterior cingulate gyrus (β = −1.253, SE = 0.567, p = 0.028), while increased carotid calcification influenced metabolic activity in the fusiform gyrus (β = 1.660, SE = 0.498, p = 0.001) and globus pallidus (β = 1.505, SE = 0.571, p = 0.009). We observed that atherosclerotic plaque accumulation, especially in the carotid arteries, has potential implications for metabolic changes in brain regions governing cognition, emotion, sensory perception, and motor activities. Our findings underscore the possible early interventions that can be used to preempt or delay cognitive deterioration linked with cardiovascular ailments.

1. Introduction

Cardiovascular disease (CVD) is a leading cause of morbidity and mortality worldwide, as it accounts for 32% of global deaths [1]. Atherosclerosis, the occlusion of arteries due to the accumulation of fatty substances, cholesterol, calcium, and fibrin in the arterial walls, can result in reduced blood flow and a subsequent decrease in oxygen delivery to the organs supplied by the affected artery [2]. Atherosclerosis and subsequent hypoperfusion are the primary pathophysiologies behind major vascular causes of death, such as heart attacks, strokes, and cerebrovascular diseases [1,3,4]. Atherosclerosis of the carotid arteries, often related to hypertension, diminishes the arteries’ ability to dampen pulse pressure, subjecting the microvasculature to a higher pressure. The small arteries, arterioles, and capillaries that supply blood to brain regions are ill-equipped to withstand such high pressures, potentially becoming damaged and dysfunctional. In addition to hypoperfusion caused by stenosed and narrowed carotid arteries, unstable atherosclerotic plaques can rupture, resulting in embolisms that can also damage the microvasculature and cause ischemic events, further contributing to the development of cognitive impairment and dementia [5,6,7,8].
Positron emission tomography–computed tomography (PET-CT) enables the in vivo assessment of cerebral glucose metabolism. As extensively documented in the literature, 18F-fluorodeoxyglucose (18F-FDG) has been recognized as a crucial diagnostic marker in the early stages of dementia, allowing for differentiation between multiple neurodegenerative diseases and dementia subtypes through the identification of distinct patterns of cerebral glucose hypometabolism, according to topographic metabolic alterations [9,10,11]. 18F-Sodium Fluoride (NaF)-PET, a valid method of assessing molecular calcification and therefore atherosclerosis, can be utilized to detect and quantify atherosclerosis in CVD patients and controls. NaF has also been utilized to detect atherosclerosis in patients with cardiovascular risk factors (CRFs), allowing for the early identification of atherosclerotic calcification [12,13,14]. 18F-NaF PET demonstrates the potential to supplement existing methods for patient stratification and the identification of vulnerable populations based on cardiovascular risk factors, further guiding clinical decision making and medical management. The reported literature, however, has not clearly correlated arterial disease throughout the body with cerebral hypometabolism.
Given the increasing evidence of an association between CVD and cognitive decline in the absence of stroke, early detection is crucial to allow for timely and effective intervention before irreversible changes occur. In this study, we evaluate regional glucose metabolism in subjects with known cardiovascular risk factors. With a novel methodology that integrates both 18F-FDG PET/CT imaging and 18F-NaF PET/CT imaging, this study seeks to explore the potential correlations between cardiovascular risk factors and brain metabolic activity. Building on prior research linking cardiovascular risk to changes in specific brain functions, we hypothesized that individuals at risk for cardiovascular disease would show reduced cerebral glucose metabolism, especially in areas pivotal for memory, cognition, and behavior, when compared to healthy controls [12]. We anticipate that these patterns of decreased metabolism could serve as early indicators of cognitive decline associated with cardiovascular risk. Additionally, we suspect metabolism in these significant regions would inversely correlate with carotid microcalcification.

2. Materials and Methods

2.1. Study Population

The study population included 104 individuals, aged 21–75, selected from a pool of 139 subjects participating in the Cardiovascular Molecular Calcification Assessed by 18F-NaF PET-CT (CAMONA) protocol, for whom PET/CT images were of sufficient quality to allow bilateral carotid segmentation. This prospective study was conducted under the purview of the Danish National Committee on Biomedical Research Ethics and in accordance with the 1964 Helsinki declaration and its later amendments. All subjects gave written informed consent prior to the study.

2.2. Patient Evaluation

Our analysis included 66 healthy controls (mean age: 43.9 ± 13.5 years; 51.6% male) and 38 individuals at risk of developing cardiovascular disease (CVD) (mean age: 56.1 ± 11.8 years; 50% male), as determined by a Heart Systematic Coronary Risk Evaluation core (SCORE-2 or SCORE-2-OP) of >0% or the presence of angina pectoris symptoms. A cohort of healthy Danish individuals was assembled from a random sample of the population, with no known history or indicators of cardiovascular disease (CVD). These subjects were assessed for potential future CVD risks utilizing calculative models like the Framingham Risk Score (FRS), which projects a decade’s worth of risk of myocardial infarction, along with the European SCORE method. The latter predicts the likelihood of cardiovascular mortality over a ten-year span, factoring in variables including gender, smoking habits, age, blood pressure measurements, and cholesterol levels. Following standard practice guidelines, SCORE-2 was used for subjects less than 70 years of age, and SCORE-2-OP was used for subjects 70 years of age or older. At-risk subjects were recruited from patients evaluated for chest pain symptoms, including angina pectoris, who were referred for coronary CT angiography. Individuals who were not using any blood pressure medications and who had a greater-than-1% increased risk of fatal CVD, as estimated by the SCORE tool, were eligible for inclusion into the at-risk group. This threshold was determined to ensure that all individuals in the healthy cohort were at risk levels as close to zero as possible. Additionally, to assess risk of stroke associated with CVD, the CHA2DS2-VASc score was calculated for all subjects. Participants were not eligible for the study if they had experienced conditions including but not limited to recent pregnancy, any cancer diagnosis in the last five years, established immunodeficiency disorders, incidents of deep vein thrombosis or pulmonary embolism in the preceding three months, current or past issues with alcohol or substance misuse, psychiatric disorders, or ongoing treatment with statins.

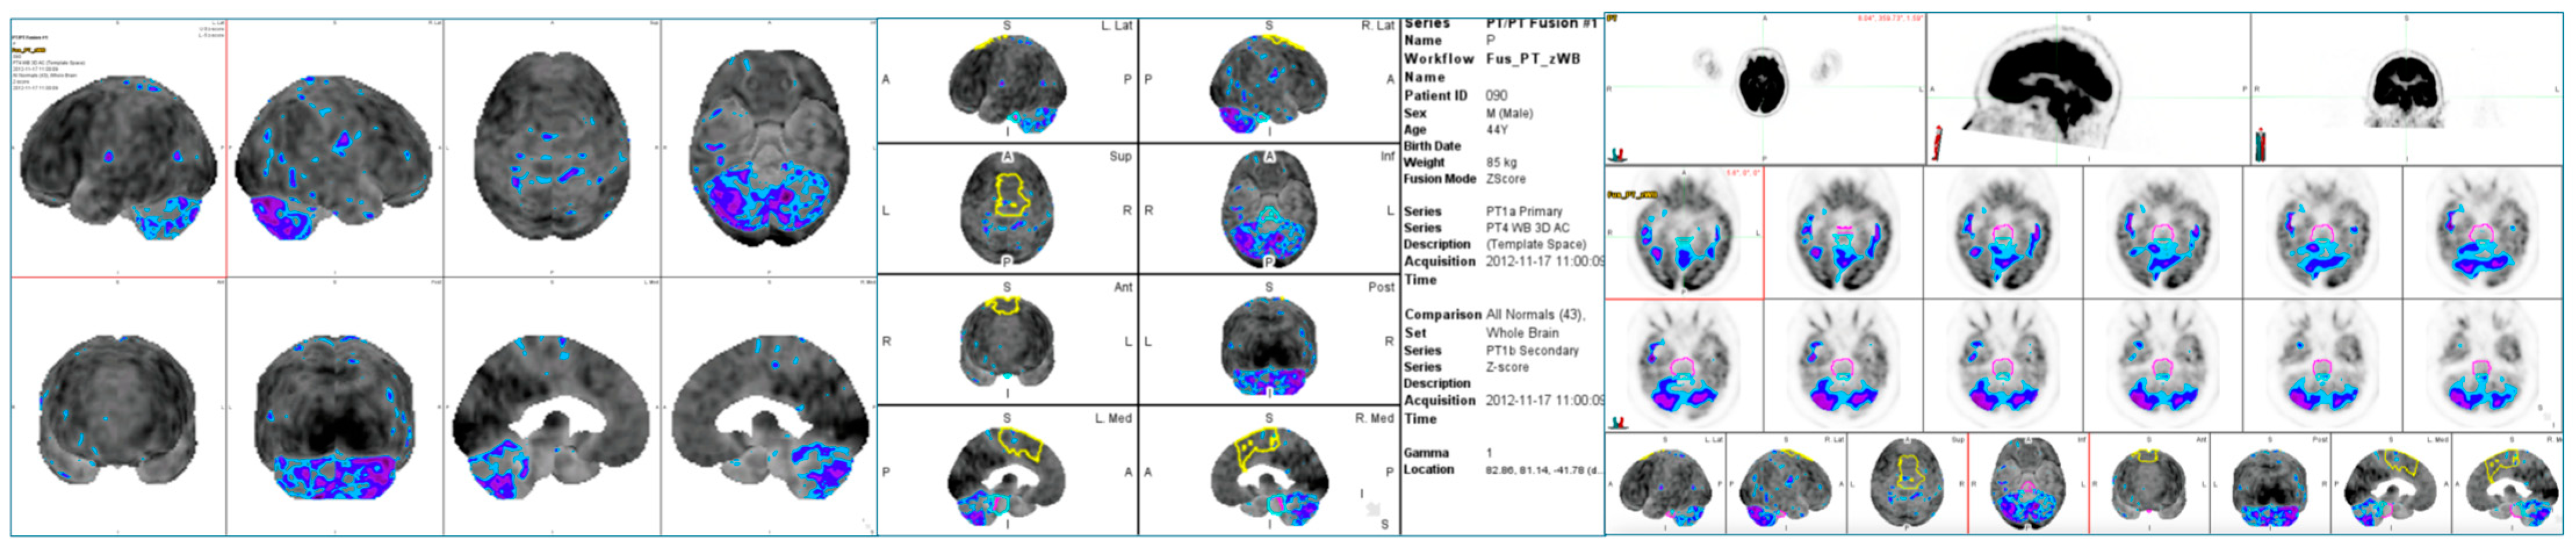
2.3. Brain PET/CT Acquisition Protocol

Each participant was subjected to a PET/CT scan three hours post-administration of an 18F-FDG dose, which was calibrated to 4.0 MBq/kg body weight. The scans were performed using hybrid PET/CT imaging systems (GE Discovery RX, General Electric Company, Boston, MA, USA) that were standardized in terms of spatial resolution. This procedure was preceded by a fasting period of a minimum of eight hours and a prerequisite check ensuring blood glucose levels were maintained below 8 mmol/L. Harmonization of the image characteristics was performed prior to the study’s initiation. The harmonization process, which included the use of measurements obtained using a Hoffman 3D phantom, was employed to ensure the spatial resolution of the brain 18F-FDG PET images remained consistent across different scanners/sites. Low-dose CT imaging (140 kV, 30–110 mA, noise index 25, 0.8 s/rotation, slice thickness 3.75) was employed for attenuation correction and structural correlation with PET scans. Corrections for scatter, attenuation, random coincidences, and the dead time of the scanner were applied to the PET scans.

2.4. Brain PET/CT Data Analysis

Quantitative regional analysis of PET data was conducted using MIMneuro version 7.1.5 (MIM Software, Inc., Cleveland, OH, USA). This software facilitated the analysis of PET images and enabled comparisons of 18F-FDG uptake across diverse brain regions. Instead of providing SUV values, MIM’s software transposes PET data on a voxel-to-voxel basis onto a standard brain template. This template facilitates comparative analysis with a comprehensive anatomical brain atlas, which encompasses pre-established regions of interest. Subsequently, the software generates normalized z-scores utilizing its proprietary database for reference. Within the context of this study, “z-score” is used as an equivalent to “SUV” for comparison purposes, adhering to MIM’s methodology.
As part of MIM’s protocol, metabolic activity for each participant was standardized to the activity of their whole brains based on validated methods. The decision to normalize metabolic activity to the activity of the whole brain was based on previous studies suggesting its stability and reliability as a reference region [15,16]. Using the whole brain takes into account global effects and offers a broad baseline for analysis. This normalization involved linear scaling to account for variations in individual brain size and employed nonlinear warping to diminish discrepancies in brain regions between individual scans and the atlas. The utilized program discerned metabolic activity across the 70 identified regions covered in the analysis (Figure 1). Among these, eight regions are recognized as midline structures, represented by a singular value (e.g., midbrain, pons, medulla, and vermis). Conversely, regions with bilateral counterparts within the two cerebral hemispheres were analyzed distinctly (e.g., left and right lateral temporal lobes). The metabolic activity of each participant was again normalized to their overall brain activity. An independent samples t-test was conducted to evaluate disparities in z-scores between control groups and those identified as at-risk across the 70 regions of interest. The significance threshold was established at p < 0.05.

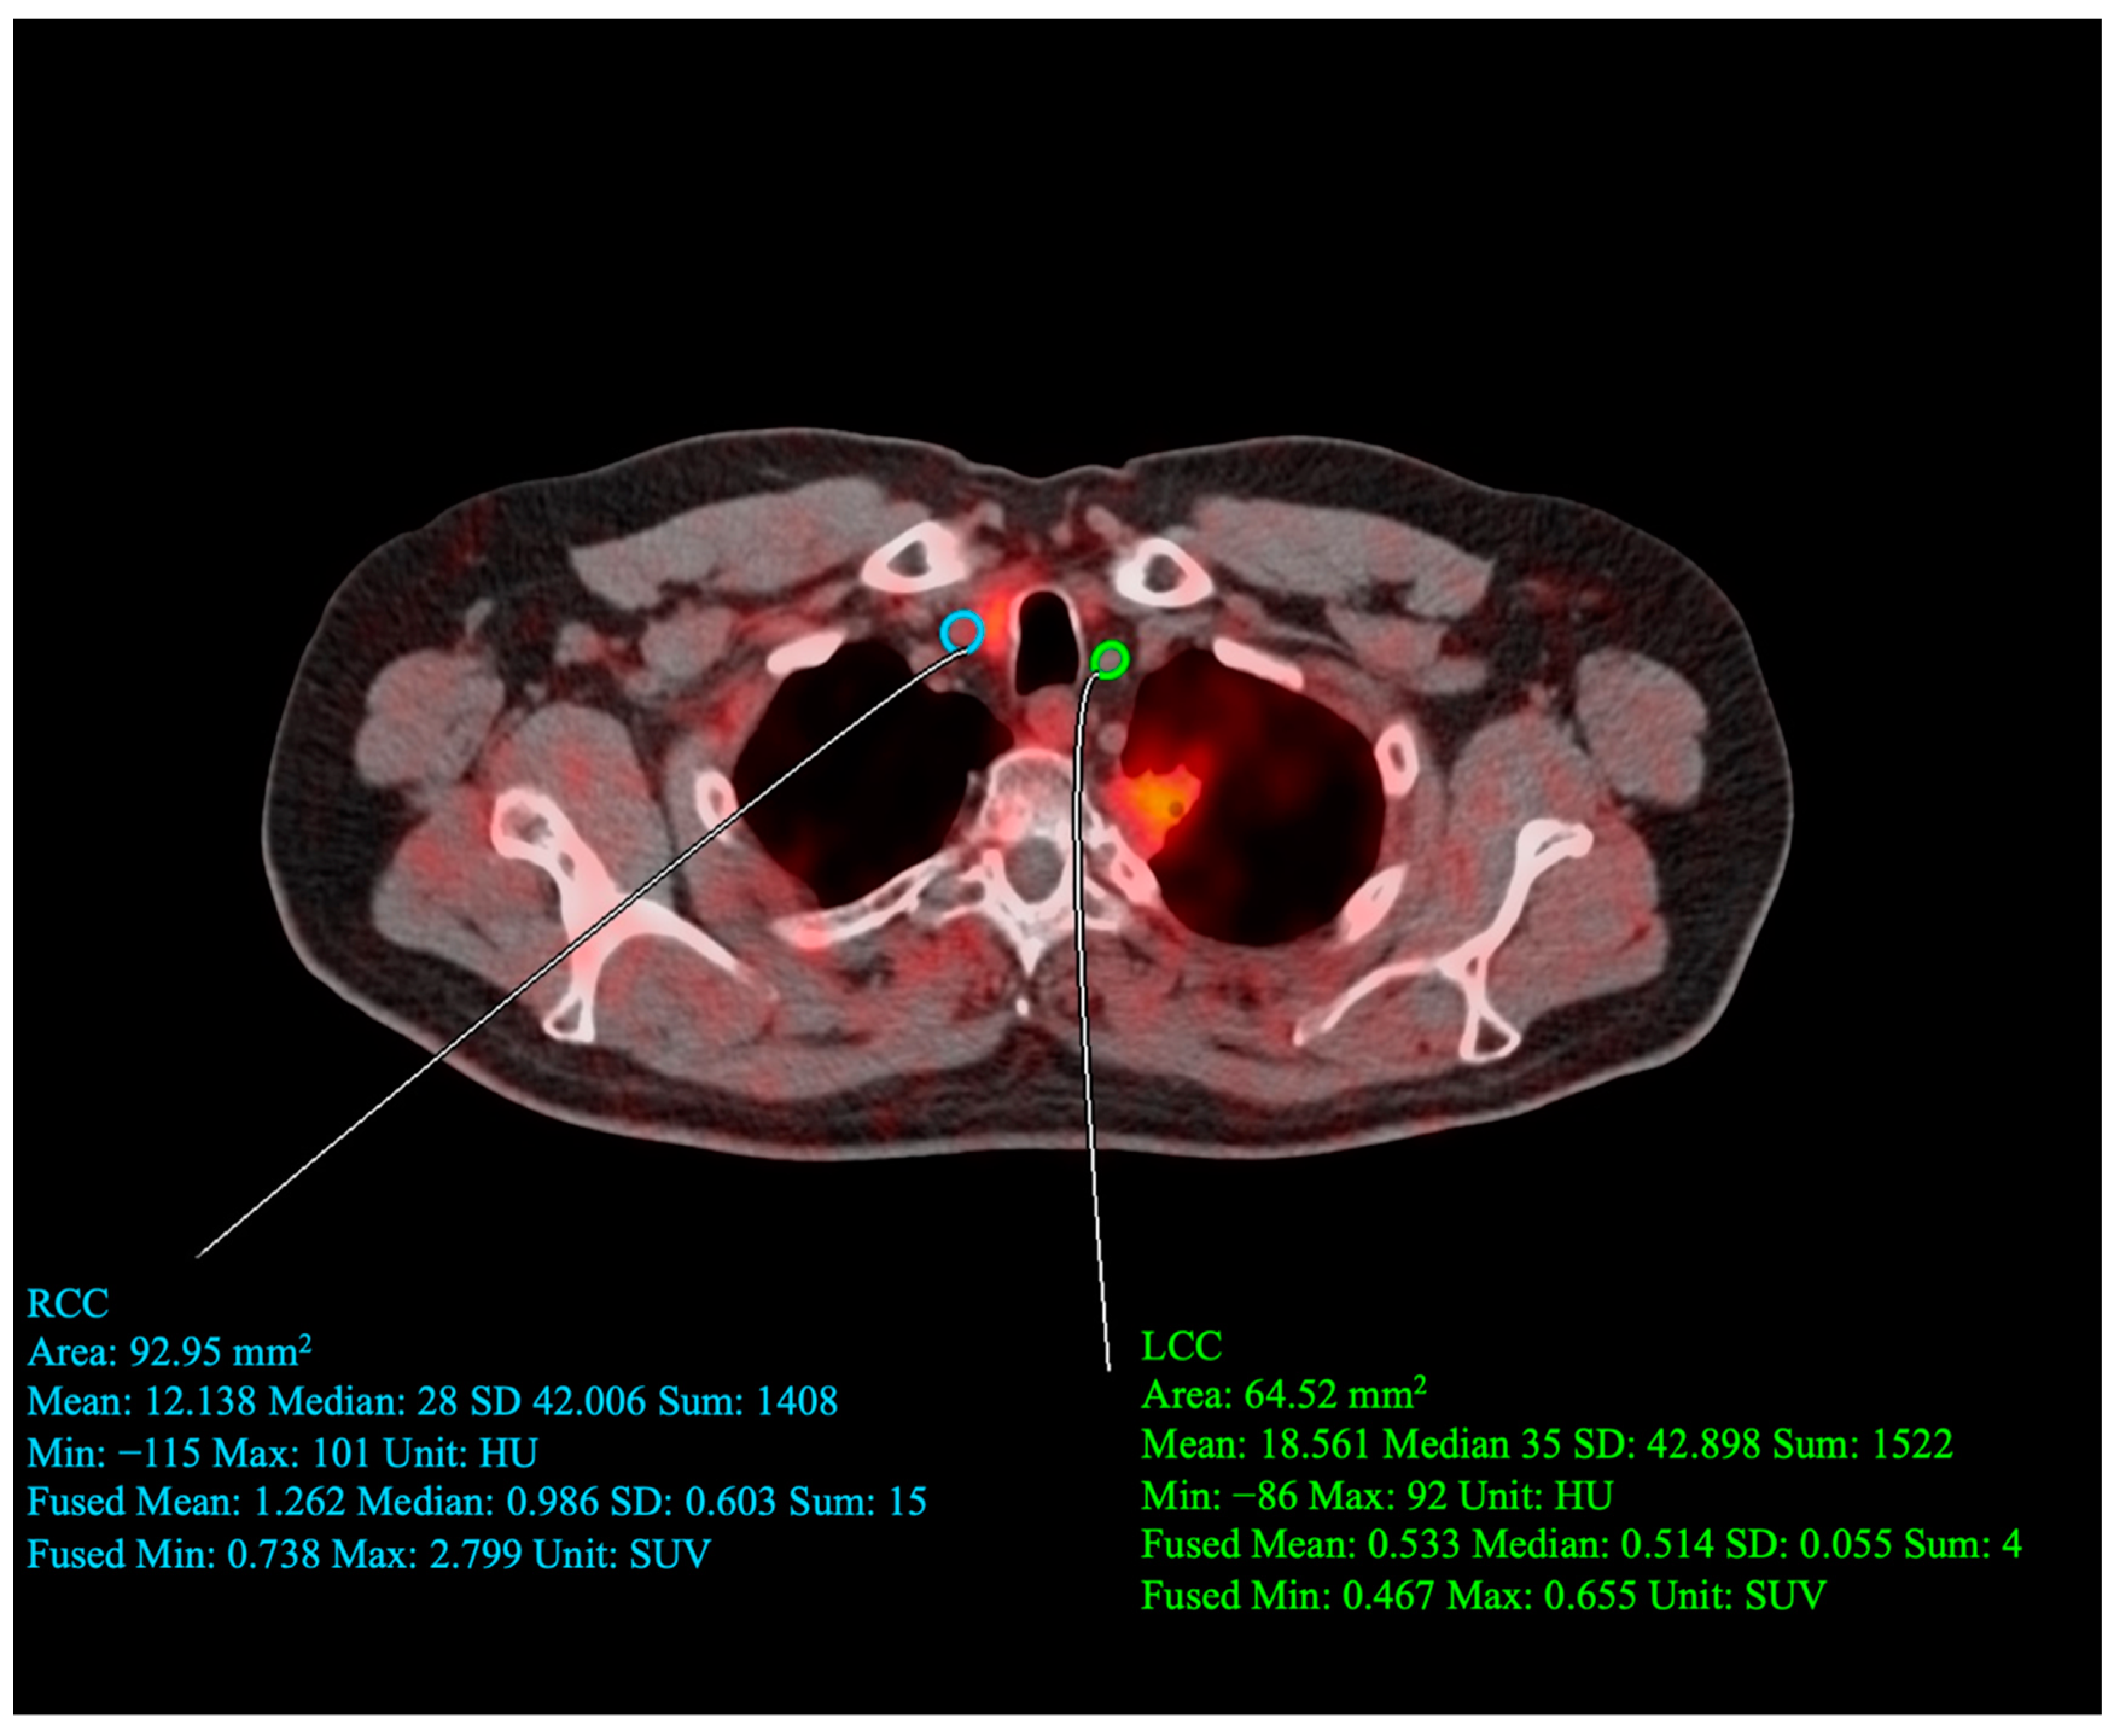
2.5. Carotid PET/CT Acquisition Protocol

18F-NaF PET/CT imaging was employed in accordance with methods previously described by the CAMONA study group [17,18]. Briefly, hybrid PET/CT scanners (GE Discovery RX and 690/710 systems) were employed, and the scanners were randomly assigned to each subject by the hospital’s scheduling department. Harmonization of the image characteristics was performed prior to the study’s initiation. The harmonization process, which included the use of measurements taken using a Hoffman 3D phantom, was employed to ensure the spatial resolution of the 18F-NaF-PET images remained consistent across different scanners/sites. Ninety minutes subsequent to the intravenous administration of 18F-NaF, dosed at 2.2 MBq per kilogram of the subject’s body weight, PET/CT imaging was performed. The PET images underwent correction processes for attenuation, scatter, coincidences that were random, and the dead time of the scanner. The Ordered Subset Expectation Maximization (OSEM) technique was employed to reconstruct these PET images. Concurrently, a low-dose CT scan, with parameters set to 140 kV and 30–110 mA, a noise index of 25, and a 0.8 s rotation time with a slice thickness of 3.75 mm, was utilized for both attenuation correction and providing anatomical reference points. The total effective radiation dose for the complete imaging procedure was estimated to be around 6.7 mSv.

2.6. Carotid PET/CT Data Analysis

OsiriX MD software v.13.0.1 (a Digital Imaging and Communications in Medicine viewer and image-analysis program produced by Pixmeo SARL, Bernex, Switzerland) was employed to analyze 18F-NaF PET/CT scans of all 104 subjects (66 healthy and 38 at-risk). On the fused PET/CT scans, regions of interest (ROIs) were hand-drawn to assess carotid calcification. The semi-quantification of 18F-NaF uptake was determined from the regions outlined by the hand-drawn ROIs, with regions manually traced on each transverse slice (Figure 2). A standardized uptake value mean (SUVmean) was obtained for each transverse slice. ROIs were manually drawn on each 2 mm slice surrounding the common carotid artery of interest. The entire common carotid structure was segmented, extending from the origin of the aortic arch (on the left) or the brachiocephalic trunk (on the right) to the point of carotid bifurcation (at the level of the fourth cervical vertebra or the laryngeal prominence). SUVmean was documented, and the average SUVmean was calculated for both the right and left carotid arteries. Blood-pool correction was conducted by measuring the activity in the inferior vena cava only, as performed by prior CAMONA authors, because this location was least subject to spillover activity from adjacent 18F-fluoride-avid anatomical locations.

2.7. Statistical Analysis

Continuous variables are presented either as means ± SD after normality was ascertained or as medians (25th–75th percentile) when not normally distributed. Evaluation of the distribution’s conformity to a normal curve was performed using the one-sample Kolmogorov–Smirnov test on all the continuous data sets. For comparing these continuous variables, an independent one-way ANOVA was utilized. Categorical data are represented as either percentages or counts. The chi-square test or Fisher’s exact test were used to compare distributions of categorical variables in the healthy and at-risk patient groups. A mixed-effects linear regression model was utilized to determine the relation between scaled 18F-FDG uptake and both cardiovascular risk (FRS) and carotid artery calcification, correcting for carotid laterality as a within-subjects factor (i.e., repeated measurement of left- vs. right-carotid 18F-NaF uptake within one subject at a given time point). Additional fixed model effects included age and patient health status (healthy vs. at-risk for cardiovascular disease). Interaction terms between carotid 18F-NaF uptake and both patient health status and carotid laterality were accounted for in this mixed-effects model. Levene’s test for homogeneity was used to compare differences in coefficients of variation. All analyses were performed using R version 4.0.3.

3. Results

3.1. Clinical Characteristics of the Study Population

The baseline characteristics of the study population are summarized in Table 1. A total of 104 patients (66 healthy and 38 at risk of cardiovascular disease) were included in this study. The baseline characteristics of the study population were generally similar between the healthy and at-risk patients in terms of demographics, comorbidities, and lab tests. The mean age and median Framingham risk score were significantly greater in the at-risk group than in the healthy group. The levels of physical activity and medication usage were similar between the two groups.

3.2. Correlations between Brain Metabolic Activity and Cardiovascular Risk

Table 2 provides the outputs of the multivariable mixed regression model assessing the association between 18F-FDG uptake and cardiovascular risk and age. 18F-FDG uptake inversely correlated with cardiovascular risk in the following regions: the cuneus (β = −0.030, SE = 0.014, p = 0.035), middle occipital gyrus (β = −0.032, SE = 0.011, p = 0.005), parahippocampal gyrus (β = −0.034, SE = 0.014, p = 0.020), posterior cingulate gyrus (β = −0.032, SE = 0.015, p = 0.044), precuneus (β = −0.036, SE = 0.014, p = 0.014), primary visual cortex (β = −0.025, SE = 0.012, p = 0.037), and superior occipital gyrus (β = −0.038, SE = 0.013, p = 0.004). Direct correlations were observed between 18F-FDG uptake and cardiovascular risk in the basis pontis (β = 0.025, SE = 0.012, p = 0.038), pons (β = 0.034, SE = 0.013, p = 0.008), pontine tegmentum (β = 0.053, SE = 0.015, p < 0.001), postcentral gyrus (β = 0.028, SE = 0.012, p = 0.022), posterior orbital gyrus (β = 0.038, SE = 0.013, p = 0.003), Rolandic operculum (β = 0.031, SE = 0.014, p = 0.031), and superior cerebellar peduncle (β = 0.031, SE = 0.011, p = 0.005).
Increased 18F-FDG uptake was directly correlated with both age and cardiovascular risk in the basis pontis (β = 0.029, SE = 0.006, and p < 0.001 and β = 0.025, SE = 0.012, and p = 0.038, respectively) and pons (β = 0.022, SE = 0.007, and p = 0.002 and β = 0.034, SE = 0.013, and p = 0.008, respectively). Metabolic activity directly correlated with age and inversely correlated with cardiovascular risk in the cuneus (β = 0.023, SE = 0.008, and p = 0.004 and β = −0.030, SE = 0.014, and p = 0.035, respectively), middle occipital gyrus (β = 0.015, SE = 0.006, p = 0.021 and β = −0.032, SE = 0.011, and p = 0.005, respectively), parahippocampal gyrus (β = 0.035, SE = 0.008, and p < 0.001 and β = −0.034, SE = 0.014, and p = 0.020, respectively), primary visual cortex (β = 0.025, SE = 0.006, and p < 0.001 and β = −0.025, SE = 0.012, and p = 0.037, respectively), and superior occipital gyrus (β = 0.035, SE = 0.007, and p < 0.001 and β = −0.038, SE = 0.013, and p = 0.004, respectively). Conversely, 18F-FDG uptake in the posterior orbital gyrus was inversely associated with age and directly associated with cardiovascular risk (β = −0.028, SE = 0.007, and p < 0.001 and β = 0.038, SE = 0.013, and p = 0.003, respectively).
Our findings highlight the correlation between metabolic activity in distinct brain regions and both cardiovascular risk and age. An analysis of these correlations uncovered significant variations in the effects of cardiovascular risk and age on regional metabolic activity. To enhance our understanding of the connections between health status, age, and regional metabolic activity in the brain, we explored the correlations between age and the average uptake of 18F-NaF in the carotid arteries, focusing on its influence on metabolic activity across different brain regions.

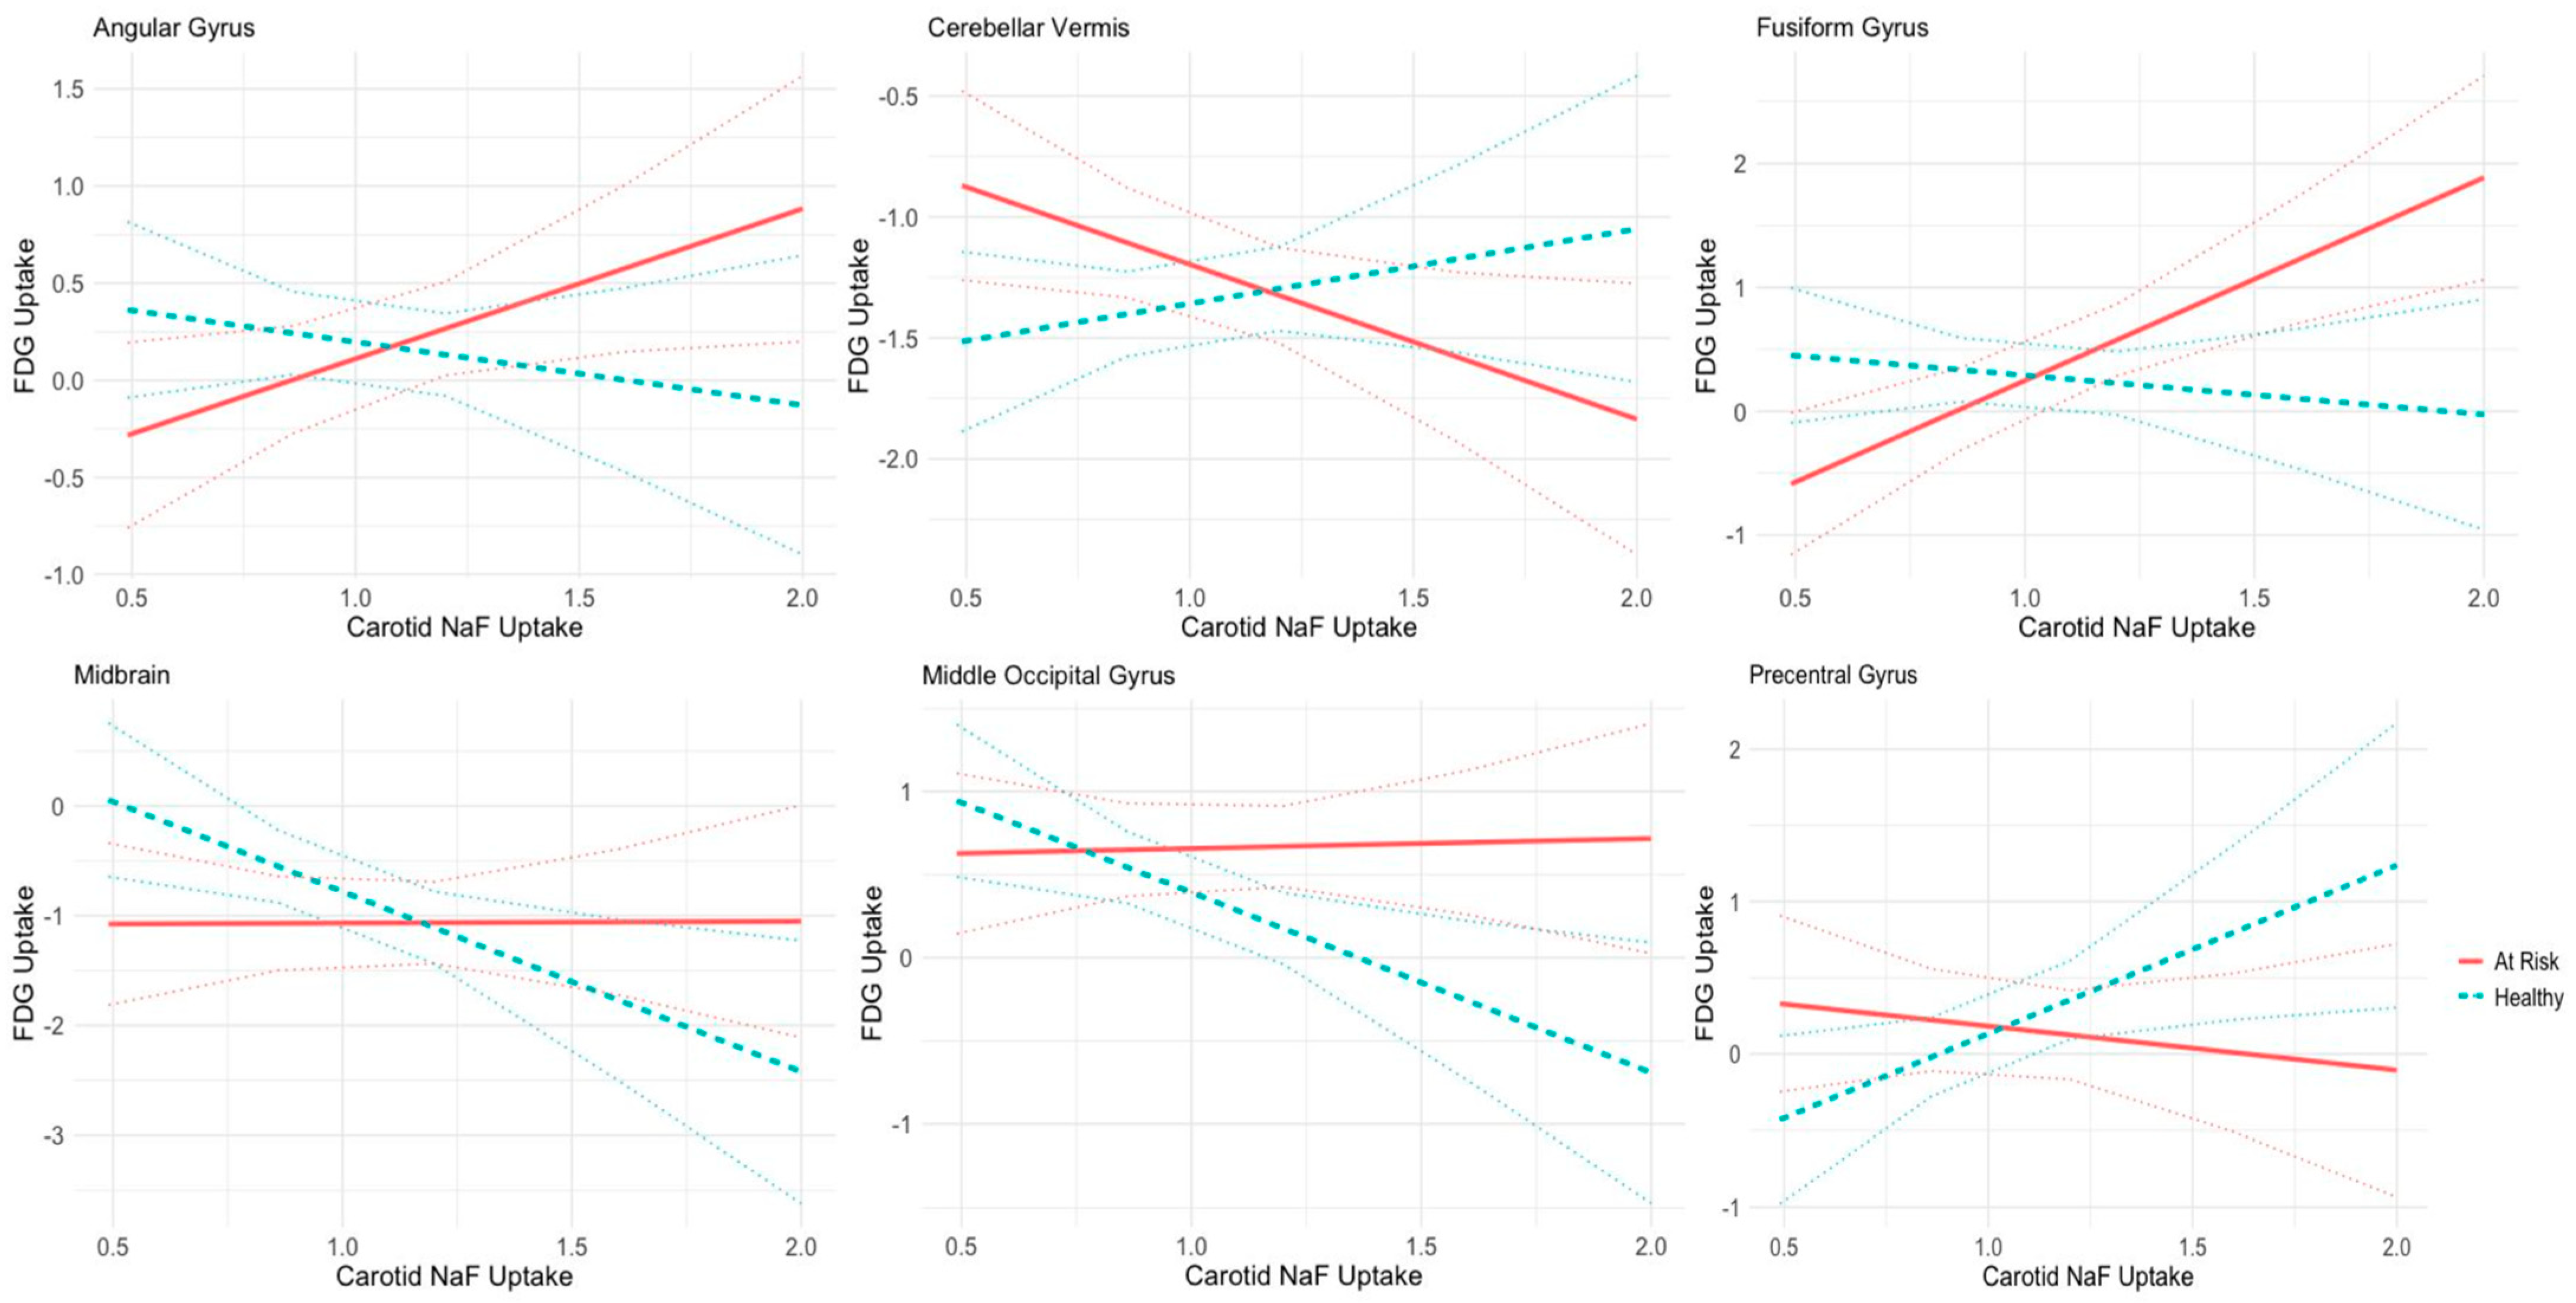
3.3. Correlations between Regional Cerebral Metabolism and Average Bilateral 18F-NaF PET Uptake in Carotid Arteries

As shown in Table 3, significant inverse correlations were observed between carotid NaF uptake and 18F-FDG uptake in the cerebellar hemisphere (β = −0.818, SE = 0.486, p = 0.023), cerebellum (β = −0.825, SE = 0.354, p = 0.021), cingulate gyrus (β = −1.232, SE = 0.540, p = 0.023), medulla (β = −0.888, SE = 0.405, p = 0.029), and posterior cingulate gyrus (β = −1.253, SE = 0.567, p = 0.028). These results suggest that a higher level of carotid calcification, indicative of cardiovascular risk, is associated with decreased metabolic activity in several key brain regions. This finding aligns with the previous Results subsection, suggesting health status may impact metabolic activity in regions involved in cognitive, emotional, and physical processes. In contrast, 18F-FDG uptake directly correlated with carotid 18F-NaF uptake in the fusiform gyrus (β = 1.660, SE = 0.498, p = 0.001) and globus pallidus (β = 1.505, SE = 0.571, p = 0.009). This indicates that higher carotid calcification unexpectedly corresponds with increased metabolic activity in these brain regions.
Patient health status was found to have a significant interaction effect on the correlation between 18F-FDG uptake and carotid 18F-NaF uptake in the following brain regions: the angular gyrus (β = −1.097, SE = 0.512, p = 0.033), cerebellar vermis (β = 0.947, SE = 0.420, p = 0.025), fusiform gyrus (β = −1.954, SE = 0.617, p = 0.001), midbrain (β = −1.657, SE = 0.793, p = 0.037), middle occipital gyrus (β = −1.142, SE = 0.519, p = 0.028), and precentral gyrus (β = 1.393, SE = 0.620, p = 0.025). These relationships are shown in Figure 3. In the angular gyrus, fusiform gyrus, midbrain, and middle occipital gyrus, the correlation between 18F-FDG uptake and carotid 18F-NaF uptake appears to trend more inversely in healthy patients than in patients with cardiovascular risk. Conversely, in the cerebellar vermis and precentral gyrus, metabolic activity and carotid 18F-NaF uptake trend more directly in healthy patients than in patients with cardiovascular risk. Patient health status was not found to demonstrate significant interaction effects in the other analyzed brain regions.
Overall, the mean 18F-NaF SUV in the healthy cohort was 0.976 for the left carotid artery and 1.057 for the right carotid artery. In comparison, subjects with cardiovascular risk factors had mean 18F-NaF SUVs of 1.084 for the left carotid artery and 1.147 for the right carotid artery. Comparison via t-test demonstrated that both the left carotid artery (p = 0.0381) and the right carotid artery (p = 0.0466) had significantly greater uptake in patients with greater cardiovascular risk, indicating atherosclerotic calcification. Carotid laterality, however, was not found to have any significant interaction effects on the correlation between 18F-NaF uptake and 18F-FDG uptake in any brain region (p > 0.05).

4. Discussion

Our study uncovers critical correlations between cardiovascular risk factors and metabolic activity across distinct cerebral regions. We used an imaging approach to assess cardiovascular risk, a growing practice in clinical medicine that can enhance the early identification of vulnerable patients and enable the personalization of medical management [19,20]. Our data suggest that microcalcification of atherosclerotic plaques within the carotid arteries, which correlates with elevated cardiovascular risk, may instigate metabolic alterations within brain regions responsible for cognitive, emotional, sensory, and motor functions.
Metabolic activity was found to inversely correlate with cardiovascular risk in the cuneus, middle occipital gyrus, parahippocampal gyrus, posterior cingulate gyrus, precuneus, primary visual cortex, and superior occipital gyrus. Many of these regions are found within the occipital lobe, which is implicated in visuospatial processing and memory formation [21,22]. The occipital lobe receives vascular supply from the cortical branches of the posterior cerebral artery (PCA), which is traditionally considered to arise from the basilar artery [23]. This may explain why the metabolic activity of occipital lobe structures was found to inversely correlate with cardiovascular risk as measured using the FRS, but no such relationships were observed with respect to carotid 18F-NaF uptake. Further research is needed to understand whether molecular calcification in the basilar arteries may impair occipital lobe function by reducing blood flow and thereby depriving this region of essential nutrients and oxygen. Reduced activity in these brain regions, as observed in cases of regional cerebral hypometabolism, may lead to a variety of adverse consequences for affected individuals. A disruption in the functionality of occipital lobe structures could manifest in difficulties in visual processing, object recognition, and memory formation. The parahippocampal gyrus is another putative cortical region involved in memory encoding and retrieval. Similar to the occipital lobe, the parahippocampal gyrus receives blood supply from a branch of the PCA [24]. Inverse correlations were observed between molecular activity and clinical measures of cardiovascular risk. However, no such associations were found between 18F-FDG uptake and carotid 18F-NaF uptake. The posterior cingulate cortex, which receives spatial and action-related information, also contributes to memory. This region receives vascular supply from the pericallosal arteries, branches of the anterior cerebral artery (ACA), which arise from the internal carotid arteries [21]. In contrast to that in occipital lobe structures and the parahippocampal gyrus, 18F-FDG uptake in the posterior cingulate cortex was observed to inversely correlate with both clinical measures of cardiovascular risk and carotid 18F-NaF uptake. This finding provides support for the existence of a mechanistic relationship between molecular calcification in the carotid arteries and posterior cingulate gyrus impairment.
Intriguingly, 18F-FDG uptake was found to directly correlate with cardiovascular risk in the basis pontis, pons, pontine tegmentum, postcentral gyrus, posterior orbital gyrus, Rolandic operculum, and superior cerebellar peduncle. The pons and its associated structures are implicated in unconscious processes, such as sleep–wake cycle regulation and breathing [25]. The postcentral gyrus contains the primary somatosensory cortex, a brain region significant for proprioception, and the posterior orbital gyrus plays a critical role in sensory expression [26,27]. The Rolandic operculum is also involved in gustatory and visceral sensation [28]. The superior cerebellar peduncle is a white matter tract that connects the cerebellum to the midbrain and is therefore implicated in motor function [29]. Taken together, many of these brain regions are critical for basic physical and sensory functions. The observed phenomenon involving 18F-FDG uptake and cardiovascular risk in these regions could potentially indicate adaptive responses or compensatory mechanisms preserving autonomic and motor functions amidst physiological changes driven by atherosclerosis.
Consistent with previous research, age was found to have varying associations with regional metabolic activity. In this study, we observed that 18F-FDG uptake inversely correlated with age and directly correlated with cardiovascular risk in the posterior orbital gyrus. Age has been extensively studied as a correlate of regional atrophy and hypometabolism, including in the orbital gyrus [30,31]. We further identified a direct correlation between metabolic activity and age in the pons, cuneus, middle occipital gyrus, parahippocampal gyrus, primary visual cortex, and superior occipital cortex. Such a relationship between age and increased metabolic activity may reflect compensatory mechanisms related to the aging process. It is possible that a compensatory mechanism acts in response to degenerative changes in other cerebral regions [32,33,34]. The concurrent variable associations between metabolic activity and cardiovascular risk underscore the heterogeneous impact of both aging and cardiovascular risk on metabolic activity in the brain, highlighting the necessity of region-specific analyses. Further research is required to clarify the mechanisms that drive age- and cardiovascular-derived changes in cerebral glucose metabolism.
Our correlation analysis delineates an association between the calcification in the carotid arteries and an observed reduction in metabolic activity within the cerebellar hemisphere, cerebellum, cingulate gyrus, medulla, and posterior cingulate gyrus. Whereas the cerebellar hemisphere, cerebellum, and medulla receive blood supply from the basilar arterial system, branches of the carotid arteries provide blood to the posterior and cingulate gyrus. This study included the segmentation of carotid arteries to the exclusion of the basilar arteries. It is possible that calcification within the basilar artery may result in hypometabolism of the regions supplied by its branches. Hypoperfusion engenders a pernicious cycle of hypoxia, oxidative stress, mitochondrial dysfunction, and inflammation, which exacerbates neuronal cell death [35]. This deleterious cycle provokes additional adverse events, including blood–brain barrier dysfunction and cerebral amyloid angiopathy, both of which contribute to further neuronal damage and ultimately culminate in cognitive impairment [36].
The correlation between carotid artery calcification and 18F-FDG uptake was found to depend on patient health status in the angular gyrus, cerebellar vermis, fusiform gyrus, middle occipital gyrus, and precentral gyrus. A notable finding from our analysis was a significant direct correlation between metabolic activity in the fusiform gyrus and carotid 18F-NaF uptake among the at-risk patients. In contrast, an indirect relationship was observed among healthy patients, which provides support for the notion that atherosclerotic calcification may have heterogenous effects on regional brain metabolism depending on the health status of a patient. Interaction effects of carotid artery laterality were also explored, but these were not found to have any significant impact on correlations between NaF uptake and metabolic activity in any brain region.
The etiology of vascular dementia is intricate, with chronic cerebral hypoperfusion constituting a primary pathophysiological mechanism underpinning the disease. Hypertension is particularly implicated as a critical risk factor for vascular dementia, as elevated blood pressure can compromise peripheral blood vessels, encompassing those perfusing the brain. This leads to hypoperfusion, oxidative stress, and inflammation, which underlie the disease pathophysiology [37]. Machulda et al. demonstrated that neurodegeneration, including hypometabolism, has a more detrimental impact on cognitive function than amyloidosis alone [38]. Emerging evidence is highlighting the role of brain glucose metabolism dysfunction as an early and progressive event in Alzheimer’s disease (AD), with hypometabolism observed in relevant brain regions correlating with disease progression and suggesting that enhancing neuronal energy states may mitigate cognitive decline [39]. AC-1202, designed to safely elevate serum ketone levels, has demonstrated potential for improving memory and cognition in mild-to-moderate AD patients by providing an alternative energy substrate for glucose-compromised neurons, with treatment outcomes influenced by apolipoprotein E genotype status [39,40] The literature has demonstrated that a higher cardiovascular risk burden, as indicated by the Framingham General Cardiovascular Risk Score, may predict declines in global cognition, episodic memory, working memory, and perceptual speed while also being associated with neurodegeneration, smaller brain volumes, and increased white matter hyperintensities [41,42,43]. Elevated blood levels of circulating lipoprotein and cholesterol, both major risk factors for atherosclerosis, have also been associated with long-term dementia risk [44,45]. As atherosclerosis is largely influenced by diet, our findings support a growing body of evidence linking the effects of nutritional intake with metabolic outcomes in the brain [46].
Our study corroborates previous research that has investigated the association between atherosclerosis, brain function, and biomarkers. For instance, studies have reported that atherosclerosis is associated with decreased cognitive performance, reduced cerebral blood flow, and an increased risk of dementia [47,48]. For example, Li et al. investigated the distribution of brain tissue oxygenation and cortical capillary blood flow in a mouse model of atherosclerosis using two-photon phosphorescence lifetime microscopy; the researchers determined that atherosclerosis induced lower tissue oxygenation, lower red-blood-cell speed and flux, and smaller capillary diameter in old atherosclerotic mice compared to young mice [49]. In one cross-sectional study, it was determined that the presence of atherosclerosis in the descending aorta is associated with accelerated brain aging, as evidenced by decreased total cerebral brain volume and increased white matter hyperintensity volume [50]. Moreover, findings from longitudinal studies suggest that atherosclerosis can lead to an increased burden of white matter hyperintensities and microbleeds, which can contribute to cognitive decline and brain atrophy [51,52]. Our findings elucidate the impact of cardiovascular risk factors on metabolic activity in key brain regions involved in cognition, emotion, and motor function, thereby contributing to a more comprehensive and nuanced understanding of the aging brain, with the potential to enhance clinical practice, patient outcomes, and public health strategies.
To the best of our knowledge, our study is the first of its kind to explore the relationship between carotid artery calcification and distinct brain regions in a population with cardiac risk factors. There are also limitations. First, although our approach is novel, the sample size of this study was modest, which may have limited the statistical power required to detect significant differences. Also, MRI scans of the brain were not available for this study, limiting the examination of markers of cerebrovascular disease. The potential benefits of using brain MRI should be considered in future research. Moreover, we did not perform volume calculations of the atherosclerotic calcifications in the common carotid arteries, an aspect that might provide more detailed insights. Additionally, our cross-sectional study design precludes causal inferences, and future longitudinal studies are needed to better understand the relationships between health status, age, and brain metabolism. Furthermore, it should be noted that certain individuals were excluded from this study based on specific criteria such as a history of pregnancy, malignancy within the past 5 years, and the utilization of statin therapy. These exclusions may have potential implications for the generalizability and representativeness of this study’s sample. Future research should aim to identify factors contributing to the observed differences in metabolic activity, including the lifestyle choices, genetic predispositions, and environmental factors that impact neurological function. Longitudinal studies are needed to determine causal relationships between health status, age, and brain function and explore potential interventions for preserving cognitive, emotional, and motor function. Further research is warranted to elucidate the specific mechanisms underlying differences in metabolic activity and their relationship with atherosclerosis.
Our study demonstrates the impact of cardiovascular risk factors on the metabolic activity within cerebral domains responsible for cognitive, emotional, sensory, and motor functionalities. Overall, our investigation, in tandem with existing research on atherosclerosis, brain function, and biomarkers, holds the potential to significantly advance our understanding of the complex relationships between health status, age, brain function, and the pathogenesis of vascular dementia and may contribute to the development of effective prevention and treatment strategies.

Author Contributions

Conceptualization, E.M.T. and R.C.S.; Methodology, E.M.T. and R.C.S.; Software, E.M.T. and R.C.S.; Validation, R.C.S., E.M.T. and S.P.; Formal Analysis, E.M.T. and S.P.; Investigation, R.C.S. and E.M.T.; Resources, R.C.S. and O.A.-D.; Data Curation, R.C.S. and E.M.T.; Writing—Original Draft Preparation, R.C.S., E.M.T., S.P., C.P., L.N. and J.A.; Writing—Review and Editing, R.C.S., E.M.T., S.P., A.N. and P.F.H.-C. Visualization, E.M.T. and S.P.; Supervision, P.F.H.-C. and A.A.; Project Administration, A.A. All authors have read and agreed to the published version of the manuscript. All authors have read, edited, made significant contributions to, and approved the final manuscript. Moreover, this manuscript is not being considered for publication elsewhere, either in printed or electronic form.

Funding

This research received no external funding.

Institutional Review Board Statement

Institutional Review Board approval was obtained. The CAMONA study was approved by the Danish National Committee on Biomedical Research Ethics, registered at ClinicalTrials.gov (NCT01274749, approval date November 2012) and conducted from 2012 to 2016 in accordance with the Declaration of Helsinki.

Informed Consent Statement

Written informed consent was obtained from all subjects (patients) in this study.

Data Availability Statement

The data presented in this study are available on request from the corresponding author.

Acknowledgments

The authors acknowledge Thomas Werner, Yvonne Su, Talha Khan, and Miraziz Ismoilov for their support of this manuscript.

Conflicts of Interest

The authors declare no conflicts of interest. The authors do not have any financial or non-financial interests that are directly or indirectly related to the work submitted for publication.

Abbreviations

18F-FDG18F-fluorodeoxyglucose;
A1cGlycated hemoglobin;
ADAlzheimer’s disease;
ACAAnterior cerebral artery;
ACEAngiotensin-converting enzyme;
ARBsAngiotensin receptor blockers;
BMIBody mass index;
CAMONACardiovascular molecular calcification assessed by 18F-NaF PET-CT
CHADS-VaScCongestive heart failure, hypertension, age, diabetes, stroke/transient ischemic attack, vascular disease, and sex category;
CVDCardiovascular disease;
FDGFluorodeoxyglucose;
FRSFramingham risk score;
NaFSodium fluoride;
PET-CTPositron emission tomography–computed tomography;
SCORESystematic coronary risk evaluation;
SUVStandard uptake value;

References

  1. Cardiovascular Diseases (CVDs). Available online: https://www.who.int/news-room/fact-sheets/detail/cardiovascular-diseases-(cvds) (accessed on 2 May 2023).
  2. Bytyçi, I.; Shenouda, R.; Wester, P.; Henein, M.Y. Carotid Atherosclerosis in Predicting Coronary Artery Disease. Arterioscler. Thromb. Vasc. Biol. 2021, 41, e224–e237. [Google Scholar] [CrossRef] [PubMed]
  3. Kuriakose, D.; Xiao, Z. Pathophysiology and Treatment of Stroke: Present Status and Future Perspectives. Int. J. Mol. Sci. 2020, 21, 7609. [Google Scholar] [CrossRef] [PubMed]
  4. de la Torre, J.C. Cardiovascular Risk Factors Promote Brain Hypoperfusion Leading to Cognitive Decline and Dementia. Cardiovasc. Psychiatry Neurol. 2012, 2012, 367516. [Google Scholar] [CrossRef]
  5. Wang, A.; Liu, X.; Chen, G.; Hao, H.; Wang, Y.; Wang, Y. Association between Carotid Plaque and Cognitive Impairment in Chinese Stroke Population: The SOS-Stroke Study. Sci. Rep. 2017, 7, 3066. [Google Scholar] [CrossRef] [PubMed]
  6. Cannistraro, R.J.; Badi, M.; Eidelman, B.H.; Dickson, D.W.; Middlebrooks, E.H.; Meschia, J.F. CNS small vessel disease: A clinical review. Neurology 2019, 92, 1146–1156. [Google Scholar] [CrossRef] [PubMed]
  7. Graff-Radford, J. Vascular Cognitive Impairment. Contin. Lifelong Learn. Neurol. 2019, 25, 147. [Google Scholar] [CrossRef]
  8. O’Brien, J.T.; Erkinjuntti, T.; Reisberg, B.; Roman, G.; Sawada, T.; Pantoni, L.; Bowler, J.V.; Ballard, C.; DeCarli, C.; Gorelick, P.B. Vascular cognitive impairment. Lancet Neurol. 2003, 2, 89–98. [Google Scholar] [CrossRef]
  9. Teune, L.K.; Bartels, A.L.; de Jong, B.M.; Willemsen, A.T.; Eshuis, S.A.; de Vries, J.J.; van Oostrom, J.C.; Leenders, K.L. Typical cerebral metabolic patterns in neurodegenerative brain diseases. Mov. Disord. 2010, 25, 2395–2404. [Google Scholar] [CrossRef]
  10. Marcus, C.; Mena, E.; Subramaniam, R.M. Brain PET in the Diagnosis of Alzheimer’s Disease. Clin. Nucl. Med. 2014, 39, e413–e426. [Google Scholar] [CrossRef]
  11. Minoshima, S.; Cross, D.; Thientunyakit, T.; Foster, N.L.; Drzezga, A. 18F-FDG PET Imaging in Neurodegenerative Dementing Disorders: Insights into Subtype Classification, Emerging Disease Categories, and Mixed Dementia with Copathologies. J. Nucl. Med. 2022, 63 (Suppl. 1), 2S–12S. [Google Scholar] [CrossRef]
  12. Mayer, M.; Borja, A.J.; Hancin, E.C.; Auslander, T.; Revheim, M.E.; Moghbel, M.C.; Werner, T.J.; Alavi, A.; Rajapakse, C.S. Imaging Atherosclerosis by PET, with Emphasis on the Role of FDG and NaF as Potential Biomarkers for This Disorder. Front. Physiol. 2020, 11, 511391. Available online: https://www.frontiersin.org/articles/10.3389/fphys.2020.511391 (accessed on 14 May 2023). [CrossRef]
  13. McKenney-Drake, M.L.; Moghbel, M.C.; Paydary, K.; Alloosh, M.; Houshmand, S.; Moe, S.; Salavati, A.; Sturek, J.M.; Territo, P.R.; Weaver, C.; et al. 18F-NaF and 18F-FDG as molecular probes in the evaluation of atherosclerosis. Eur. J. Nucl. Med. Mol. Imaging 2018, 45, 2190–2200. [Google Scholar] [CrossRef]
  14. Rojulpote, C.; Patil, S.; Gonuguntla, K.; Karambelkar, P.; Bravo, P.E.; Seraj, S.M.; Asadollahi, S.; Raynor, W.Y.; Bhattaru, A.; Borja, A.J.; et al. NaF-PET/CT global assessment in detecting and quantifying subclinical cardiac atherosclerosis and its association with blood pressure in non-dyslipidemic individuals. Am. J. Cardiovasc. Dis. 2020, 10, 101–107. [Google Scholar] [PubMed]
  15. Teichner, E.M.; You, J.C.; Hriso, C.; Wintering, N.A.; Zabrecky, G.P.; Alavi, A.; Bazzan, A.J.; Monti, D.A.; Newberg, A.B. Alterations in cerebral glucose metabolism as measured by 18F-fluorodeoxyglucose-PET in patients with persistent postconcussion syndrome. Nucl. Med. Commun. 2021, 42, 772–781. [Google Scholar] [CrossRef]
  16. Partovi, S.; Yuh, R.; Pirozzi, S.; Lu, Z.; Couturier, S.; Grosse, U.; Schluchter, M.D.; Nelson, A.; Jones, R.; O’Donnell, J.K.; et al. Diagnostic performance of an automated analysis software for the diagnosis of Alzheimer’s dementia with 18F FDG PET. Am. J. Nucl. Med. Mol. Imaging 2017, 7, 12–23, Published 15 January 2017. [Google Scholar]
  17. Blomberg, B.A.; Thomassen, A.; Takx, R.A.P.; Hildebrandt, M.G.; Simonsen, J.A.; Buch-Olsen, K.M.; Diederichsen, A.C.; Mickley, H.; Alavi, A.; Høilund-Carlsen, P.F. Delayed 18F-fluorodeoxyglucose PET/CT imaging improves quantitation of atherosclerotic plaque inflammation: Results from the CAMONA study. J. Nucl. Cardiol. 2014, 21, 588–597. [Google Scholar] [CrossRef] [PubMed]
  18. Blomberg, B.A.; de Jong, P.A.; Thomassen, A.; Lam, M.G.; Vach, W.; Olsen, M.H.; Mali, W.P.; Narula, J.; Alavi, A.; Høilund-Carlsen, P.F. Thoracic aorta calcification but not inflammation is associated with increased cardiovascular disease risk: Results of the CAMONA study. Eur. J. Nucl. Med. Mol. Imaging 2017, 44, 249–258. [Google Scholar] [CrossRef] [PubMed]
  19. Perone, F.; Bernardi, M.; Redheuil, A.; Mafrica, D.; Conte, E.; Spadafora, L.; Ecarnot, F.; Tokgozoglu, L.; Santos-Gallego, C.G.; Kaiser, S.E.; et al. Role of Cardiovascular Imaging in Risk Assessment: Recent Advances, Gaps in Evidence, and Future Directions. J. Clin. Med. 2023, 12, 5563. [Google Scholar] [CrossRef]
  20. Visseren, F.L.J.; Mach, F.; Smulders, Y.M.; Carballo, D.; Koskinas, K.C.; Bäck, M.; Benetos, A.; Biffi, A.; Boavida, J.M.; Capodanno, D.; et al. 2021 ESC Guidelines on cardiovascular disease prevention in clinical practice: Developed by the Task Force for cardiovascular disease prevention in clinical practice with representatives of the European Society of Cardiology and 12 medical societies with the special contribution of the European Association of Preventive Cardiology (EAPC). Eur. J. Prev. Cardiol. 2022, 75, 429. [Google Scholar] [CrossRef]
  21. Williams, P.L. Gray’s Anatomy; Churchill Livingstone: Edinburgh, UK, 1980. [Google Scholar]
  22. Rehman, A.; Al Khalili, Y. Neuroanatomy, Occipital Lobe. [Updated 24 July 2023]. In StatPearls [Internet]; StatPearls Publishing: Treasure Island, FL, USA, 2023. Available online: https://www.ncbi.nlm.nih.gov/books/NBK544320 (accessed on 28 July 2023).
  23. Kuybu, O.; Tadi, P.; Dossani, R.H. Posterior Cerebral Artery Stroke. In StatPearls; StatPearls Publishing: Treasure Island, FL, USA, 2023. [Google Scholar]
  24. Marinković, S.V.; Milisavljević, M.M.; Vucković, V.D. Microvascular anatomy of the uncus and the parahippocampal gyrus. Neurosurgery 1991, 29, 805–814. [Google Scholar] [CrossRef]
  25. Rahman, M.; Tadi, P. Neuroanatomy, Pons. [Updated 30 January 2023]. In StatPearls [Internet]; StatPearls Publishing: Treasure Island, FL, USA, 2023. Available online: https://www.ncbi.nlm.nih.gov/books/NBK560589/ (accessed on 2 August 2023).
  26. DiGuiseppi, J.; Tadi, P. Neuroanatomy, Postcentral Gyrus. [Updated 24 July 2023]. In StatPearls [Internet]; StatPearls Publishing: Treasure Island, FL, USA, 2023. Available online: https://www.ncbi.nlm.nih.gov/books/NBK549825/ (accessed on 8 August 2023).
  27. Nestor, P.G.; Nakamura, M.; Niznikiewicz, M.; Thompson, E.; Levitt, J.J.; Choate, V.; Shenton, M.E.; McCarley, R.W. In search of the functional neuroanatomy of sociality: MRI subdivisions of orbital frontal cortex and social cognition. Soc. Cogn. Affect. Neurosci. 2013, 8, 460–467. [Google Scholar] [CrossRef]
  28. Sutoko, S.; Atsumori, H.; Obata, A.; Funane, T.; Kandori, A.; Shimonaga, K.; Hama, S.; Yamawaki, S.; Tsuji, T. Lesions in the right Rolandic operculum are associated with self-rating affective and apathetic depressive symptoms for post-stroke patients. Sci. Rep. 2020, 10, 20264. [Google Scholar] [CrossRef]
  29. Kim, M.S.; Tak, H.J.; Son, S.M. Recovery of cerebellar peduncle injury in a patient with a cerebellar tumor: Validation by diffusion tensor tractography. Neural. Regen. Res. 2014, 9, 1929–1932. [Google Scholar] [CrossRef]
  30. Ishibashi, K.; Onishi, A.; Fujiwara, Y.; Oda, K.; Ishiwata, K.; Ishii, K. Longitudinal effects of aging on 18F-FDG distribution in cognitively normal elderly individuals. Sci. Rep. 2018, 8, 11557. [Google Scholar] [CrossRef]
  31. Terribilli, D.; Schaufelberger, M.S.; Duran, F.L.; Zanetti, M.V.; Curiati, P.K.; Menezes, P.R.; Scazufca, M.; Amaro, E., Jr. Age-related gray matter volume changes in the brain during non-elderly adulthood. Neurobiol. Aging 2011, 32, 354–368. [Google Scholar] [CrossRef] [PubMed]
  32. Koziol, L.F.; Budding, D.; Andreasen, N.; D’Arrigo, S.; Bulgheroni, S.; Imamizu, H.; Ito, M.; Manto, M.; Marvel, C.; Parker, K.; et al. Consensus Paper: The Cerebellum’s Role in Movement and Cognition. Cerebellum 2014, 13, 151–177. [Google Scholar] [CrossRef] [PubMed]
  33. Glickstein, M.; Doron, K. Cerebellum: Connections and Functions. Cerebellum 2008, 7, 589–594. [Google Scholar] [CrossRef] [PubMed]
  34. Ward, N.S. Compensatory Mechanisms in the Aging Motor System. Ageing Res. Rev. 2006, 5, 239–254. [Google Scholar] [CrossRef] [PubMed]
  35. Northington, F.J.; Chavez-Valdez, R.; Martin, L.J. Neuronal Cell Death in Neonatal Hypoxia-Ischemia. Ann. Neurol. 2011, 69, 743–758. [Google Scholar] [CrossRef]
  36. ElAli, A.; Thériault, P.; Préfontaine, P.; Rivest, S. Mild chronic cerebral hypoperfusion induces neurovascular dysfunction, triggering peripheral beta-amyloid brain entry and aggregation. Acta Neuropathol. Commun. 2013, 1, 75. [Google Scholar] [CrossRef] [PubMed]
  37. Venkat, P.; Chopp, M.; Chen, J. Models and mechanisms of vascular dementia. Exp. Neurol. 2015, 272, 97–108. [Google Scholar] [CrossRef]
  38. Machulda, M.M.; Hagen, C.E.; Wiste, H.J.; Mielke, M.M.; Knopman, D.S.; Roberts, R.O.; Vemuri, P.; Lowe, V.J.; Jack, C.R., Jr.; Petersen, R.C. Practice effects and longitudinal cognitive change in clinically normal older adults differ by Alzheimer imaging biomarker status. Clin. Neuropsychol. 2017, 31, 99–117. [Google Scholar] [CrossRef]
  39. Costantini, L.C.; Barr, L.J.; Vogel, J.L.; Henderson, S.T. Hypometabolism as a therapeutic target in Alzheimer’s disease. BMC Neurosci. 2008, 9, S16. [Google Scholar] [CrossRef] [PubMed]
  40. Craft, S.; Asthana, S.; Schellenberg, G.; Baker, L.; Cherrier, M.; Boyt, A.A.; Martins, R.N.; Raskind, M.; Peskind, E.; Plymate, S. Insulin Effects on Glucose Metabolism, Memory, and Plasma Amyloid Precursor Protein in Alzheimer’s Disease Differ According to Apolipoprotein-E Genotype. Ann. N. Y. Acad. Sci. 2000, 903, 222–228. [Google Scholar] [CrossRef] [PubMed]
  41. Song, R.; Xu, H.; Dintica, C.S.; Pan, K.Y.; Qi, X.; Buchman, A.S.; Bennett, D.A.; Xu, W. Associations Between Cardiovascular Risk, Structural Brain Changes, and Cognitive Decline. J. Am. Coll. Cardiol. 2020, 75, 2525–2534. [Google Scholar] [CrossRef] [PubMed]
  42. Cui, K.; Song, R.; Xu, H.; Shang, Y.; Qi, X.; Buchman, A.S.; Bennett, D.A.; Xu, W. Association of Cardiovascular Risk Burden with Risk and Progression of Disability: Mediating Role of Cardiovascular Disease and Cognitive Decline. J. Am. Heart Assoc. 2020, 9, e017346. Available online: https://www.ahajournals.org/doi/full/10.1161/JAHA.120.017346?rfr_dat=cr_pub++0pubmed&url_ver=Z39.88-2003&rfr_id=ori%3Arid%3Acrossref.org (accessed on 2 May 2023). [CrossRef] [PubMed]
  43. Wang, Z.; Cui, K.; Song, R.; Li, X.; Qi, X.; Buchman, A.S.; Bennett, D.A.; Xu, W. Influence of Cardiovascular Risk Burden on Motor Function Among Older Adults: Mediating Role of Cardiovascular Diseases Accumulation and Cognitive Decline. Front. Med. 2022, 9, 856260. Available online: https://www.frontiersin.org/articles/10.3389/fmed.2022.856260 (accessed on 2 May 2023). [CrossRef] [PubMed]
  44. Di Fusco, S.A.; Arca, M.; Scicchitano, P.; Alonzo, A.; Perone, F.; Gulizia, M.M.; Gabrielli, D.; Oliva, F.; Imperoli, G.; Colivicchi, F. Lipoprotein(a): A risk factor for atherosclerosis and an emerging therapeutic target. Heart 2023, 109, 18–25. [Google Scholar] [CrossRef] [PubMed]
  45. Iwagami, M.; Qizilbash, N.; Gregson, J.; Douglas, I.; Johnson, M.; Pearce, N.; Evans, S.; Pocock, S. Blood cholesterol and risk of dementia in more than 1·8 million people over two decades: A retrospective cohort study. Lancet Healthy Longev. 2021, 2, e498–e506. [Google Scholar] [CrossRef]
  46. Varamini, B.; Sikalidis, A.K.; Bradford, K.L. Resveratrol increases cerebral glycogen synthase kinase phosphorylation as well as protein levels of drebrin and transthyretin in mice: An exploratory study. Int. J. Food Sci. Nutr. 2014, 65, 89–96. [Google Scholar] [CrossRef]
  47. Debette, S.; Seshadri, S.; Beiser, A.; Au, R.; Himali, J.J.; Palumbo, C.; Wolf, P.A.; DeCarli, C. Midlife vascular risk factor exposure accelerates structural brain aging and cognitive decline. Neurology 2011, 77, 461–468. [Google Scholar] [CrossRef] [PubMed]
  48. Wendell, C.R.; Waldstein, S.R.; Ferrucci, L.; O’Brien, R.J.; Strait, J.B.; Zonderman, A.B. Carotid Atherosclerosis and Prospective Risk of Dementia. Stroke 2012, 43, 3319–3324. [Google Scholar] [CrossRef] [PubMed]
  49. Li, B.; Lu, X.; Moeini, M.; Sakadžić, S.; Thorin, E.; Lesage, F. Atherosclerosis is associated with a decrease in cerebral microvascular blood flow and tissue oxygenation. PLoS ONE 2019, 14, e0221547. [Google Scholar] [CrossRef]
  50. Aparicio, H.J.; Petrea, R.E.; Massaro, J.M.; Manning, W.J.; Oyama-Manabe, N.; Beiser, A.S.; Kase, C.S.; D’Agostino, R.B.; Wolf, P.A.; Vasan, R.S.; et al. Association of descending thoracic aortic plaque with brain atrophy and white matter hyperintensities: The Framingham Heart Study. Atherosclerosis 2017, 265, 305–311. [Google Scholar] [CrossRef]
  51. Schmidt, R.; Seiler, S.; Loitfelder, M. Longitudinal change of small-vessel disease-related brain abnormalities. J. Cereb. Blood Flow Metab. 2016, 36, 26–39. [Google Scholar] [CrossRef]
  52. van Dijk, E.J.; Prins, N.D.; Vrooman, H.A.; Hofman, A.; Koudstaal, P.J.; Breteler, M.M.B. Progression of cerebral small vessel disease in relation to risk factors and cognitive consequences: Rotterdam Scan study. Stroke 2008, 39, 2712–2719. [Google Scholar] [CrossRef] [PubMed]
Figure 1. Sample of quantitative assessment conducted using the MIM PET-FDG workflow. The pons (light blue), pontine tegmentum (pink), and supplementary motor region (yellow) are shown as significant ROIs in this young patient.
Jvd 03 00010 g001
Figure 2. Sample image of quantitative assessment conducted by drawing regions of interest (ROI) around the left (LCC) and right (RCC) common carotid arteries. For the drawn RCC ROI, SUVmean = 1.262, SUVmin = 0.0738, and SUVmax = 2.799. For the drawn LCC ROI, SUVmean = 0.533, SUVmin = 0.467, and SUVmax = 0.655.
Jvd 03 00010 g002
Figure 3. Correlation analysis between normalized FDG Z-scores in various brain regions and carotid NaF-PET uptake in healthy (depicted in green) and unhealthy (depicted in red) subjects. Table We1: Characteristics of patients in the study (n = 104). Patient health status demonstrates significant interaction effects in six brain regions: angular gyrus, cerebellar vermis, fusiform gyrus, midbrain, middle occipital gyrus, and the precentral gyrus.
Jvd 03 00010 g003
Table 1. Characteristics of patients in study (n = 104).
HealthyAt-Riskp-Value
  Countn = 66n = 38
 Demographics
  Female, n (%)32 (48.4)19 (50.0)1.0
  Age, years43.9 ± 13.556.1 ± 11.8<0.01
  Body mass index26.5 ± 4.126.8 ± 4.40.32
 Comorbidities
  Smoking history, n (%)33 (50.0)18 (47.3)0.84
  Family history of coronary artery disease, n (%)16 (24.2)9 (23.6)1.0
  Arterial hypertension, n (%)30 (45.4)16 (42.1)0.83
  Hypercholesterolemia, n (%)13 (19.6)5 (13.1)0.43
  Hypertriglyceridemia, n (%)10 (15.1)5 (13.1)1.0
  Atrial fibrillation, n (%)8 (12.1)1 (2.6)0.15
  Heart valve disease, n (%)4 (6.0)1 (2.6)0.65
  Peripheral artery disease, n (%)3 (4.5)1 (2.6)1.0
  History of cerebrovascular disease, n (%)2 (3.0)0 (0.0)0.53
 Laboratory tests
  Total cholesterol, mmol/L5.2 ± 0.94.9 ± 0.80.08
  HDL cholesterol, mmol/L1.4 ± 0.41.3 ± 0.40.56
  LDL cholesterol, mmol/L3.2 ± 0.83.0 ± 0.70.22
  Triglycerides, mmol/L1.1 ± 0.61.1 ± 0.80.22
  HbA1c, mmol/L35.2 ± 4.235.3 ± 6.00.46
  C-reactive protein, mg/L2.5 ± 3.12.5 ± 4.10.89
  White blood cell count, 109 cells/L6.0 ± 2.06.4 ± 2.10.07
  Fibrinogen, μmol/L9.4 ± 1.811.4 ± 11.80.37
  Creatinine, μmol/L79.0 ± 18.381.5 ± 13.90.13
  Estimated glomerular filtration rate, mL/min/1.73 m281.4 ± 15.680.3 ± 13.20.63
 Medications
  Aspirin, n (%)8 (12.1)1 (2.6)0.15
  Beta blockers, n (%)7 (10.6)2 (5.2)0.48
  Angiotensin-converting enzyme inhibitors/angiotensin receptor blockers, n (%)11 (16.6)2 (5.2)0.12
  Lipid-lowering medication, n (%)10 (15.1)4 (10.5)0.56
 Risk profile
  10-year Framingham risk, % (25–75th percentile)3.9 (1.6–8.2)8.5 (5.8–16.8)<0.01
  CHA2DS2-VASc score, % (25–75th percentile)1.0 (0.0–1.0)1.0 (0.0–1.0)0.58
  Level of physical activity, % (25–75th percentile)2.0 (1.0–3.0)2.0 (2.0–3.0)0.99
 Chronic Kidney Disease: no data; Diabetes: all negative
Table 2. Multivariable correlation of regional FDG uptake with cardiovascular risk and age.
Cardiovascular Risk (FRS)Age
βSEp-ValueβSEp-Value
Angular Gyrus−0.0140.0110.221−0.0150.0060.018
Basis Pontis0.0250.0120.0380.0290.006<0.001
Cerebellar Vermis0.0110.0090.2170.0140.0050.007
Cuneus−0.0300.0140.0350.0230.0080.004
Fusiform Gyrus0.0190.0130.1650.0240.0070.001
Midbrain0.0010.0170.9190.0440.010<0.001
Middle Occipital Gyrus−0.0320.0110.0050.0150.0060.021
Parahippocampal Gyrus−0.0340.0140.0200.0350.008<0.001
Pons0.0340.0130.0080.0220.0070.002
Pontine Tegmentum0.0530.015<0.0010.0130.0080.129
Postcentral Gyrus0.0280.0120.022−0.0060.0060.361
Posterior Cingulate Gyrus−0.0320.0150.0440.0060.0080.463
Posterior Orbital Gyrus0.0380.0130.003−0.0280.007<0.001
Precentral Gyrus0.0150.0140.278−0.0230.0070.002
Precuneus−0.0360.0140.0140.0130.0080.101
Primary Visual Cortex−0.0250.0120.0370.0250.006<0.001
Rolandic Operculum0.0310.0140.031−0.0100.0080.189
Superior Cerebellar Peduncle0.0310.0110.005−0.0020.0060.745
Superior Occipital Gyrus−0.0380.0130.0040.0350.007<0.001
Table 3. Multivariable correlation of regional FDG uptake with carotid NaF uptake accounting for potential interaction effects of health status and carotid laterality.
Carotid UptakeHealth Status Interaction EffectsLaterality Interaction Effects
βSEp-ValueβSEp-ValueβSEp-Value
Angular Gyrus0.5710.4140.169−1.090.5120.0330.4010.5060.428
Cerebellar Hemisphere−0.8180.4860.0230.6610.4420.136−0.0330.4370.938
Cerebellar Vermis−0.5840.3390.0860.9470.4200.025−0.1100.4150.789
Cerebellum−0.8250.3540.0210.7470.4380.090−0.0450.4330.916
Cingulate Gyrus−1.2320.5400.0230.1330.6690.8410.3780.6610.567
Fusiform Gyrus1.6600.4980.001−1.9540.6170.001−0.0450.6090.941
Globus Pallidus1.5050.5710.009−0.8030.7060.256−0.4490.6980.520
Medulla−0.8880.4050.0290.5240.5010.2970.3810.4950.442
Midbrain−0.0090.6410.987−1.6570.7930.0370.0520.7830.946
Middle Occipital Gyrus0.0680.4190.871−1.1420.5190.028−0.0160.5120.973
Posterior Cingulate Gyrus−1.2530.5670.028−0.9270.7020.1880.4120.6940.552
Precentral Gyrus−0.2340.5010.6401.3930.6200.025−0.1090.6130.859
Disclaimer/Publisher’s Note: The statements, opinions and data contained in all publications are solely those of the individual author(s) and contributor(s) and not of MDPI and/or the editor(s). MDPI and/or the editor(s) disclaim responsibility for any injury to people or property resulting from any ideas, methods, instructions or products referred to in the content.

