1. Introduction
The fourth industrial revolution, also known as Industry 4.0, encompasses a wide range of technologies, including the Internet of Things (IoT), big data, cloud computing, digital twins, and additive manufacturing [
1]. There are different concepts associated with Industry 4.0. Common concepts are smart factory, cyber–physical systems and self-organisation [
2,
3]. Salkin et al. mention that the most unifying factor between the different conceptual approaches of Industry 4.0 is the integration of production facilities, supply chains, and service systems into value–creation processes [
4]. In this sense, predictive maintenance focuses on the continuous monitoring of the machine or process and is a possible part of Industry 4.0 [
5]. More precisely, it can be part of the smart factory, as Pech mentioned: ‘All elements of the smart factory are connected, exchange information and detect and evaluate situations’.
The digitalisation of existing production facilities for an Industry 4.0 environment enables the profitable continued use of existing production facilities, but also presents a number of opportunities and challenges. The implementation of advanced technologies is the enabler, such as the Internet of Things (IoT), artificial intelligence (AI), and big data analytics. They open up new possibilities for process optimisation, productivity enhancement, and predictive maintenance. These capabilities enable real-time monitoring, efficient resource allocation, and data-driven decision-making, leading to improved operational efficiency and cost savings.
However, the transition to an Industry 4.0 environment comes with a number of challenges. One of the key challenges for predictive maintenance is the training and deployment of AI models in a variety of domains. Each producing domain has specific machines for producing its products. Accordingly, the machines have different actuators and sensors and interact differently with their production environment. From the overall perspective, this diversity results in heterogeneity in terms of data sources, data formats, and terminologies, even though the relevant data are time-series data.
The data play a very central role in the success of predictive maintenance in a specific production facility. The data analyst must collect, understand, and evaluate the usability of the data in order to train and deploy the AI model for predictive maintenance. The data analyst spends significant effort on the data integration activities specific to production facilities.
This paper addresses the effort involved in data integration for training and deploying AI models and enables a significant reduction in effort using existing computer science methods. The research objective of this paper is to enable seamless data exchange and collaboration from a production environment to AI frameworks, which shall be similar for all production facilities from different domains. With this, the vision of a smart factory that is connected to exchange information and detect and evaluate situations can be achieved for predictive maintenance in the scope of Industry 4.0. The approach focuses on the specification and implementation of a flow of information, which is invisible, but is at the core of the functioning and sustainable integration of predictive maintenance. For that purpose, a holistic view of data is necessary. The needed data-modelling and data-integration capabilities for this are not taken into account by the available AI frameworks/libraries such as Tensorflow, Weka, PyTorch, or Caffe. They offer libraries that technically open the data sources and allow the data to be read. The actual reading, interpretation, and mapping of the input for AI methods must be performed additionally by the data analyst/developer. An example of the challenges to be faced is shown in the
Figure 1.
The example from
Figure 1 is taken from the library pandas 2.1.3 (
https://pandas.pydata.org/docs/index.html, accessed on 29 January 2024) which is used by Tensorflow 2.15.0 (
https://www.tensorflow.org/, accessed on 29 January 2024) and other frameworks written in Python. The data analyst defined the filename and defined which is the used separator inside the CSV file. For that purpose, he/she needs already to understand the data format of the CSV file to configure the data integration. In addition, the data analyst defined that the first row should be ignored. To know this fact, he needed to open the data file and have a first look at the data. Finally, the data analyst obtains an n-dimsensional array containing all the data as an outcome. The columns that represent the timestamp and the columns that represent the measurements for the relevant sensors are parts of the time-series data to be identified by the data analyst. This also holds for the “id_columns”, which often come as strings, where the data analyst needs to handle/pre-process them separately. While the capability of understanding the data format and the content data schema is simple for CSV files, there are a lot of data formats for time-series data, such as TDMS or M4, which store the data as byte arrays and have complex schemas. With this, the proposed seamless information flow from the production environment to the AI models is impossible.
The weakness is that it requires significant data integration efforts for the data analyst and a specific solution for the customer that wants to set up and maintain a predictive maintenance solution in the production environment. Similarly, data engineering pipeline tools such as Airflow (
https://airflow.apache.org/, accessed on 29 January 2024) provide various nodes for setting up information flows, but the interpretation and mapping of the data are also performed independently/manually. Thus, the goal and novelty of this article is to establish a holistic approach to enable an information flow for training and deploying AI models in diverse production environments without the need to understand customer-specific data sources. As a result, it aims to serve as a universal, adaptable, one-size-fits-all solution and replace the traditional data integration scripts employed traditionally in data understanding and data preparation phases of AI model training.
The one-size-fits-all solution requires significant investment in infrastructure, software, and staff training, with respect to the achievement of interoperability. Interoperability is defined as “the ability of two or more systems or components to exchange and use information” [
6]. The systems of interest are the tools related to condition monitoring and predictive maintenance as target systems and the machines of the production environment as source systems. The interoperability addressed shall enable the interoperable exchange of time-series data from the different sources to the target systems. ISO 16100 has extended this definition of the term information as “the ability to share and exchange information using common syntax and semantics to meet an application-specific functional relationship through the use of a common interface” [
7]. In the context of this article, the time-series data are to be made available to the target tools as information in a unified syntactic and semantic way, independently of the provided syntax (data format, data schema) and semantics of the data collected from the machines. As a result, time-series data can be integrated by condition monitoring and predictive maintenance tools without any data integration effort.
Another challenge is the heightened concern about maintainable information flows. Increased connectivity and data sharing between connected devices make the risk of maintenance errors and data breaches more pronounced. It is critical for organisations to prioritise robust information flows, to safeguard sensitive data and protect against data integration conflicts. This paper aims to propose a sustainable information flow using transparent and traceable data integration steps, starting from heterogeneous sensor data and ending in well-formed predictions about the probability of machine failure and quality loss.
The paper is outlined as follows.
Section 2 presents the challenges posed by the heterogeneity of the data. Subsequently,
Section 3 defines the information flow, and all the building bricks for the implementation of an interoperable and productive environment-independent information flow. The benefits of integrating the information flow for predictive models into production are evaluated in
Section 4. The discussion of the evaluation result is shown in
Section 5. The paper closes with a conclusion and outlook.
2. Background and Problem
This article focuses on the development of a robust information flow as input for existing AI frameworks and tools. This means that the AI framework can use their common libraries for accessing the data but does not need to handle the data integration related to the interoperability. With this, the background does not consider the state of the art in the capabilities of AI frameworks. Instead, the consideration and applicability of interoperability are the focus. The definition of the interoperability by IEEE can be split into different levels.
As shown in
Figure 2, the lowest level involves data/information and addresses the management, exchange, and processing of different data, which can be heterogenous according to data format, data schema, terminologies, and other domain-specific aspects.
Before the data can be used for management, exchange, and processing between a production environment and an AI framework, the data must be physically transferred. To do this, the data must pass through seven layers defined by OSI, which are represented in
Figure 3. The data must pass from the network within the machine, through the local network within the production environment, to the Internet to be accessible by AI frameworks. At each interface (machine/local network, local network/internet), interoperability between the different layers must be established. For example, the network layer at the third level implements the unique identification of a system within the network. While in the local network, a system is addressed by its MAC address and the Address Resolution Protocol (ARP); on the Internet, it is addressed by its IP address and the Internet Protocol (IP). State-of-the-art hardware devices, such as routers, are available to meet this interoperability challenge. With this, the interoperability is ensured until layer 5. Layers 6 and 7 offer a range of opportunities about how the data shall be distributed between stakeholders on the Internet. Accordingly, this article assumes that this type of interoperability exists for the OSI layers (1–5) and does not need to be considered in the problem description and solution.
The interest is in the consumption of the information within the data and via the presentation/application layer of the Internet. Hereby, a piece of information is defined by Bellinger as “…data that has been given meaning by way of relational connection…” [
10]. To achieve this understanding for a data analyst, the level of semantic understanding by Ören needs to be applied, which contains the levels of lexical understanding, syntactical understanding, morphological understanding, and semantic understanding [
11]. In doing so, the lexical, syntactical, and morphological understanding enables the recognition of the structure of the information and the grouping of relevant entities in the time-series data-specific syntax. Semantic understanding is the crucial understanding of the data’s meaning and involves closing the gap from data to information. Hereby, the data analyst is not interested in the data but instead in the information that he/she could use for training and the usage of the AI models. Based on the information view, the data-driven service can consume and publish information instead of data. This is a precondition to achieve interoperability on the level of ATHENA services [
8]. The interoperability of services is defined as identifying, composing, and executing various applications as a sequence [
8]. With this, services are an abstraction and an encapsulation of the functionality provided by an autonomous entity. In the scope of this article, the autonomous entity refers to the information flow, enabling continuous condition monitoring and prediction independent of the concrete data sources and tools for data integration and AI. In the following, the challenges for the aspects of data integration and tooling are presented in detail.
2.1. Heterogeneity of Data
Data heterogeneity refers to diverse types, formats, structures, and semantics within a dataset or across multiple datasets. The challenge is that machine vendors have developed different protocols and standards to store and share the operational data of a machine. Heterogeneity is only noticed when information is to be exchanged instead of data. In this case, data integration conflicts appear, which is an inverse indicator for data heterogeneity. The extent of data integration conflicts was defined by Goh [
12] and was confirmed by Wache [
13], among others.
The data integration conflicts listed by Goh [
12] (see
Figure 4) are based on the analysis of databases. A subset of the structures contained in models, description logic, and test script languages can be mapped with databases. Accordingly, the data integration conflicts from Goh also apply to the syntax and semantics of machine data stored in databases.
The article focuses on time-series data as a subset of machine data. Time-series data refer to sequences of data points or observations that are recorded, measured, or collected over successive time intervals. It is a special form of data in which the values are associated with specific time stamps or time periods, indicating the temporal order and continuity of the data. Time-series data are commonly used in fields as diverse as finance, economics, meteorology, signal processing, and machine learning. In the scope of this article, time-series data coming from a production environment are used for the goal of predictive maintenance. Previous studies have explored data structuring in various formats but have not adequately addressed the interoperability challenges specific to time-series data and industrial predictive maintenance applications.
Time-series data are available in different data formats. The current state is that data can be stored in a wide range of formats, such as spreadsheets, databases (SQL, NO-SQL, Time series data bases), XML, JSON, CSV, or proprietary file formats. The interoperability challenge is that each format has its own structure and rules for organising and representing data. There are general features for data structuring, such as trees or tables. The weakness is that the data formats do not contain the mapping of taxonomies relevant to the explicit mapping of time-series data. This allows time series for specific machines under specific conditions to be displayed in any kind of structure, which is generic, but supports the representation of time-series data; this representation is intended to cover an entire production environment. As an outcome, the data formats require data transformation or conversion to ensure compatibility and interoperability between different services.
2.2. Data Integration for Predictive Models
The data integration for the training and usage of AI models as part of the predictive maintenance is a complex process. This process is described in the Cross-Industry Standard Process for Data Mining (CRISP-DM). It is an open standard process model and describes common proceedings by data mining experts for the goal of data analysis. The CRISP-DM “is the de-facto standard and an industry-independent process model for applying data mining projects” [
14].
The first three of six phases of the CRISP-DM define the data integration steps that are presented in the following way:
(#1) Business Understanding: In this step, the company’s objectives are defined, and the important factors are derived. This step identifies the relevant processes, the relevant machines, and the requirements for predictive maintenance. Based on this, the applicable AI models, including success criteria and relevant data sources, can be identified.
(#2) Data Understanding: This step focuses on collecting, interpreting, and checking the quality of the data. This means that data samples are collected manually, and the data analyst needs to understand the data. This involves reading the data from the data samples. This step can be difficult if the data are stored in a binary format such as TDMS. The second step is to interpret the data schema and determine whether the data it contains meets the requirements of the planned AI models. The challenge of this step depends on the data formats rather than the information contained.
(#3) Data Preparation: This step involves selecting the appropriate data from the original data formats, cleaning, constructing attributes from the data, and integrating data from multiple sources into a target format. The challenge is to develop and customise custom data adapters to enable the automatic collection of training and streaming data.
Steps 2 and 3 are critical for the successful training and use of AI models.
Figure 5 illustrates a generic information flow for these steps. In these steps, data are collected, packaged, and then provided to the data analyst for data analytics.
The concrete data integration challenges from the perspective of the data analyst include the tasks of how to collect the initial data, how to describe the data, how to explore the data, how to check the data quality, and finally, how to select the right data for each pilot considering the different data sources and data transfer options. The concrete data integration challenges related to the pilots considered in the evaluation are shown in
Table 1.
The biggest hurdles here are of a technical nature and require expertise in semantic data integration. This integration aims to enhance efficiency and productivity by tackling the challenges posed by diverse incoming data formats. Interoperability is “the ability of two or more systems or components to exchange and use information” [
6]. There are a variety of data integration approaches for semantic data integration. Lenzerini defines the goal of these approaches: “Data integration is the problem of combining data residing at different sources, and providing the user with a unified view of these data” [
15]. The basis of this uniform view is an interoperability model that describes the content of the information to be exchanged and thereby enables interoperability. Domain-specific models, ontologies, or knowledge graphs are usually used for this. Choosing the right data integration approach is challenging and depends on the specific application scenario. Below, the required data integration approach is presented based on the choice of schema mapping and the type of data integration.
The information from a data source can be mapped to the interoperability model using the Global as View (GAV), Local as View (LAV), or Hybrid (GLAV) approaches [
15]. There are a variety of technical solutions for the approaches available. For the purpose of data integration, the GAV approaches use the interoperability model as a reference and use this to define the information to be integrated. In contrast, the solutions of the LAV approaches use the schema of the local data source (the machine’s data sources) as a reference to define the information to be integrated. In the context of this article, the global view is defined by the characteristics of the time-series data. With this, the GAV model is applicable, because the global view can be defined and modelled.
This means that in the context of the data understanding (Step 2) and data preparation (Step 3) steps of the CRISP-DM, the data analyst can use the shared data as information in his tools. Data integration can be either virtual or physical. The aim of virtual data integration is to request the data on demand from the data source and transform and deliver the data into the target format for the AI tool. In contrast, physical integration focuses on transforming and storing the information to enable dynamic data delivery in the target format. In the context of the training, retraining, and deployment of AI models, the physical data integration approach is more applicable. For this purpose, the shared and stored data must contain the information of the time stamp and the measurement value. In addition, information is needed about the sensor and machine from which the measurement was taken. The term ‘information’ rather than ‘data’ is important in this context, because the data analyst needs to understand, for example, the specific values for the time stamp and the measurement values based only on the data samples provided. This means that the data samples provided must be self-describing, without the need to know the implicit knowledge of the units used, the meaning of acronyms, or identifiers.
If this requirement is met, the interoperability for data exchange from the pilots to the data analyst is given, and the analyst can begin the task of analysing the data for the predictive maintenance application. This requirement was not met at the beginning of the LEVEL-UP research project, where the data from the pilots related to woodworking, pultrusion, extrusion, inspection, and CNC equipment were collected. Examples of data integration conflicts that prevent the interoperability and direct use of data for predictive maintenance are shown in
Table 1.
2.3. Problem Statement
As discussed in the preceding section, the data-integration process, encompassing the stages of data understanding and data preparation following the CRISP-DM methodology, is crucial for a smooth and effective analysis. However, there are often challenges in this critical phase. This paper proposes a solution by offering an automated implementation of the CRISP-DM mechanism, ensuring simplicity and seamlessness.
The CRISP-DM steps for data understanding and data preparation are feasible, but require manual effort and expertise, as shown in
Figure 6. In the process, human effort is frequently needed to prepare the sample data for data analysts. Once the sample data are received, data analysts require assistance from experts in pilots, to comprehend the specific data schemas. Armed with this understanding, data analysts can then generate code snippets and scripts for various data pre-processing tasks, such as feature selection, transformation, and data integration. This operational approach facilitates the swift adoption of a comprehensive analytical framework, streamlining the process and expediting the overall analytical endeavour.
The data integration conflicts presented were encountered in the LEVEL-UP pilots and illustrate the problem statement for each data-analysis task in a production environment. The effort required is pilot-specific and leads to pilot-specific solutions that are not sustainable. The expertise required for data integration requires pilot domain knowledge and expertise in working with different data formats, schemas, and terminologies.
The pilot-specific effort and expertise are hurdles to ramping up a predictive maintenance project from a data-analysis perspective. More specifically, these data integration activities should not be necessary and can be handled by available computer science technologies, where technologies can provide the interoperability of time-series data.
With this, dealing with multiple input formats requires individual adjustments for each format, along with additional filtering and formatting processes. Consequently, a substantial amount of effort is required solely for data retrieval. Ultimately, adopting a universal data structure will reduce unnecessary efforts and, in turn, optimise the overall effectiveness of the entire data and prediction system.
3. Approach for Automating the Information Flow
The approach focuses on the seamless integration of heterogeneous data sources into the training and inference of AI models in the scope of predictive maintenance. The goal here is to develop an information flow that is generally valid for various data sources and AI methods and that is adaptable to changes in the lifecycle of machines and software tools. The approach for such an information flow is presented in detail below. In doing so, the building blocks with their capabilities are presented in detail. A special focus is placed on the data formats and transformation approaches developed, because they enable the interoperable flow of information.
3.1. Overview
Figure 7 gives an overview of the architecture whereby the information flow starts with the machines in the production environment and ends with digital services for predictive maintenance in the cloud. It consists of three main types of elements: edge services, data-sharing infrastructure, and predictive maintenance services. Edge services are used to capture machine data from factories and fields in pilots. Typical edge services are, for example, the cyber–physical systems (CPS) and the Internet of Things (IoT) gateway. Data from edge services, in the form of JSON, XML, or something else, are sent to the data-sharing infrastructure. The data-sharing infrastructure includes data pipelines and services to stream, process, integrate, and preserve machine data. It exploits ontology and semantic mediators to annotate, transform, and integrate the various machine data delivered by edge services. This provides semantic interoperability and helps other services to understand the data. The processed data are afterwards managed in the knowledge-based system (KBS), including a triple store and a repository. Meanwhile, the processed data can be streamed to, and consumed by the predictive maintenance services. The proposed approach uses diverse data-analysis tools and services, which employ various algorithms and methodologies, to analyse and process data for prediction. The reason for utilising multiple analytics tools is that it can leverage the strengths of each tool and capture different aspects of the predictive maintenance problem. Using a variety of tools enables a more holistic view of the data and enhances the chances of detecting potential issues accurately. As a result, it leads to a more reliable and comprehensive decision-making process in predictive maintenance use cases.
Following the overview outlined above,
Figure 8 illustrates the information flow within this approach. In this flow, data are initially collected by the middleware, managed within the knowledge-based system (KBS), and subsequently transformed, integrated, and shared through the semantic mediator. By minimising human effort and intervention, this system effectively addresses the challenges outlined in
Section 2.3.
The information flow leverages the semantic mediator to facilitate the following key functions: (1) identifying relevant data based on domain ontology, (2) uplifting pilot-specific data to align with the chosen domain ontology, (3) enabling the seamless semantic integration of diverse pilot-specific data, and (4) facilitating the sharing and provision of machine-learning models with relevant data, formatted as required, such as in JSON.
This approach streamlines the process, automating various tasks and significantly reducing the need for human involvement. For instance, data analysts only need a comprehension of the domain ontology, eliminating the necessity to inquire into various pilot-specific data schemas. Additionally, the semantic mediator reduces the manual effort required for data integration.
The sub-sections below present the steps of the implemented information flow in detail. For each of the steps, the relevant approaches, specification, and implementation details are shown.
3.2. Information Flow Step: Collection of Data Using Middleware and Data Storage Using KBS
Provisioning and managing field data enable predictive maintenance to leverage an approach for the data integration and interoperability of hw/sw modules, knowledge extraction and data consumption from other applications, and the handling of data flows and their validation. The main objective is to allow a structured and time-based ordered acquisition of IoT-related and maintenance-oriented data from advanced industrial equipment, machinery, gateways, or other correlated applications, defining an intermediate layer and a well-established interface between edged and data consumers.
The requirements have led to the proposal of a middleware which takes into account aspects related to IoT representation, data collection, edge-based processing facilities, and data streaming to support reactive data processing and the efficient integration of applications, including one for long-term data storage and formalisation (KBS). Particular care is given to the system’s security, as it is taught to uplift and scale data from the field layer to the cloud layer, as typically IoT data grow large, with a lot of records from many different sources.
On the edge devices side, the interfacing is implemented through MQTT and HTTP protocols. It supports communication methods typically available on those devices and ensures confidentiality and security in the data exchange. Data are therefore accepted and propagated on a robust streaming interoperable platform both for internal services and external data consumers. On top of this, external data consumers can selectively subscribe to data published on the streaming platform of the middleware or access historical persistent data recorded inside the KBS. So, this approach enables data consumers to use live streams of data arriving from edge devices over a streaming platform optimised for application scalability and access to historical data over a service abstracting complexity on big data storage.
3.2.1. IoT Data Representation
Data management and communication are based on the definition of the entities, allowing the recognition of the devices and the formalisation of the information. Accordingly, IoT data mapping is proposed as shown in
Figure 9, both for supporting efficient streaming/storage and for enabling base security and authorisation mechanisms.
Data series (big data)—typically maps to the collection of parameters that can share functional meaning, data types, and sampling time; each data series specifies the structure of the data in terms of a data-series schema, expressed in Avro format (
https://avro.apache.org/, accessed on 29 January 2024), and can have several revisions to accommodate the need to evolve data definitions over time.
Device types—logical grouping of devices that share common traits. Typically, they map to types of equipment.
Devices—hereby instances of a given device type.
Applications—“Trusted parties” in processing the data published for devices.
Gateways—Intermediate objects that can act as delegates to communicate data belonging to associated devices.
A device type also contains the definitions of the message types that will be exchanged as a data series. They have a unique name within the device type, a schema that describes the structure of the data exchanged, and a set of parameters that control how the data will be treated.
An important concern is that all data handled are time-based, and some services support this paradigm by enforcing time-based queries over data. Not all data can be meaningfully queried by time ranges. Nonetheless, the time-based data are quite general, as it is mostly easy to associate a timestamp with recorded data. To support cases where the time-based paradigm is not fitting, the platform allows for easy integration by connecting to the streaming platform: in this way, it is trivial to listen to data streams and adopt ad-hoc persistence facilities as required. Data-validation features allow users to enforce schemas over incoming data, ensuring that data can be safely accepted and validated, while keeping the flexibility to review data structures over time or to use more relaxed approaches. This also enables metadata enrichment and introduces semantics to acquired data.
3.2.2. Streaming Data
Taking a closer look at the middleware approach, more details on the main elements inside it are provided:
The main element consists of the Kafka cluster, which provides a streaming platform and the backbone of communication across all the services and components, enabling reactive data processing.
An IoT Registry is proposed as a service containing the definition of the data structures and the connected devices and exposes a GUI, allowing the user to map the data in terms of the definition of devices, device types, time-series data, and relationships among them.
Gateway modules are introduced as services to expose interfaces toward the field, leveraging MQTT and HTTP protocols. An additional MQTT proxy implementing a connector for an IDS-compliant access control has been proposed and included as a possible further way to interact with middleware.
3.2.3. Long Storage of Data
The KBS approach deals with a big-data persistency layer, keeping the data in safe storage indexed by a timestamp and exposing API-based data-retrieval queries.
The main input comes from the middleware streaming layer, which enables the data flow: the KBS subscribes to all the topics on the streaming platform and provides long-term data storage backed by an appropriate database.
The storing procedures leverage the declaration of devices and data series to achieve an efficient storage model and tune options such as data retention. All persistent needs are addressed using Cassandra key spaces; Apache Cassandra technology has been chosen as it ensures great horizontal scalability, very easy-to-tune replicability, and is one of the best technologies in class performance for big-data storage.
Data retrieval consists of several endpoints available for different types of queries: the avatar endpoint provides a quick representation of the last state of a device, while the history endpoint provides efficient access to large amounts of data processing and filters them by the specific data series or devices.
3.3. Information Flow Step: Data Are Transformed into Information for CRISP-DM Using Semantic Mediator
The goal of the semantic mediator is to achieve the interoperability of data and provide the data as information to the AI tools. The input is the stored data series from middleware and differs with respect to data formats, schemas, and ontologies. To harmonise these heterogeneities, a domain ontology for the time series has been developed and applied for the semantic data-integration approach. The ontology and data integration are presented in detail in the following sub-sections.
3.3.1. Ontologies
The proposed approach takes the sensor, observation, sample, and actuator (SOSA) ontology as the basis for the domain ontology. SOSA is a central building block for the semantic sensor network (SSN) ontology, which describes sensors, their observations, associated procedures, features of interest, samples used, observed properties, and actuators [
16,
17].
Figure 10 provides an overview of the SOSA ontology perspective.
The proposed approach mainly reuses the classes and properties from the observation perspective (as shown in the figure above). The key concepts, such as sensor, observation, result, and feature of interest, can be reused to describe the application of various measurement devices (e.g., sensors) on industrial equipment to obtain measurement values about specified observable properties. The rationale behind this decision is mainly that most production environments deal with measurements about some interesting features (e.g., machine, oil condition, or part feature) with some kind of measurement device, i.e., manual or automatic sensors. For example, the data in the ESMA pilot are mostly measurement data from various sensors installed on machines, such as fibre-optic sensors or acceleration sensors. The TOSHULIN pilot has, for example, the data for oil condition monitoring, and machine operation state monitoring (record of changes between different operating states of the machine). These different kinds of measurements in pilots can be handled as different kinds of observations in the semantic sensor network ontology world. Furthermore, the semantic sensor network ontology is well-accepted in academia and practice [
18]. It is, therefore, feasible to reuse and adapt the concepts in the semantic sensor network ontology as a domain ontology to represent the various measurements in this project.
In the proposed approach, we have extended the SOSA ontology for production environments. For example, in the ESMA pilot, the feature of interest is mainly in machines. We have, therefore, extended the concept sosa:FeatureOfInterest with a sub-class machine. Afterwards, we extended the concept sosa:Sensor with sensors used in the ESMA pilot, such as fibre-optic and acceleration sensors. Meanwhile, the sosa:ObservableProperty is extended, for example, to include arForceEvolutionOSI and arAcceleration.
3.3.2. Transformation Approach
A transformation is defined as a process that is intended to transform or reshape a source. In the scope of this article, the source is data, which are available in different data formats, and terminologies are generated by machines of the production environment. The target of the transformation of machine data is information, represented as an ontology and consumed by the AI frameworks/tools. The transformation process needs a definition of how the source can be transformed into the target.
According to Kleppe et al. [
19], such a type of transformation includes three components “…transformation, transformation definition and transformation rule…”, which are defined as follows: “…A transformation is the automatic generation of a target model from a source model, according to a transformation definition. A transformation definition is a set of transformation rules that together describe how a model in the source language can be transformed into a model in the target language. A transformation rule is a description of how one or more elements in the source language can be transformed into one or more elements in the target language…”. In the context of this work, the definition of transformation according to Kleppe et al. [
19] is used. In the following, the transformation process from time-series data into the domain ontology (SOSA) is presented.
The approach focuses on the creation of transformation definitions for semi-structured data sources. Examples of semi-structured data sources are CSV, JSON, or XML files. Hereby, the transformation can translate only a subset or the complete data from the original data. The available range is shown in
Table 2 below [
15].
The approach focuses on the completeness criteria sound views and exact views whereby the specific amount of information can be defined for each pilot. For that purpose, the tuples of the ontology to be transformed are defined in SPARQL queries. The SPARQL query defines which concepts and properties are relevant and based on this, the specific transformation rules are determined as part of the transformation definition.
The transformation definition shall be transparent, traceable, and updateable in the lifecycle of the ML. For that purpose, the transformation definition is represented as an XML file readable by humans and computer programs. The XML file contains transformation rules to transform the input into an ontology. The sequence of transformation rules is shown in
Figure 11.
The sequence starts with the transformation of the ontological concepts. For that purpose, all relevant concepts need to be listed and the location within the source needs to be added. For each concept, the transformation rule ClassMapping needs to be defined.
Figure 12 shows an example of such a rule taken for the mapping of an XML path.
The XML element XMLTag is data source type that is specific and can be changed for each type of semi-structured data source. This means that the name of this XML element and the type of the data source defines how the location of concepts works within the transformation rule. For example, mapping for hierarchical data sources, such as JSON and XML (XMLTag), uses the path of the element tree, while the mapping for CSV files (column) uses the column instead.
The transformation rule ClassMapping contains a unique ID for internal mapping and the path where the list of elements representing the concept is added.
An individual of an ontological concept needs concrete values for the datatype properties. For example, the name of a person or age of a person are common datatype properties. The mapping of a datatype property maps an element to a specific datatype property for a concept. For that purpose, the transformation rule DatatypePropetyMapping is specified. An example is shown in
Figure 13. The name of the datatype property is codified in the XML attribute propertyName. The assignment to a concept is implemented via the XML element SubClass. The specific mapping of source schema to the ontology is data-format-specific. In the case of an XML or JSON file, the XML element XMLTag is used to achieve the mapping from the source schema to the target datatype property. If the same datatype property is mapped for two different ontological concepts, then two transformation rules are required.
The tree structure of a hierarchical file supports nested objects. The creation of nested objects is possible in ontologies using object properties. To enable the transformation of nested objects, mappings of object properties to source elements are possible.
The considered sensory/time-series data from the pilots are a sequence of JSON attributes for a sensor and its measured value. To link the measurements to background information like the sensor type or sensor tolerance, a new type of transformation rule is needed and has been added. This new transformation rule enables the creation of additional ontological statements (facts for the Abox) during the transformation process. An example of such a wrapper configuration is shown in
Figure 13.
The XML element <StatementInsertion> of the transformation rule defines in the example that the reference to the sensor and measured property is added in the case of the transformation of the arForceEvolutionOSI sensor measurement. This additional capability enables the uplifting of sensory data with background knowledge to simplify the usage for subsequent analysis.
3.3.3. Ontology-Annotated Time-Series Data for Predictions
The result of transforming time-series data into an ontology is an ontology in RDF/XML that contains the core information of the time-series data. This includes the measurements, which have a time stamp, as well as the measured sensor value and the background information of the sensor. The sensor is represented as an individual and is associated with a measurement as an individual. This amount of information serves as input for subsequent predictive analysis.
Predictive models require continuous data as input (streaming data), which could be represented as an ontology. So far, no tools support ontologies as input. In contrast, JSON is the de facto standard for exchanging data between REST services on the Internet. Accordingly, the requirement was set that the time-series data should not be provided to the tools as an ontology, but rather as JSON. Accordingly, another transformation definition was required. The transformation definition takes as input an ontology in which the T-box (for terminological knowledge) is fixed, and only the A-box (for assertions) can change. Furthermore, the target format, which was developed as part of the research, is also fixed. The challenge is that the target format should also be fixed in the case of heterogeneous sensor data, which could be heterogeneous with respect to the linkage to a sensor and the data type of the measured value. The developed JSON schema as the target data format is shown as a snippet in
Figure 14. Starting from line 31, there is a repeating part defined for each primitive datatype (boolean, string, float and integer), which is removed for String, Float and Integer to ensure readability of the schema.
The JSON schema includes the Observable Properties JSON attribute, which lists all the measured properties of a given sensor. For example, the observed properties
http://www.levelup-project.eu/ontologies#acceleration and
http://www.levelup-project.eu/ontologies#processEnergy could be measured by an acceleration sensor. The readings are added within the observations JSON array. A new entry is added for each new timestamp. Each entry contains a timestamp and the readings for that timestamp. The readings are added to the corresponding JSON arrays (Boolean, float, string) according to their data type. The index of the array correlates to the index within the observable property of the array. This linkage allows fast parsing approaches without traversing the entire JSON file. An example of prediction input is shown in
Figure 15.
The examples show that two measurements of different observable properties are available for one timestamp. Both measurements measured the sensor values as float values, but the second measurement contained two values for a timestamp instead of one. This difference is not a bug but rather a feature and allows more than one value to be added to a given timestamp. This allows the different frequencies of the sensors to be taken into account at the receiver endpoint of this input data.
3.3.4. Ontology-Annotated Time-Series Data for Historical Data
Historical data are collected over a long period of time, during which data formats and other technical details change. Each change means that the historical data collection tool chain needs to be updated. In this case, steps 2 and 3 of the CRISP-DM need to be performed. Common updates would include a new software adapter to enable the integration of the new data formats and terminologies into the expected data formats for predictive maintenance tools. This challenge is solved by using the proposed information flow and tool chain.
The application of the semantic mediator plays a central role in updating the supported data formats. For this purpose, the semantic mediator needs to update only the transformation definition as part of the configuration in case the data formats (e.g., change from XML to JSON), the data schema, or the terminology changes. In this case, the transformation rules need to be updated, and data collection can continue. This means that the transformation rules are available and are human-readable, rather than hidden in the source code of the adapters. This means that the transformation rules can be updated by a wide range of knowledgeable people. The transformation of the data into the prediction JSON files supports archiving the files into a file-based repository such as the KBS or uploading the time-series data into an Influx DB. The upload of the JSON files to an Influx DB is possible using the semantic mediator. The approach presented allows the creation of historical data using a file repository or a time-series database.
The semantic enrichment of time-series data is intended for historical data. For this purpose, the data integration is accompanied by an ontology. The ontology is pre-filled with the specification of the sensors used to enable the look-up of meta-information. Common meta-information is, e.g., the sensor type or the tolerances. The linkage of a sensor to the time-series data is enabled by a UUID of the sensor, which is added to the time-series data. Measurements can also be linked to specific features. A feature measures something for a specific purpose. For example, a feature might measure whether a part meets dimensional requirements, or a smart sensor might measure strange sensor values. The definition of these features can be added to the ontology and mentioned inside the featureOfInterest JSON attribute as part of the prediction JSON input file.
The specification of sensors and features is relevant information for building AI models. For example, the definition of outlier detection can take into account the measurement range, or the measurement accuracy can be used to smooth time series. Using this information from an ontology supports the traceability of the setup and calibration of an AI model. Thus, the change of sensors during the ML lifecycle can be automatically taken into account using this kind of formalised and integrated knowledge. In addition, the background knowledge can be used to apply prescriptive analytics in which the past performance and trends are investigated based on the measured features and applied to determine future goals.
3.3.5. Preparing Information for AI Tools Based on Ontology-Annotated Data
This step addresses integrating the time-series data into the AI tools to perform the CRISP-DM steps of modelling, evaluation, and deployment.
As mentioned above, the journey of data is a well-orchestrated process that starts with the initial data ingestion, transportation, and storage handled by HOLONIX’s middleware and knowledge-based system (KBS). The final preparatory step occurs in the semantic mediator where vital transformations take place. During this final step, the data are translated into a standardised JSON format that can be universally comprehended by all project pilots, facilitating the data-consuming process.
The transformed data, now harmonised and structured, are received from the predictive maintenance platform through a Kafka publication/subscription model (
https://kafka.apache.org/, accessed on 29 January 2024) once they go through the semantic mediator following the format depicted in
Figure 16.
3.4. Information Flow Step: Integrating Information into the AI Framework
The final phase in integrating analytics and data engineering tools into the AI framework involves the AI components receiving information through the middleware, specifically via the semantic mediator’s topic. The received data adhere to a globally standardised format, as detailed in previous sections. Consequently, minimal transformation is required, enabling the analysis.
Notably, this pipeline eliminates the need for custom reshaping, focusing on transformations, thereby leaving room only for essential pre-processing functions. In the instances outlined in this paper, a C#-based micro-service was crafted to handle filtering, buffering, computational functionalities, and the transformation of incoming data into the predictive maintenance platform’s internal JSON format. By maintaining a consistent JSON format across various scenarios, the necessity for diverse receiving services, as described above, has been eliminated.
To retrieve data, a Kafka client was initialised, subscribed to the relevant topic, and applied the necessary transformations. In addition to the online pipeline, a mechanism for offline data retrieval was developed. This serves as an error-mitigation strategy in case of malfunctions during the online phase, allowing data retrieval offline. It also serves as an initial step in setting up the analysis, where offline data are retrieved for the initial training and preparation of fully deployed online predictive analysis tools.
Within this mechanism, Python scripts were created to directly retrieve data from the KBS and save these data into an InfluxDB. An example of such an application is provided below, where in
Figure 17 and
Figure 18, the authentication process for accessing the KBS as well as the actual retrieval of data are depicted.
The flow recommences once the offline preparation is complete and the online tools have been developed. With the preliminary processing complete, via the transforming services that were described previously, the data moves on to the analysis phase. Each tool can handle this part differently. Nonetheless, for the use cases described in this paper, the predictive maintenance platform solution contains various C# and Python micro-services that offer fault detection, vibration analysis, and time-series prediction services. Each of these services can be customised and optimised to cater to the unique use cases presented by the various scenarios.
Finally, large amounts of processed sensorial data together with the prediction results are stored in time-series databases, such as MongoDB or Influx DB, for preservation, post-processing of results, and visualisations. The analysis results are published back to the HOLONIX’s middleware, available for consumption by any post-processing service.
4. Evaluation
The evaluation aims to assess and analyse the research findings, methods, and outcomes to draw meaningful conclusions and make informed recommendations in predictive maintenance. To accomplish this, the evaluation places a primary focus on the applicability and advantages of the developed information flow.
The evaluation shall demonstrate its applicability for production environments in the real world. In doing so, the information flow is established and evaluated in two application scenarios. In these application scenarios, time-series data are systematically gathered from machines, and subsequently employed in predictive maintenance processes, characterised by continuous detection and forecasting capabilities. The two real-world examples are concrete use cases in the research project LEVEL-UP, in which existing production environments have been upgraded with sensors to enable predictive maintenance and other Industry 4.0-related services. With this, the heterogeneity of the data sources related to legacy systems and the added sensors are the typical baseline for predictive maintenance projects. This is the reason why the two pilots have been selected.
The evaluation has two scenarios. The first scenario of the evaluation compares the effort for the CRISP-DM phases before using the data-sharing infrastructure to map the automatic data acquisition, data integration, and storage for the information flow. In doing so, the acquisition of the data as mentioned in the previous sections, the middleware, and the semantic mediator were utilised. Once the data were retrieved and transformed to a uniform JSON format via the semantic mediator, the analytics tools were able to apply machine-learning techniques and algorithms. In the following scenarios, the information flow, the applied AI methods, and their findings are presented in detail. In the following, both scenarios of the evaluation are presented in detail.
4.1. Evaluation Scenario I: Data Understanding and Data Preparation of CRISP-DM
The evaluation scenario examines the effort involved in carrying out the CRISP-DM steps of data understanding and data preparation for the ESMA and TOSHULIN pilots. The effort at the beginning of the research project, when the data-sharing tool was not available, was compared with the effort after the data-sharing tool was implemented. This evaluation is possible because different sensors were integrated into the machines at different times during the project and could therefore be used for predictive maintenance.
Table 3 demonstrates that the effort required for planning and the subsequent physical exchange of measured values is eliminated. Furthermore, the tasks of understanding the file format and the schema are no longer necessary. While the assignment of the measured values to specific sensors was integrated by the semantic mediator, there is a lack of understanding of the meaning of the measured values in relation to production and the machine. For this purpose, meetings and additional documentation between the pilot and the data analyst are still necessary as part of the semantic understanding. The subsequent steps related to data cleaning, data filtering, and feeding into the target programs are carried out automatically and do not require any manual steps on the part of the data analyst.
4.2. Evaluation Scenario II: Modelling and Deployment of CRISP-DM
The following scenarios illustrate the application of the proposed flow and components, providing readers with a sense of how such a system could operate for the CRISP-DM steps of modelling and deployment. While the measurements and analysis may vary depending on the case and scenario, the process of data retrieval and transformation through the middleware and semantic mediator remains similar across different applicable cases.
The different scenarios highlight different experiences in the same information flow that, in a generic way and as a whole, are described in
Figure 7.
4.2.1. Application Scenario: ESMA
The primary goal of the ESMA scenario is to undertake a vibration-based analysis and develop an anomaly detection approach for the press structure and its associated kinematic chain components, such as bearings. The specific use case for the ESMA scenario centres on ensuring the structural integrity of a press, which comprises welded metal sheets of varying thicknesses and welded joints susceptible to cracking due to the cumulative effects of fatigue.
The core focus of the analysis is to identify and predict the onset of any cracks by leveraging a diverse range of sensory data. In the ESMA use case, several sensors have been installed for condition monitoring, from which we isolated and focused on the most prominent ones. Specifically,
Table 4 showcases the data that the semantic mediator and, later on, the analytic tools utilise for detecting cracks and deformations.
The selection of these measurements as the primary focus for analysis was guided by domain expertise and recommendations from experts. Furthermore, the patterns identified in the OSI and OSO measurements have proven to be instrumental in applying various pattern-identification techniques and models. The inclusion of the ID was essential for effective filtering, and lastly, the accelerometer measurements provide valuable insights into the condition of machinery equipment.
The main goals of the implemented PdM solutions for the ESMA scenario were as follows:
Real-time visual analysis of acceleration and force-related measurements;
Historical analysis of above signals for a selected period (e.g., one week/month/year back);
Real-time anomaly detection to assess the state of the machine.
Machine-status monitoring is facilitated through customised panels for visual representation, which is shown in
Figure 19. In this scenario, a range of fault-detection techniques were developed and assessed. These techniques employed semi-supervised methods, utilising patterns from OSI and OSO measurements along with acceleration data to yield valuable results. During the evaluation of the techniques, the emphasis was on preventing false positive indications, as a complete F1-score calculation was impractical due to the absence of actual failures during the evaluation period. The figures below depict the status of various monitoring panels that contain actual data, analysis-based thresholds, and detected events.
Further data analytics services, such as machine-state forecasting and anomaly detection, have also been integrated into the ESMA scenario. These deployed services utilised the data retrieval from the accelerometer sensors transformed through the middleware and semantic mediator, which then served as input to the predictive data analytics models.
Figure 20 depicts the detection results for a 3-day interval. The top diagram shows the machine state (i.e., NORMAL, WARNING, or CRITICAL), and the bottom plot depicts the “anomaly score”, which represents the distance from the healthy state, together with the thresholds (yellow: Warning, red: Critical) that define the point anomalies.
4.2.2. Application Scenario: TOSHULIN
For the TOSHULIN application scenario, a vertical lathe, the SKIQ-16, takes centre stage. This machine handles workpieces weighing up to 12 tons, firmly secured to a clamping plate or table, and during the machining process, they rotate at speeds of up to 200 RPM. As the cutting tool comes into play, it diligently removes material in the form of chips, meticulously sculpting the workpiece to meet the desired shape and precision criteria.
In this manufacturing setup, the role of data analysis and machine-learning tools takes on paramount importance. Their primary objectives revolve around time-series forecasting and anomaly detection. Specifically, they focus on evaluating the condition and state of the lubrication system, a critical component of the manufacturing process. This assessment is made possible by monitoring the contribution of oil particles of various sizes throughout the production operations.
A variety of sensorial data were collected, with a focus on the lubrication system and the oil particles’ measurements in accordance with the goal of analysis.
Table 5 showcases the measurements that were isolated and went through an ontology transformation before they were received from the predictive maintenance tools.
These measurements were selected based on expert suggestions and aimed at providing a more representative assessment of the machine’s condition. Specifically, the quantity of oil particles of different dimensions indicates the oil’s state, thereby offering insights into the machine’s overall condition.
The PdM solutions applied in the TOSHULIN scenario offer the following functionalities:
Condition monitoring for the critical parts of the SQIK-v2 machine, such as the hydraulic and lubrication systems;
Monitoring of energy consumption related to the process;
Machine-state-forecasting models together with real-time anomaly detection for oil particles to assess the state of the oil lubrication system.
Figure 21 shows a snapshot (~8 h) of the integrated machine-state-forecasting service developed for the SKIQ-v2 machine. The true sensor values are shown in blue, whereas the model predictions are indicated with orange dots. Additionally, a heatmap-state diagram (
Figure 22) is integrated into the dashboard to have a visual way to assess the oil particles’ state.
Another case that involves lubrication-system monitoring and near-future-behaviour forecasting can be found in the examples below. This analysis consists of two components: the utilisation of semi-supervised fault-detection-monitoring services and the implementation of time-series prediction models for oil-condition forecasting. In the first case, dynamic limits are calculated, signalling varying degrees of criticality to promptly alert the user if any oil particles surpass the warning or critical thresholds. In
Figure 23, the data are depicted in green, while the warning thresholds are indicated in orange.
For the prediction stage, a smoothing mechanism alongside an encoder–decoder neural network model is utilised to forecast the upcoming oil particle concentrations. The accuracy of this forecasting mechanism is visually demonstrated in
Figure 24 and
Figure 25. These figures compare the actual data and the predicted values while also showcasing the calculated root mean square error (RMSE).
The evaluation of the techniques considered two primary key points. Firstly, in the anomaly detection section, the analysis prioritised the avoidance of false positive indications rather than a full-scale F1 score estimation, given the absence of actual faults during the evaluation period. Secondly, for the prediction stage, the RMSE index can be utilised to assess the accuracy of the predictions.
5. Discussion
5.1. Challenges and Findings
Data for AI, often referred to as ‘training data’ or ‘input data’, are the raw and structured information used to train, validate, and test artificial intelligence (AI) models. These data serve as the foundation upon which AI algorithms learn patterns, make predictions, and perform various tasks. In this article, we focus on data provided by production environments that have begun to transform into Industry 4.0 environments. This makes a huge amount of heterogeneous data from machines, the environment, and other types of sources available for predictive maintenance. The challenge is that the available data are treasures but spread over different data sources, formats, schemas, and terminologies. The drawback for the current data analyst is that the CRISP-DM process describes the training and deployment of AI models, but there is no process that describes how to face the integration of data in the scope of CRISP-DM. The currently available AI frameworks provide the capability to read most of the relevant data sources, but the challenging tasks of continuous data acquisition, data understanding, and data preparation are completely unsupported by the frameworks. A major challenge for the data analyst is acquiring, understanding, and integrating the data into their own tool chain. Raw data are delivered in different media, file formats, schemas, and terminologies specified by the data provider (machine, ERP, etc.). In addition, the data providers are subject to a lifecycle and are regularly updated, which can have an impact on the data. As a result, the data analyst creates a pilot-specific solution. This results in data acquisition via email, custom scripts for data interpretation, data storage and preparation, and the request of meta-information for the datasets, such as units/frequencies and other quick fixes that cannot be used sustainably. The outcome is that these redundant tasks are necessary from the perspective of the current pilot, resulting in a huge amount of source code to be maintained forever. The disadvantages listed are examples of an information flow that has to be set up manually for each pilot. The assumption that the same information flow has to be “reinvented” for each pilot with different data sources and file formats is, in the authors’ opinion, incorrect. The authors’ assumption is that the same information flow can be implemented in the same way for different pilots. Customisation for a specific pilot would then be performed through configuration and not through the development of new scripts. The advantage for the data analyst is that the flow of information becomes negligible for them, and they receive the data in a directly understandable way (in their favourite format). This would significantly reduce the manual effort for the CRISP-DM steps of data understanding and data preparation, and there would be no unnecessary effort for the number of pilot-specific scripts. Data acquisition and semantic data integration can then be supported by automated tools. Based on this assumption, the authors chose the approach of interoperability for a sustainable flow of information. Thus, the AI method for predictive maintenance should become independent of syntax and data transmission. For this purpose, tools have been developed that can be used for every step of the information flow. The result is the data-sharing infrastructure.
The interoperability achieved at the data level results in robust interfaces that can be implemented once by the data analyst and then used for all heterogeneous data providers. This is achieved by maintaining the appropriate customisations through configuration in the middleware, KBS, and semantic mediator. This makes data collection and integration a configuration task rather than an ongoing implementation task. This allows the data analyst to focus on his or her core competency, which is data post-processing to meet the needs of specific AI methods. The data-sharing infrastructure has been deployed for two pilots, namely ESMA and TOSHULIN. The evaluation shows that the CRISP-DM steps, data understanding and data preparation, have become more efficient, as no pilot-specific custom scripts have been developed and no effort for the interpretation of the pilot-specific data formats and data schemas has been needed. In doing so, all information contained in the pilot-specific data sources could be exchanged without any loss of information. In addition, the available AI framework can still be applied without any changes, because the target data format of the data-sharing infrastructure is JSON, and all AI frameworks have libraries for reading JSON files.
5.2. Alignment with Existing Studies
Following the trends of Industry 4.0 in recent years, the traditional manufacturing industry is transforming to digitalisation. As a result, amount of machine-related usage information can be collected, for example, with sensors, for the latest machines and even for obsolete large industrial equipment and assets. To exploit the data for reducing downtime and extending the useful lifetime of machines, predictive maintenance approaches are gaining growing attention. In the literature, there are a number of research projects proposing approaches to predict the maintenance needs of various types of machines [
20,
21]. These approaches mostly take advantage of data-analysis technologies and machine-learning models on the data in implementing predictive maintenance. There is also literature which links predictive maintenance as one cornerstone of Industry 4.0 [
5].
With respect to the reference framework for digitalisation (RAMI 4.0), the developed information flow and implemented data-sharing infrastructure enable the connection of the asset layer via the integration and communication layer to the information layer and enable data-driven service [
22]. One of these data-driven services is predictive maintenance. During the implementation of predictive maintenance in the production environment, several challenges are often involved and need to be handled. These challenges include, among others, the large amount of heterogeneous data, and the variety of machine-learning algorithms, i.e., predictive maintenance models [
23,
24]. To address the challenge of heterogeneous data, semantic interoperability solutions with the usage of ontology or knowledge graphs are promising solutions. Researchers have proposed a number of ontologies and models for integrating machine-related data and for predictive maintenance [
25,
26,
27]. Ontology and knowledge graph-based approaches have also been proposed to handle semantic interoperability issues in predictive maintenance [
23,
28]. However, when we narrow down the solutions, they often address specific tasks or scenarios, for example, pilot-specific ones. The variety and the reusability of predictive maintenance models are not properly addressed. It is not uncommon that multiple PdM models are deployed for the predictive maintenance of a single machine. These different predictive maintenance models with different strengths could have focuses on different aspects of a machine and therefore have different information needs. For example, they may require different sets of data elements and different data formats. Meanwhile, the trained predictive maintenance models should be reusable in different pilots, i.e., scenarios to as great an extent as possible for the reason of, for example, cost saving. When a proposed approach cannot support the different information needs of various PdM models and facilitate the reusability of trained predictive maintenance models under different pilots and scenarios, it is not flexible and generic enough to be implemented for different scenarios.
This paper proposes an information flow to handle the above-mentioned issues. It takes advantage of the SSN ontology with extensions for semantic interoperability of machine-related data, i.e., time-series sensor data. The semantic mediator is configured to continuously enrich the near real-time sensor data with context information and transform them into ontology individuals. Subsequently, the semantic mediator transforms the ontology individuals into JSON files. These JSON files are managed in the KBS repository, and in the meantime, forwarded to predictive maintenance models for fulfilling their information needs. The reason that the sensor data are enriched with ontology and finally transformed into JSON files is multifold. One reason is that the triple store (e.g., Apache Jena Fuseki) is not suitable for managing a large volume of near real-time data. In addition, the predictive maintenance models in these scenarios require JSON files as input. It is worth noting that the semantic mediator is flexible and configurable. According to the information needs of predictive maintenance models, the semantic mediator can be configured to extract and enrich the machine data with ontology and deliver the information exactly required by the predictive maintenance models with the right data formats. In case of updated predictive maintenance models or new predictive maintenance models, which require other sets of machine data enriched with other ontologies or in other data formats, are to be implemented, the semantic mediator can be flexibly configured to meet these needs of an updated set of predictive maintenance models. This ensures the flexibility of the proposed approach. Meanwhile, with ontology-based semantic interoperability, the trained predictive maintenance models are reusable in different scenarios, for example, in different pilots. These features of the information facilitate the generic, flexible, and robust usage of predictive maintenance models under different pilots in different scenarios for predictive maintenance.
5.3. Implications for Methodology and Practice
The aim was to improve the sustainability of the implementation and maintenance of predictive maintenance in a production environment. The improvement addresses the effort to deploy and maintain AI models for predictive maintenance. Until now, data access and subsequent data-integration activities have been mainly manual and production-environment-specific. As a result, specific data access and integration tools have been developed that cannot be reused for another production environment because the communication technology, data formats, or terminology have changed.
From the data analyst’s point of view, a lot of manual effort was required to understand the production environment’s specific data formats and the terminology related to the production environment before the data analyst could start his specific task. Regarding the application of the proposed solution in practice, the proposed solution achieves the interoperability of data for the training and operation of predictive maintenance models. A methodology for transferring data from the machines to the predictive maintenance tools, which meets the interoperability requirements in terms of data access and data integration, is proposed. The benefit for the data analyst is that they automatically receive the data in one tool and one data format, independent of the original manufacturer’s IT infrastructure. This eliminates the manual effort of data access and data integration for the data analyst. This also applies if the manufacturer changes its production environment, for example, by using different data formats or terminologies. In such a case, only the configurations of the semantic mediator need to be adapted, and the information flow remains unchanged for the data analyst. This weakens the very close relationship between AI models and their input data.
The methodology is already implemented with state-of-the-art tools, and the concrete information flow is established for two heterogeneous pilots. In addition, the information flows were stable for a few months to allow the collection of historical data as well as the use of streaming data for continuous prediction. Thus, the applicability of the proposed information flow has been successfully demonstrated and has already reached technology readiness levels (TRL) 7.
The developed methodology is not limited to predictive maintenance. The developed information flow is applicable to time-series data. Thus, the information flow can be used for other application domains of AI. Some examples include using AI models as part of a digital twin, or training AI models as surrogate models for the design process.
6. Conclusions
In conclusion, the provision of data available in an Industry 4.0 environment is valuable but complicated to manage due its complexity and heterogeneity. Currently, there is the challenge of integrating this data into existing processes, such as predictive maintenance, as outlined by the CRISP-DM process. The challenge includes the lack of support for the continuous task of data acquisition, understanding, and preparation in the available AI frameworks. This support is necessary to effectively integrate predictive maintenance into Industry 4.0, which is already motivated by the RAMI 4.0 layers.
As the outcome of the weakness of traditional methods, data analysts often create pilot-specific solutions which require substantial maintenance. The authors implemented an information flow that focuses on interoperability and automatic data provision. The added value is that it establishes the same information flow across different pilots, through configuration rather than script development. This can reduce this challenge significantly, enabling analysts to focus more on their core tasks rather than data processing in the role of a software engineer. The technical solution is the data-sharing infrastructure, which is implemented with respect to existing Industry 4.0 trends, encouraging the transformation of traditional manufacturing to digitalisation and the use of predictive maintenance approaches.
Based on the pilots ESMA and TOSHULIN, the evaluation demonstrated that the successful establishment of interoperability for time-series data is feasible and significantly reduces the effort to establish predictive maintenance models and other AI models within a production environment. With this, the deployment of the data-sharing infrastructure marks a significant milestone in the field of artificial intelligence and data-driven decision making in the scope of Industry 4.0. Through careful data structuring, standardisation, and seamless integration protocols, we have paved the way for AI models to access, analyse, and share time-series data across platforms, systems, and domains.
The ability to transform data into a universal JSON format has the potential to significantly increase the value of future analytics initiatives. This capability simplifies the process, reducing both the time and effort required for pre-processing during the data acquisition phase. As a result, it not only accelerates the pace of analysis, but also reduces the complexity associated with data integration, setting the stage for more efficient and fruitful analytical efforts in the future.
Future research will look at the limited support for time-series data as possible data sources. Many AI models, such as clustering or neural networks, require other types of data. To this end, future research will focus on defining domain ontologies and appropriate JSON schemas to provide the data in a JSON format to the AI frameworks. In addition, the use of the semantic mediator for semantic data integration and the KBS for data storage of non-time-series data need to be evaluated.

 ,
, 


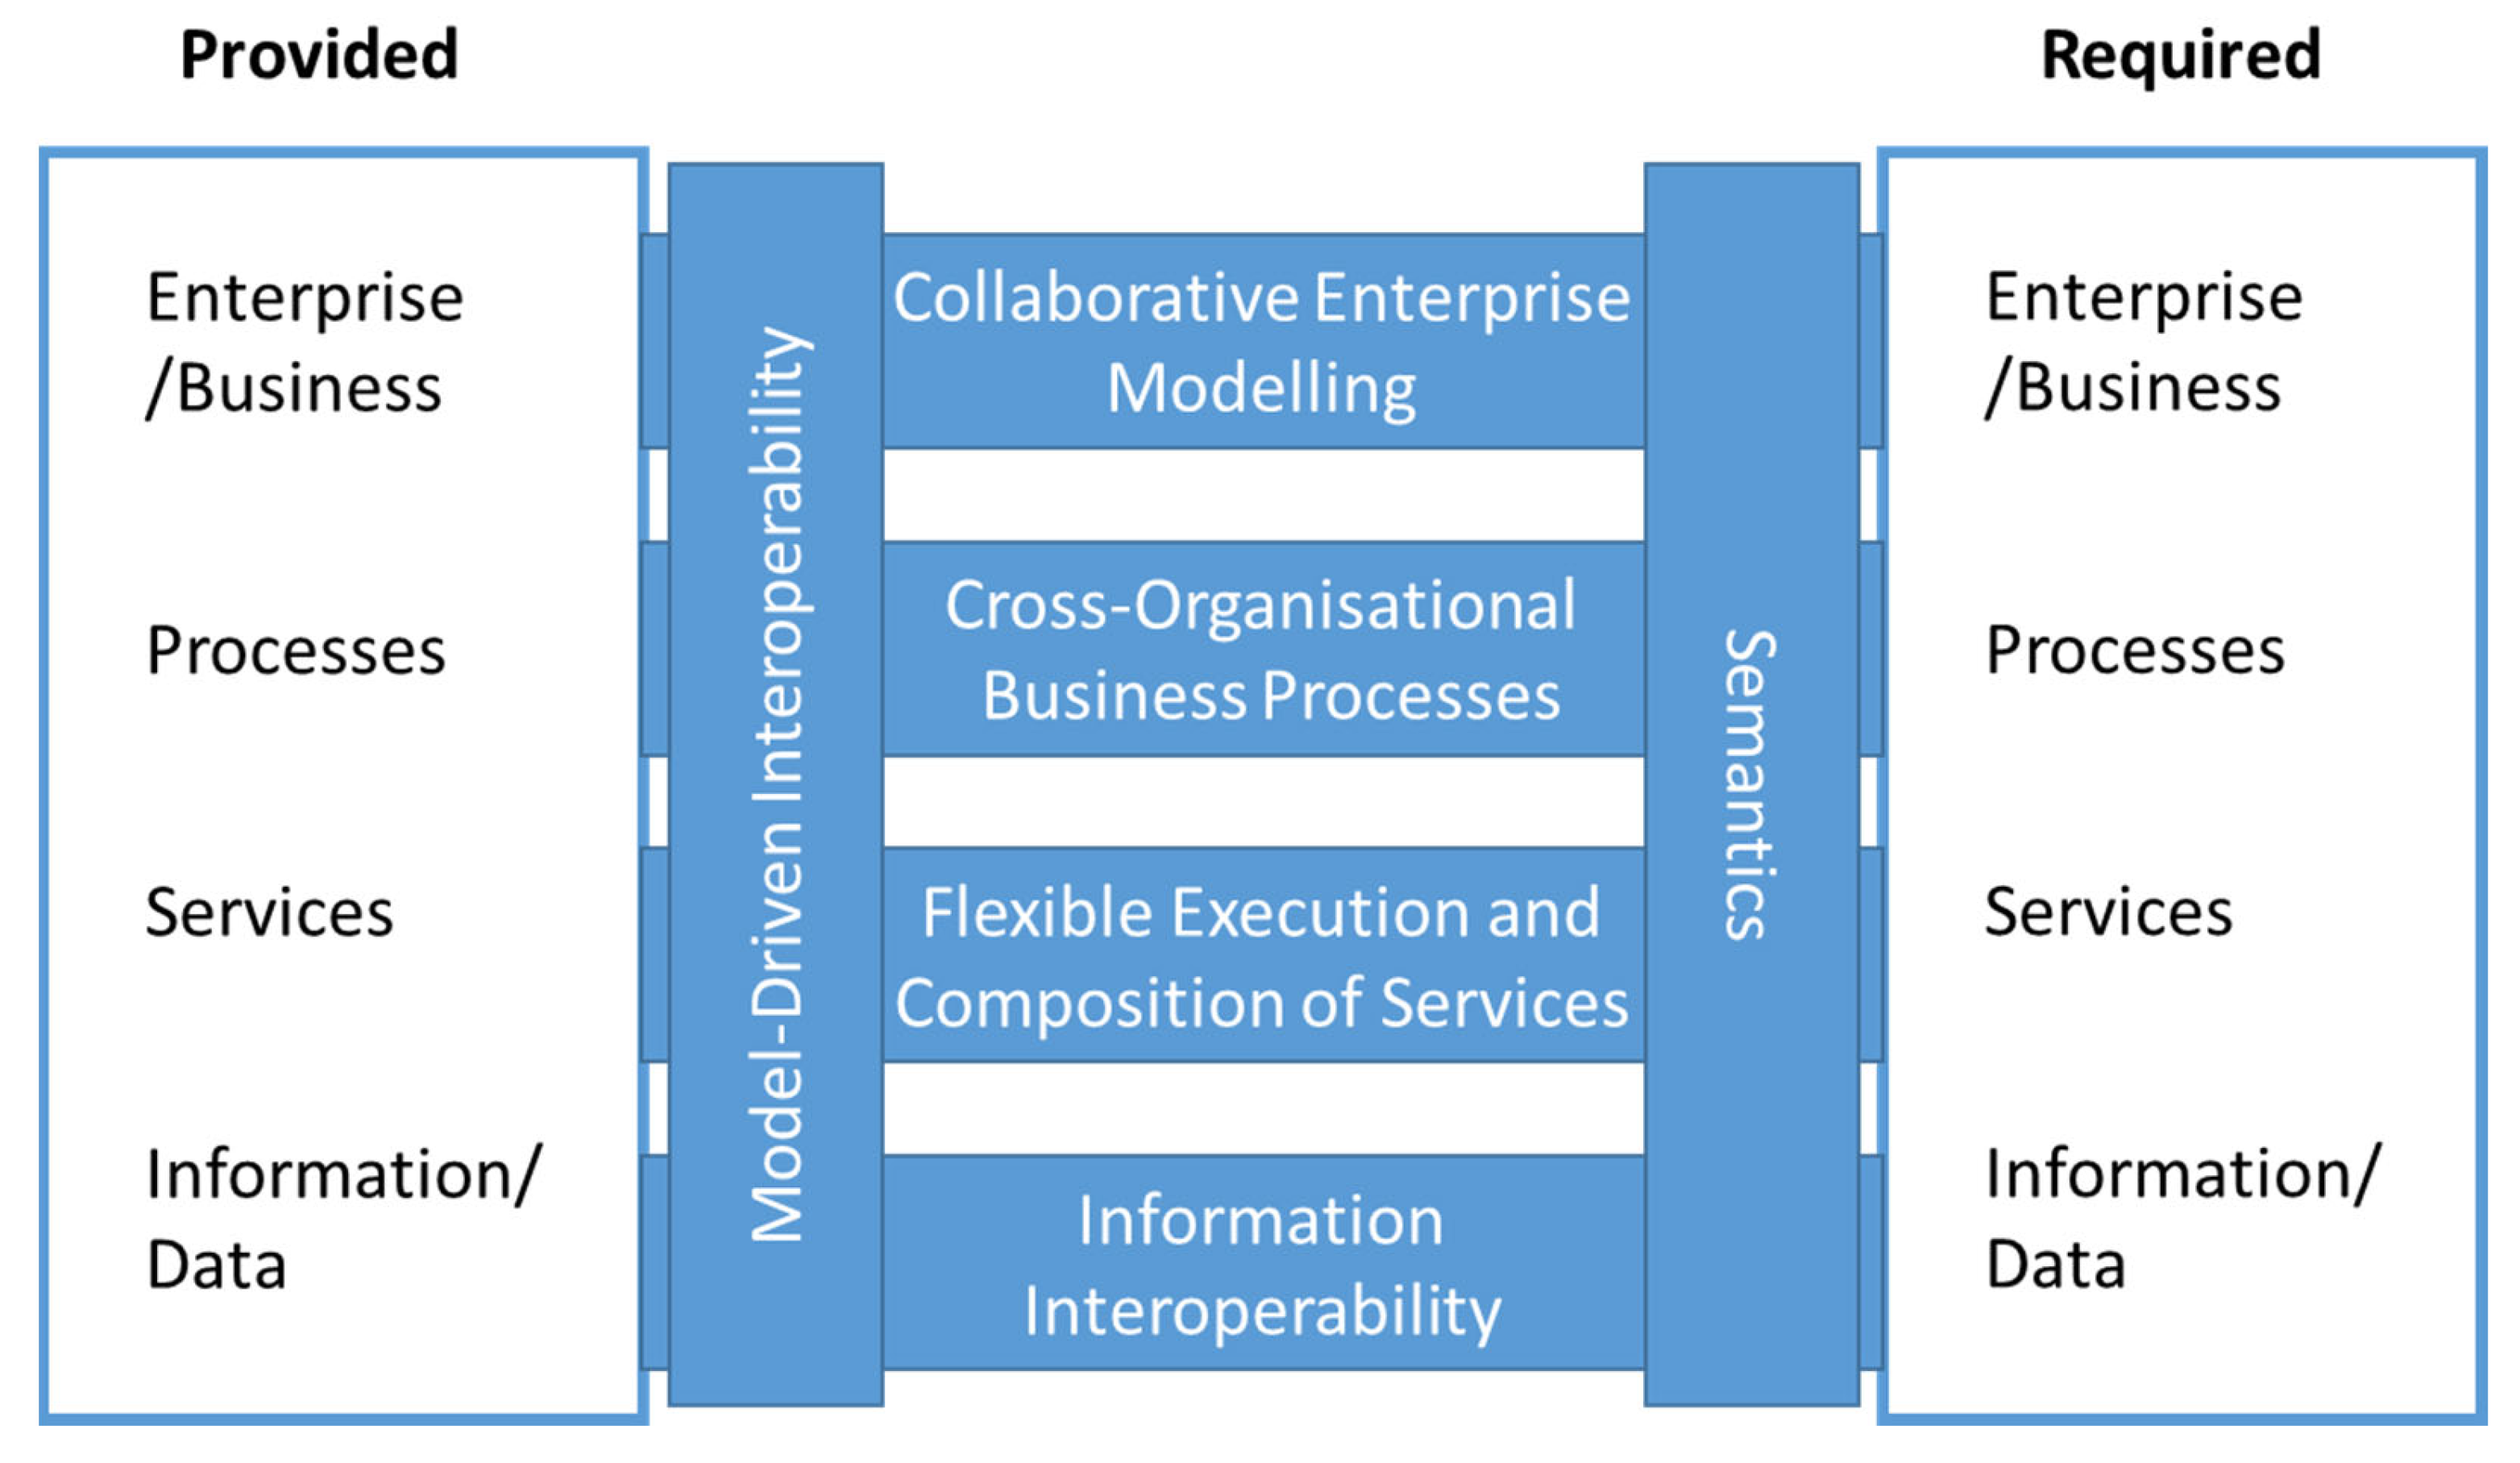
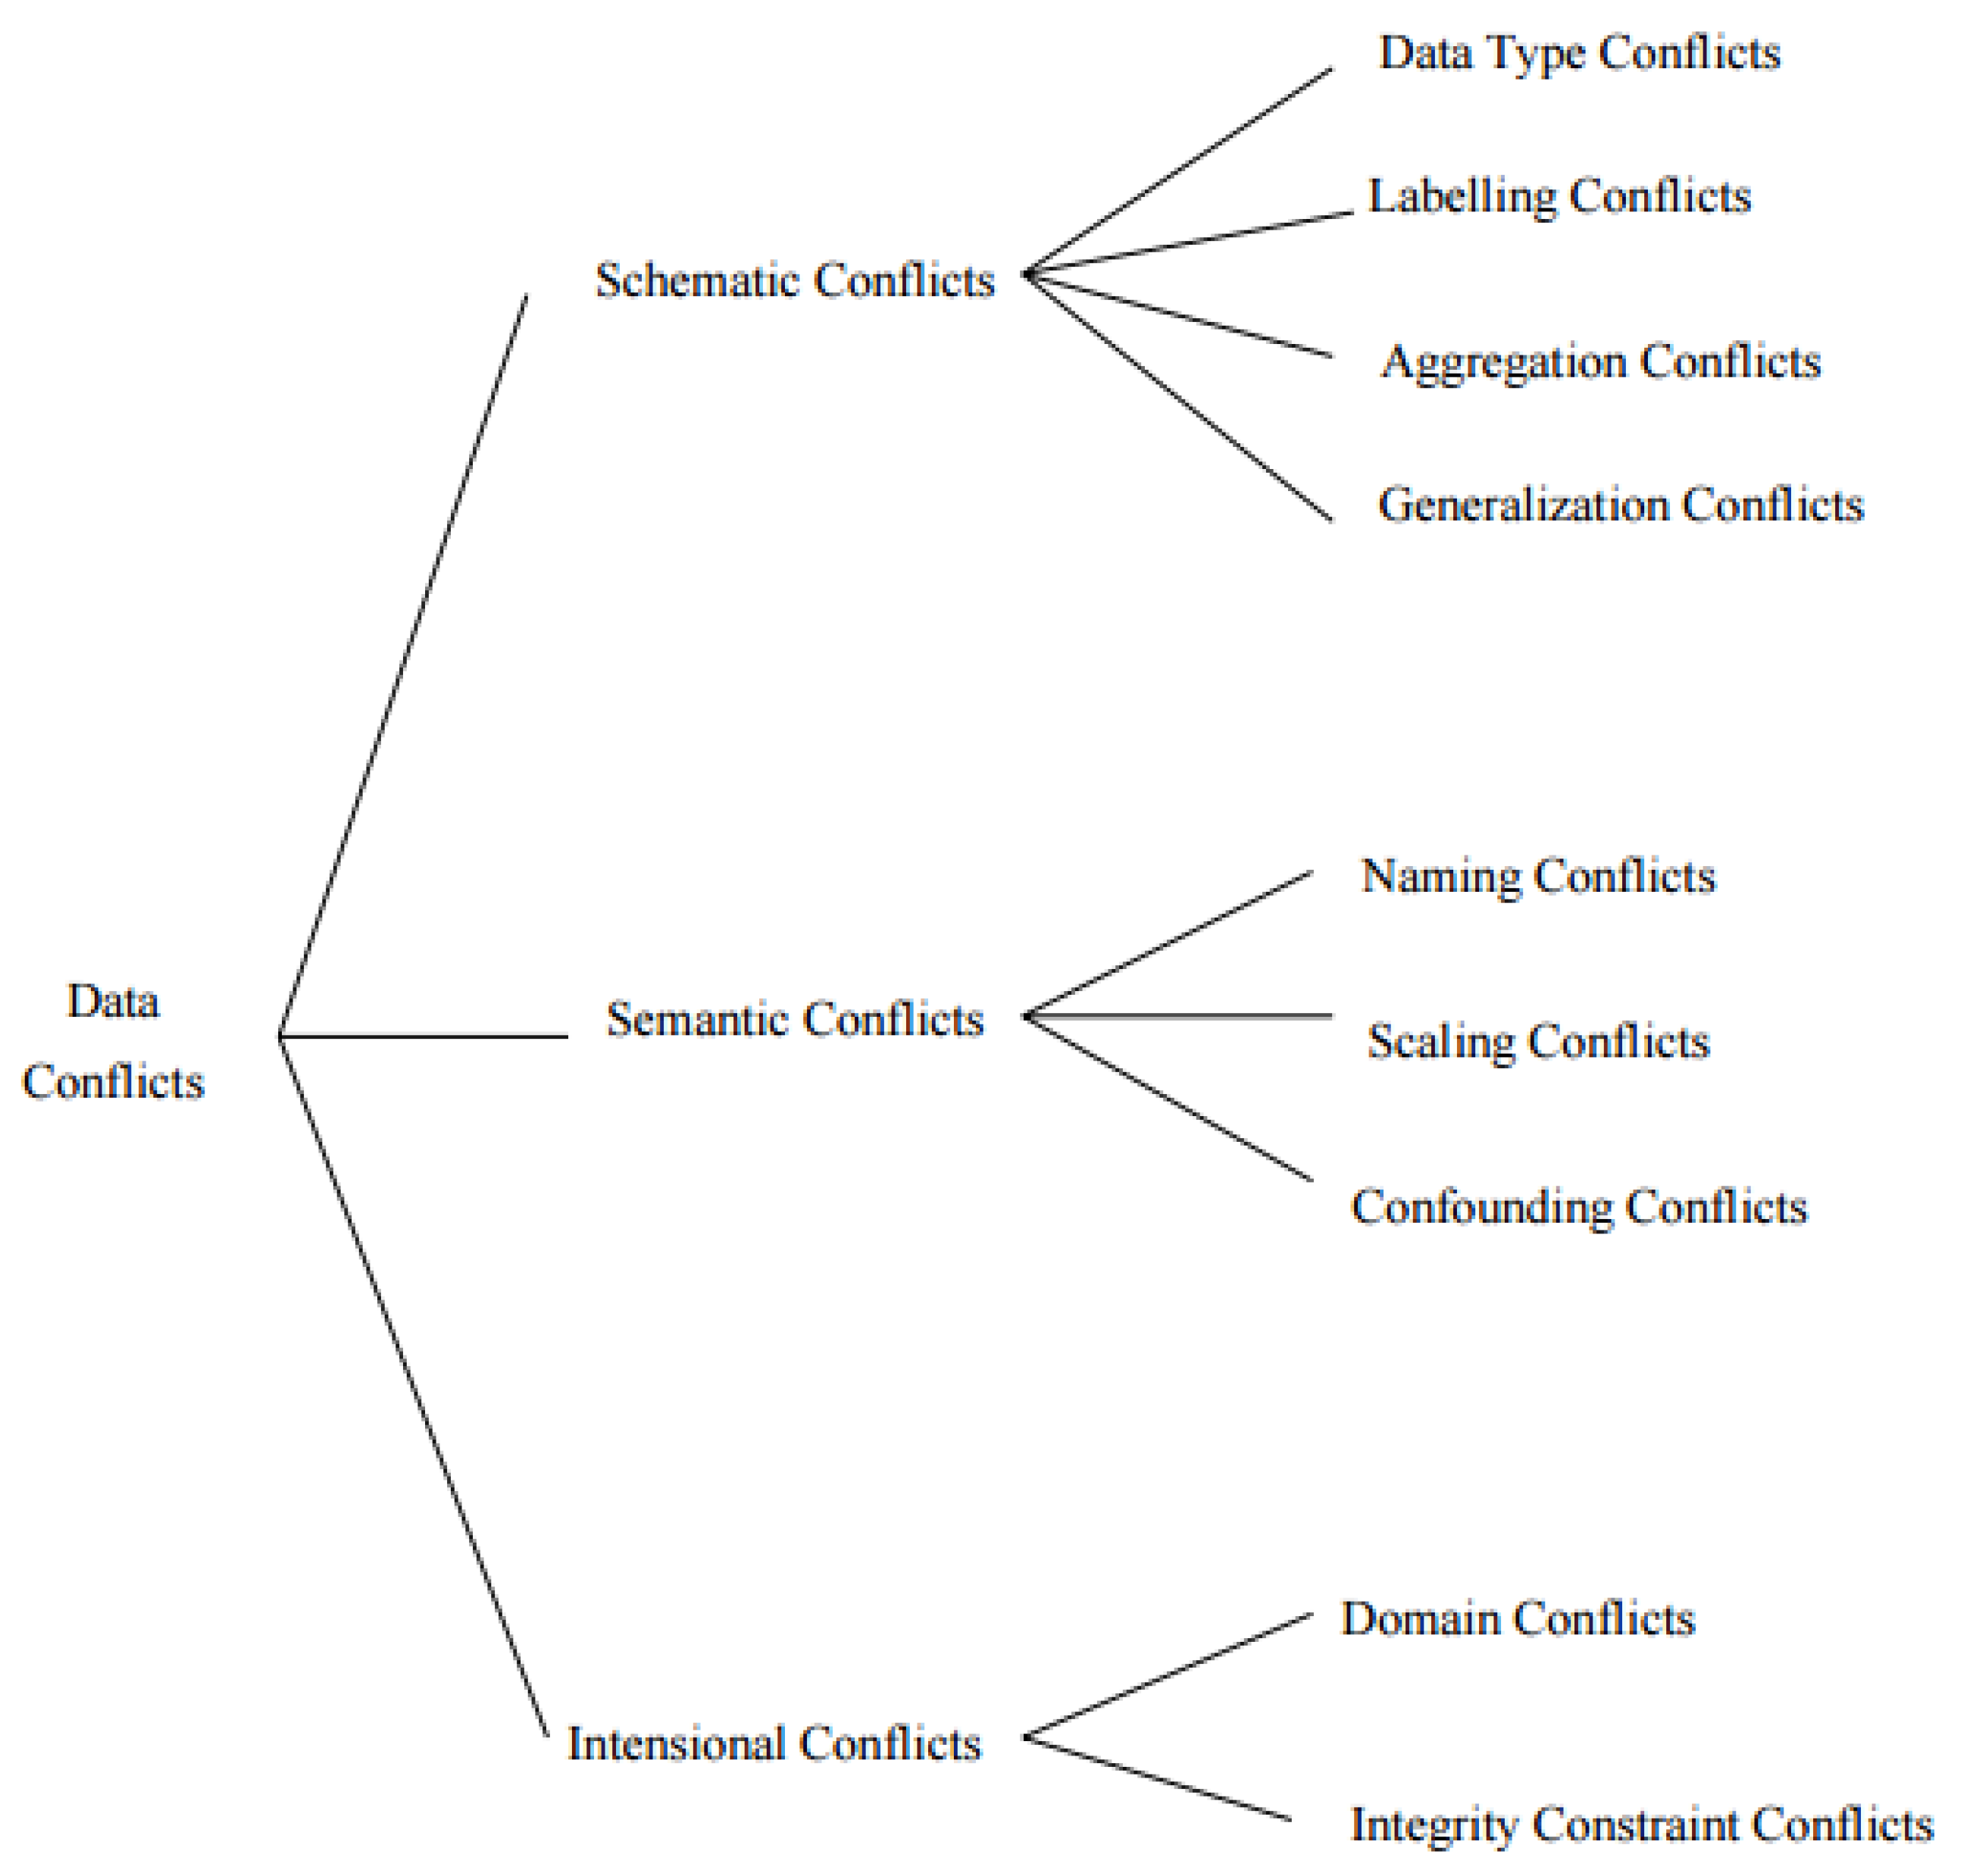
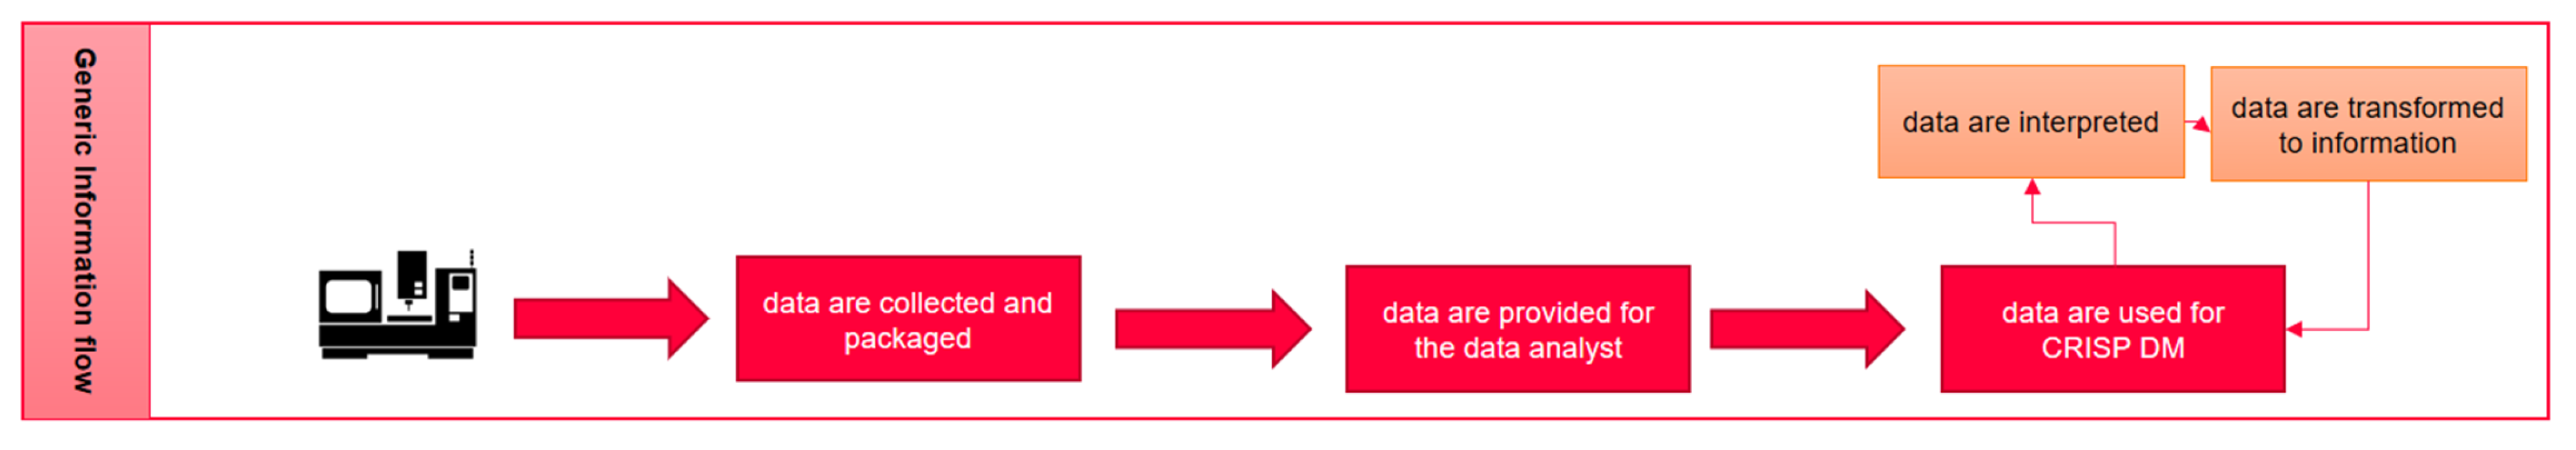
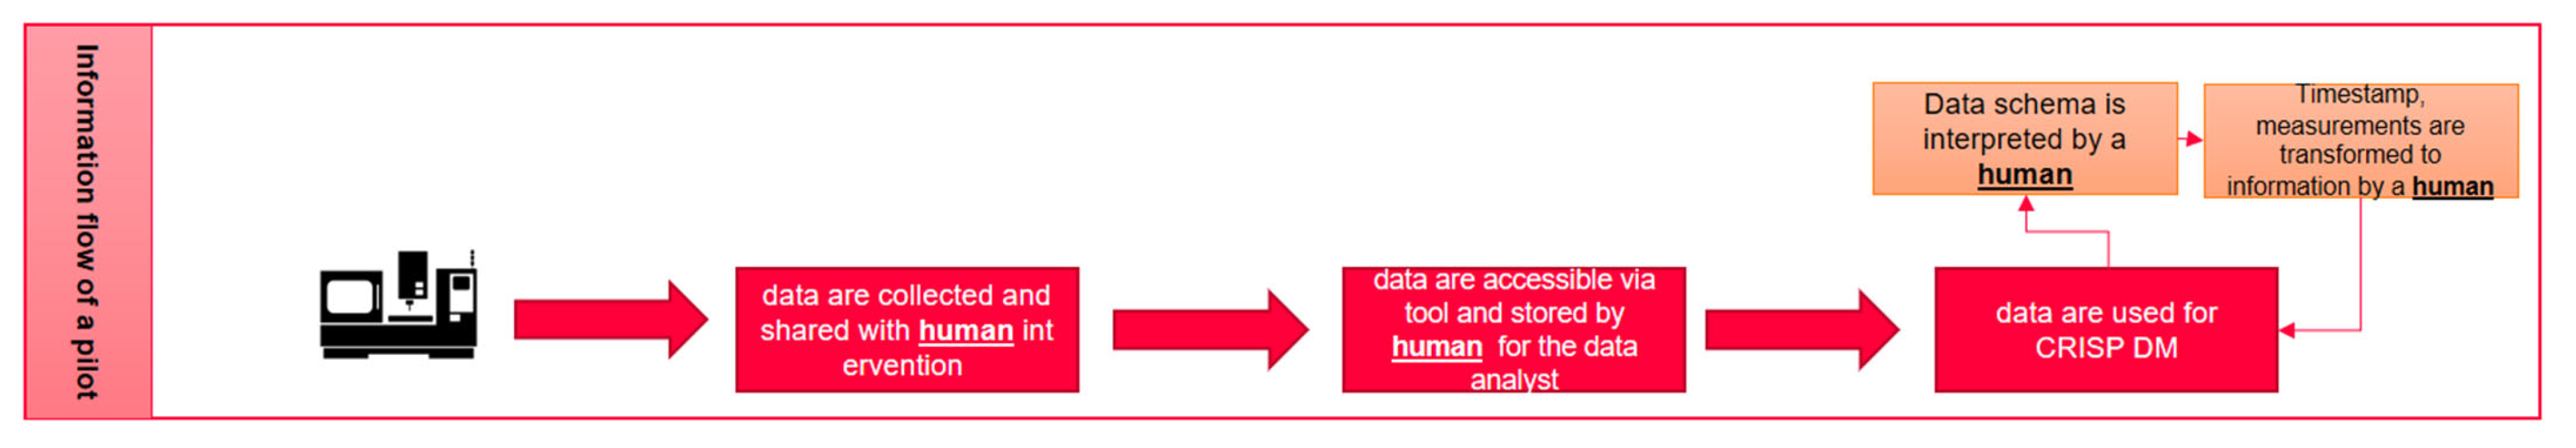
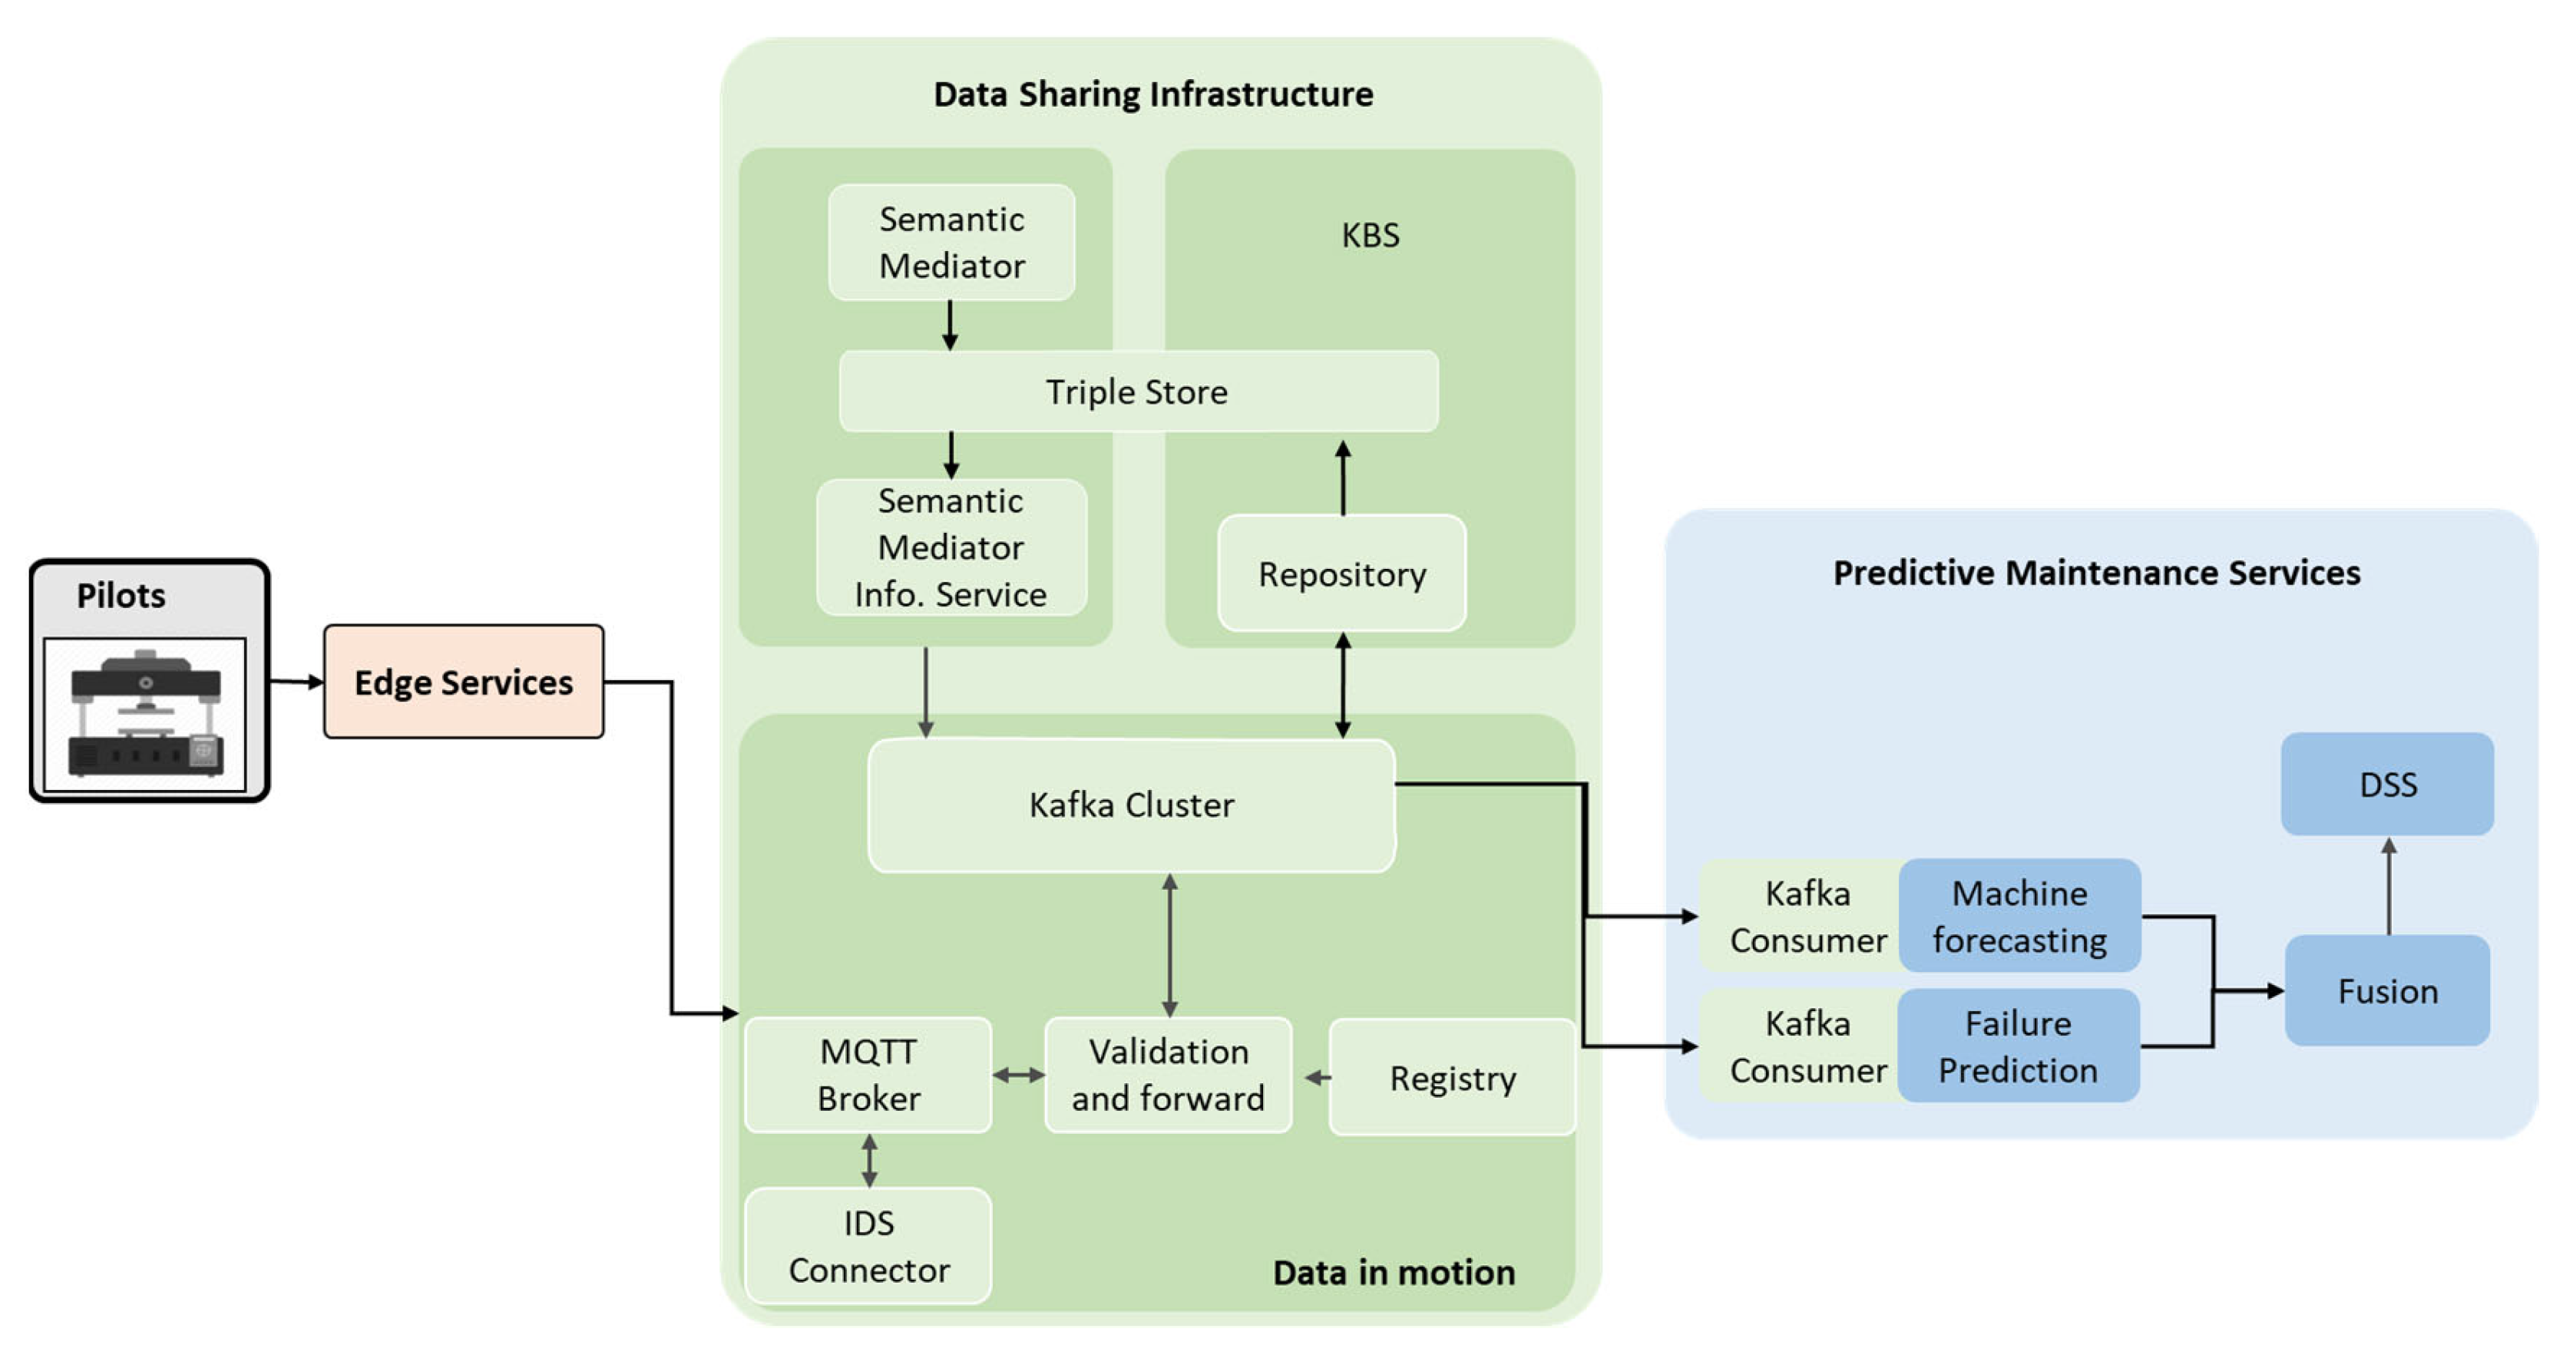
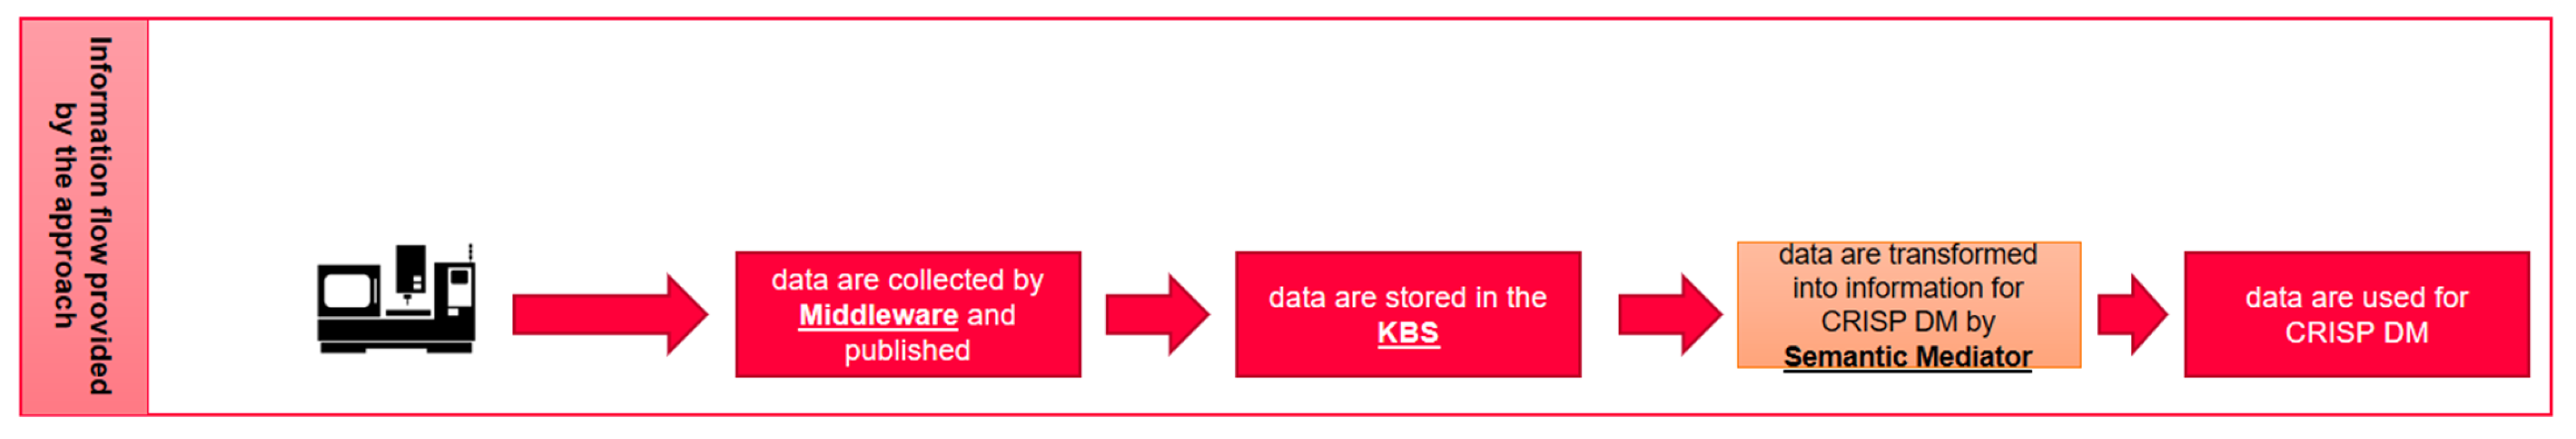
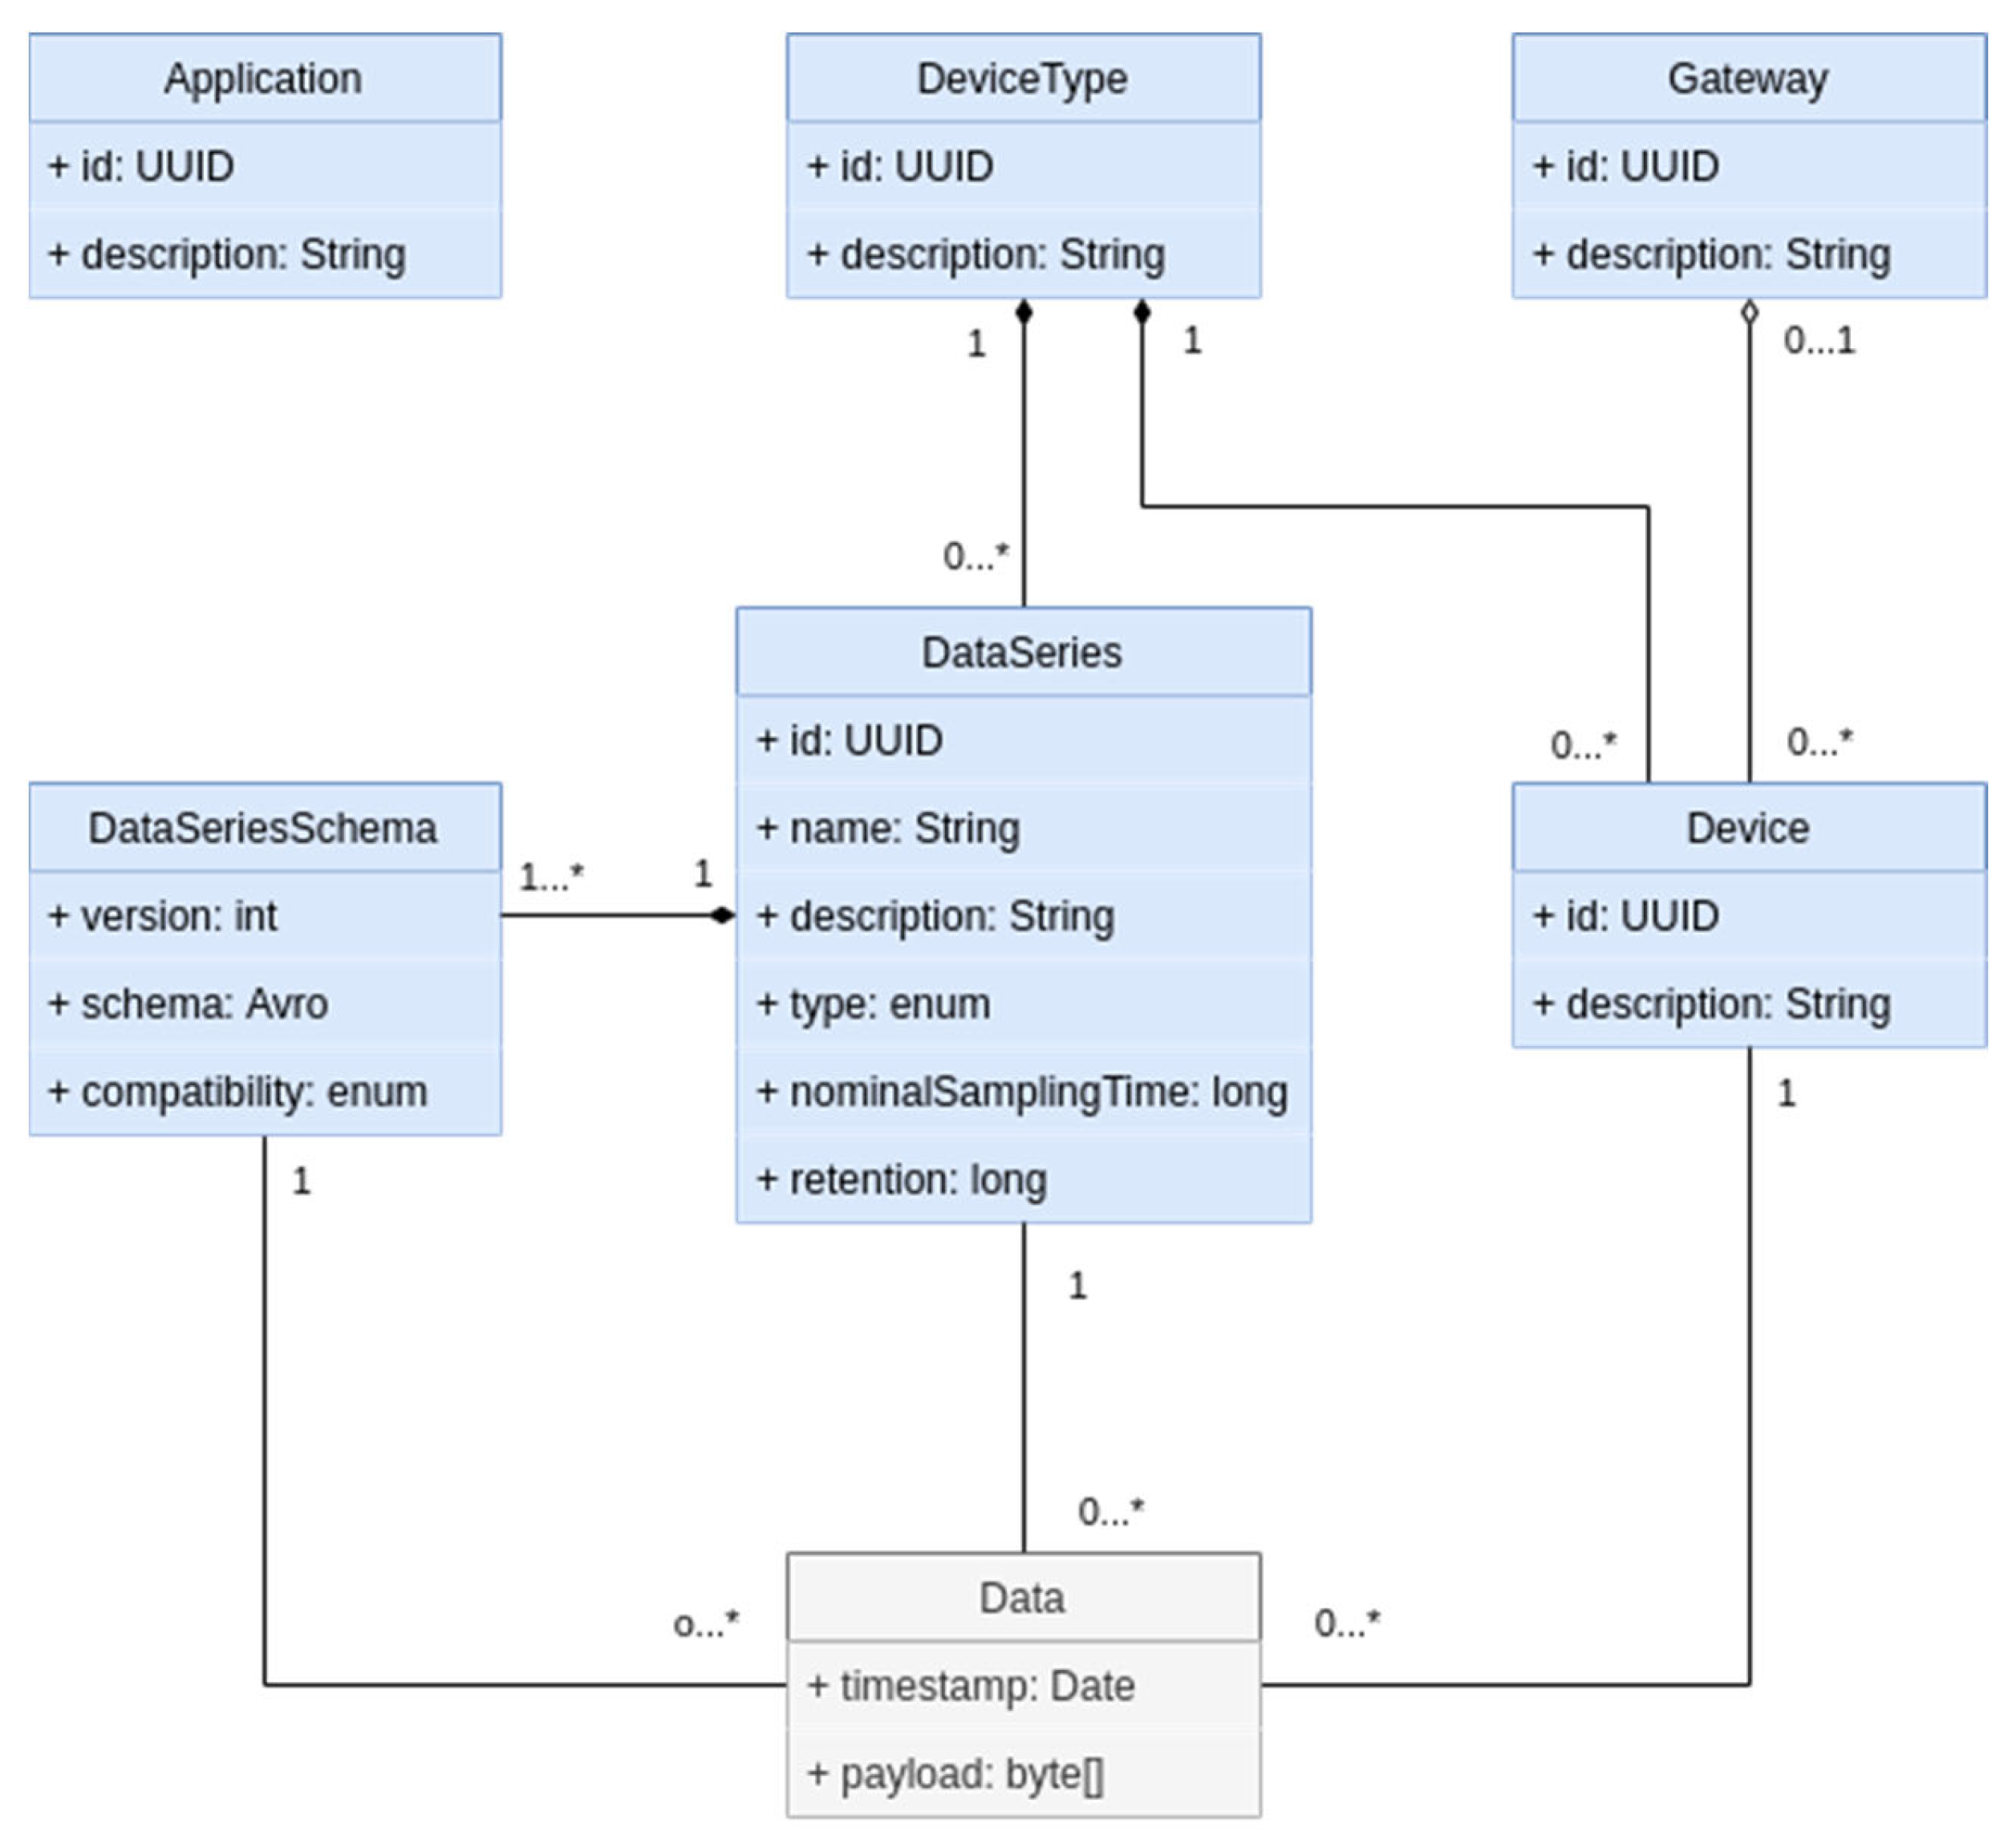
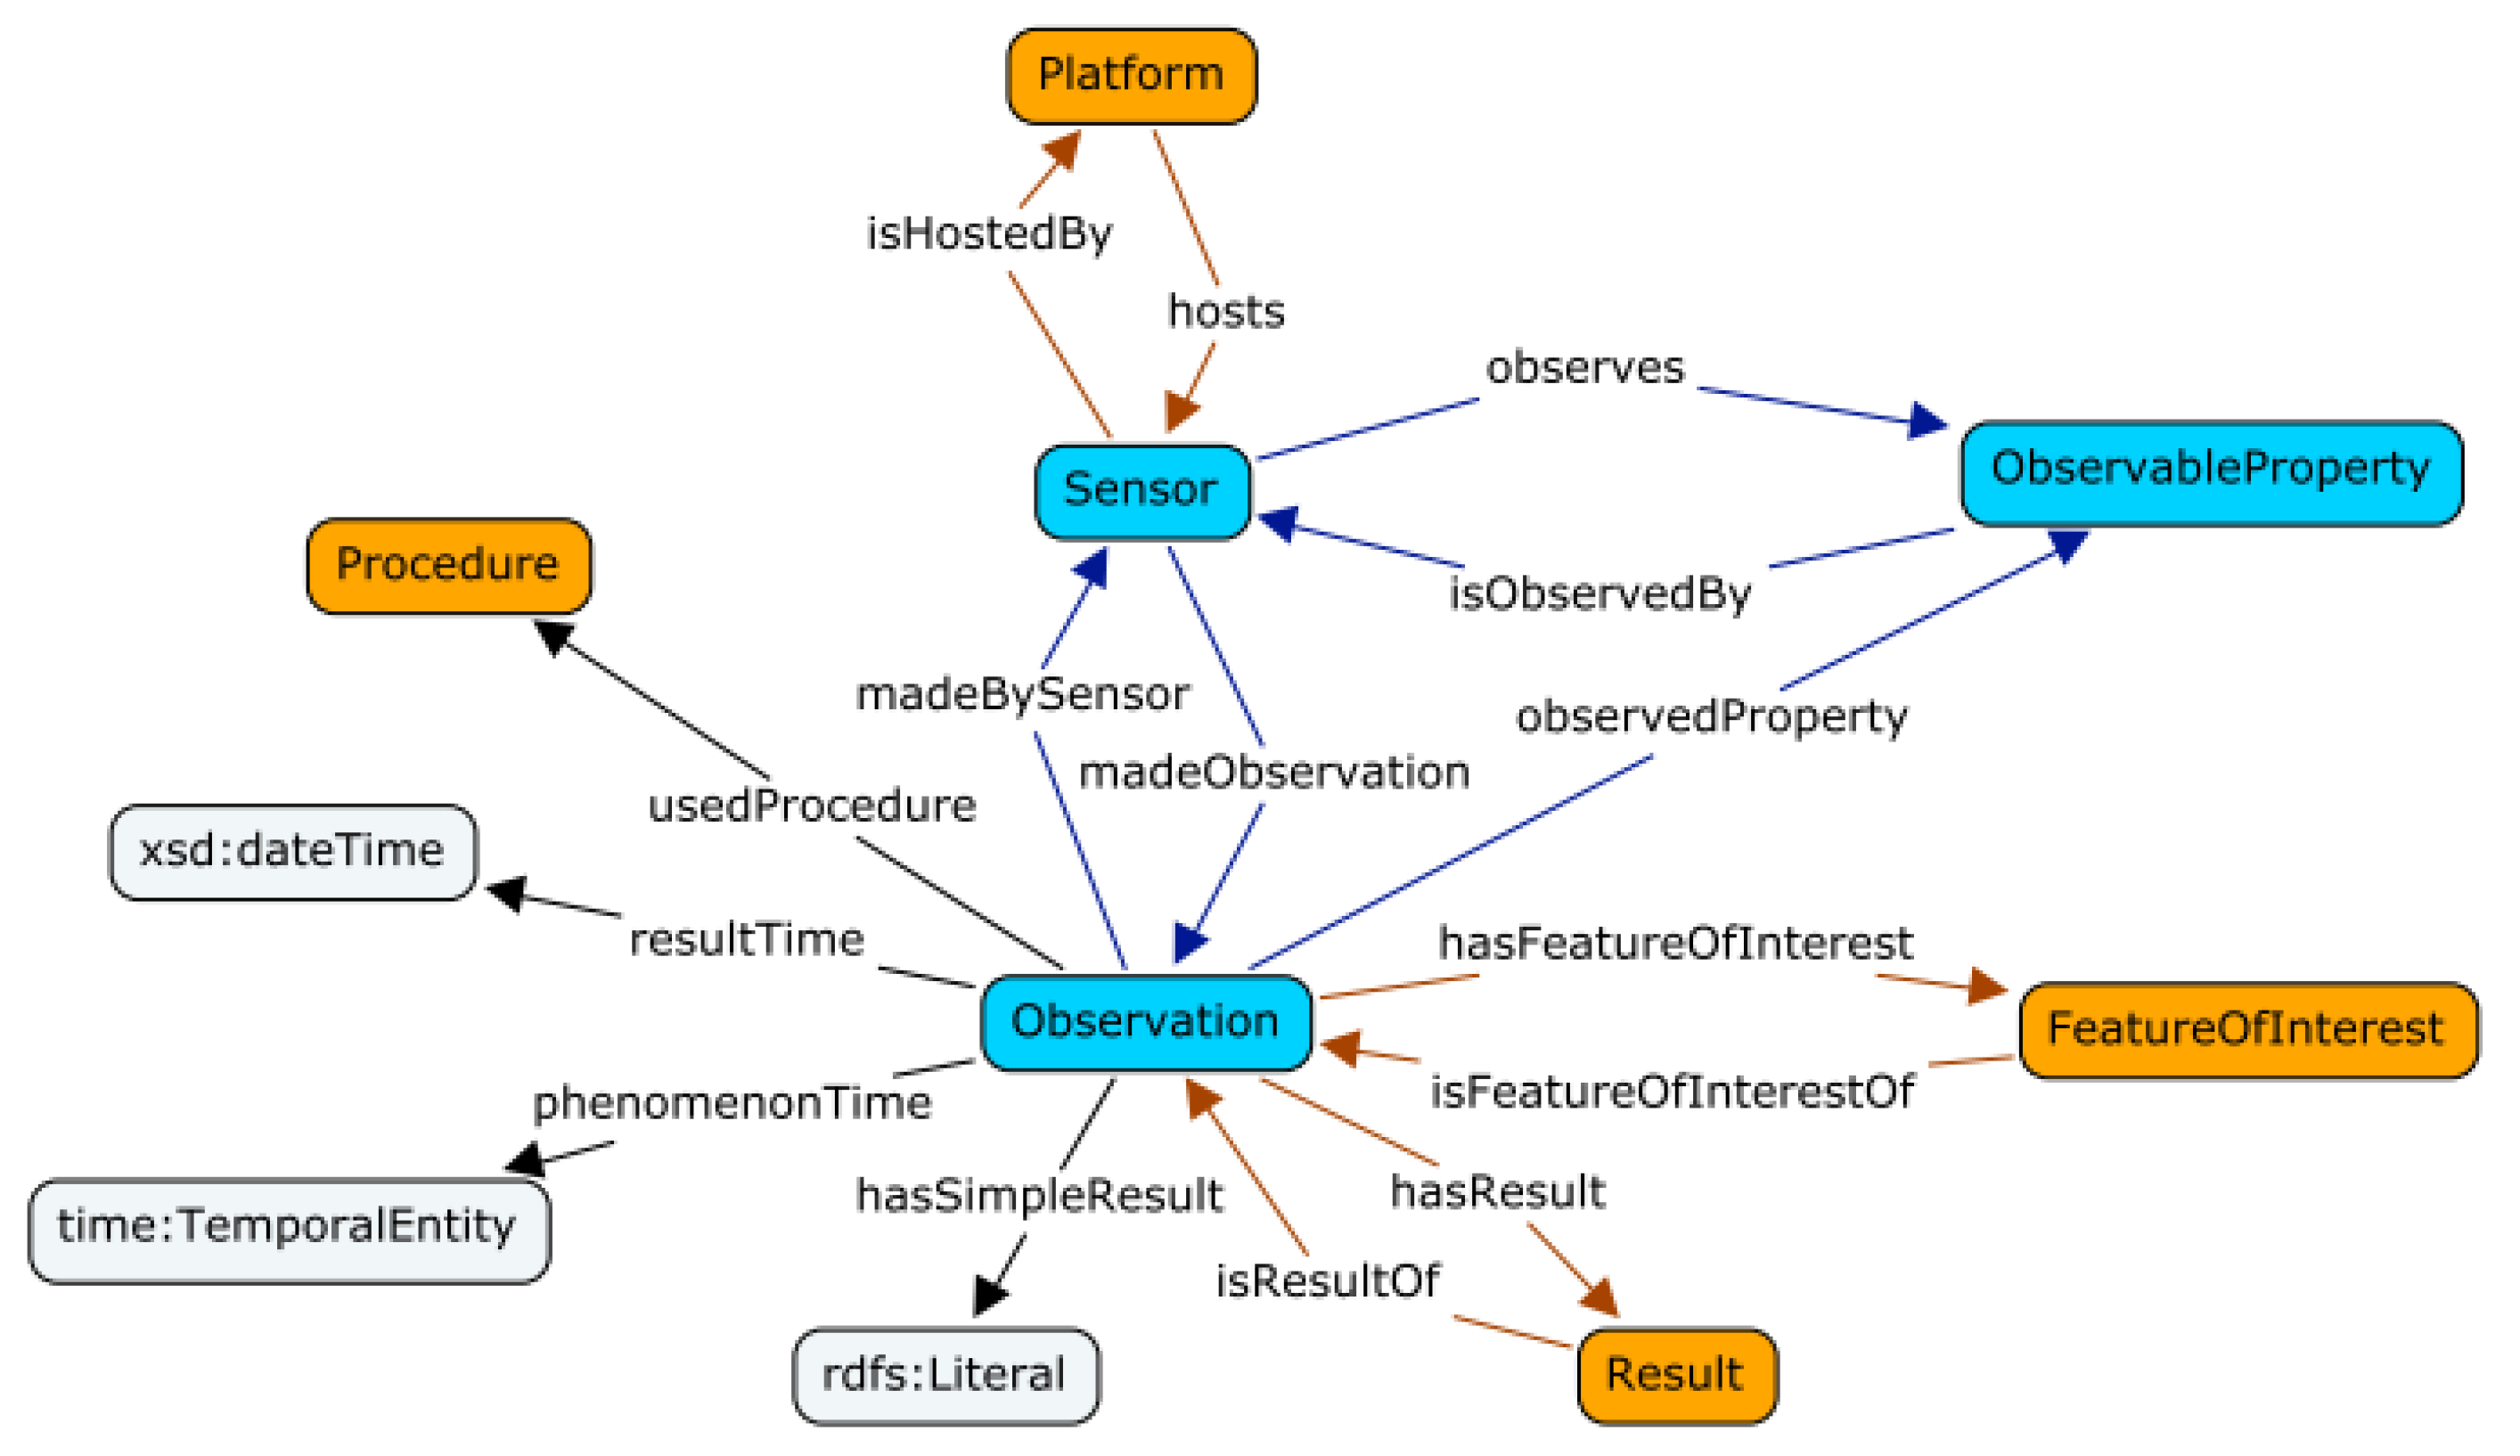
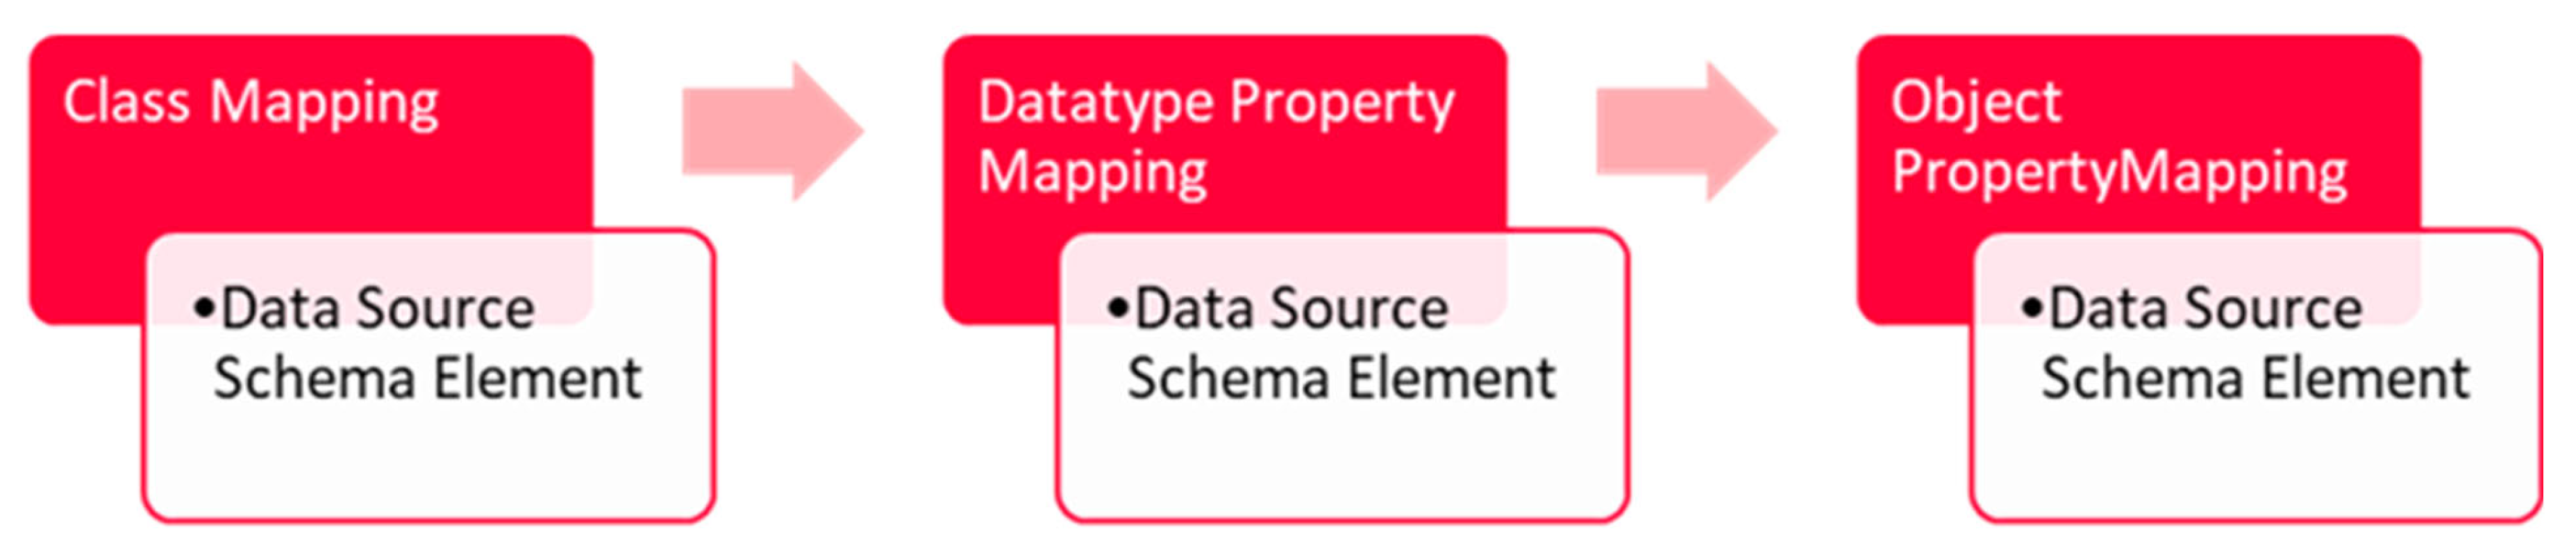
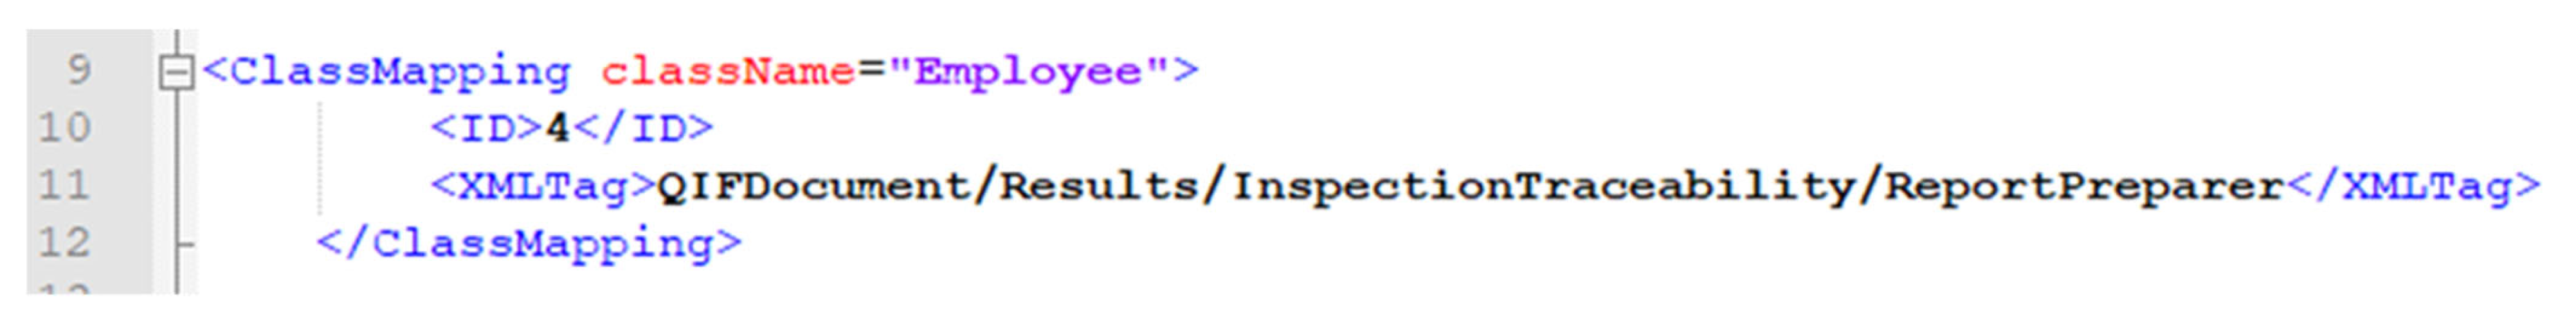
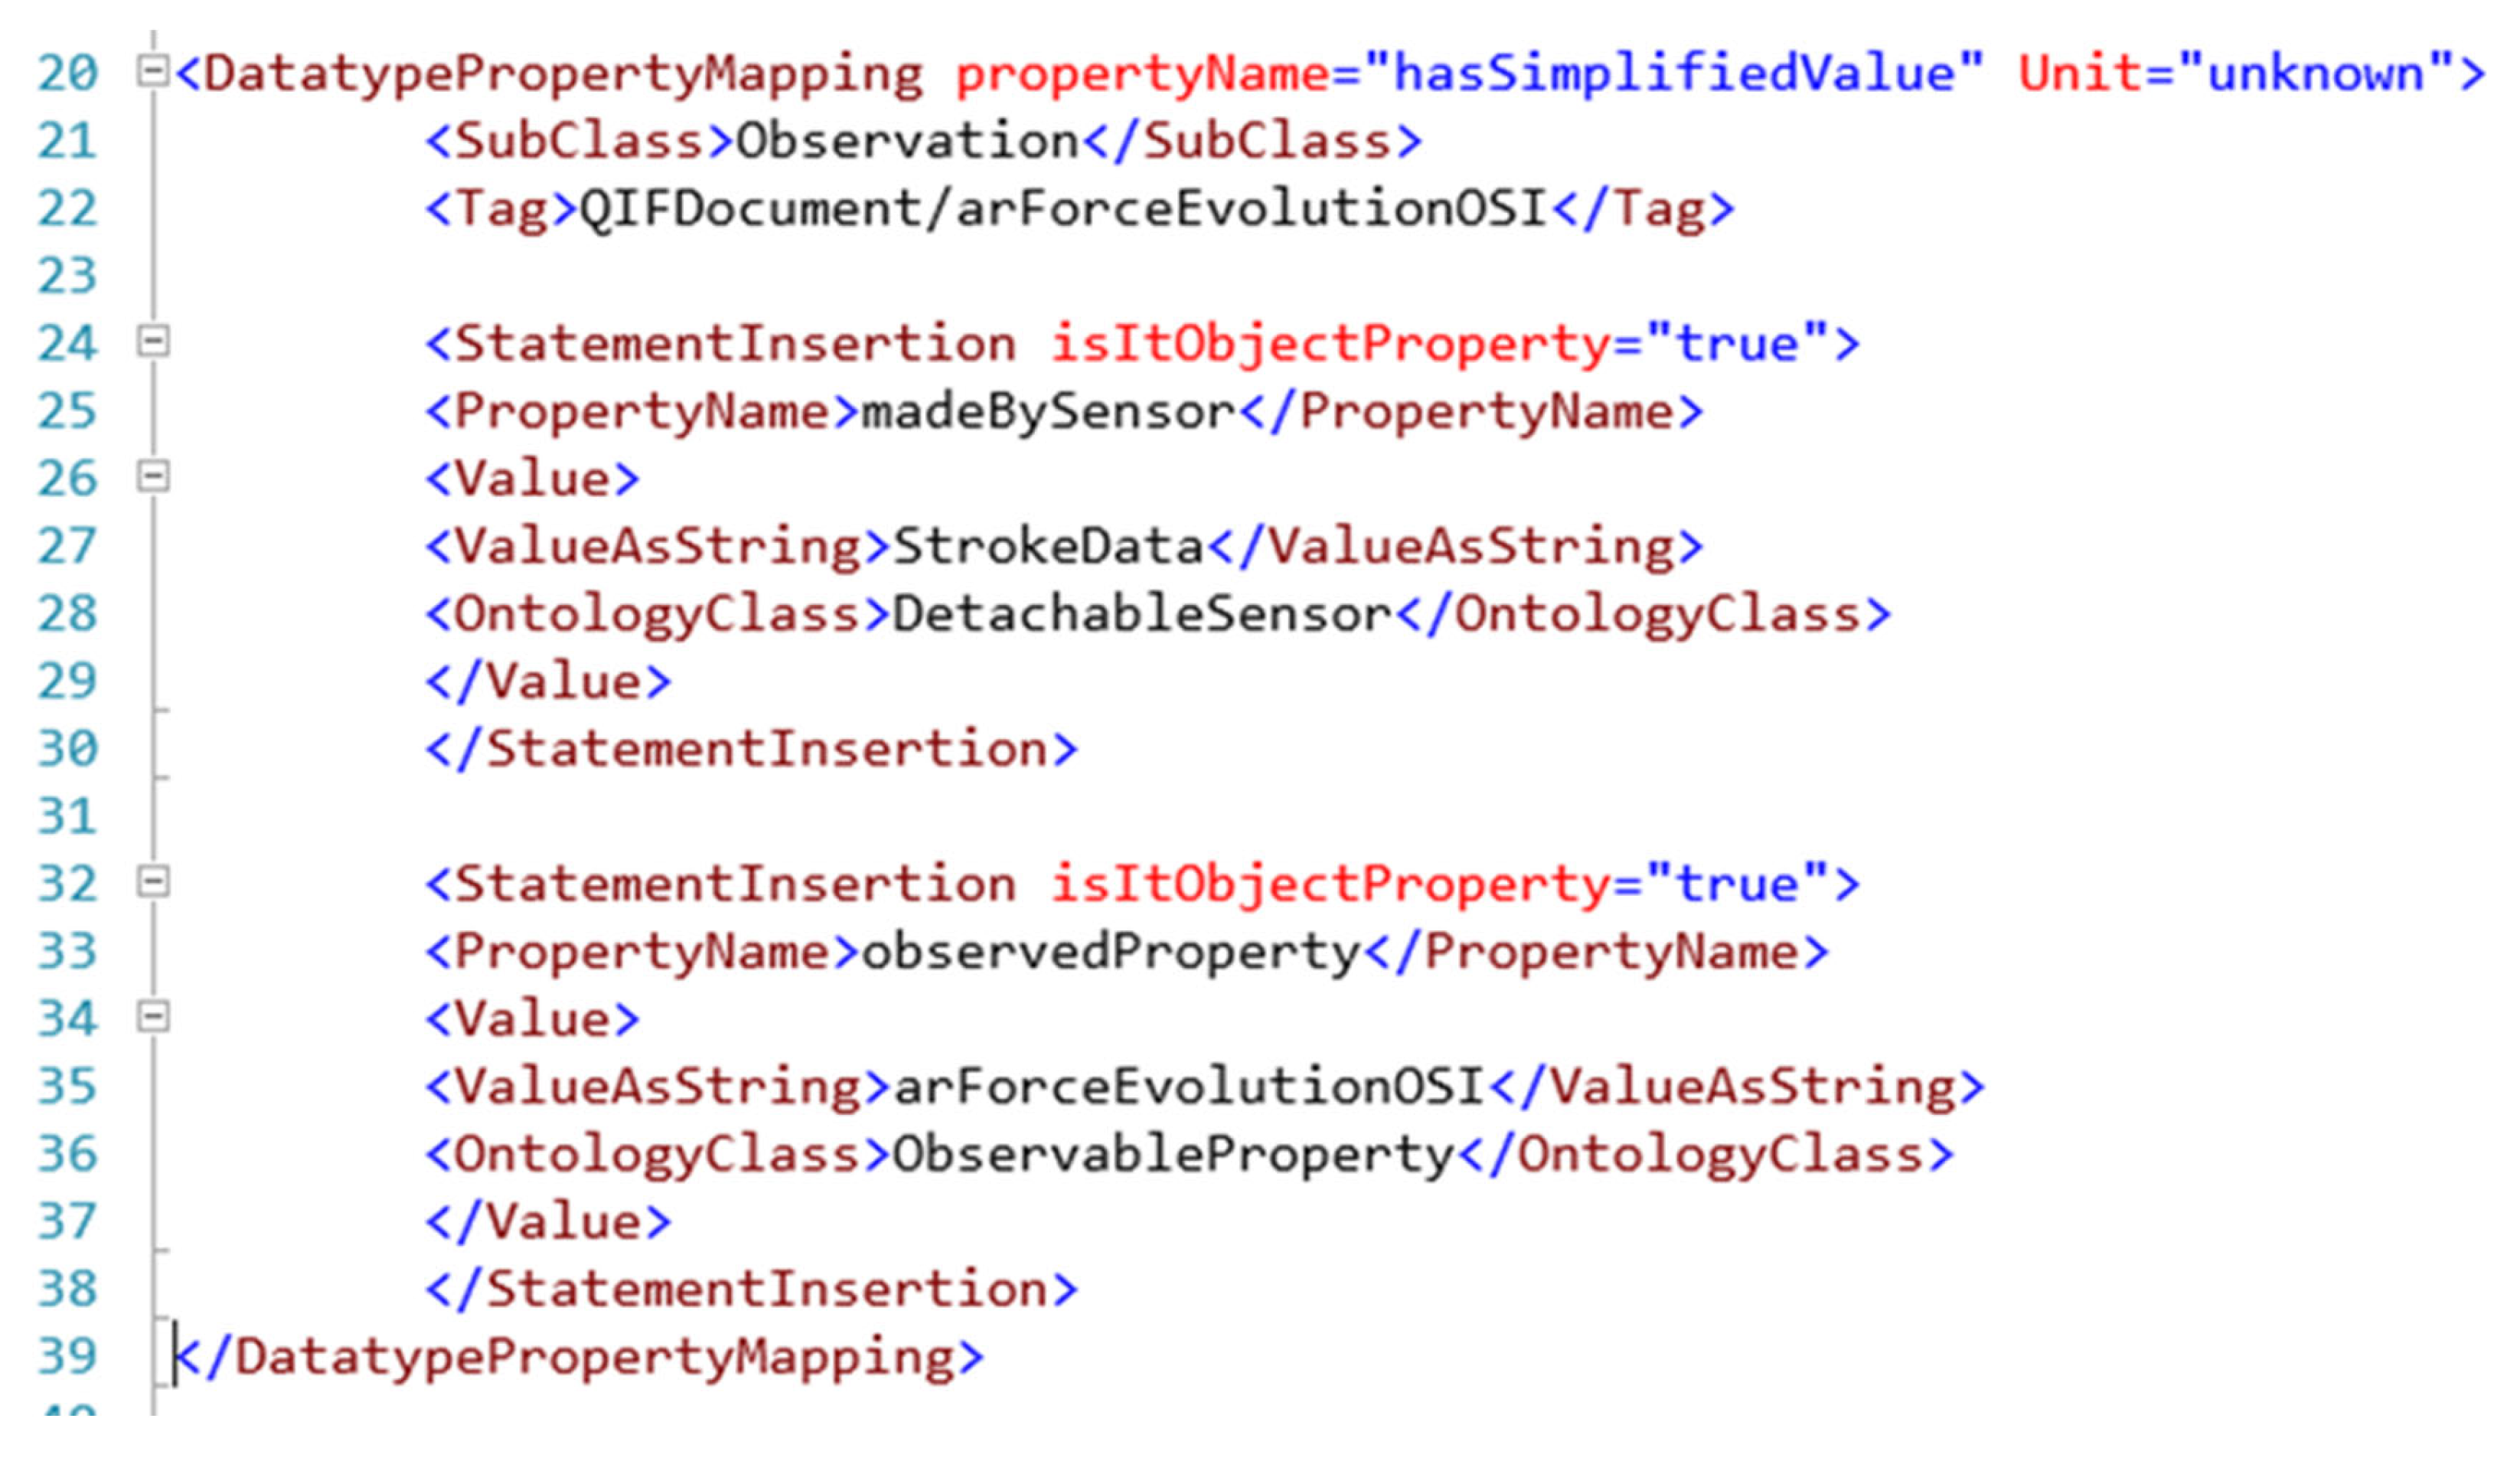
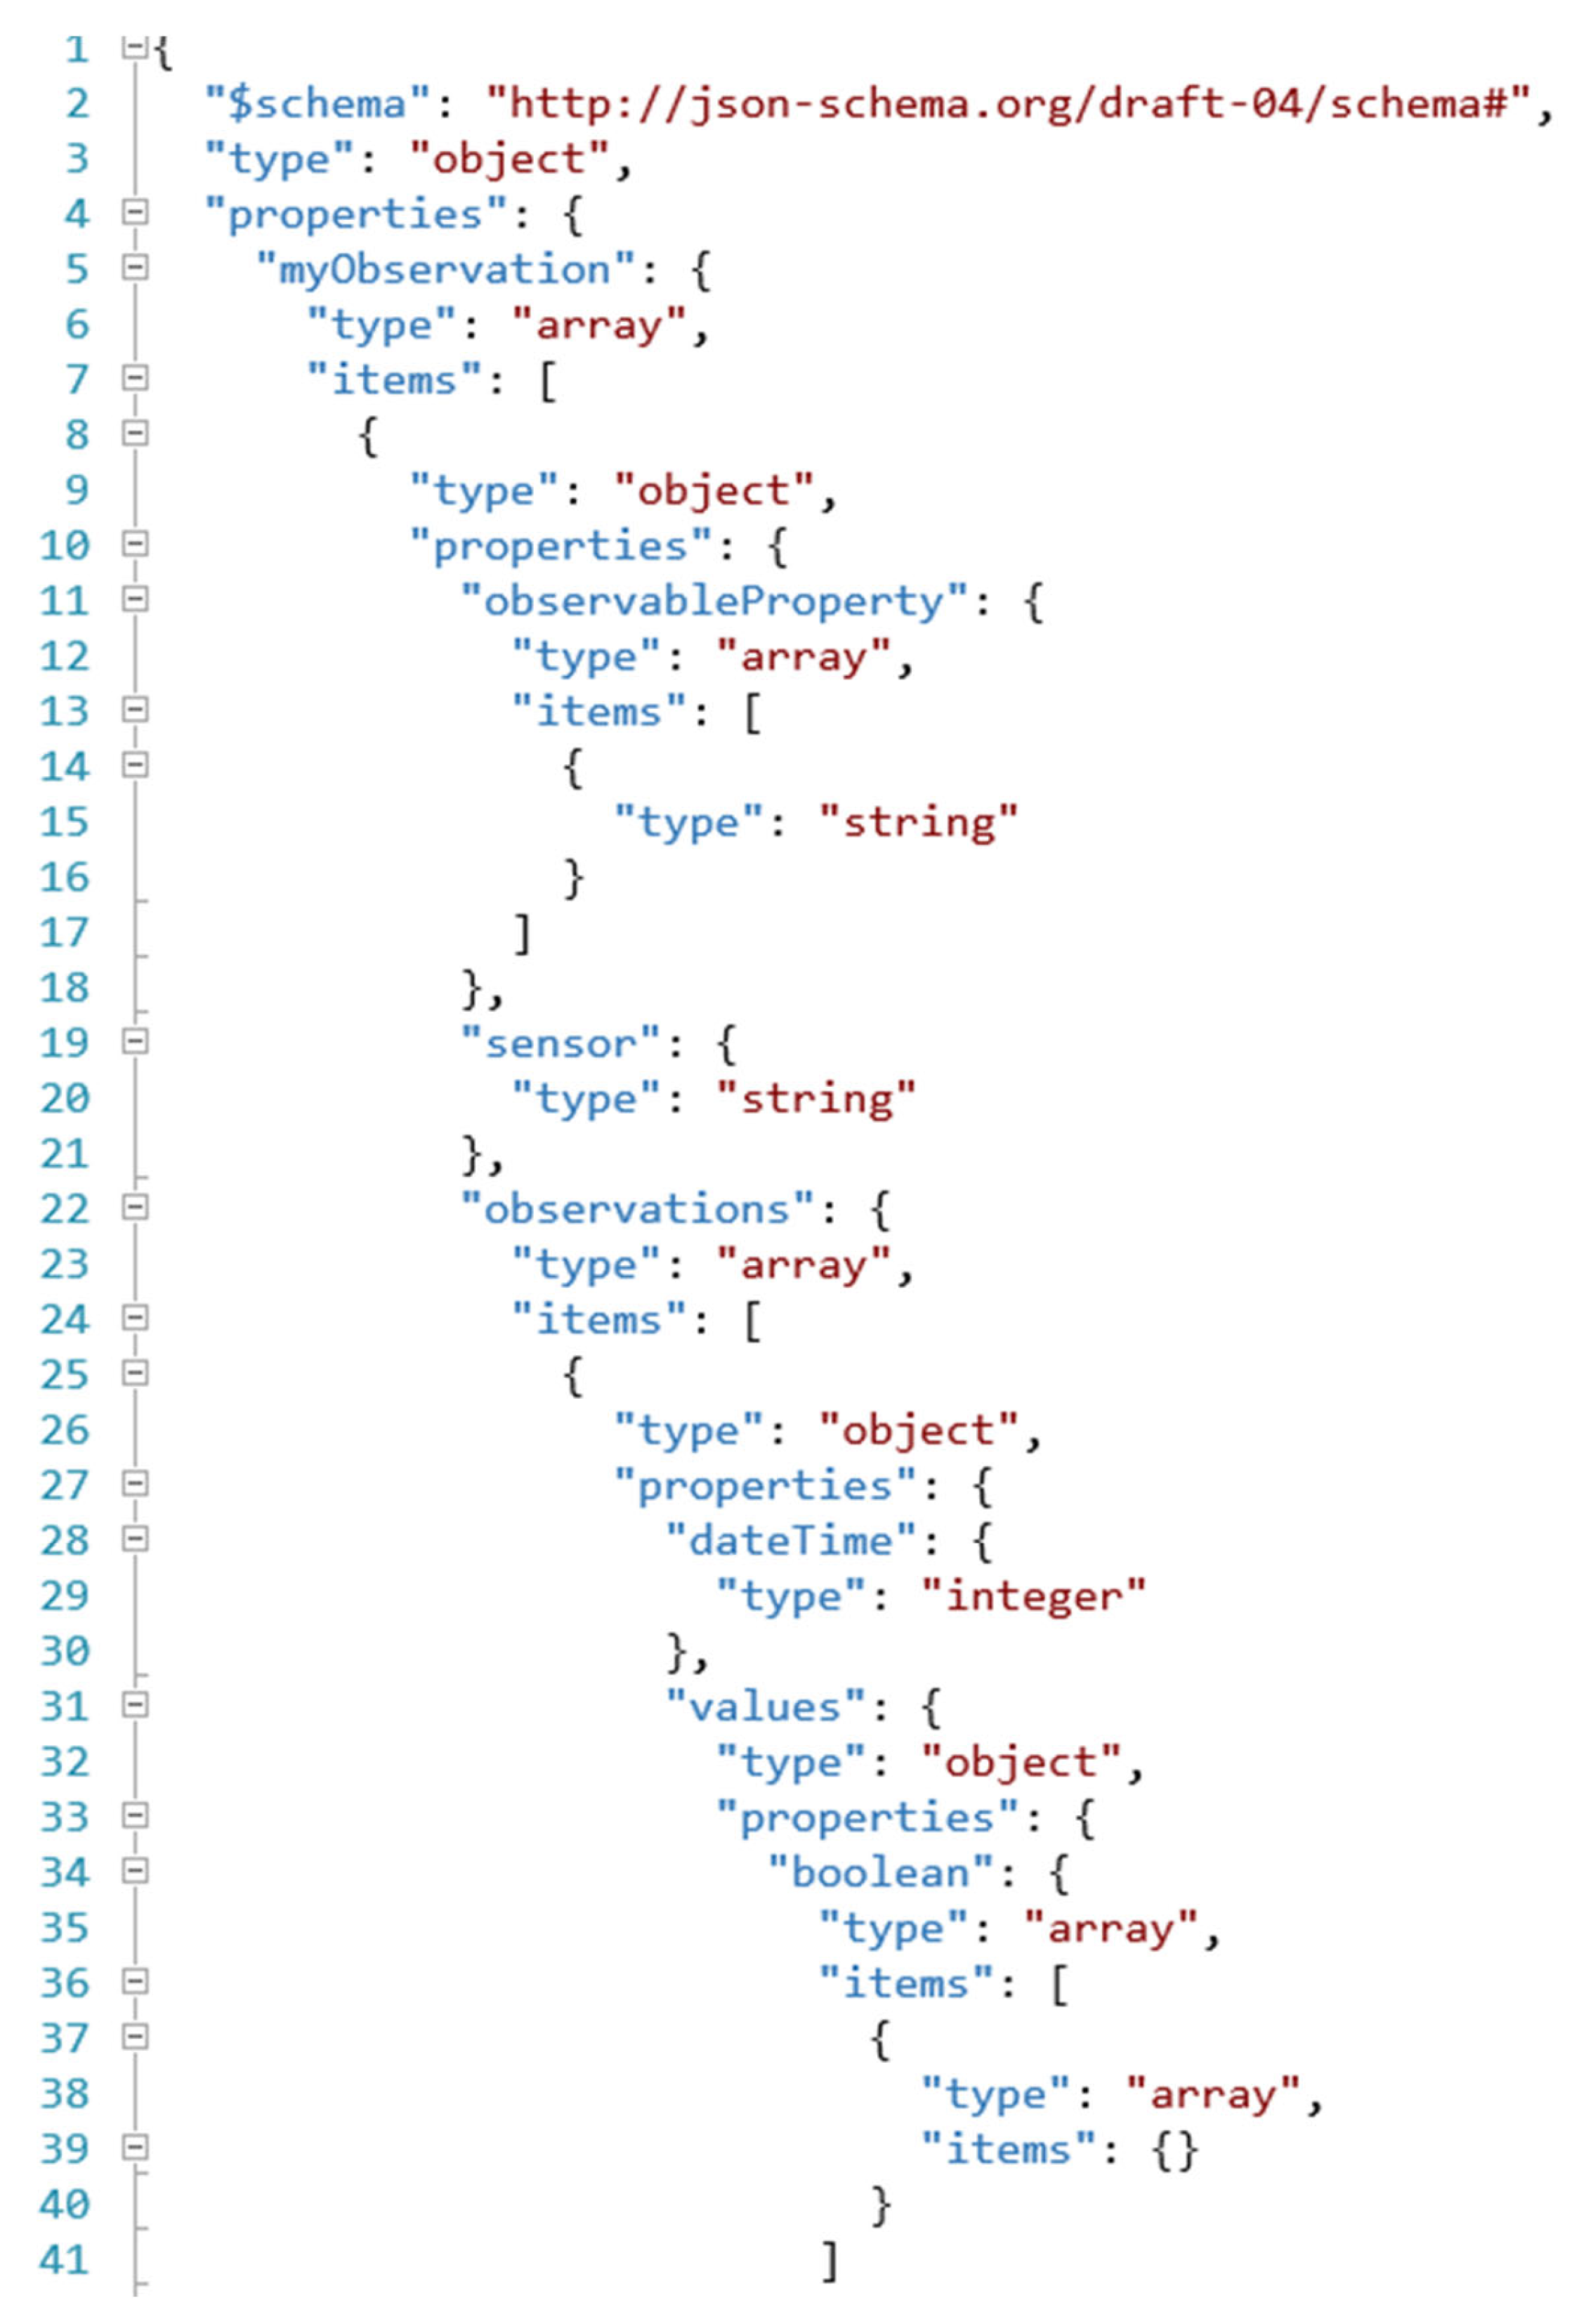
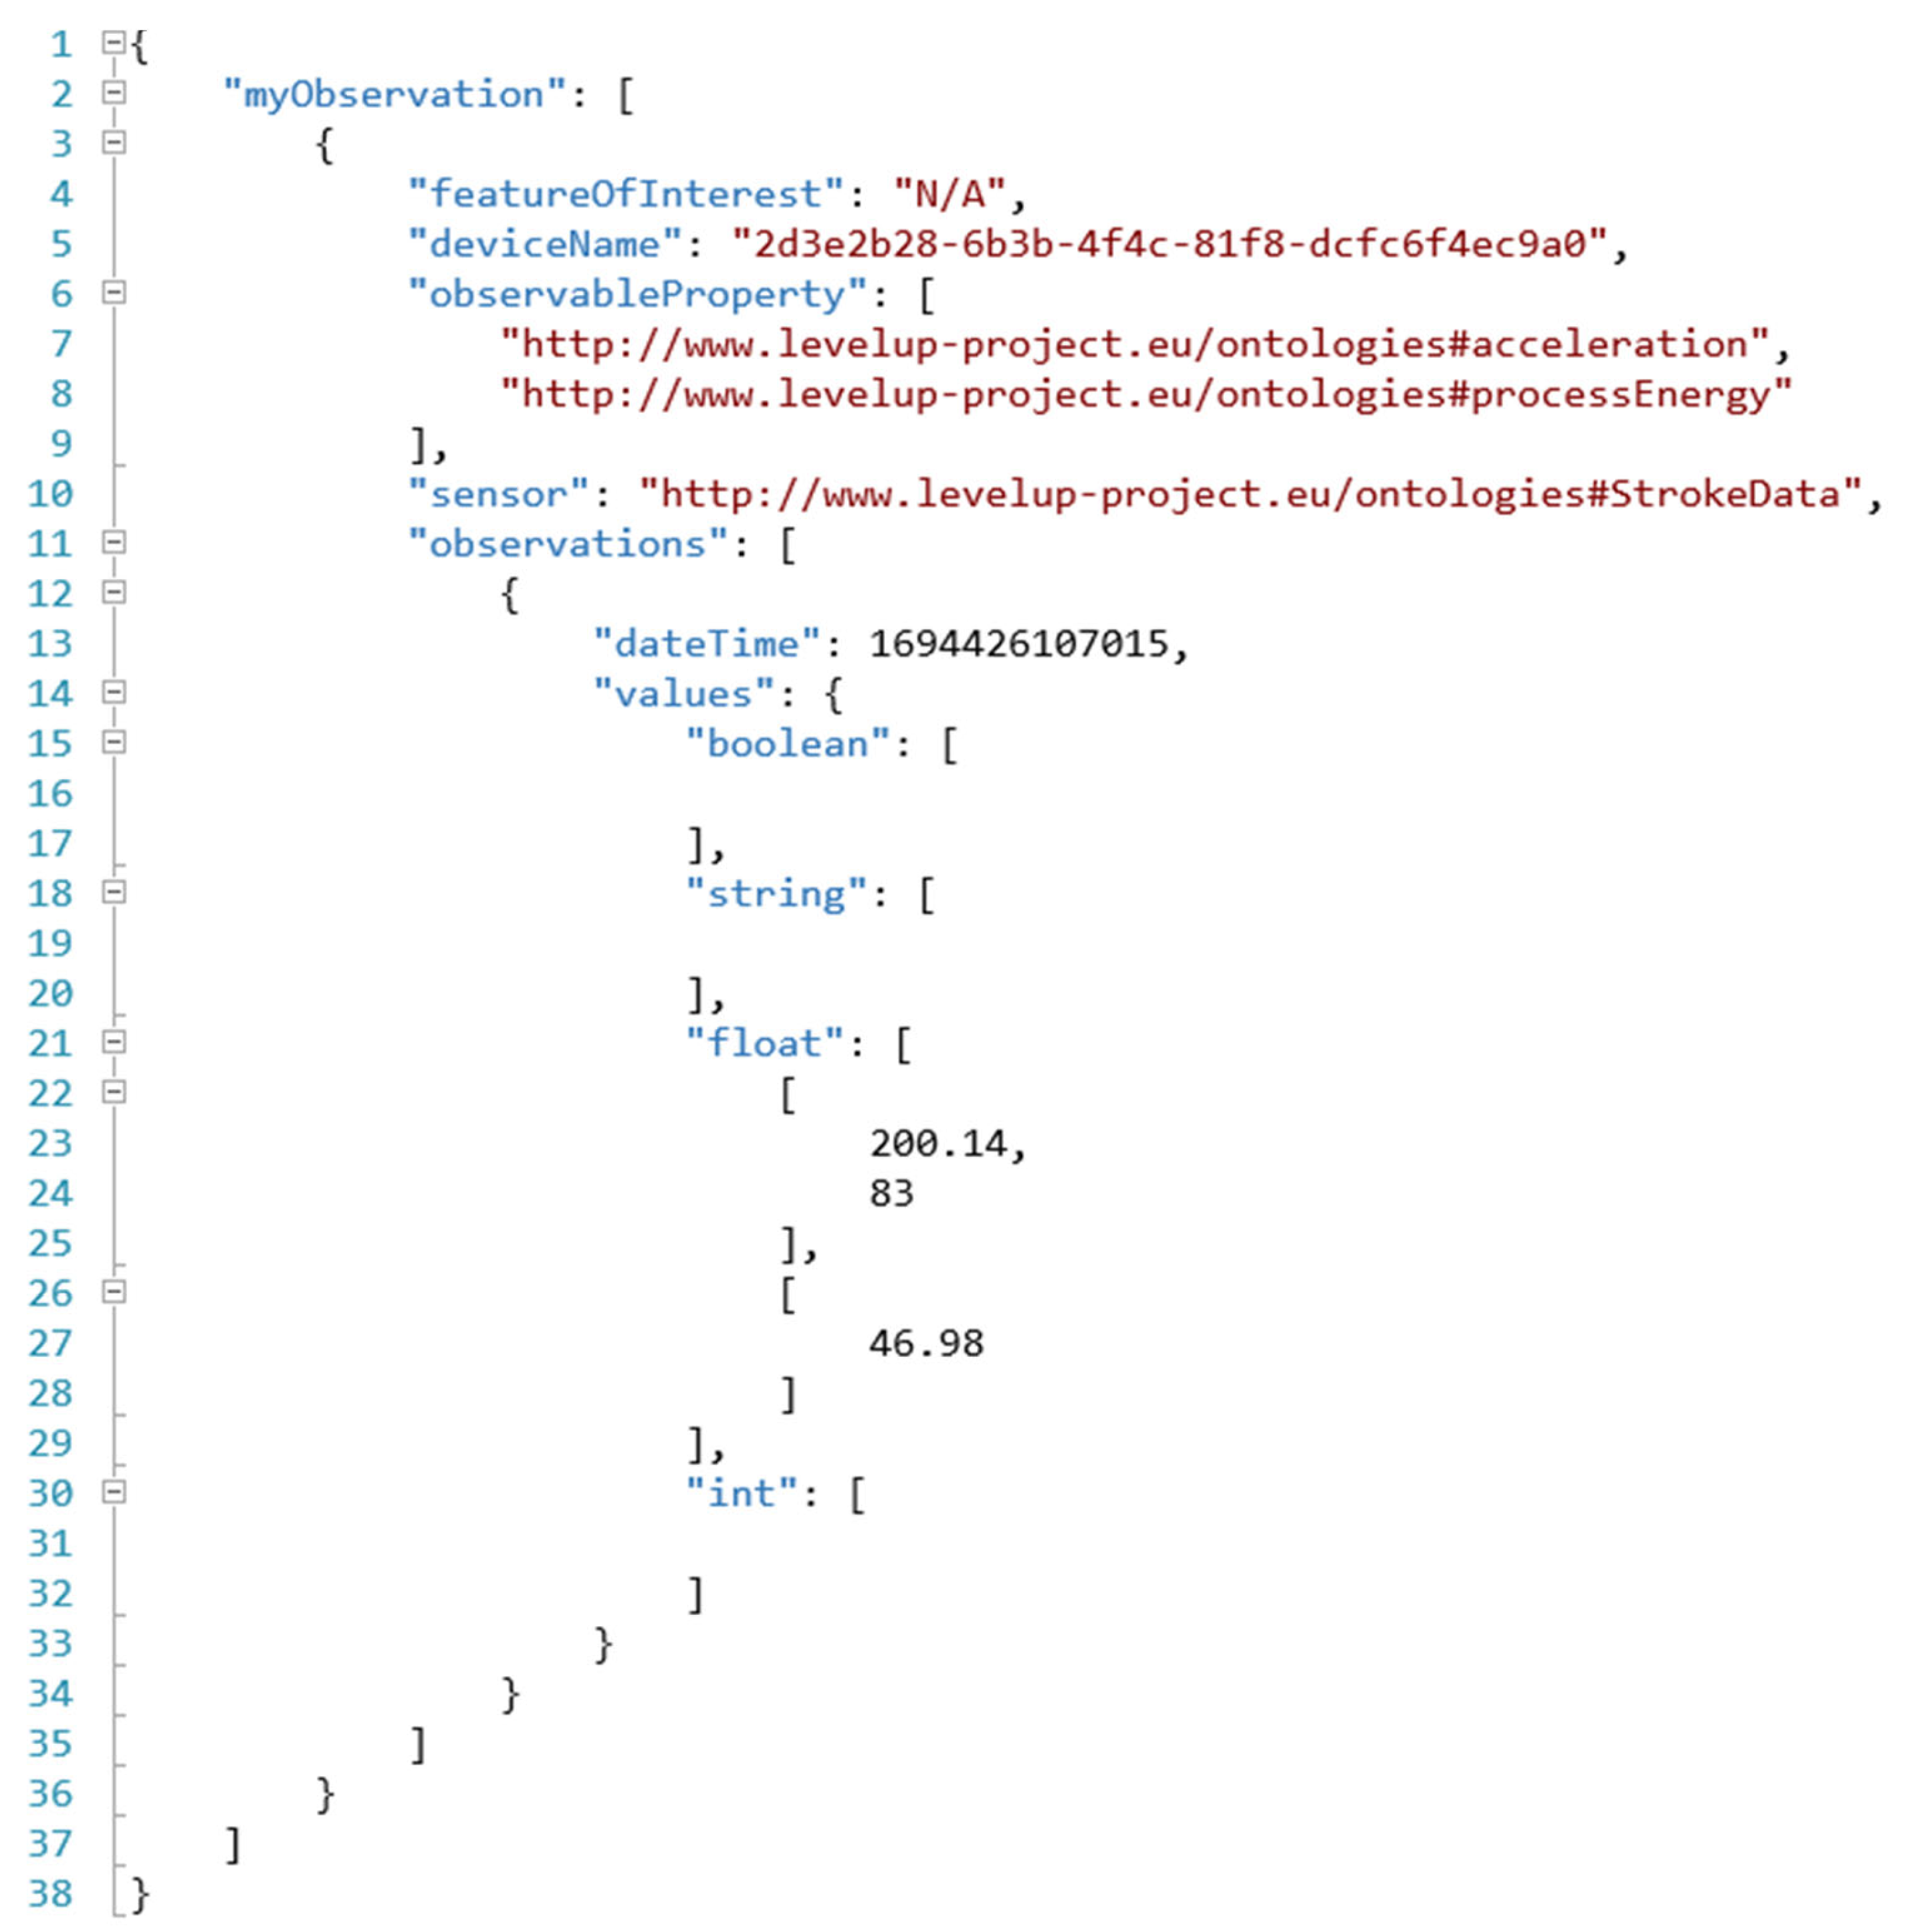
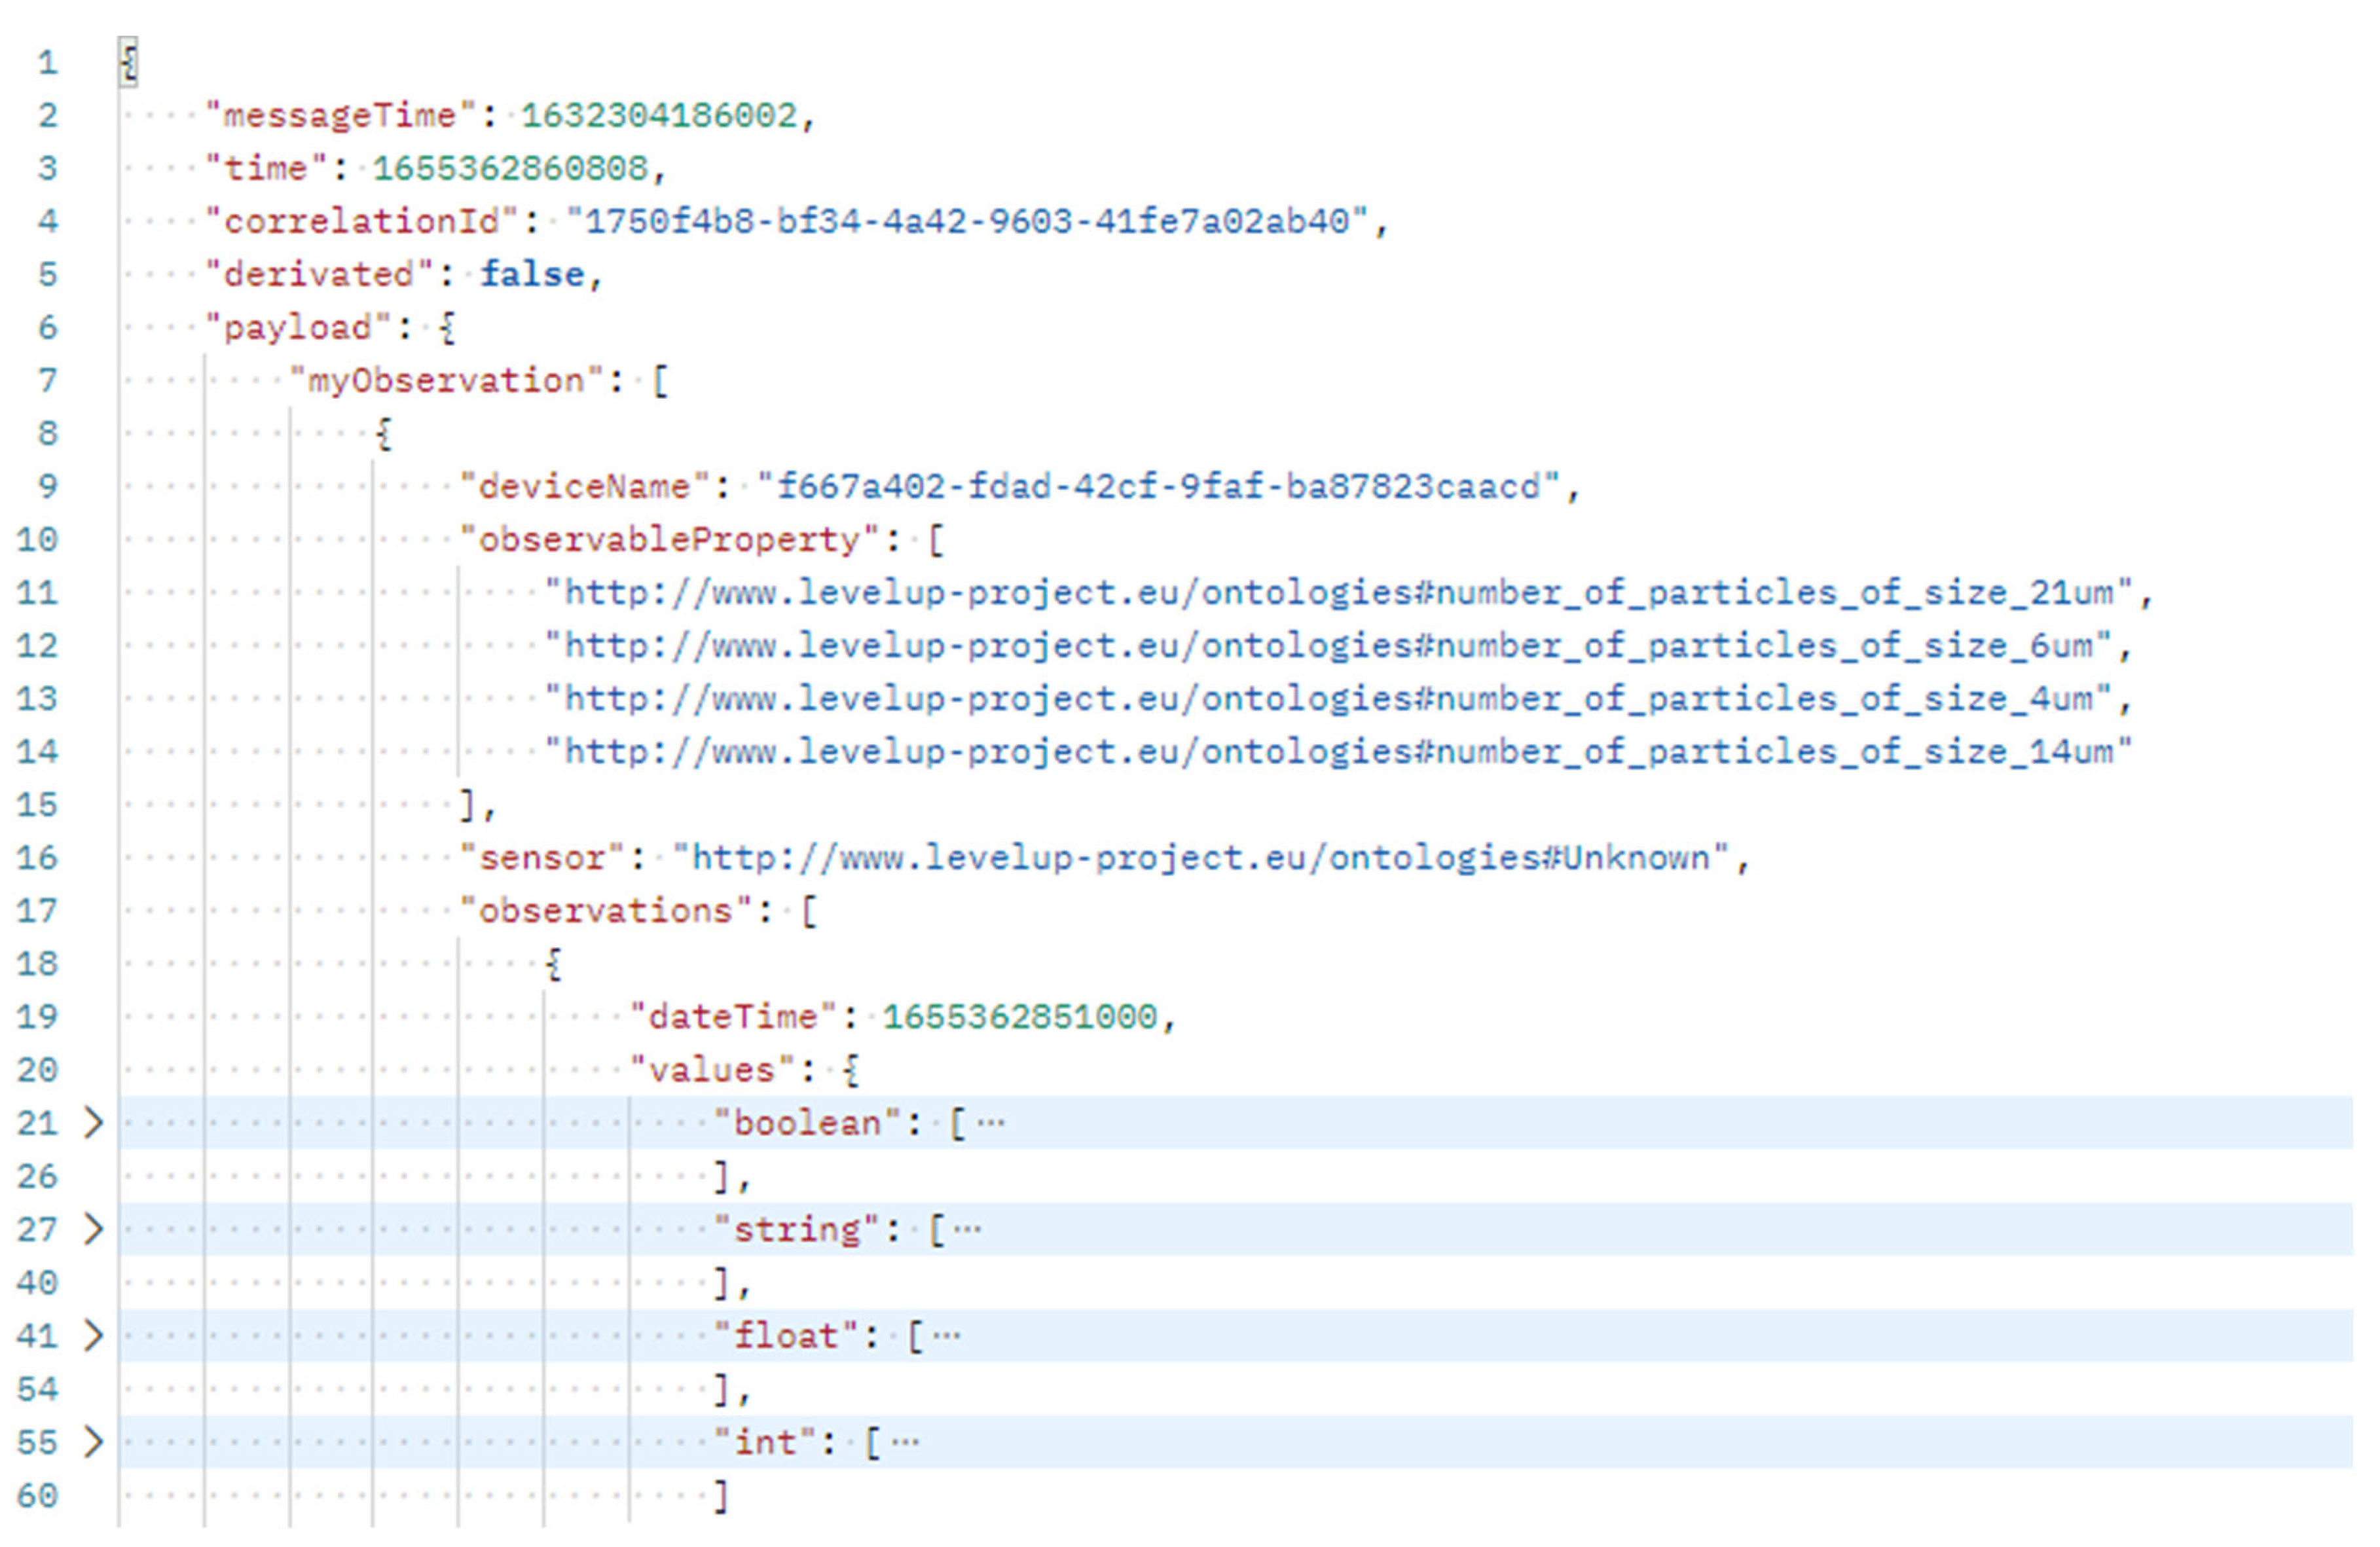
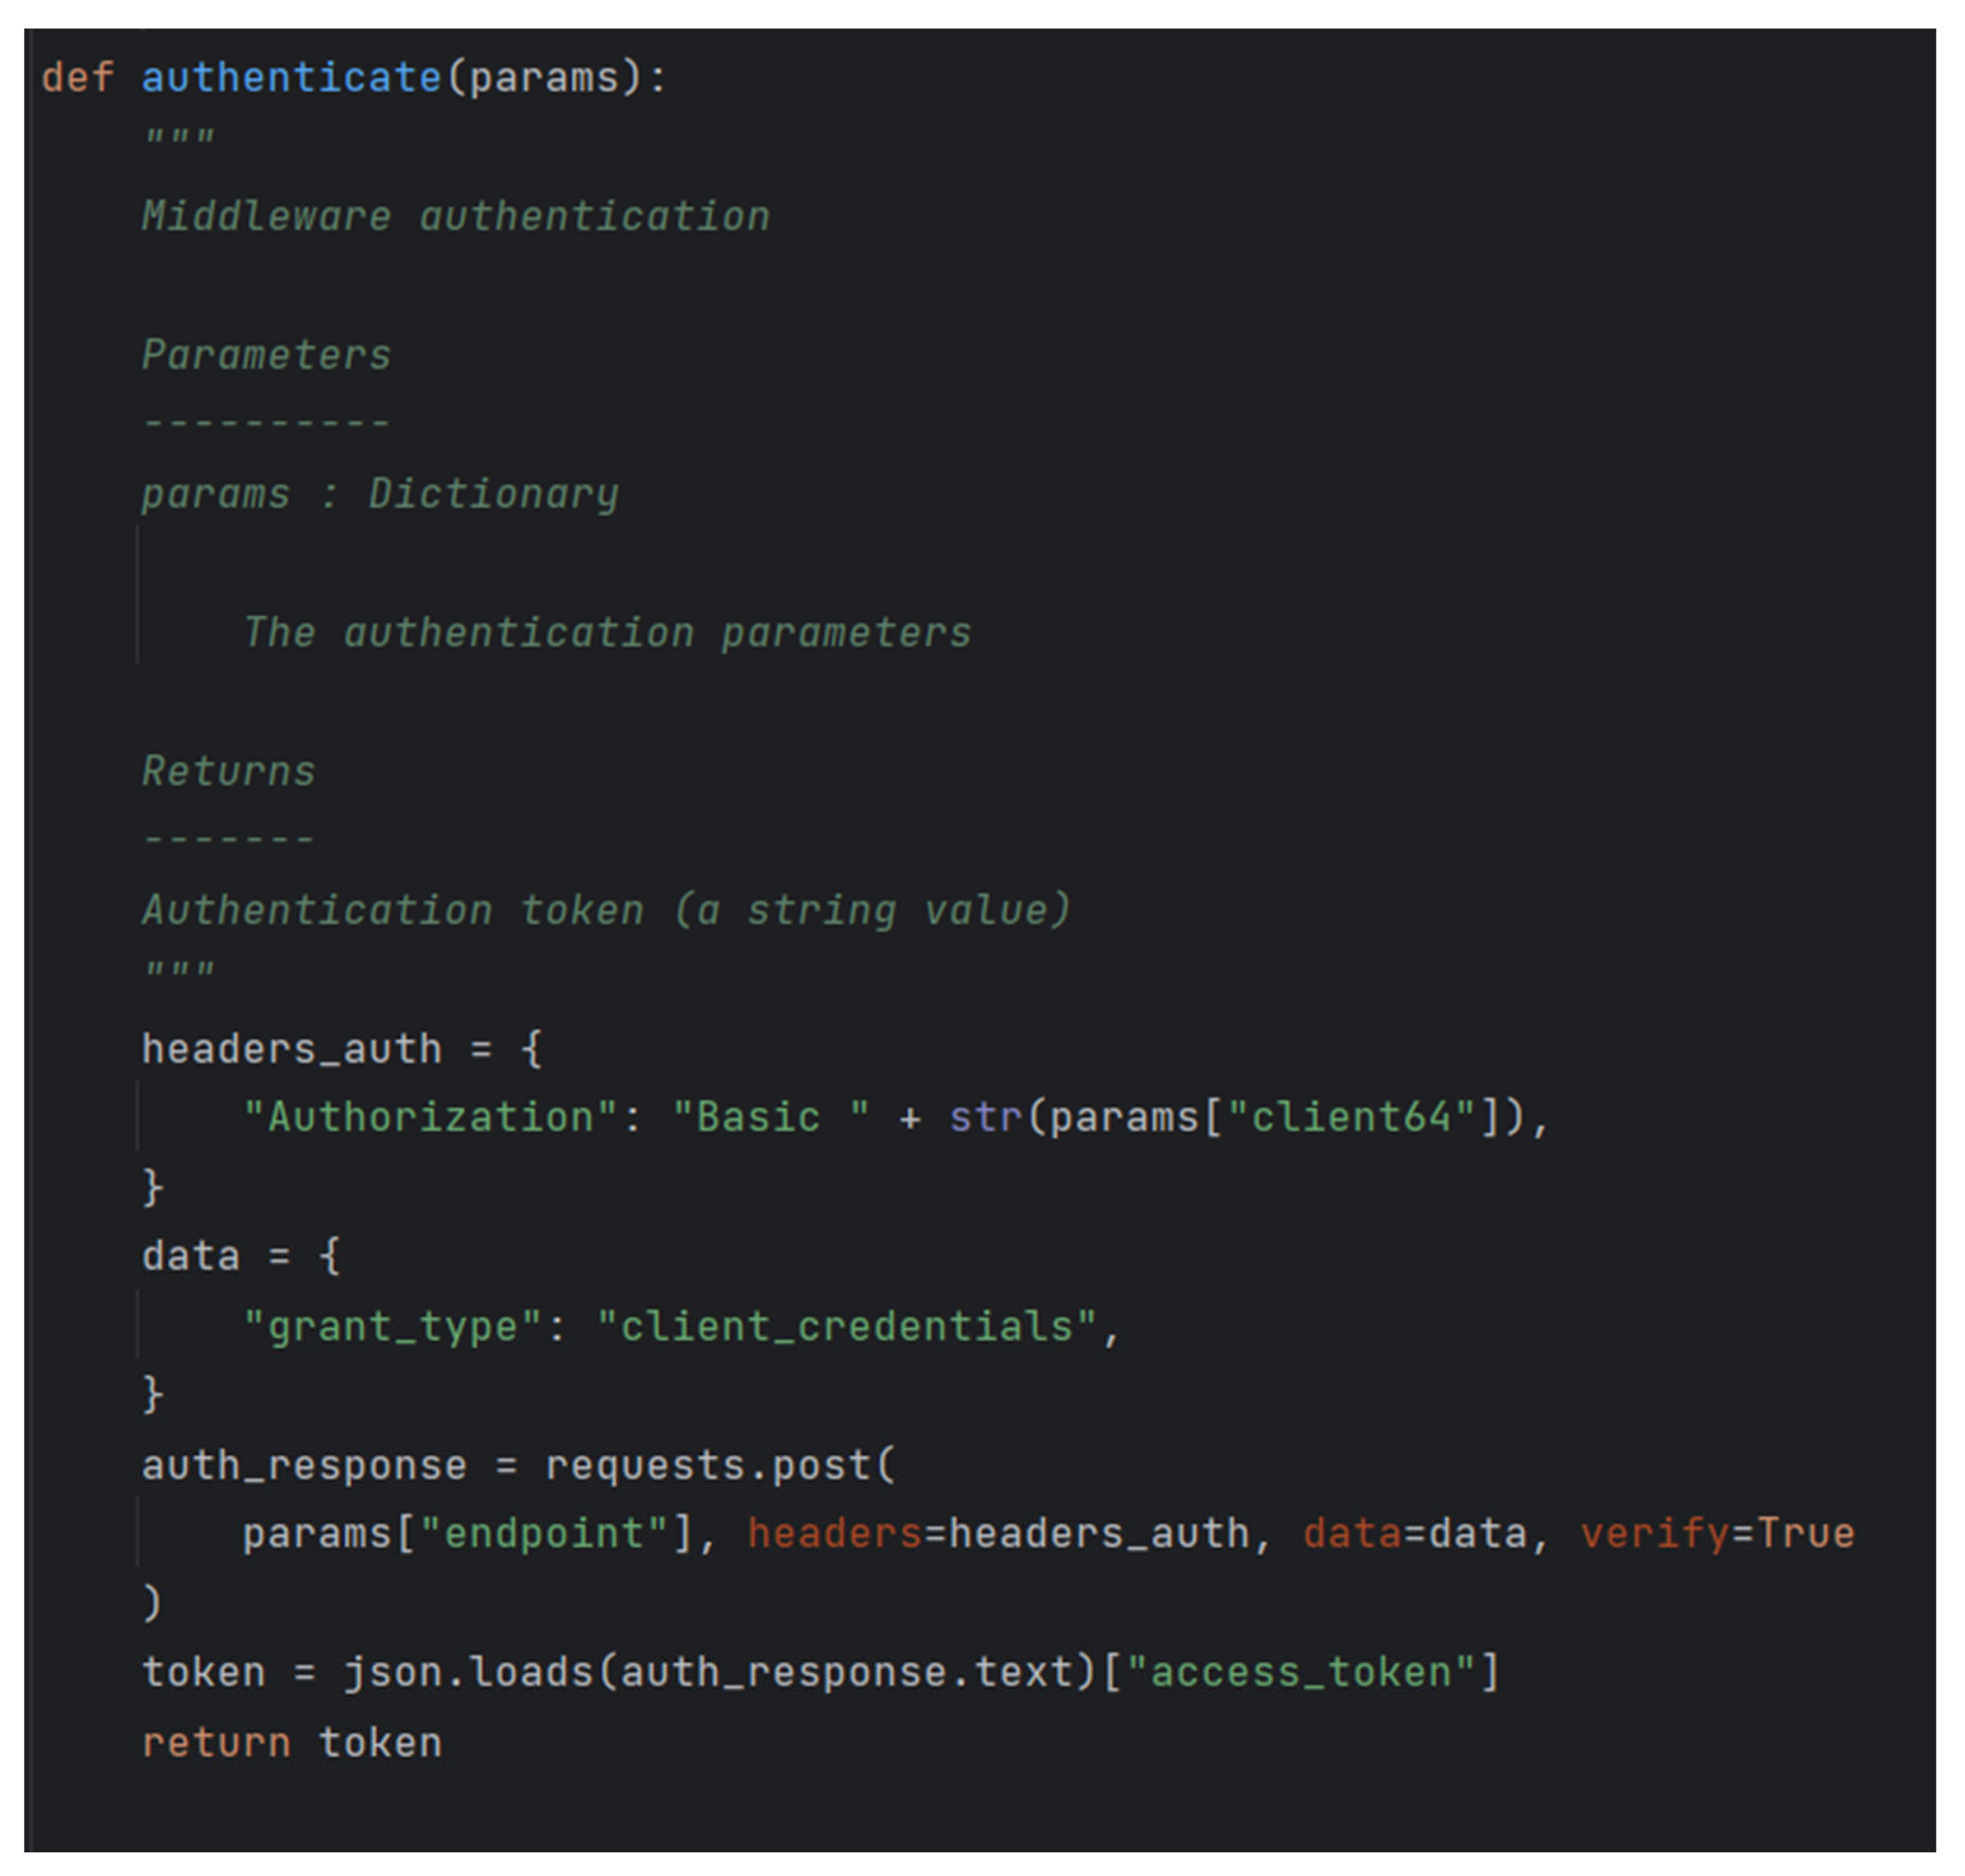
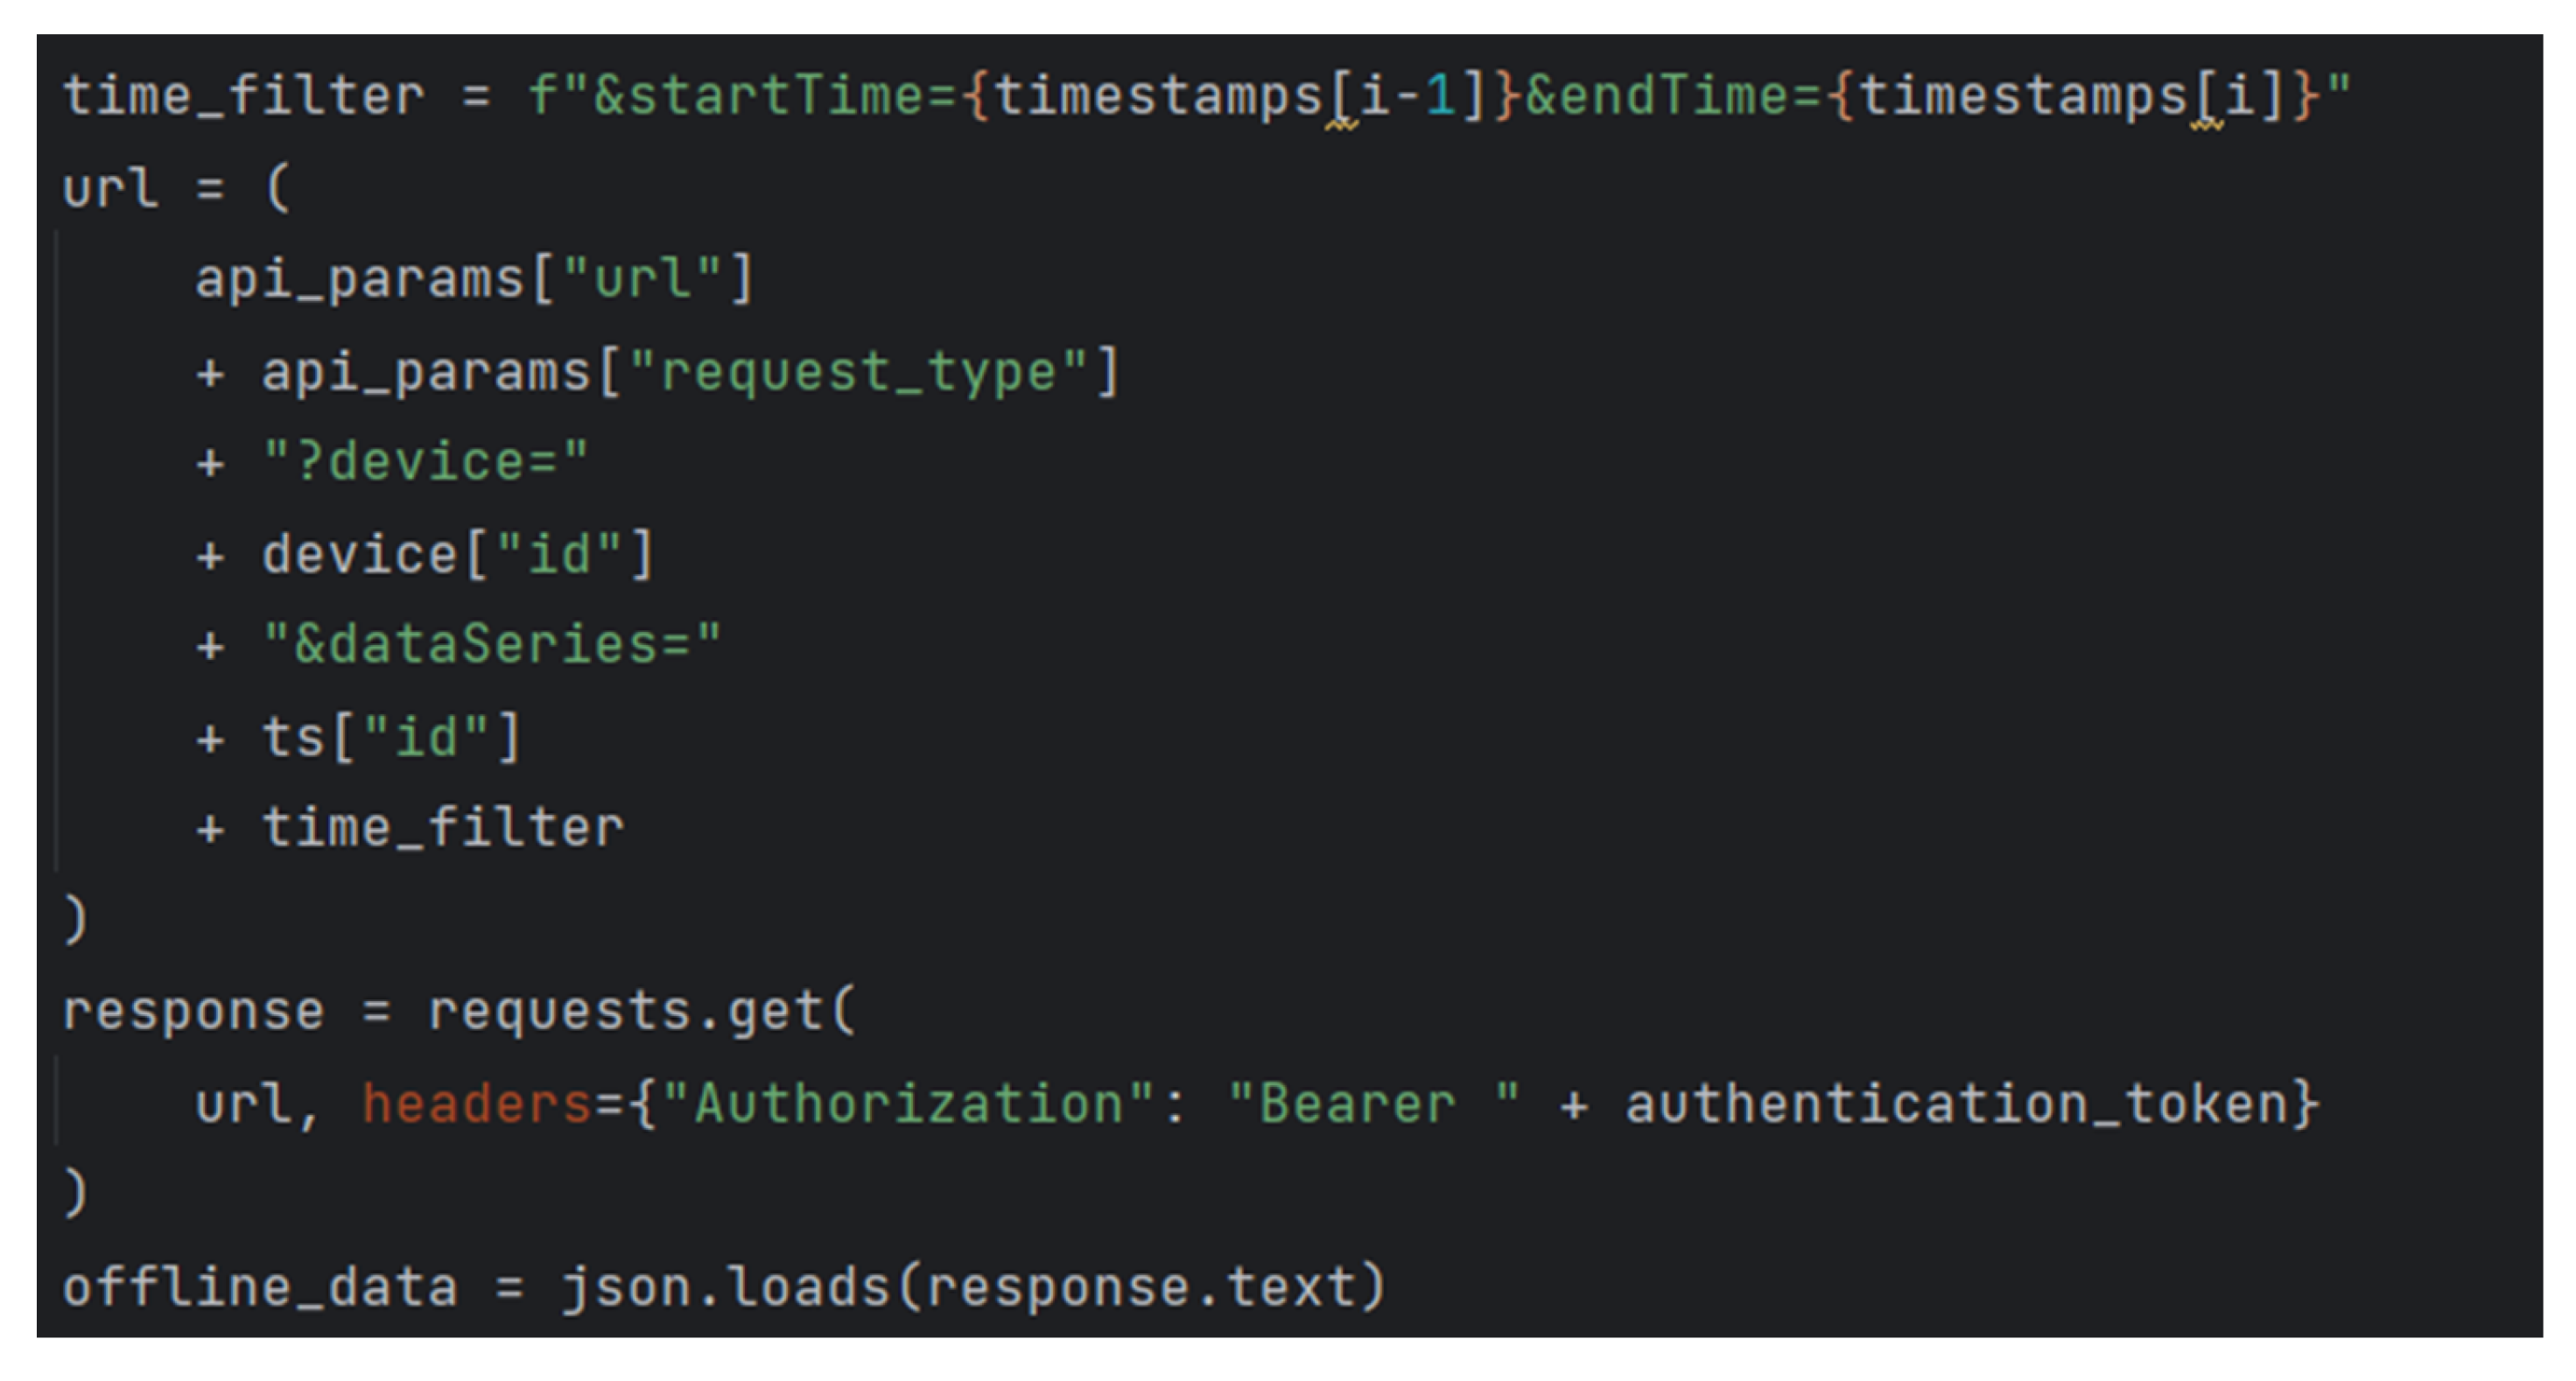
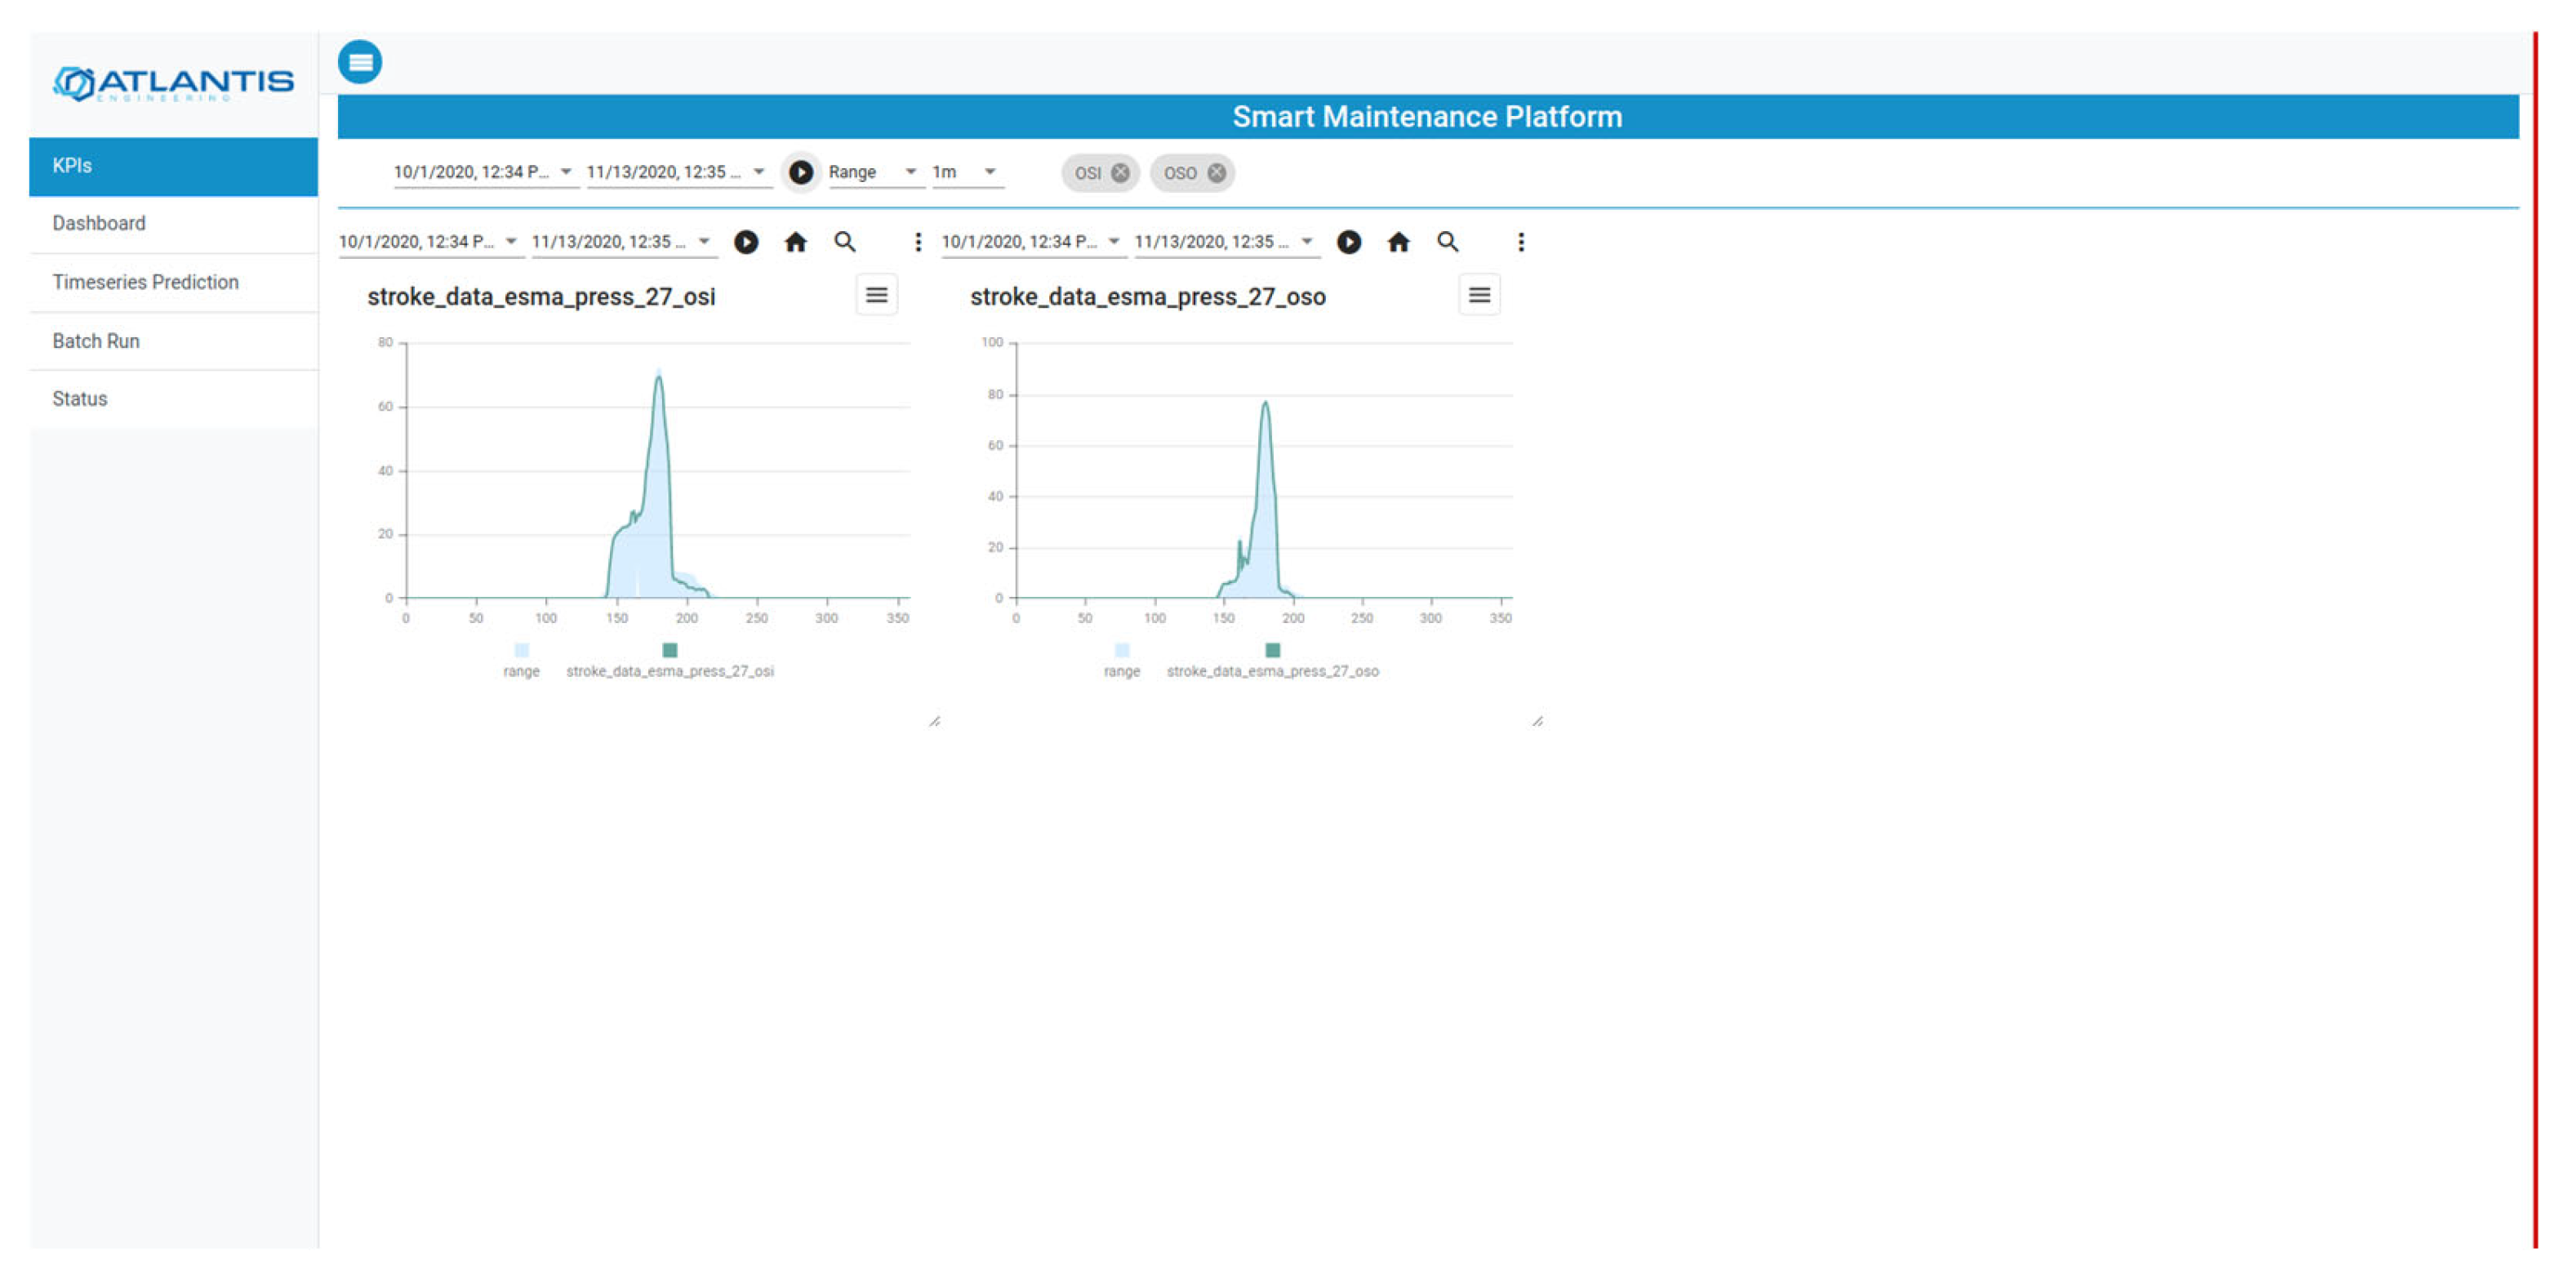
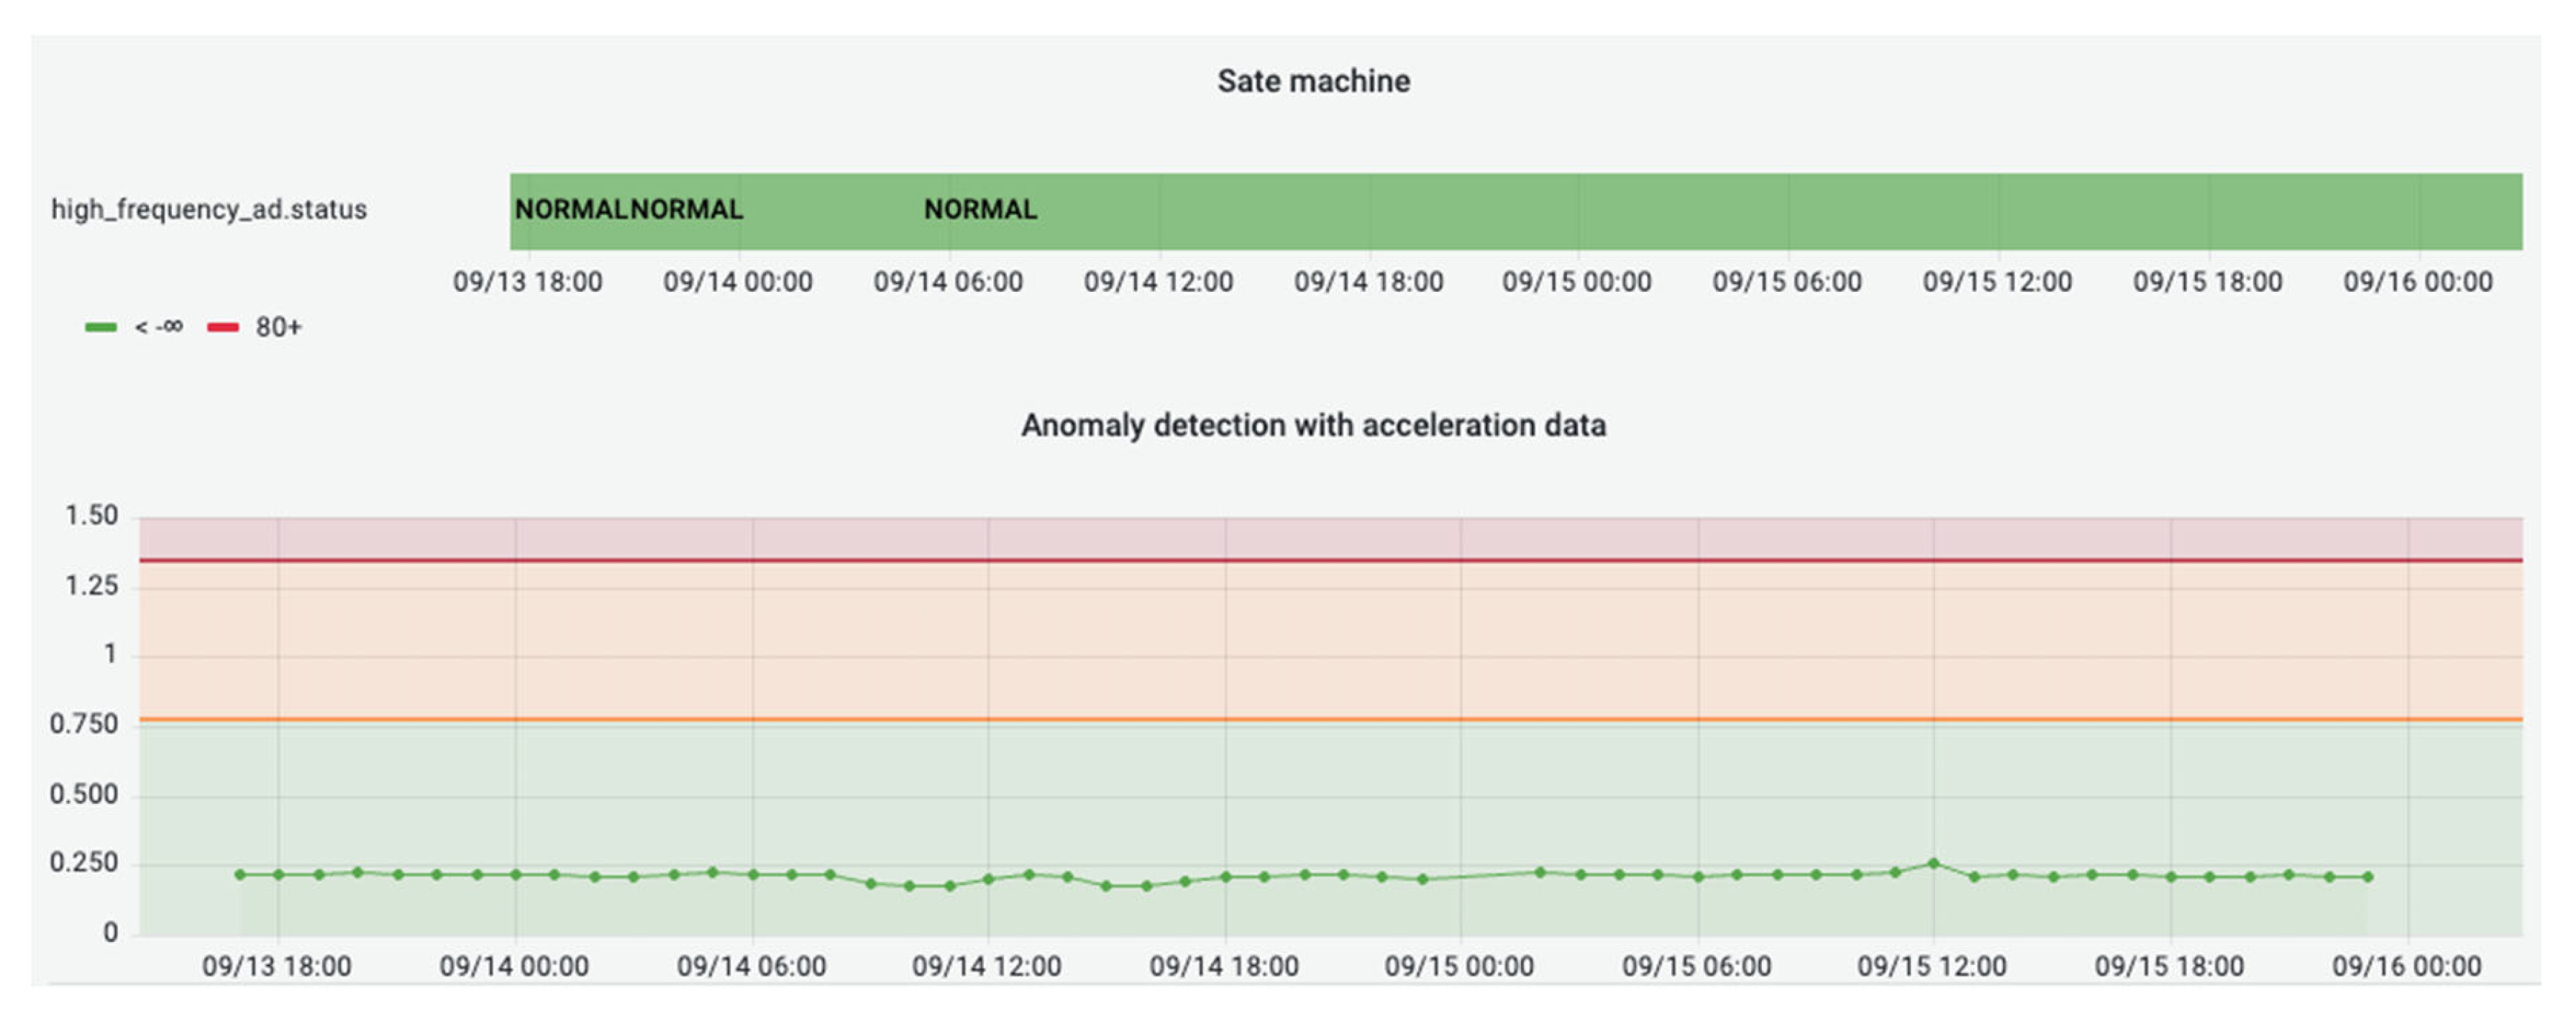
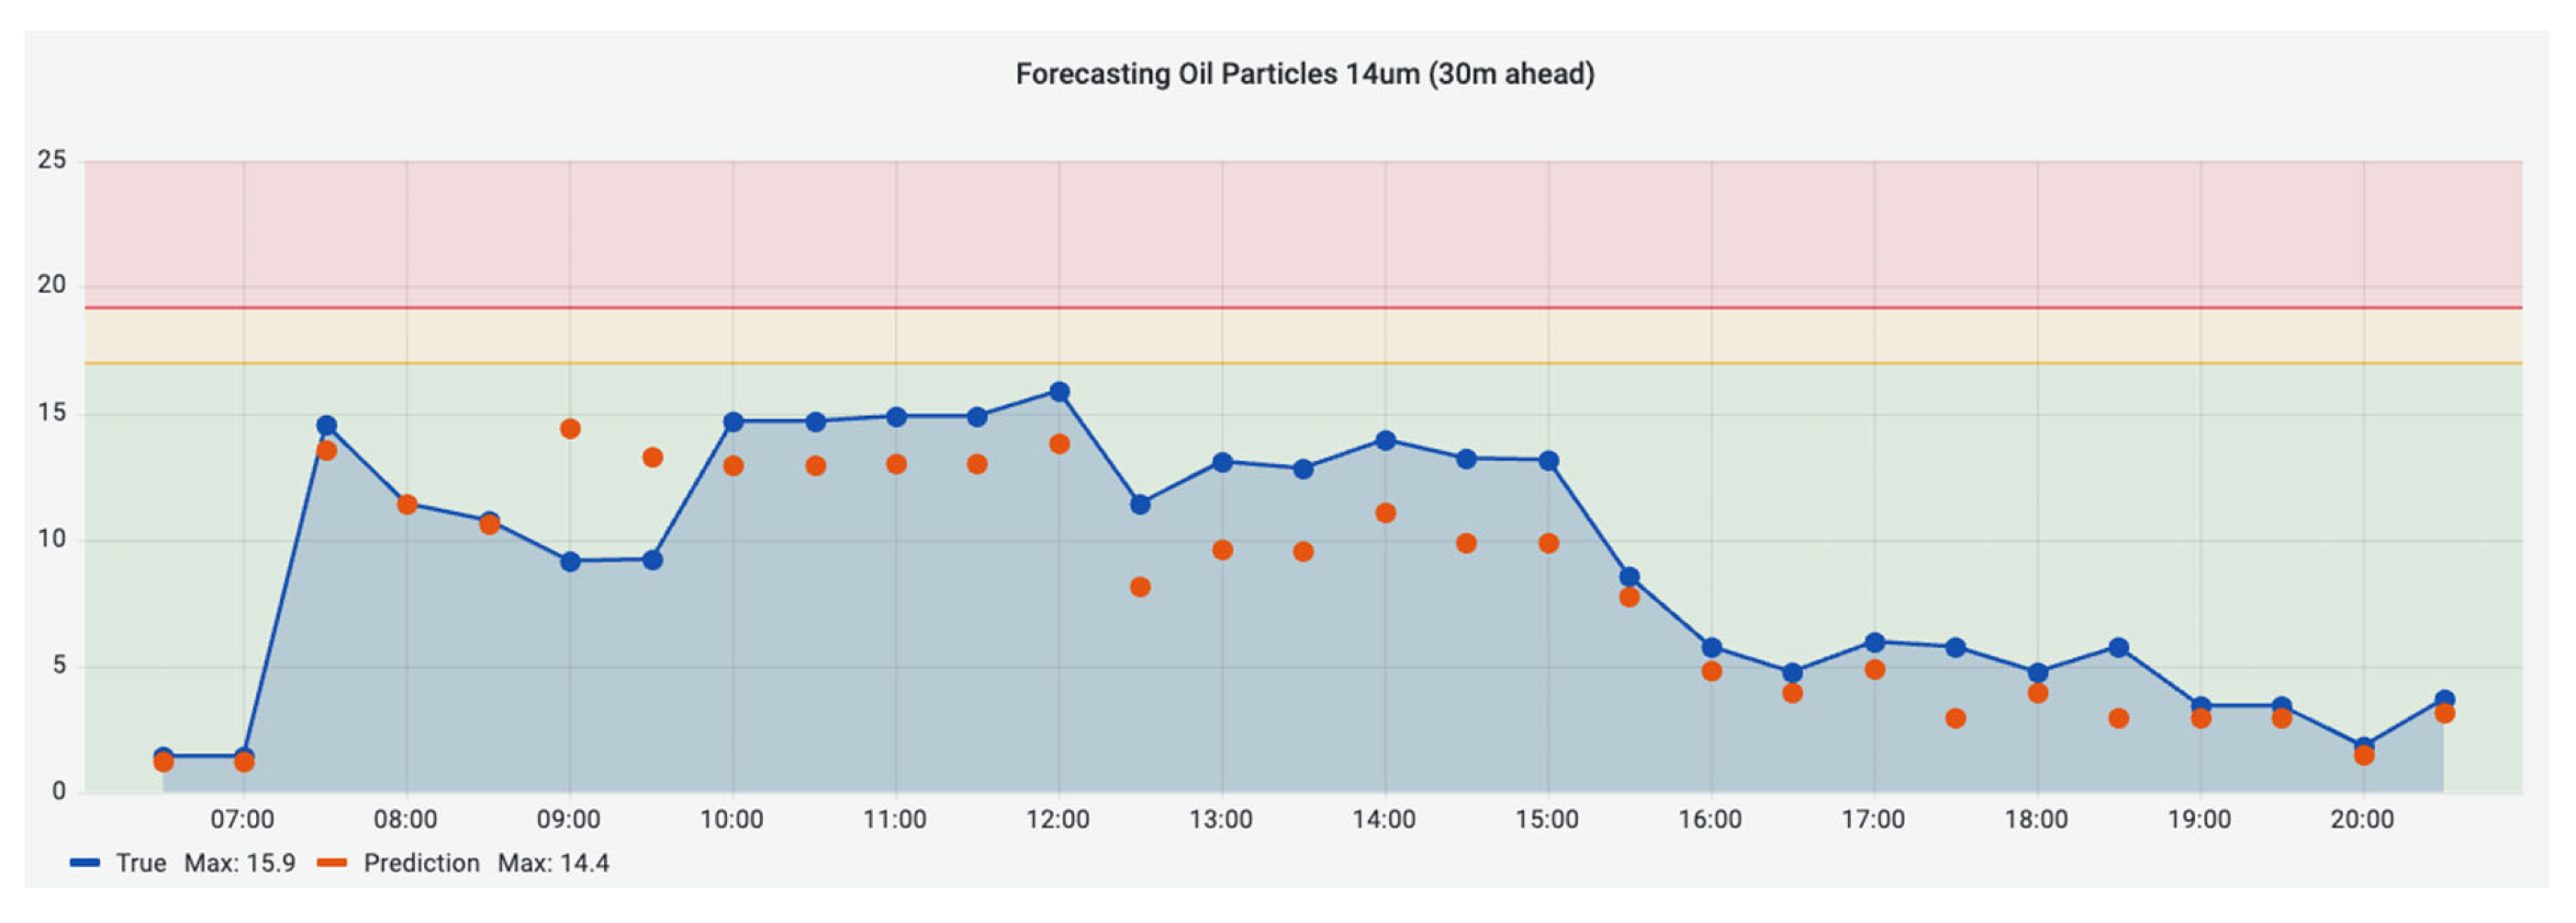
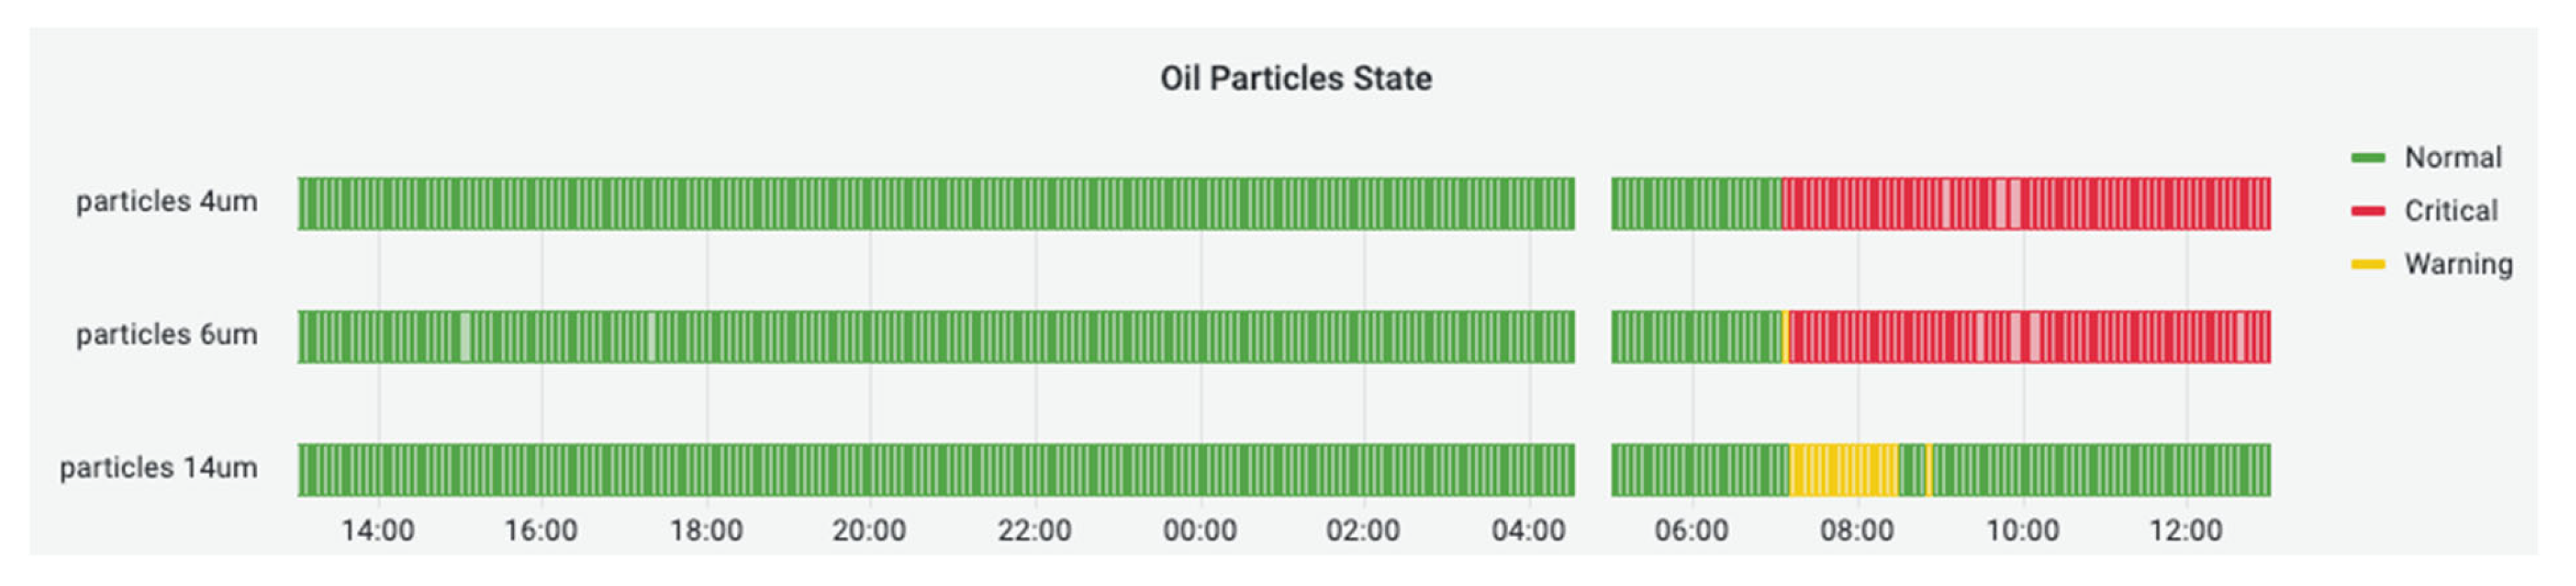
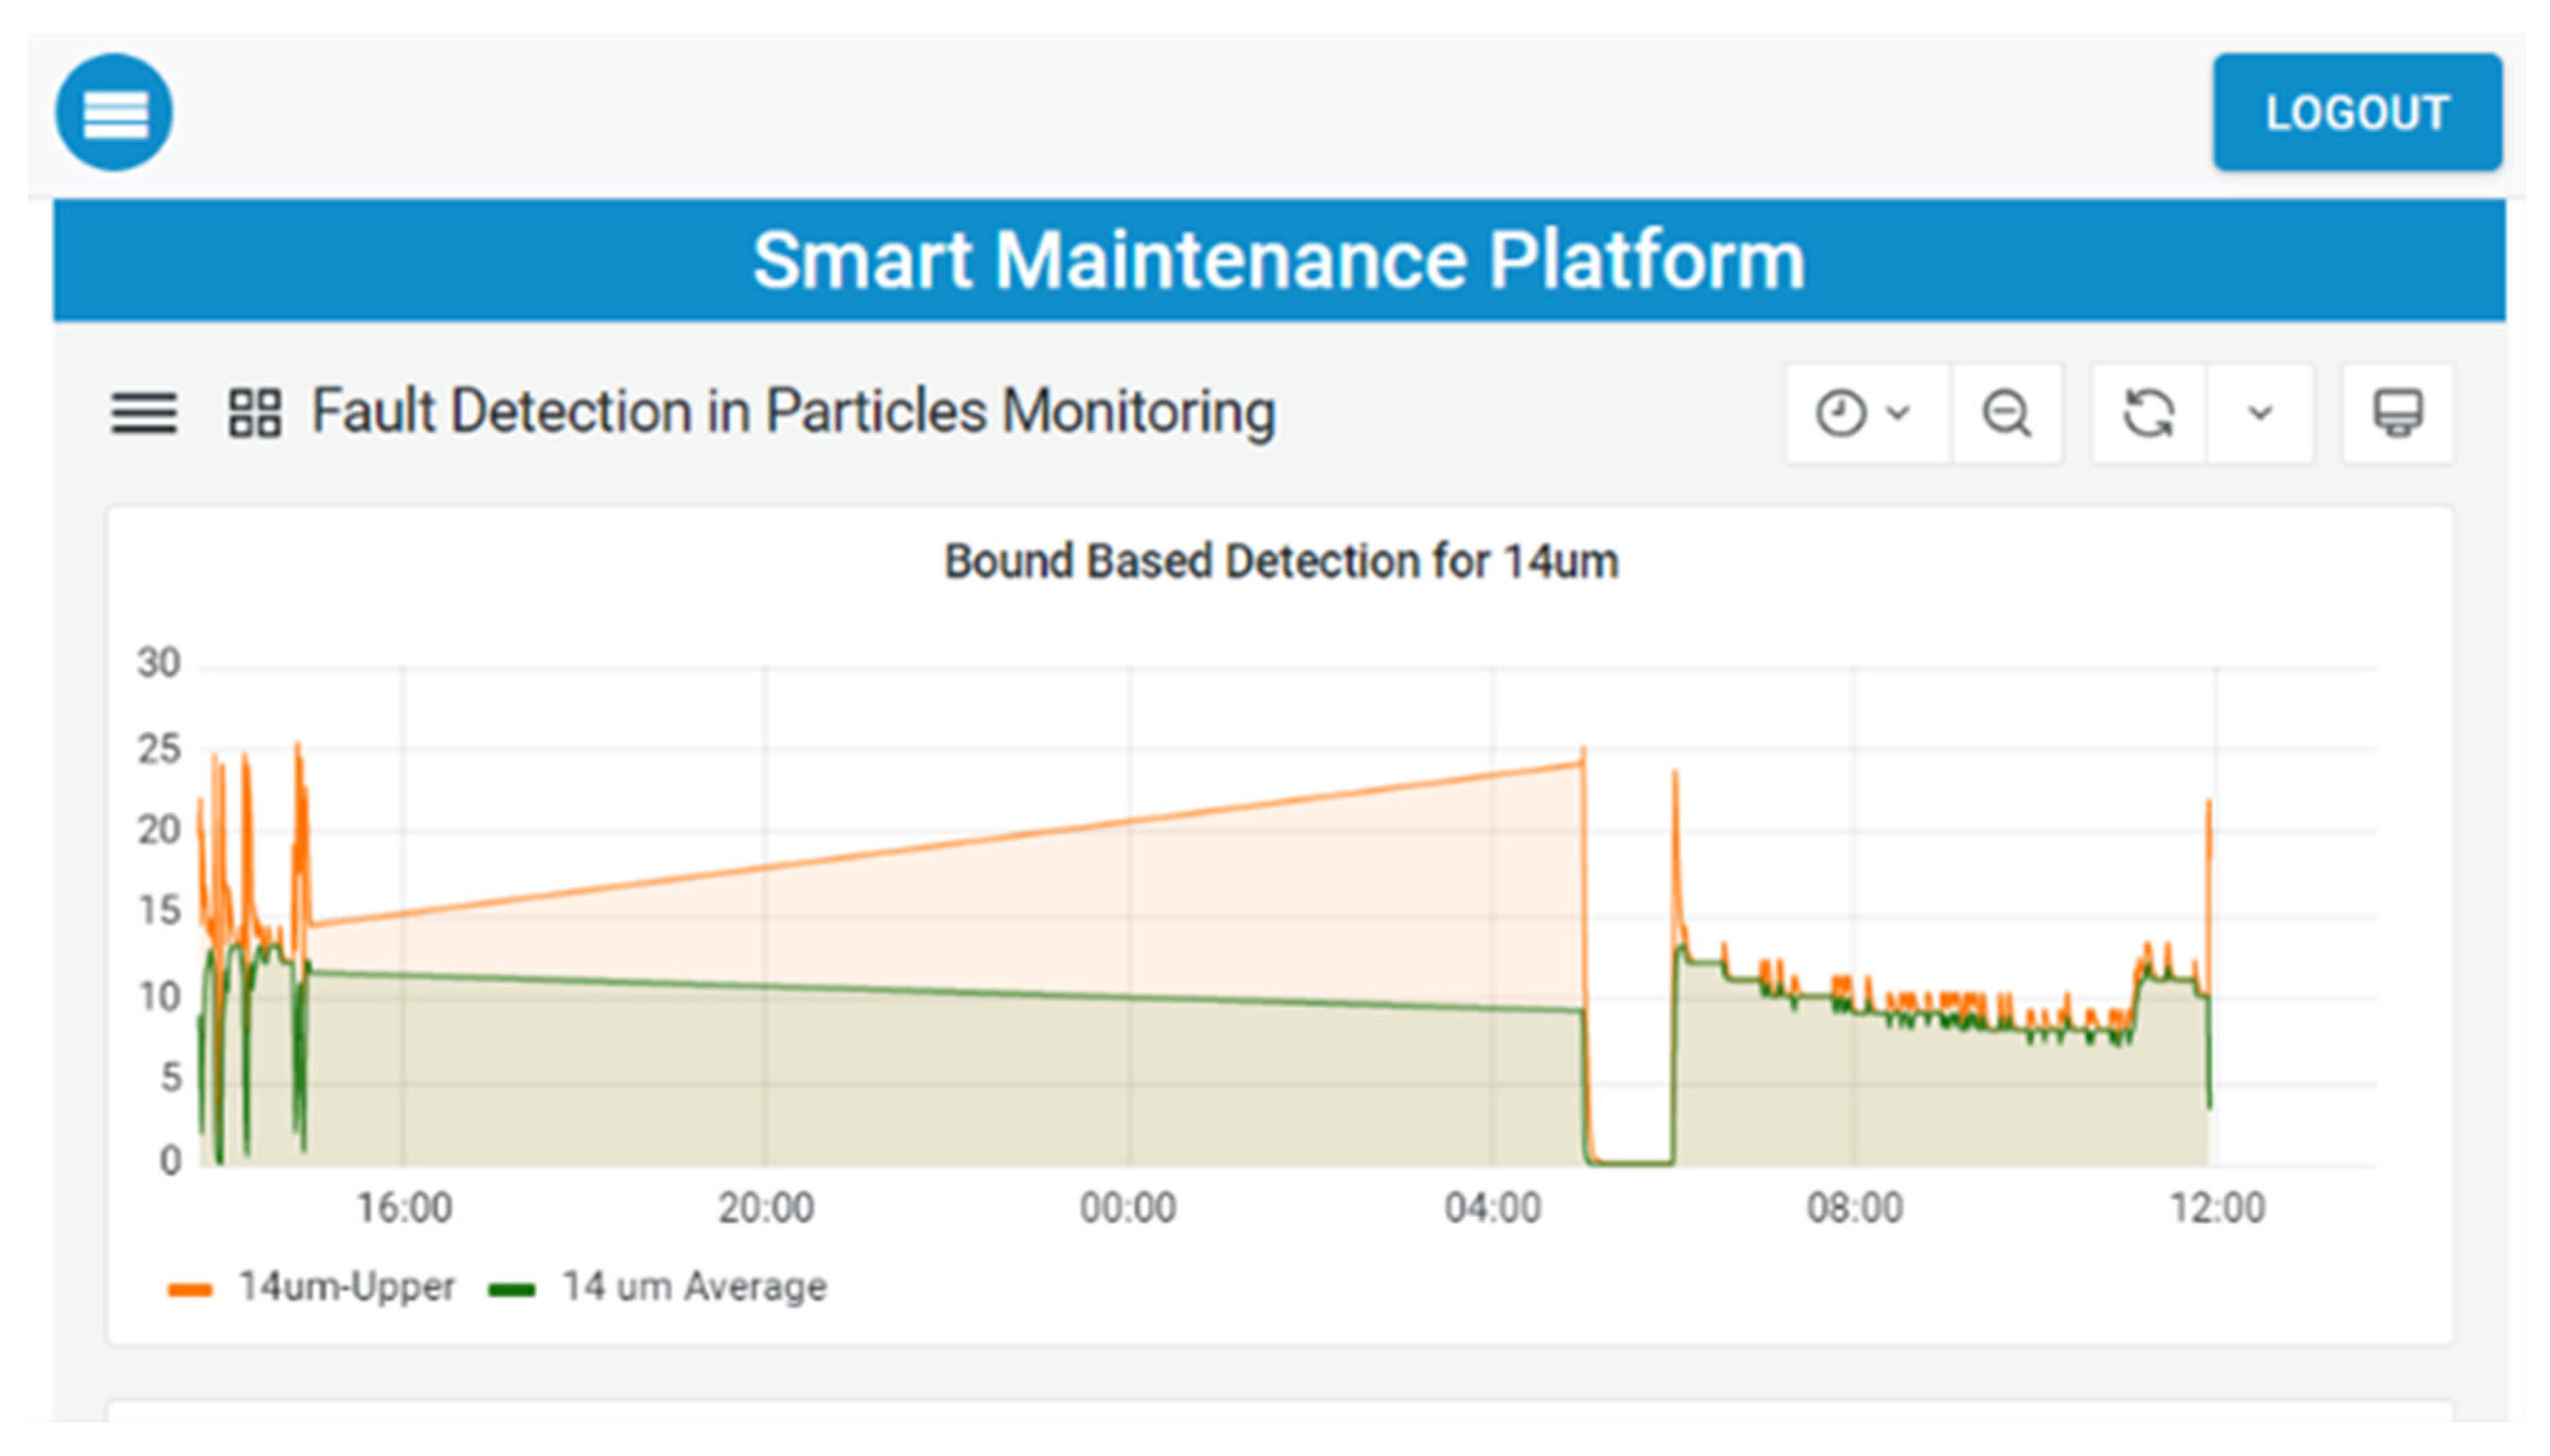
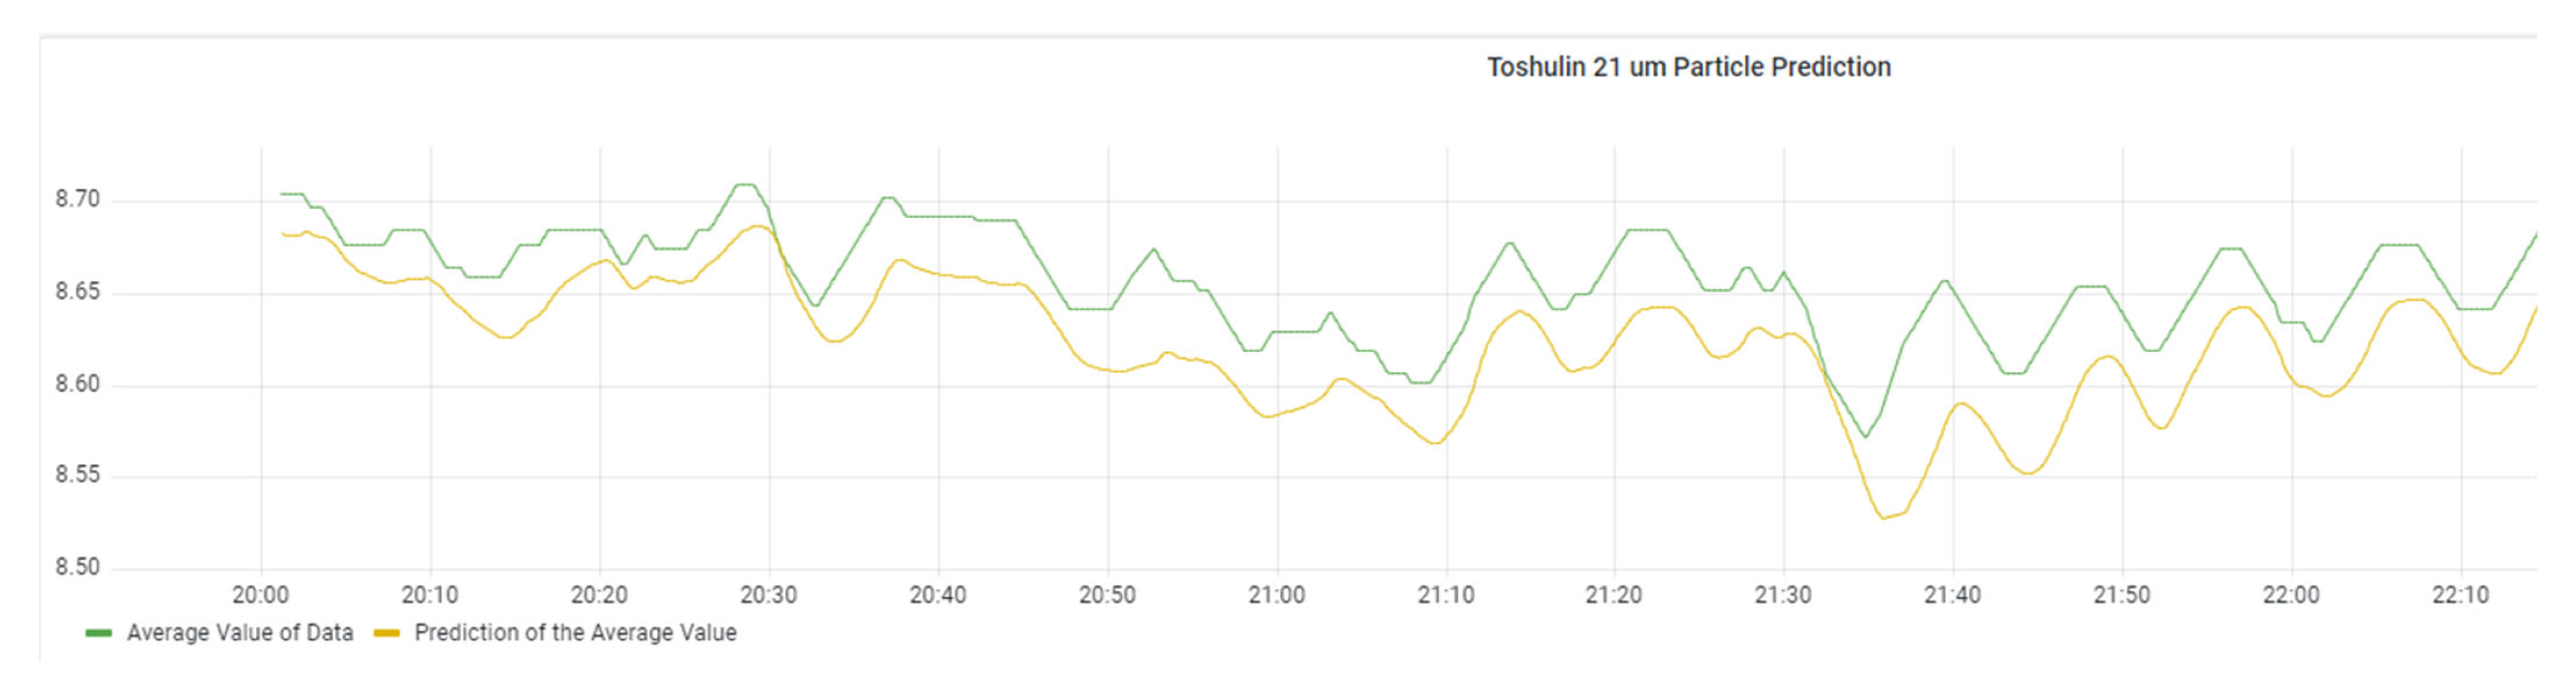
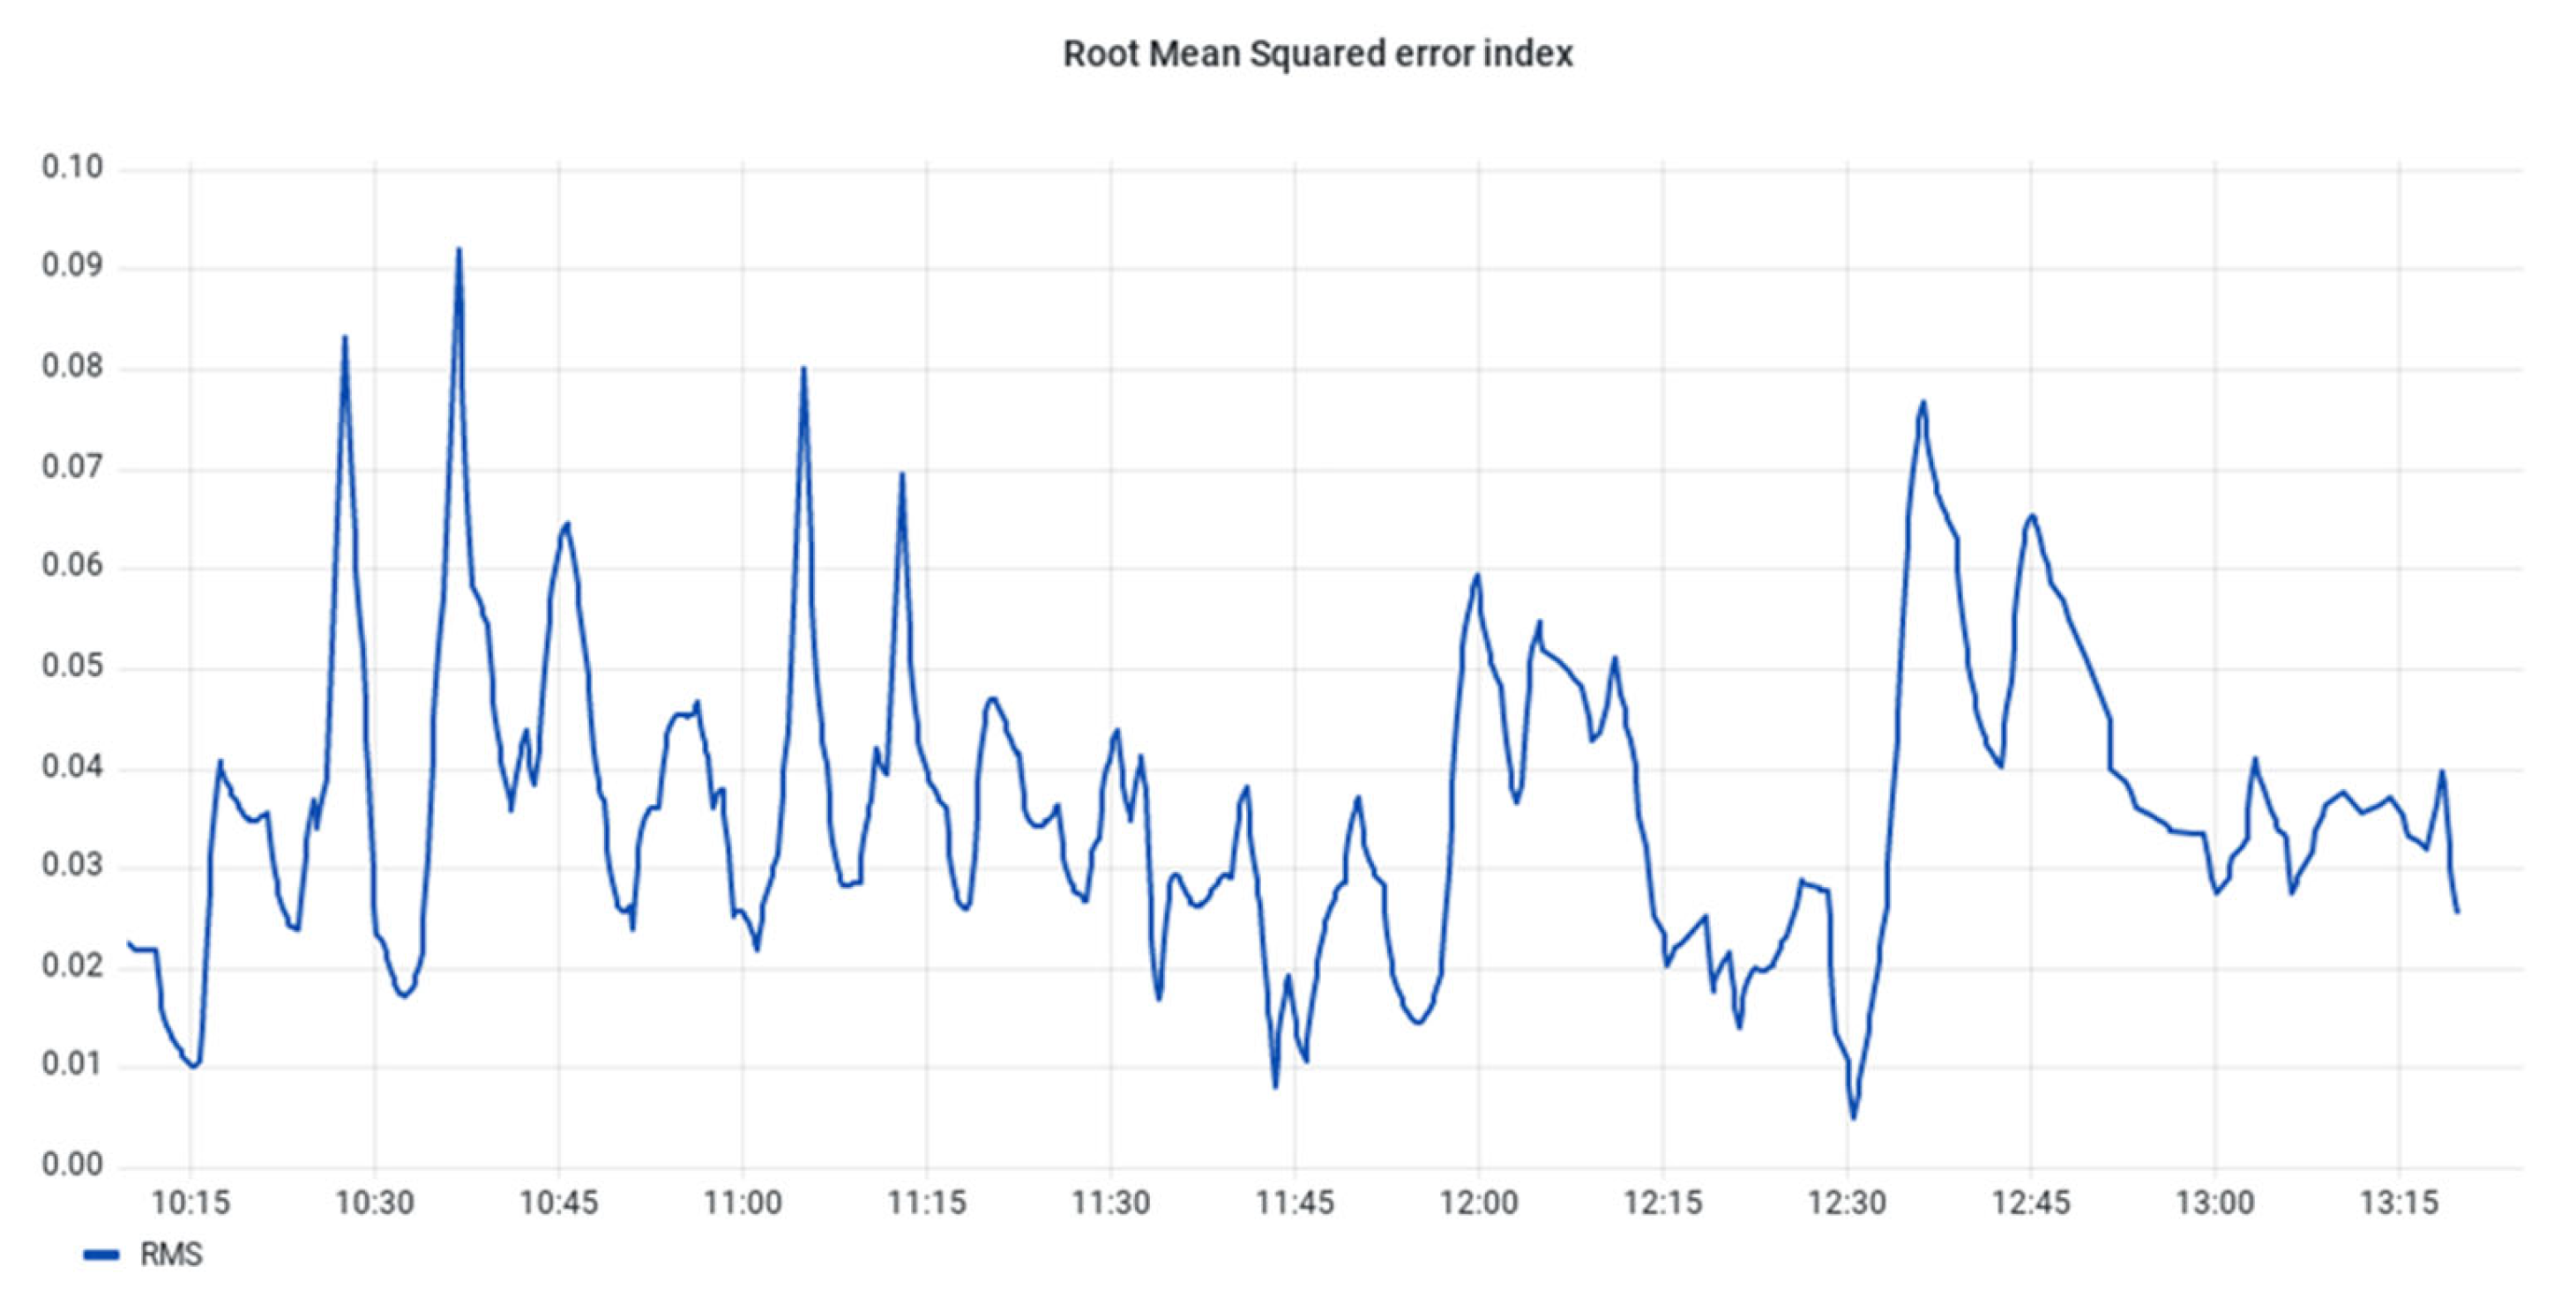