Article

Diagnostic and Prognostic Value of Quantitative Computed Tomography Parameters of Adrenal Glands in Patients from Internistled ICU with Sepsis and Septic Shock

1
Clinic of Radiology and Nuclear Medicine, Medical Faculty Mannheim, Heidelberg University, 68167 Mannheim, Germany
2
Division of Analytical Biosciences, Leiden Academic Centre for Drug Research (LACDR), Leiden University, 2333 CC Leiden, The Netherlands
3
First Department of Medicine-Cardiology, University Medical Centre Mannheim, 68167 Mannheim, Germany
*
Author to whom correspondence should be addressed.
Anatomia 2022, 1(1), 14-32; https://doi.org/10.3390/anatomia1010003
Submission received: 6 February 2022 / Revised: 1 March 2022 / Accepted: 4 March 2022 / Published: 9 March 2022
(This article belongs to the Special Issue Advances in Anatomy and Its History)

Abstract

:
The aim was to prospectively evaluate the diagnostic and prognostic value of different quantitative analysis methods assessing adrenal gland parameters on contrast-enhanced CT scans in patients with septic conditions. Seventy–six patients (49 men, 27 women) received CT scans for focus search. Adrenal glands were analyzed by means of three different methods: subjective region of interest (ROI) measurement, organ segmentation and histogram analysis using semi-automated software. Univariate analyses with multiple testing thresholds and receiver operating characteristic curves were performed. Clinical endpoints were 8-days, 28-days and 6-months mortality. Forty-four CT scans were analyzed (ground truth: patients with no sepsis: n = 6; patients with sepsis: n = 15; patients in septic shock: n = 21). Left adrenal gland (LAG) values were analyzed and compared, as data variation was lower than in the right adrenal glands. In patients with septic conditions, the combination of high LAG and Inferior Vena Cava (IVC) density values was highly specific for septic shock with all three methods. Only segmentation values were significantly different between the sepsis and septic shock groups after confounder correction (p = 0.048). Total adrenal gland volume was 20% higher in the septic shock patients while a relatively small LAG volume within the septic shock subgroup was associated with higher mortality at day 8 (AUC = 0.8; p = 0.006) and at 6 months (AUC = 0.7; p = 0.035). However, time-consuming density analysis methods assessing adrenal glands do not provide additional diagnostic value in patients with septic conditions. The combination of high LAG and IVC attenuation values seems to be highly specific for septic shock, regardless of the analysis type. Adrenal gland volume reveals short- and long-term prognostic capacity.

Graphical Abstract

1. Introduction

According to the German Centre for Sepsis Control and Care, approximately 154,000 patients are in-patients due to septic conditions throughout Germany every year, with a mortality as high as 50% and sometimes more [1,2]. Sepsis is—even today—a leading cause of critical illness and hospital mortality and remains a major challenge for modern medicine. Responsible for every third death in Germany, it is the main cause of death in the non-coronary intensive care unit (ICU). In addition, expenses for ICU patients represent about 30% of the overall ICU costs in Germany and amount to approximately 1.77 billion euros. Indirect economical costs are estimated at about 3.5 times as high as direct expenses, caused by work stoppage or early retirement and overall costs are estimated to be around 6.3 billion euros annually [1,3,4,5,6].
In 2016, as a result of the release of the Third International Consensus Definitions for Sepsis and Septic Shock, new sepsis definitions (“Sepsis 3”) were issued by a task force formed by members of the Society of Critical Care Medicine and of the European Society of Intensive Care Medicine [5].
Now, sepsis is defined as a life-threatening organ dysfunction caused by a dysregulated host response to infection. The term also comprises physiological, pathological and biochemical abnormities induced by infection. Organ dysfunction can be represented by an increase in the Sequential (Sepsis-related) Organ Failure Assessment (SOFA) Score of two or more points, which reflects an in-hospital mortality risk of greater than 10%. This score, designed to monitor patients’ status and disease development during the stay in ICU, includes six different sub-scores: One for each the respiratory, cardiovascular, hepatic, coagulation, renal and neurological systems.
Septic shock is defined as sepsis in combination with cardiovascular failure resulting in an inadequate tissue perfusion and metabolic dysfunction. Furthermore, patients with septic shock are required to meet the following Sepsis-3 criteria: need of vasopressors to maintain a mean arterial pressure of 65 mmHg or higher and serum lactate level greater than 2 mmol/L (>18 mg/dL) in the absence of hypovolemia [5,7].
Although our understanding of the pathophysiological mechanisms of sepsis has evolved over recent decades, with new therapy regimes being implemented, such as the approach of early goal-directed therapy, timely administration of antibiotics or use of modern ventilation systems, mortality rates remain high [8].
For ICU patients with a suspected septic condition, contrast-enhanced computed tomography (CT) is a fast, cost-efficient, non-invasive and widely available imaging procedure, mostly applied for detecting a possible focus of the infection as well as assessing the patients’ clinical course. In this context, the hyperenhancement of adrenal glands is known as a CT sign associated with the “hypoperfusion complex”, as described by O’ Hara et al. [9] in children with post-traumatic shock, indicating poor prognosis. For adults with intense adrenal enhancement, previous studies indicate poor clinical outcome and high mortality rates in polytraumatized patients and in patients with hypovolemic or septic shock. Additionally, adrenal enhancement may serve as a predictor for organ failure [10,11]. Another recent study by Peng et al. [12] described a new special enhancing pattern (HAGS) of the adrenal glands on dual-phase contrast-enhanced CT in the arterial phase in patients with septic shock, indicating poor prognosis.
Relative adrenal insufficiency (RAI) regularly occurs in patients with septic conditions and describes the body’s incapacity to provide the required hormonal response to infection, although the adrenal glands function at their full capacity [12]. The fast response of these organs to stress during septic conditions is vital for survival. The response is mediated by the activation of the hypothalamic-pituitary-adrenal axis (HPA), preventing an over-activation of the immune response [13,14]. The HPA is initiated by cytokines and other inflammatory mediators that trigger the activation of the corticotropin releasing hormone (CRH) from the hypothalamus and leads to the subsequent release of the adrenocorticotropic hormone (ACTH) from the pituitary gland during infection [15]. ACTH then binds to the melanocortin-2 receptor on cells of the adrenal cortex, mediating synthesis of steroids. This feedforward mechanism of cortisol genesis is balanced through a negative feedback interaction by cortisol with ACTH and CRH, inhibiting their release [16,17]. The higher metabolic demand for cortisol and the compensatory mechanism for hypovolemia in patients with septic shock leads to an increased blood flow to the adrenal glands and to their subsequent enlargement, which is seen radiologically as intense adrenal enhancement in contrast-enhanced computed tomography in patients with sepsis and septic shock [9,18,19].
In this study we want to leave behind the approach of qualitative and semiquantitative evaluation of hyperattenuating adrenal glands. Our aim is to assess quantitative data and derive cut-off values in order to distinguish sepsis stages and predict patients’ outcomes. With these endpoints in mind, the authors compared three more or less time-consuming methods of adrenal gland analysis. First, the fast and subjective method of ROI, second, the more elaborate semiautomated quantification of adrenal gland volume and, third, organ segmentation with subsequent histogram analysis. Previous studies have used histogram analysis for adrenal mass characterization, however, to the best of our knowledge, it has never been used for adrenal glands in patients with sepsis and septic shock [20,21].

2. Materials and Methods
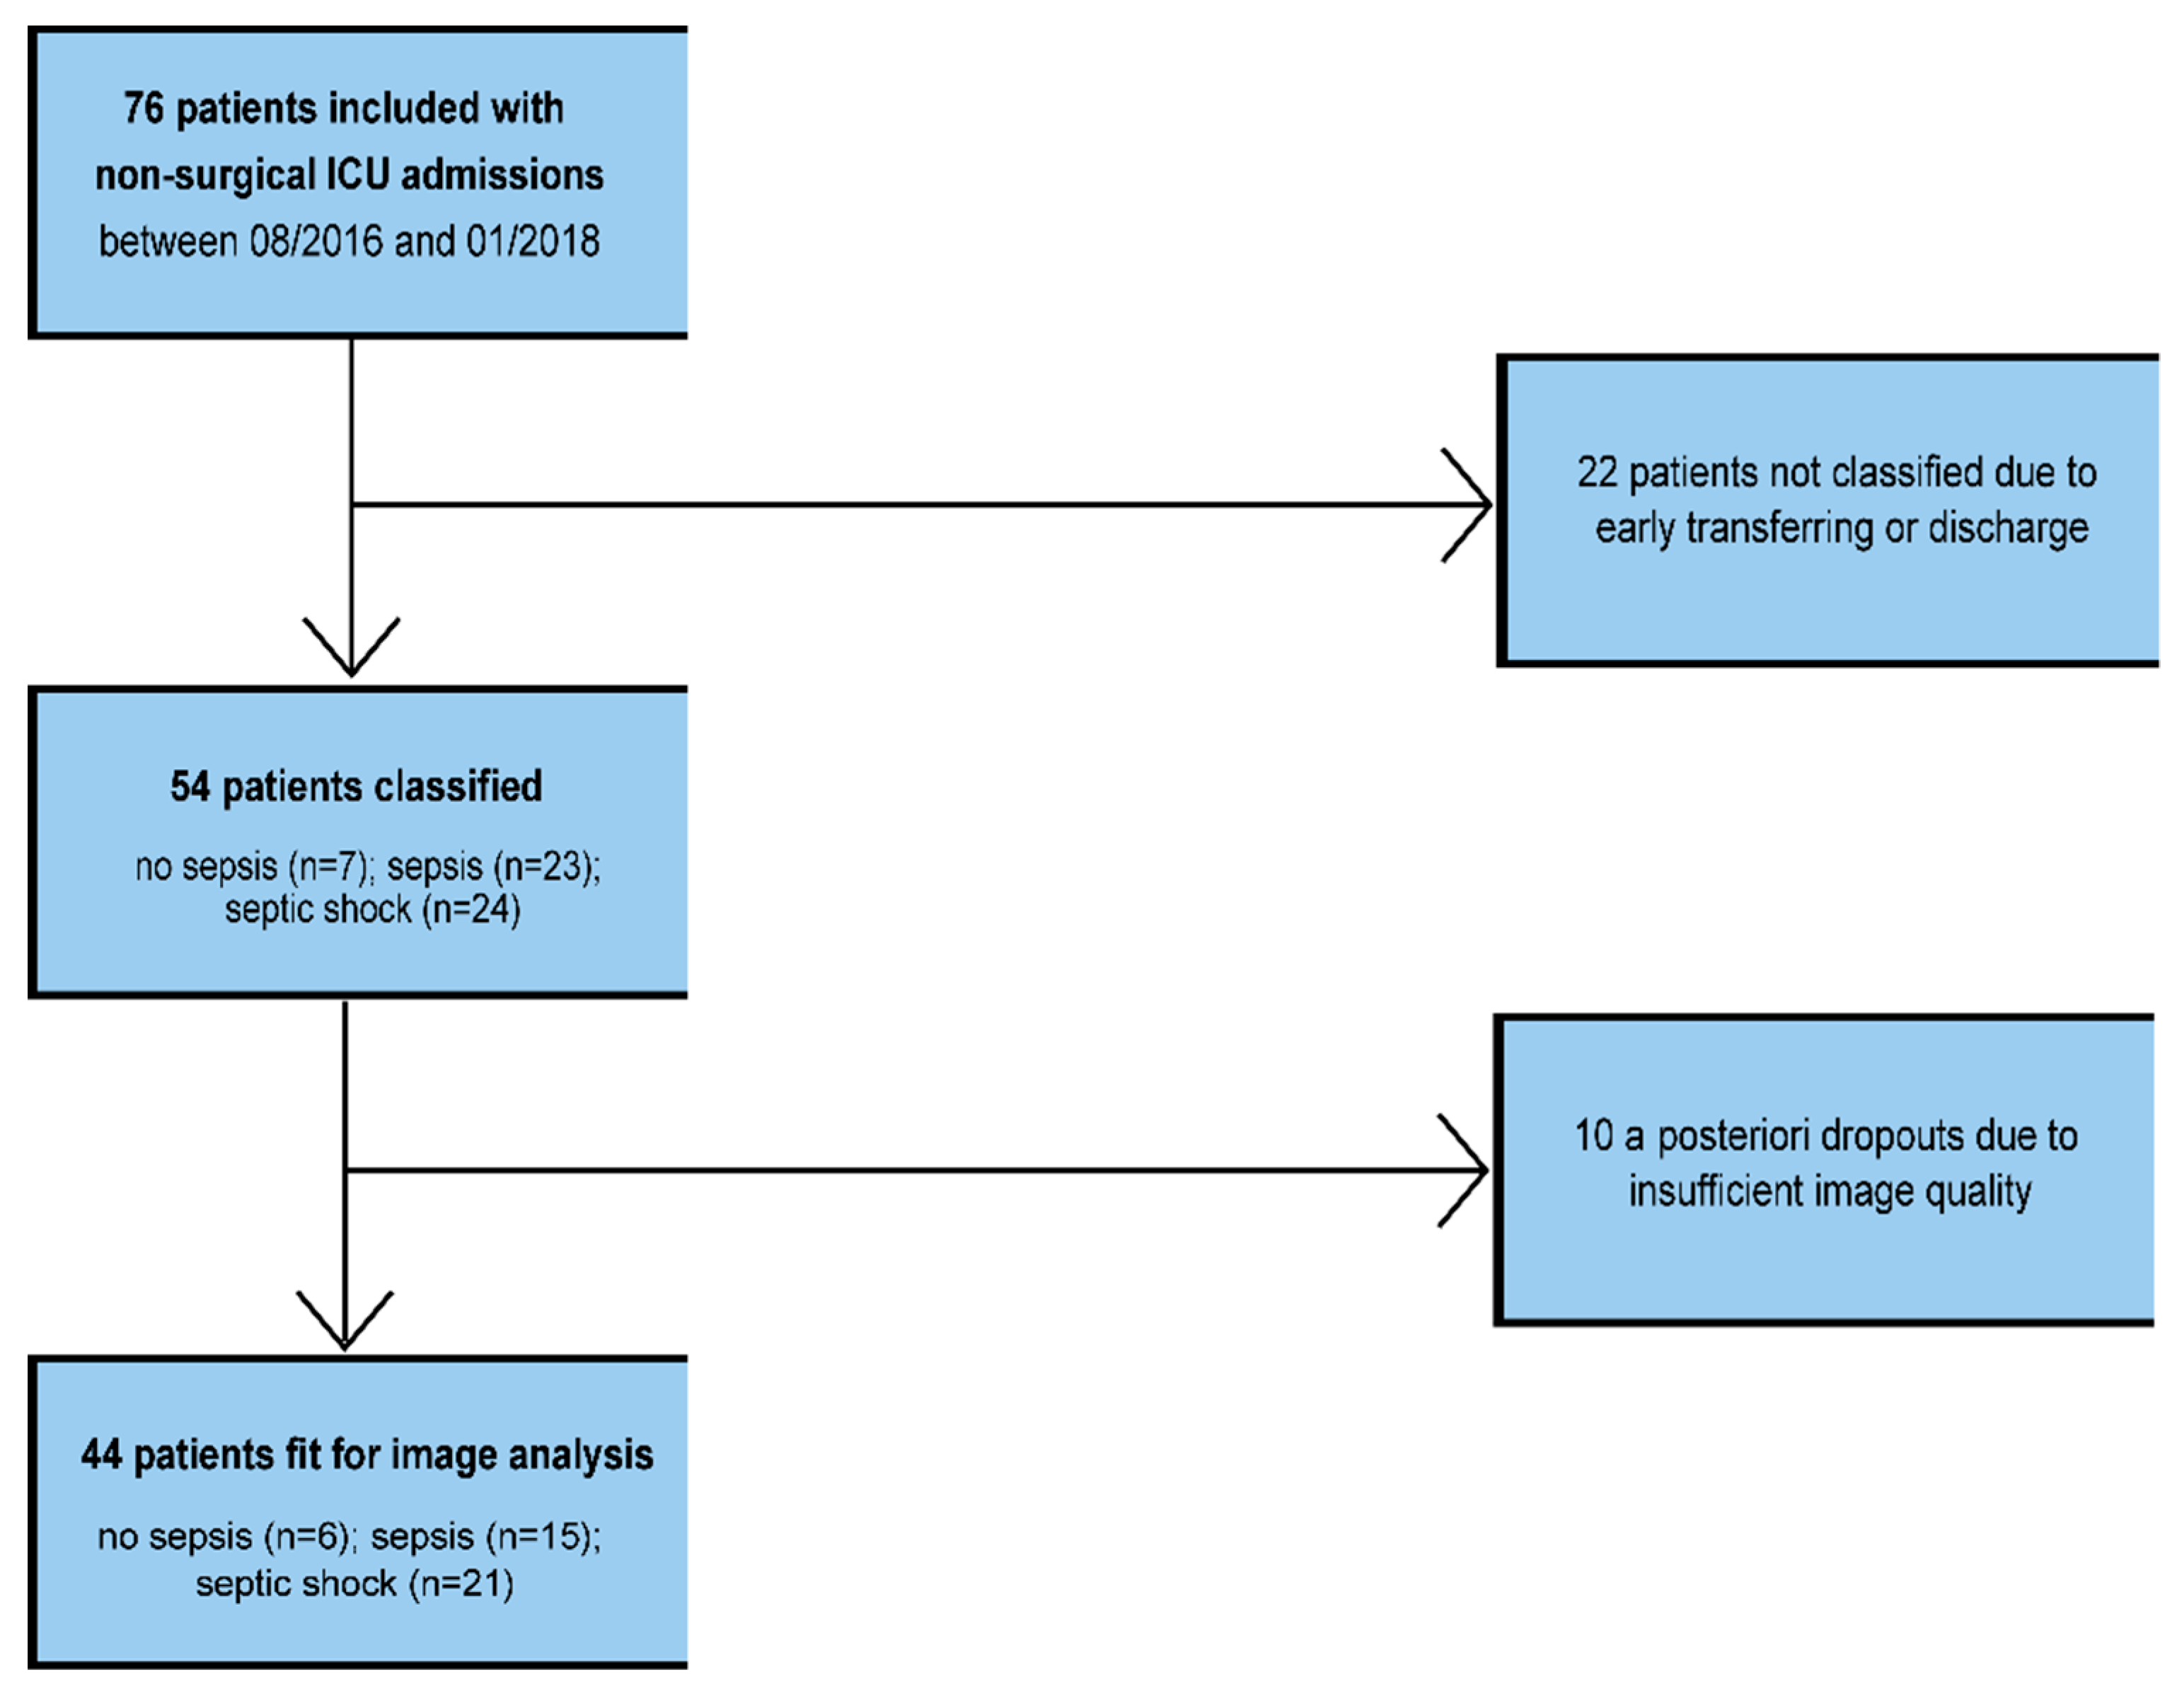
2.1. Study Protocol

This prospective single-center study conducted at the University Medical Centre Mannheim (UMM), Germany, was approved by the local ethics committee. A total of seventy-six patients were prospectively enrolled. Informed consent was obtained from all participating patients or their legal representatives. This study was performed according to standards of the Health Insurance Portability and Accountability Act (HIPAA) and the Declaration of Helsinki. Criteria for patients to be included into the study were non-surgical admission to an internist-led ICU and a suspected septic condition as well as performance of a whole-body CT scan for focus search, with i.v. contrast media application via the upper extremities or the internal jugular veins. From all the patients included in the study, venous blood samples for testing parameters known to be associated with a septic condition were collected within 24 h after they had received the contrast-enhanced CT scan. In light of the complete clinical course, the laboratory results and the radiological findings, a baseline could be established, dividing patients into the different study groups at the time-point of CT imaging. Outcomes were determined on day 8, after 28 days and after 6 months.

2.2. CT–Data Acquisition

A clinically indicated contrast-enhanced CT scan was performed on all patients participating in the study and the day of the CT-scan was determined as day 1 regarding outcome analysis. CT data was acquired on a 16-slice single-source CT scanner system (Somatom Emotion, Siemens Healthineers, Erlangen, Germany). In an average-weighted patient, 90 mL of iodinated contrast material was applied with a flow rate of 2.5 mL/s followed by a saline chaser bolus of 20 mL of the same flow rate. The scan protocol consisted of a chest scan acquired during the arterial phase, optionally a neck scan acquired 40 s after the start of contrast material application and an abdominal scan acquired during the portal-venous phase 70 s post contrast material application. The start of the scan was triggered by bolus tracking within the aortic arch. The abdominal portal-venous phase was acquired at a peak tube voltage of 130 kVp, and reference tube current of 110 mAs, pitch of 0.95. CT raw data were reconstructed with a slice thickness of 1.5 mm, slice increment of 0.9 and transferred to our PACS system.

2.3. Clinical Parameters

All collected medical patient data from the internal ICU stay were reviewed by inspection of paper files or by inspection of digital stationary ICU patient files within the hospital’s management software SAP. Parameters of interest were basic patient data such as age, previous diseases, cause for admission and days spent on the ICU, as well as sepsis-associated-parameters obtained from the day of the contrast-enhanced CT scan. These included basic vital parameters like breathing rate and systolic blood pressure as well as Glasgow Coma Scale values (GCS), necessary for a SOFA score assessment. To determine sepsis stages according to the “new” Sepsis 3 criteria using the SOFA score, namely paO2, FiO2, flow of catecholamine, creatinine, urinary excretion and lactate were used. If possible, APACHE II-, and SAPS II-scores were assessed as well.

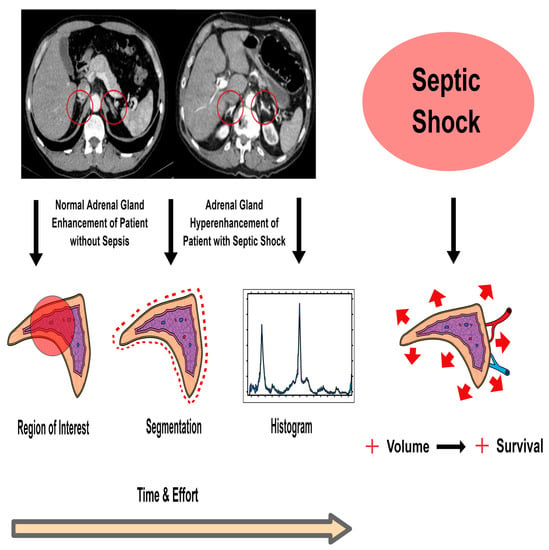
2.4. CT–Image Analysis

“Aycan OsiriX” is an open source Digital Imaging and Communications in Medicine (DICOM) archiving and distribution system that was used to assess CT images and import data for further processing [22]. After the portal-venous abdominal CT scan was imported into the local database, the Aycan-Eclipse-Tool was used to determine a region of interest (ROI) with a target size of 0.1 cm2 (between 0.08 and 0.34 cm2).
The following parameters were assessed in duplicate measurements: mean and standard deviation of both adrenal glands and the inferior vena cava and aorta at the level of both adrenal glands within the ROI, as well as the area (cm2) of the ROI itself.
For the purpose of organ segmentation, “The Medical Imaging Interaction Toolkit” (MITK) was used. This is a free open source software system for the development of interactive medical image processing software, that provides image-guided procedures and image analysis with interaction features to correct results from (semi)automated computation, if necessary [23]. DICOM-portal-venous phase abdominal images of patients’ whole-body CT scans were imported into the MITK for segmentation of the adrenal glands. Slice thickness was 1.5 mm and CT scans were either reformatted in the axial or coronal plane depending on the best delineation of the left and right adrenal gland.
3D- or 2D segmentation tools with 3D interpolation were used for the segmentation of adrenal glands. Morphological operations such as “dilation”, “closing” or “filling holes” were used, if necessary, for refining automatic segmentation as well as manual segmentation depending on the patients’ image. In addition, tumors, blood vessels, fat tissue, calcifications or infarcted areas of the gland were manually excluded from segmentation. The following parameters were assessed separately for both adrenal glands: mean density in Hounsfield Units (HU), median, standard deviation, maximum, minimum, number of voxels (n) and volume of voxel (V in mm3). Furthermore, histogram data were used by using the “copy-to-clipboard” function of the statistics’ tool. Negative pixels were eliminated in order to avoid inclusion of surrounding retroperitoneal fat tissue or small adenomas within the gland and consecutively false-low HU mean values. The histogram data provided pixel attenuation (HU) along the x axis versus the frequency of pixels at each attenuation value along the y axis [20].

2.5. Statistical Analysis

Statistical analysis and graphical representation were performed using dedicated software: R (Version 3.6 for mac); SigmaPlot (Version 14.0); Excel (2019, MSO).
For quantitative data derived from CT scans, the median and interquartile ranges (IQR) were calculated for mean attenuation values. Other quantitative data regarding baseline characteristics are presented as mean ± standard error of the mean (SEM). Categorical variables were reported as numbers and percentages. The Pearson correlation for all variables of interest and analysis of variance wase used (with subsequent Bonferroni correction for multiple testing where appropriate) for comparison of numerical data. To identify combinations of markers predictive of death or sepsis classification at various timepoints, elastic net regression for endpoints and sepsis classification was used, chemical markers were log2 transformed and data was divided into training (80%) and testing (20%) sets for all available data points per outcome. Receiver operating characteristic curves were used to illustrate various cut-offs for mortality risks associated with adrenal gland volume. Attenuation values were corrected for the confounders’ age, sex, evidence of presence of germs, APACHE-score and SOFA-score. The sepsis groups were compared with the use of the Mann–Whitney U test for numerical data again with subsequent multiple testing Bonferroni correction. Boxplot diagrams and Pearson correlations were used for all radiological data.

3. Results

3.1. Final Cohort

Baseline characteristics are given in Table 1. From 76 patients included from the internist-led ICU, 54 patients could be assigned according to the new sepsis classification. There were 7 patients (4 male, 3 female) in the non-sepsis group, 23 patients (16 male, 7 female) in the sepsis group and 24 patients (12 male, 12 female) in the septic shock group. Twenty-two patients could not be classified due to early transfer or discharge.
In our final patient cohort, we were able to perform image analysis with all three methods in a total of 44 patients assigned to the three sepsis 3-classification groups for both adrenal glands. A total of 10 patients had to be excluded a posteriori. Reasons included poor image quality and organ demarcation, partially due to poor circulatory function, malformed glands due to tumors, respiration-induced artifacts, foreign material artifacts, i.v. contrast material administration via lower extremity veins and individual anatomical variations, e.g., of suprarenal blood vessels. As for the method of segmentation, in five patients only the left adrenal gland (LAG) and in two patients only the right adrenal gland (RAG) was successfully segmented, respectively. Figure 1 presents a flowchart of the formation of the final study cohort.

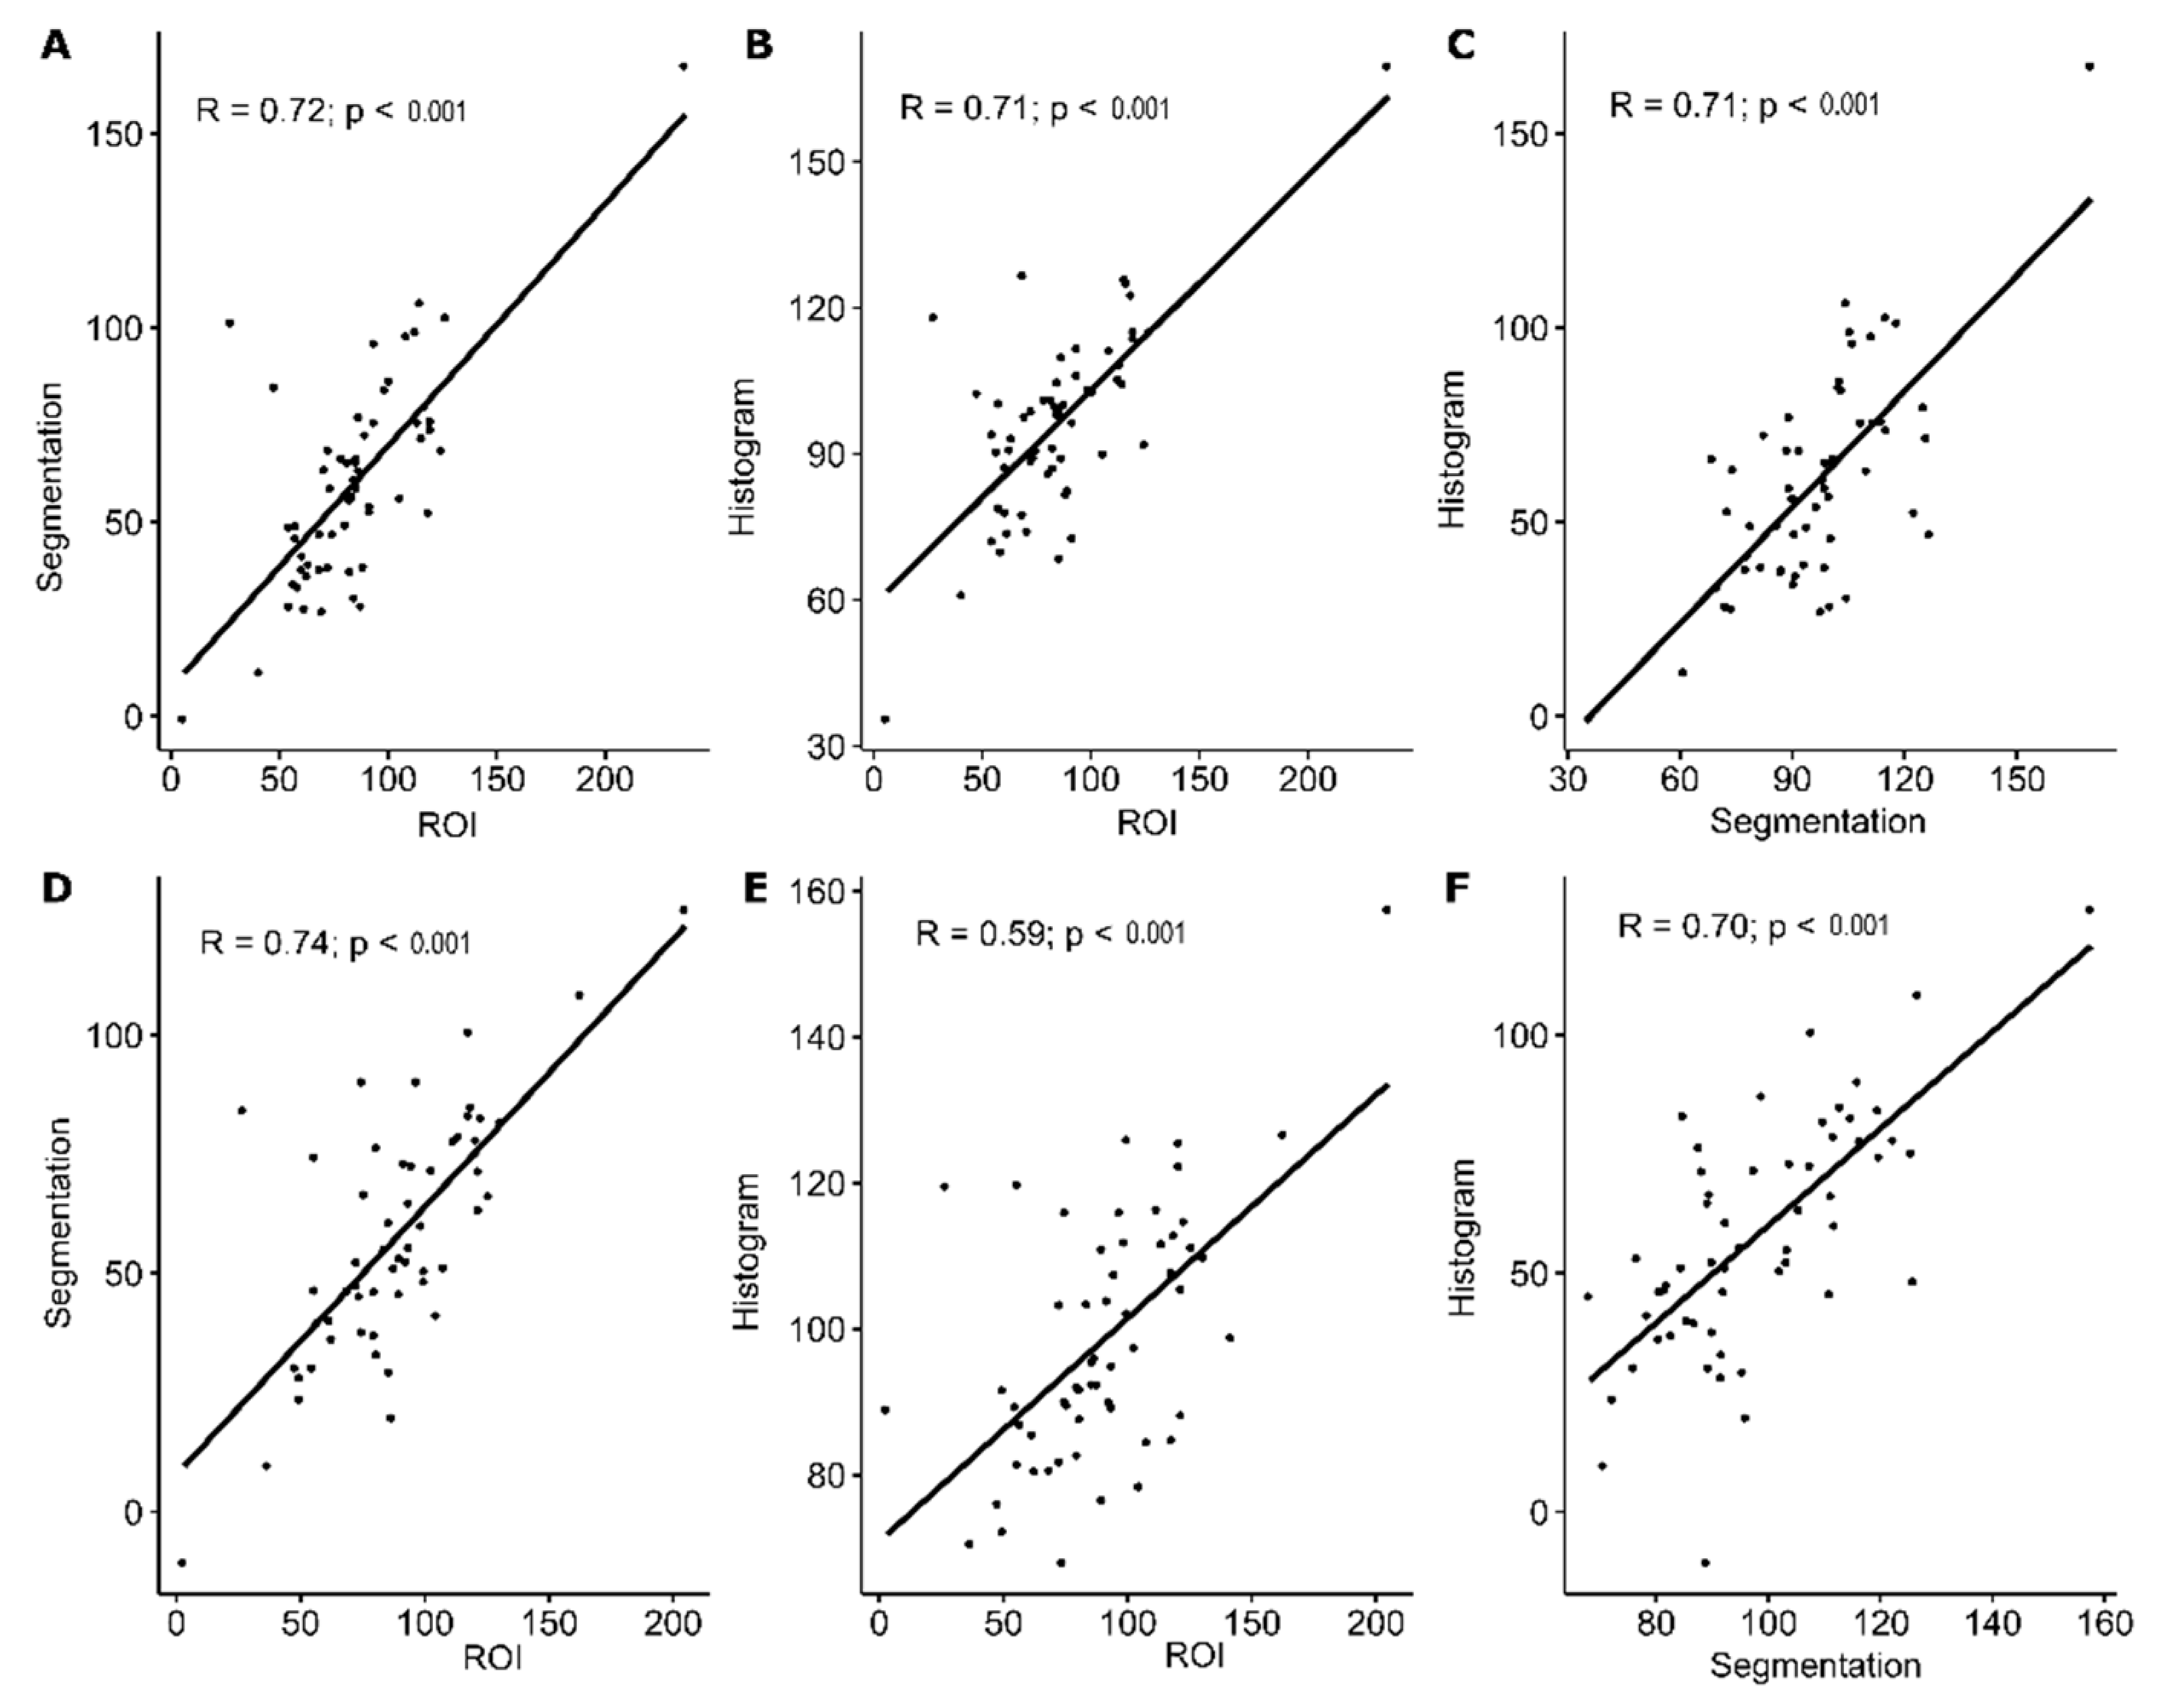
3.2. Correlation of HU Attenuation Values for Right and Left Adrenal Gland

Radiological results showed a strong correlation between both adrenal glands for all methods of image analysis. The correlation coefficients (R) for the mean (HU) values for different imaging methods were as follows (that is, for mean (median)): ROI: 0.87; semi-automatic segmentation: 0.88 (0.89); segmentation with histogram analysis: 0.78 (0.77) with all p < 0.001. The variation of mean HU values for adrenal glands was higher for RAG (R = 0.59; p < 0.001) than for LAG (R = 0.71; p < 0.001) for inter-methodical correlation of both ROI and Histogram values, as presented in Figure 2. Due to less data variation, but excellent correlation between both adrenal glands, we then solely focused on the LAG when comparing absolute attenuation values between sepsis groups.

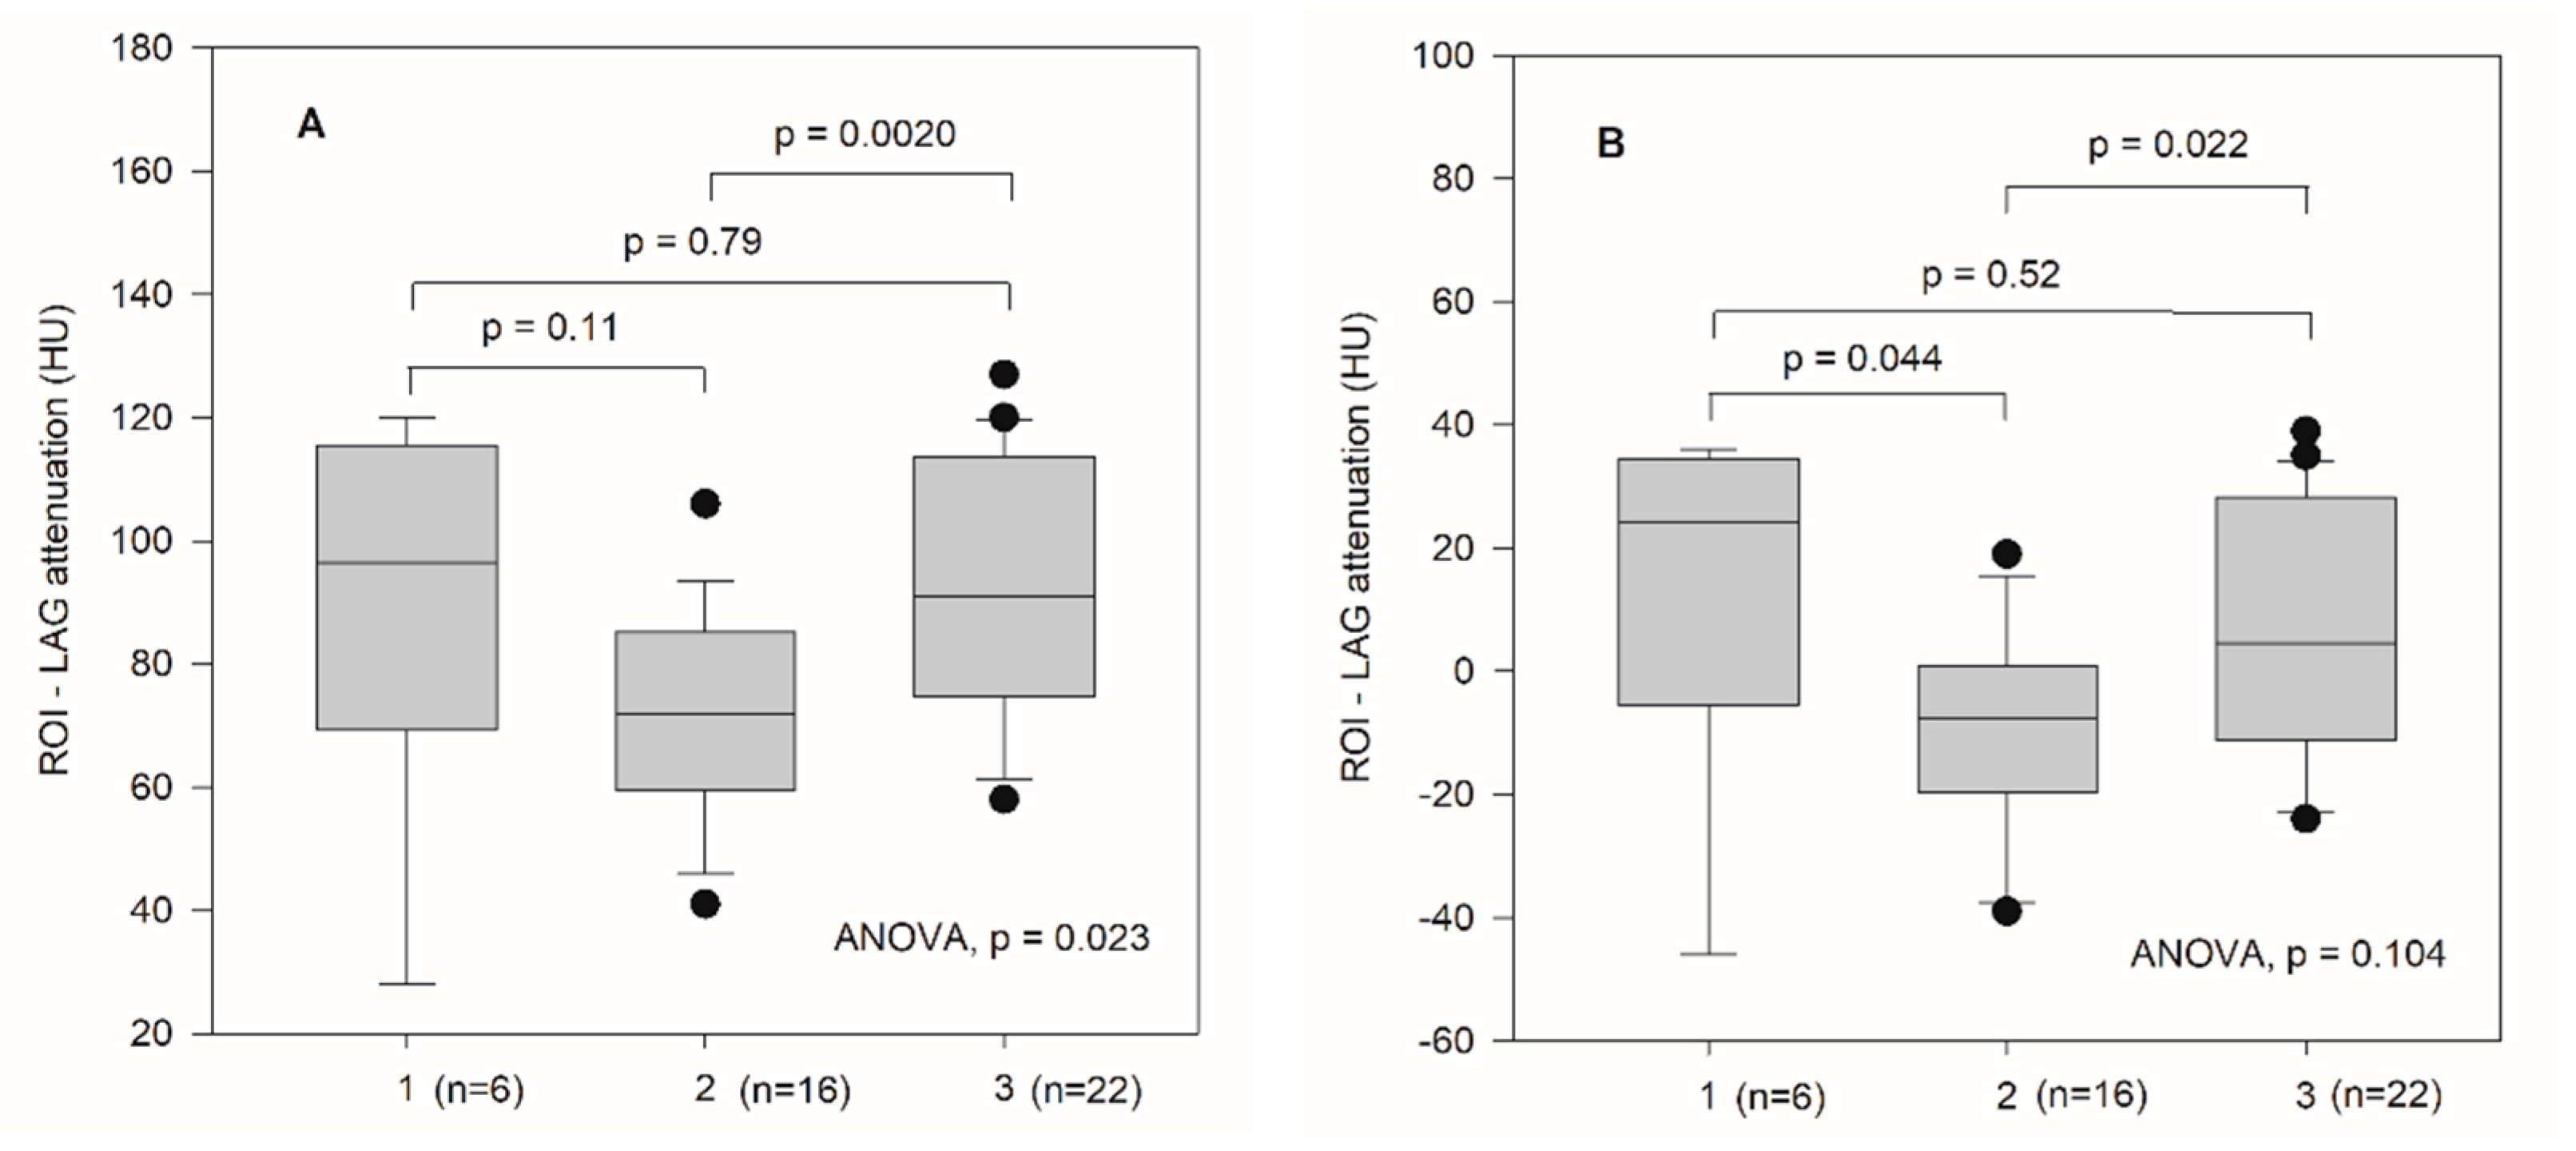
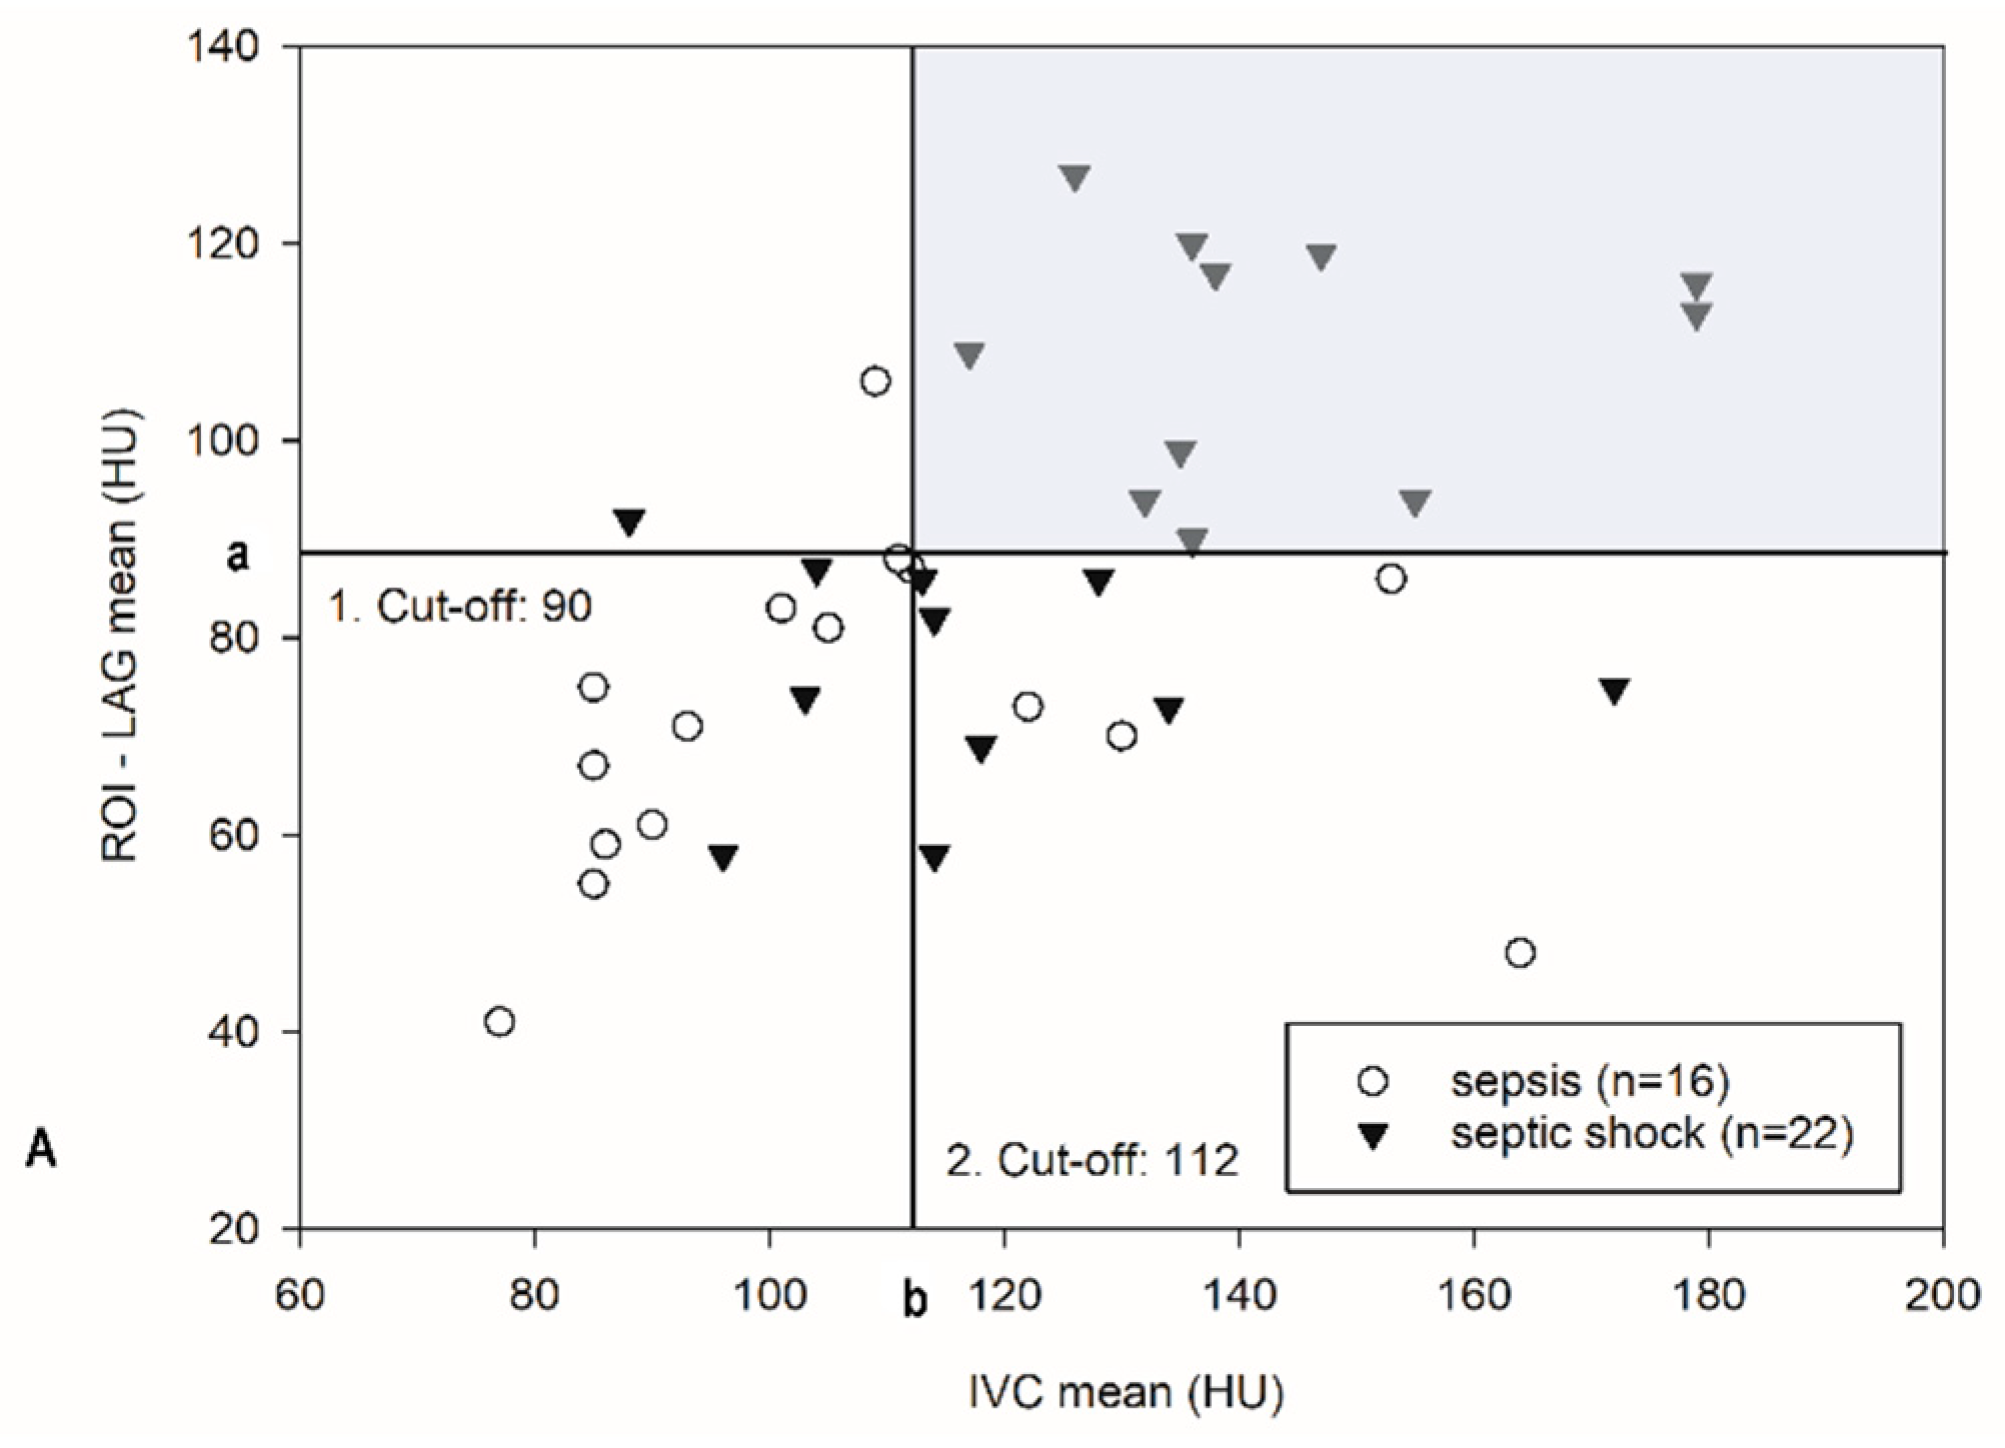
3.3. Method of Region of Interest (ROI)

Attenuation values (rounded values) from a ROI (range 0.08 to 0.34 cm2, average 0.27 cm2) for the LAG (HU) were as follows (that is, median (IQR)): no sepsis 97 (85 to 111); sepsis 72 (61 to 84); septic shock 91 (77 to 112). The values corrected for the confounders age, sex, evidence of presence of germs, APACHE score and SOFA score were (median (IQR)): no sepsis 24 (10 to 34); sepsis −9 (−17 to 0); septic shock 2 (−15 to 25). Figure 3A illustrates the distribution of absolute mean (HU) values for the LAG according to the different groups of sepsis severity at day 1 of their ICU stay. Between the groups for sepsis (2) and septic shock (3), there was a significant difference with higher attenuation values for patients with septic shock (p = 0.0020), which was also significant after multiple testing (ANOVA with subsequent Bonferroni, p = 0.023). The differences in between the other groups were not significant (p > 0.05).
Figure 3B illustrates the distribution of the corrected ROI (HU) values for the LAG, respectively. There were significant differences between the sepsis group (2) and septic shock group (3) (p = 0.022), and between the “no sepsis” and sepsis group (2) (p = 0.044), which were no longer significant after multiple testing correction (p = 0.104).

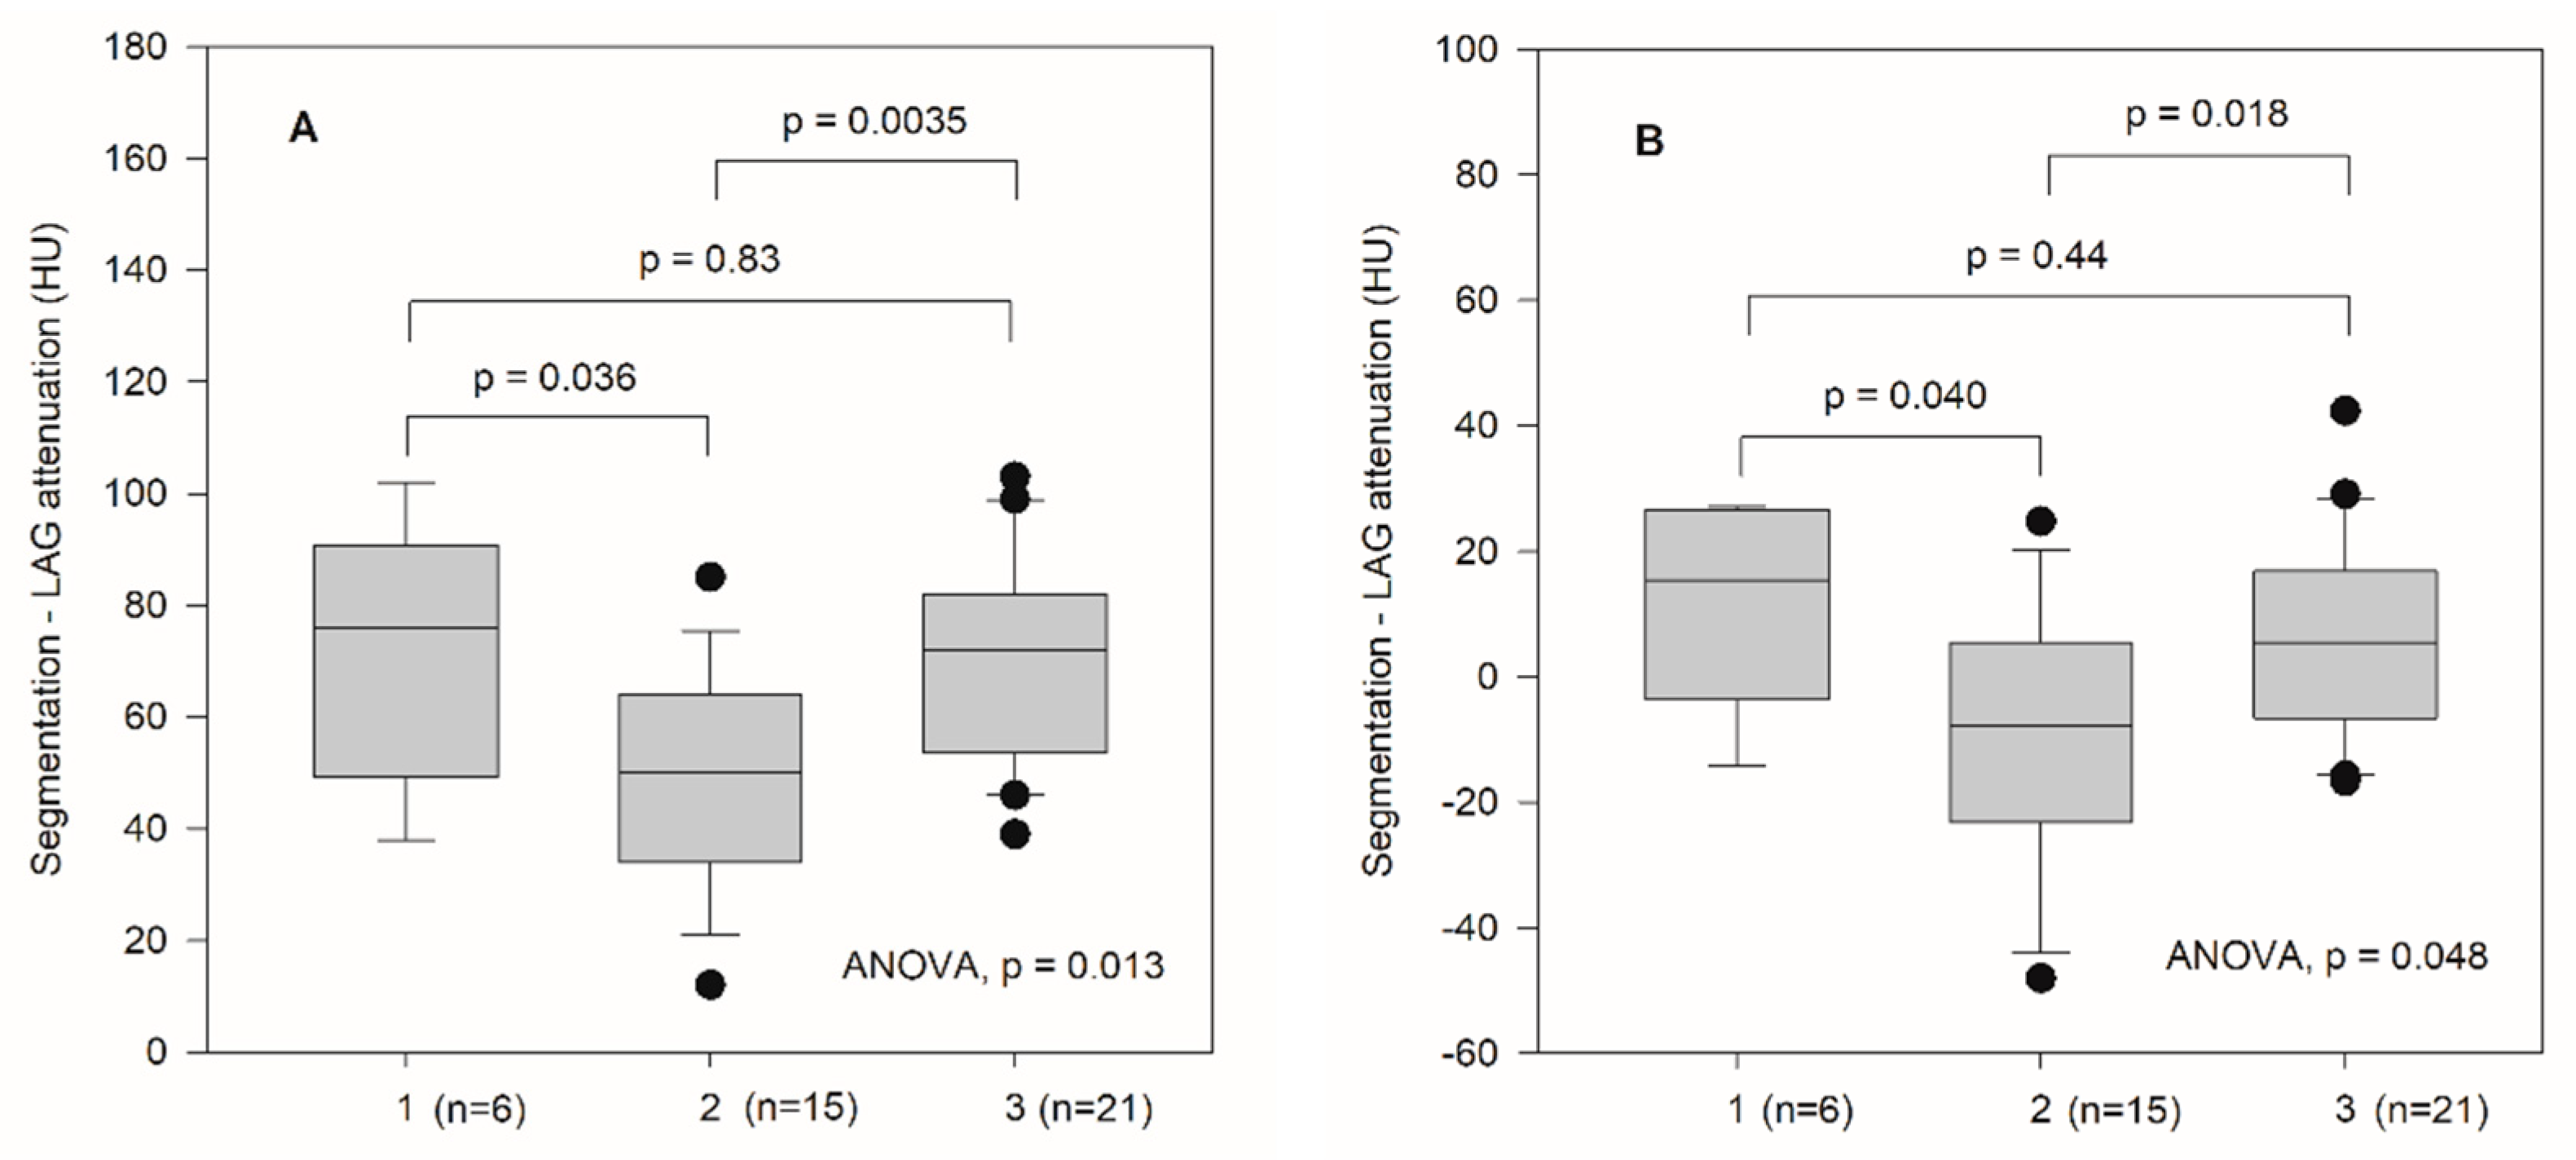
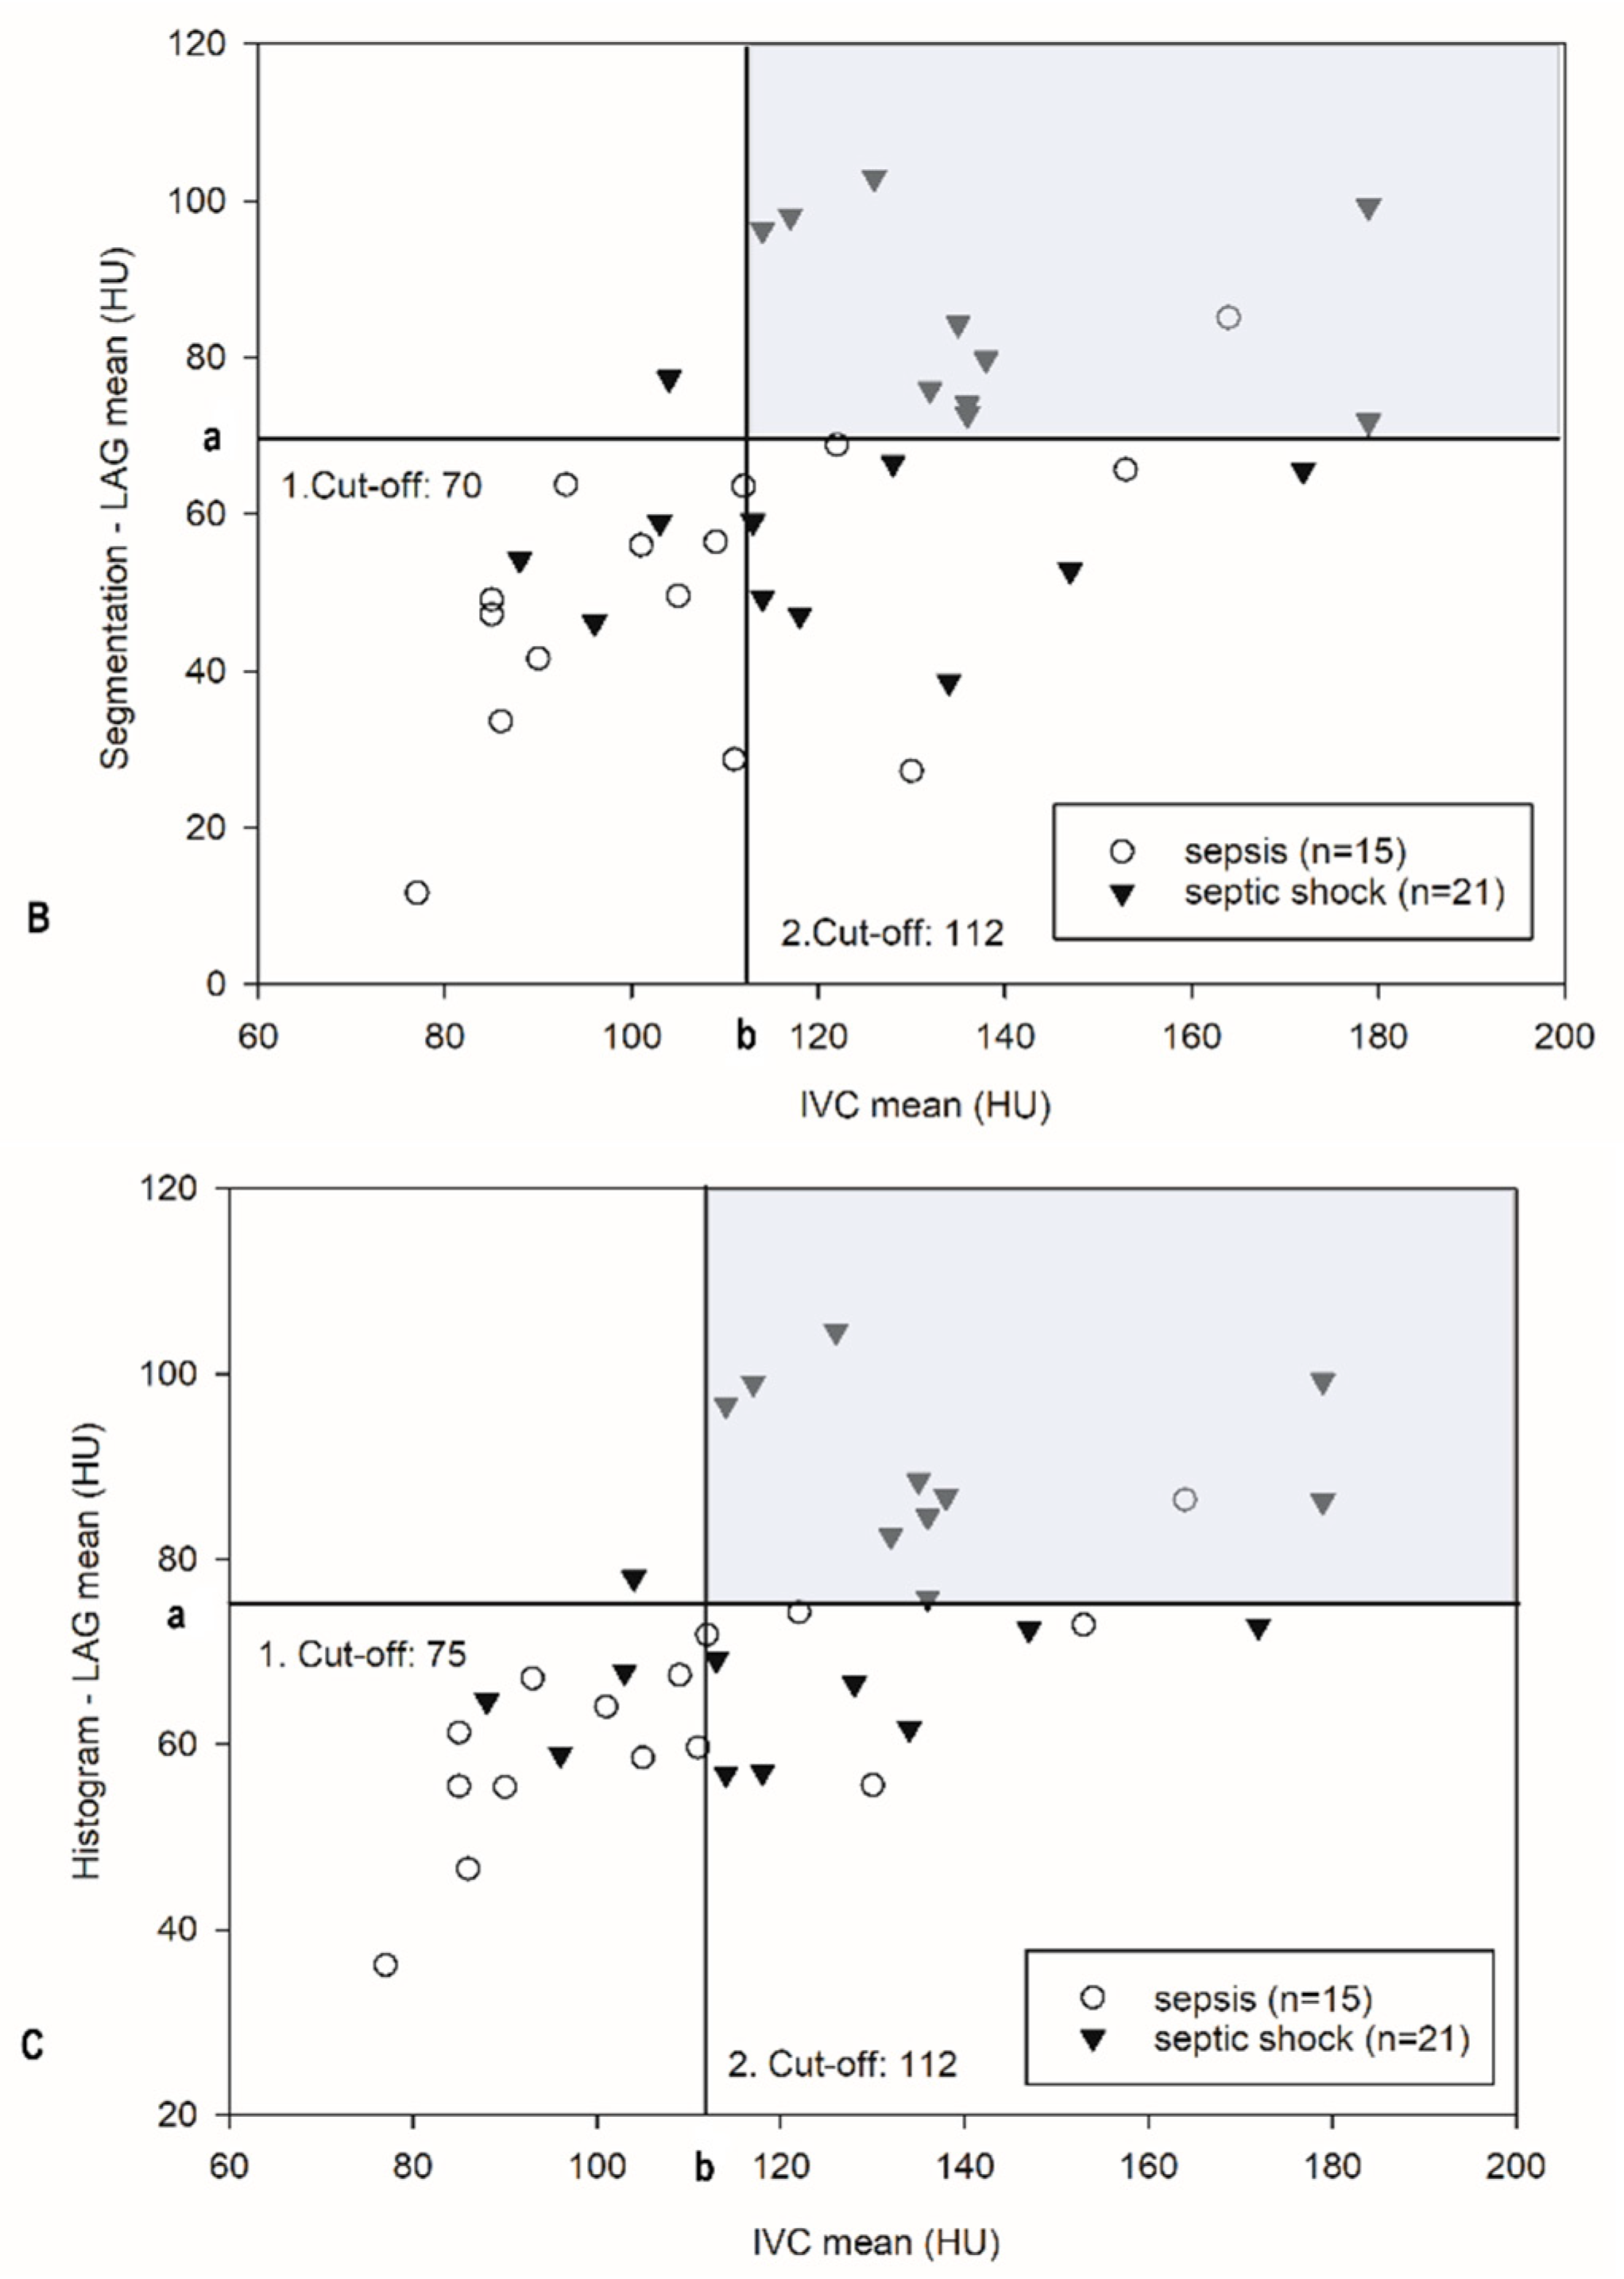
3.4. Method of Semi-Automated Organ Segmentation

Attenuation values (rounded) for segmentation with manual adjustments were as follows (that is, median (IQR)): no sepsis 76 (59 to 84); sepsis 49 (32 to 64); septic shock 69 (52 to 81). These values corrected for confounders were (median (IQR)): no sepsis 15 (2 to 26); sepsis −11 (−18 to 3); septic shock 5 (−7 to 16).
Figure 4A illustrates the distribution of absolute segmentation (HU) values for the LAG according to the different groups of sepsis severity at day 1 of their ICU stay. Between the groups for sepsis and septic shock—as demonstrated for the method of ROI—there was a significant difference in attenuation values for patients with septic shock (p = 0.0035), which remained significant after multiple testing correction (p = 0.013). The significant difference between groups 1 and 2 (p = 0.036) was no longer significant after multiple testing correction (p = 0.074).
Figure 4B illustrates the distribution of the corrected segmentation HU values, respectively. After correcting for confounders, the difference between mean attenuation values for the sepsis (2) and septic shock group (3) remained significant (p = 0.018), also after multiple testing correction (p = 0.048).
Adrenal segmentation volumes for both genders are presented in Table 2. Total adrenal gland volume on average increased around 20%, both between the “no sepsis” and septic shock group, and between the sepsis and septic shock group, but not between the no sepsis and sepsis group. The highest increase was around 26% for LAG volume between the “no sepsis” and septic shock group. RAG volume remained unchanged (±4−6%).
A small adrenal gland volume of the LAG in the septic shock group was associated with higher mortality, significant for the endpoints day 8 and 6 months. Figure 5A illustrates the receiver operating characteristic curve (ROC) correlating LAG volume and ICU mortality at day 8. A cutoff value of 4.7 cm3 provided a sensitivity of 70% and a specificity of approx. 82% for the risk of mortality during ICU stay. The likelihood ratio (LR) for death with a LAG volume of less than 4.7 cm3 was 3.85 (AUC = 0.80; p = 0.006). Figure 5B presents the ROC for LAG and mortality at 6 months with a sensitivity of approx. 73% and a specificity of around 83% at a cutoff value of 5.4 cm3. The LR for death with a LAG volume of less than 5.4 cm3 was 4.40 (AUC = 0.744; p = 0.035).

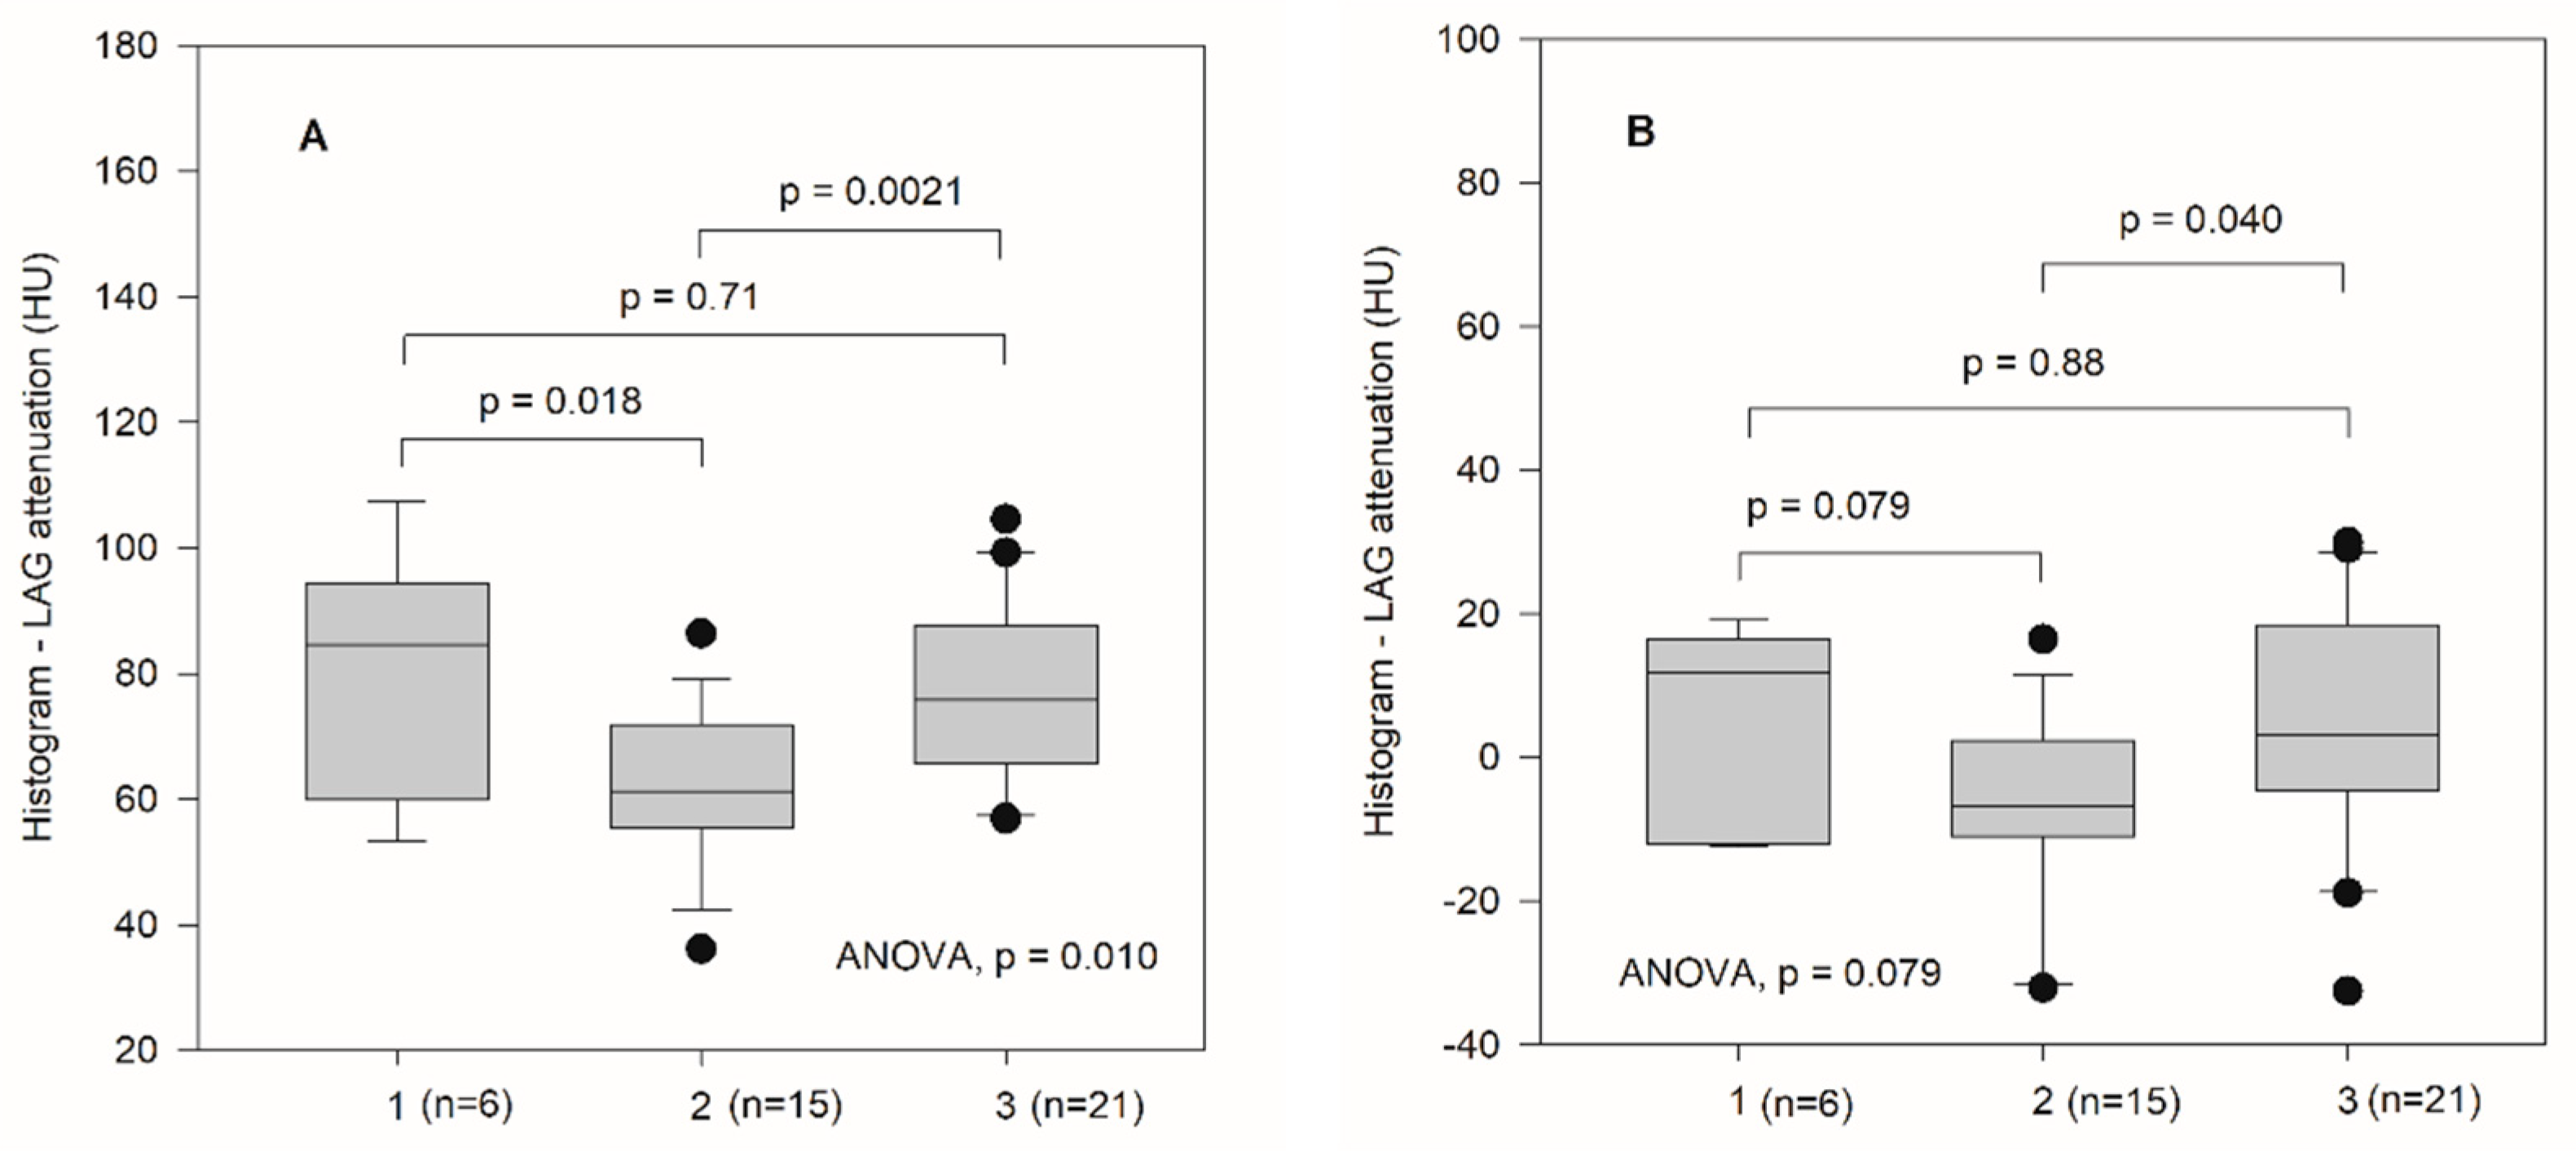
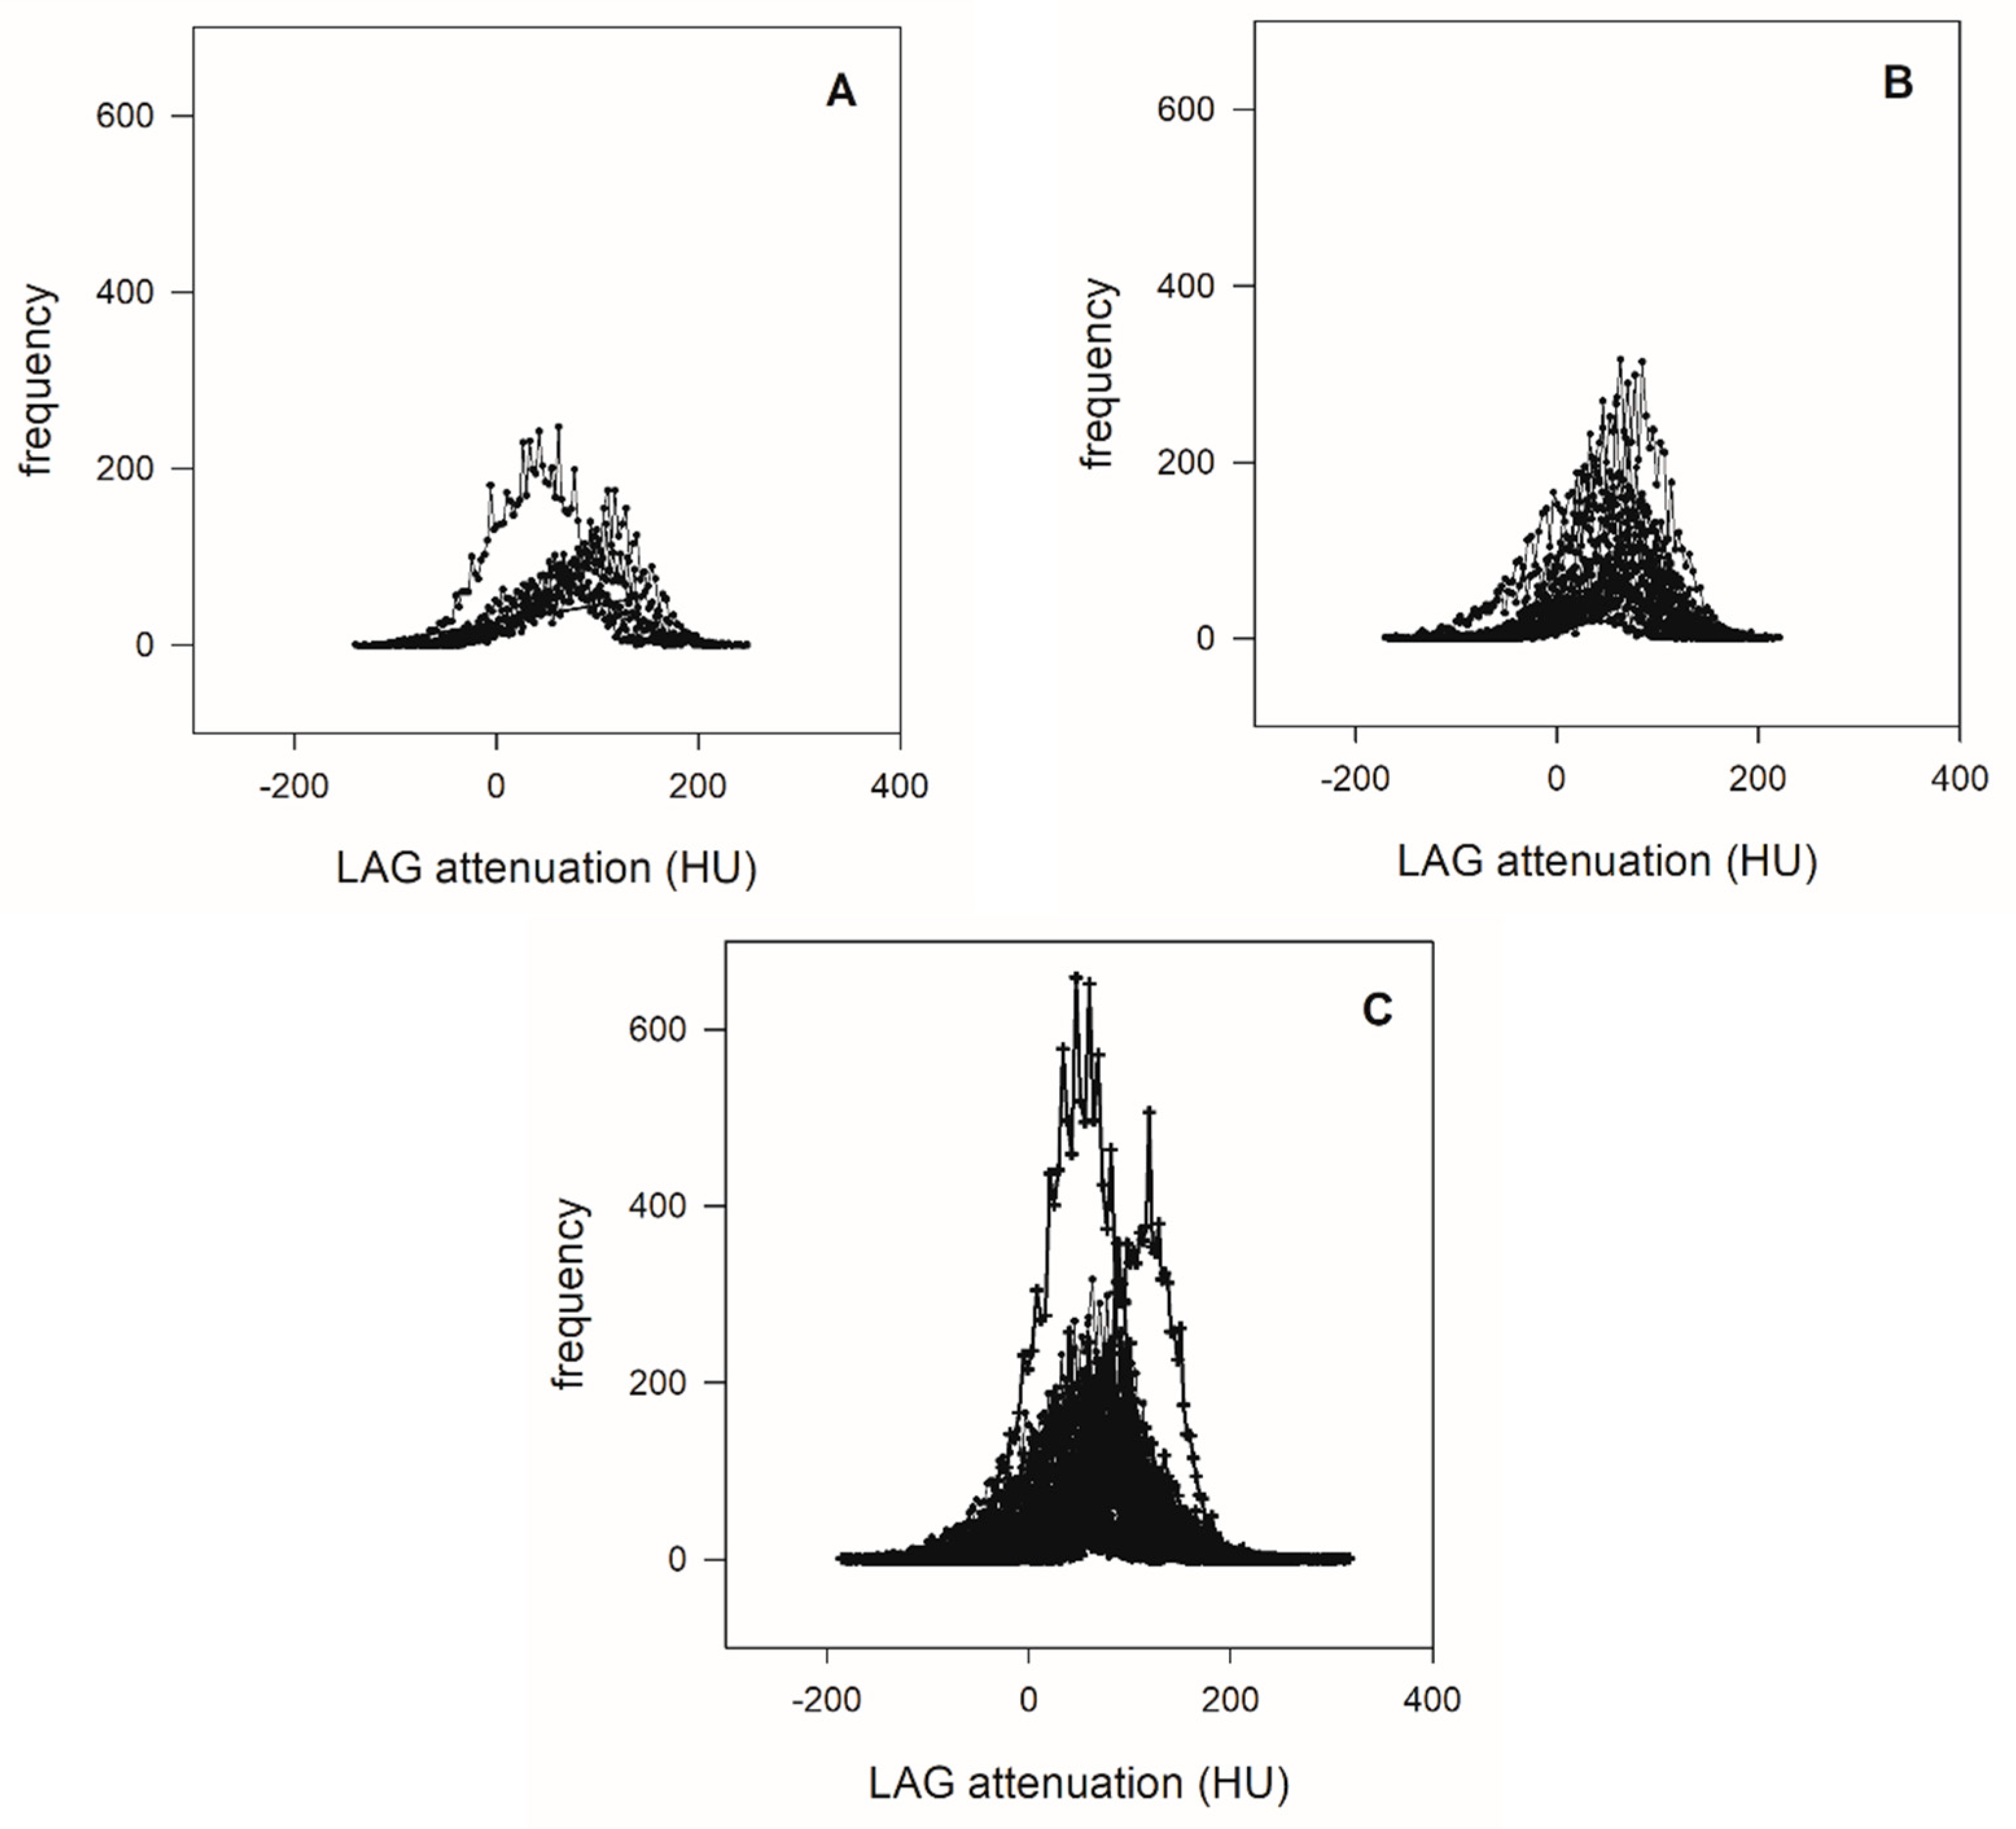
3.5. Histogram Analysis

Positive attenuation values for LAG (rounded) for histograms subsequent to organ segmentation were as follows (median (IQR)): no sepsis 106 (91 to 113); sepsis 91 (80 to 100); septic shock 102 (91 to 115). These values—corrected for confounders—were (median (IQR)): no sepsis 12 (−6 to 15); sepsis −6 (−11 to 2); septic shock 3 (−7 to 12).
Figure 6A illustrates the distribution of absolute histogram HU values (negative pixels excluded) for the LAG according to the different groups of sepsis severity at day 1 of their ICU stay. As with the methods of ROI and Segmentation, histogram attenuation values likewise showed a significant difference of mean attenuation values between the sepsis (2) and septic shock (3) group with higher attenuation values for patients with septic shock (p = 0.0021), which remained significant after multiple testing correction (ANOVA, p = 0.0010). The difference between the patients not classified with sepsis (1) and sepsis was also significant (p = 0.018) with higher attenuation values for the no sepsis group, which remained significant after multiple testing correction (p = 0.042). There was no difference between group 1 and 3 (p = 0.71).
Figure 6B illustrates the distribution of the corrected histogram HU values, respectively. The significant difference between mean attenuation values for the sepsis- (2) and septic shock (3) group (p = 0.040) was no longer significant after multiple testing (p = 0.079). There was no significant difference between the other groups (p = 0.079, p = 0.88).
The histograms grouped by septic condition are presented in Figure 7A–C. Histograms for the groups were the following: the no sepsis group had a range from −139 to 248 HU, mean attenuation of 72 HU, the sepsis group had a range from −171 to 221 HU, mean attenuation of 49 HU and the septic shock group had a range from −185 to 317 HU, mean attenuation of 71 HU.

3.6. Comparison of Image Analysis Methods

Considering the significantly lower range of data variation in LAG analysis, Table A1 (see Appendix A) presents the absolute and corrected mean attenuation values, as well as significant p-values for LAG for the three different methods of image analysis and the different groups classified by the Sepsis 3-criteria.
All of the methods showed a significant difference between attenuation values of the sepsis (2) and septic shock group (3), histogram analysis also between the no sepsis (1) and sepsis group (2) (p < 0.05). After correction for confounders, only the method of semi-automated segmentation remained significant (p = 0.048). None of the three image analysis methods performed in this study was able to differentiate between the groups, no sepsis (1) and septic shock (p > 0.05). For the comparison of goodness criteria, scatterplots of mean LAG density values in combination with mean density values of the IVC are presented for all methods of image analysis.

3.6.1. Region of Interest

A scatterplot of LAG uncorrected mean HU values assessed by ROI and the corresponding mean HU values of the inferior vena cava (IVC) for the sepsis and septic shock groups is illustrated in Figure 8A. Patients without septic conditions are excluded from this figure. The first cut-off-value of LAG mean values with a threshold of 90 HU or higher (a) resulted in a sensitivity of 55% with a specificity of 94% for patients with septic shock, with a positive predictive value (PPV) of 92% and a negative predictive value (NPV) of 60%. The second cut-off with a threshold of 112 IVC mean HU values or higher (b) provided a sensitivity of 82% and a specificity of 75%, with a PPV of 82% and a NPV of 75%. The combination of a and b (blue area) resulted in a sensitivity of 50% with a specificity of 100% (PPV = 100%; NPV = 59%). Twelve out of twenty-two (55%) patients with septic shock showed attenuation values of the LAG equal or above 90 HU. Nine of these twelve patients (75%) died (within a range of 1 to 55 days, mean 11 days).

3.6.2. Segmentation

A scatterplot of LAG uncorrected mean segmentation values HU and the corresponding mean values HU of the inferior vena cava (IVC) for the sepsis and septic shock groups is illustrated in Figure 8B. Patients without septic conditions are excluded from this figure. The first cut-off-value of LAG mean values with a threshold of 70 HU or higher (a) produced a sensitivity of 52% with a specificity of 92% for patients with septic shock, with a positive predictive value (PPV) of 92% (PPV = 92%; NPV = 58%). The second cut-off with a threshold of 112 IVC mean values HU or higher (b) provided a sensitivity of 81% and a specificity of 73% (PPV = 82%; NPV = 73%). The combination of a and b (blue area) resulted in a sensitivity of 48% with a specificity of 93% (PPV = 91%; NPV = 56%). Eleven out of twenty-one (52%) patients with septic shock showed attenuation values of the LAG equal or above 70 HU. Seven of these eleven patients (64%) died (within a range of 1 to 55 days, mean 12 days).

3.6.3. Histogram

A scatterplot of LAG uncorrected positive histogram attenuation values HU and the corresponding mean values HU of the inferior vena cava (IVC) for the sepsis and septic shock groups is illustrated in Figure 8C. Patients without septic conditions are excluded from this figure. The first cut-off-value of LAG mean values with a threshold of 75 HU or higher (a) produced a sensitivity of 52% with a specificity of 93% for patients with septic shock (PPV = 92%; NPV = 58%). The second cut-off with a threshold of 112 IVC mean values HU or higher (b) provided a sensitivity of 81% and a specificity of 67% (PPV = 77%; NPV = 71%). The combination of (a) and (b) (blue area) resulted in a sensitivity of 48% with a specificity of 93% (PPV = 91%; NPV = 56%). Eleven out of twenty-one (52%) patients with septic shock showed attenuation values of the LAG equal or above 75 HU. Nine of these eleven patients (82%) died (within a range of 1 to 55 days, mean 11 days).

4. Discussion

The aim of our study was to evaluate three different quantitative HU density analysis methods as well as the use of volumetry of adrenal glands, which could possibly provide quantitative values with discriminatory power allowing to differentiate between patients either with sepsis, with septic shock or not classified with sepsis and predicting their outcome.
The main findings of our study are three-fold: first, high mean density values of the left adrenal gland (LAG) alone or in combination with high mean density values of the Inferior Vena Cava (IVC) are highly specific for septic shock regardless of the method of image analysis (ROI, Segmentation, Histogram). Second, semi-automated segmentation of the LAG due to least data variation seems to have the highest discriminatory power to differentiate between sepsis and septic shock. It furthermore seems to provide additional short- and long-term prognostic value. Finally, and thirdly, we concluded that none of the three quantitative adrenal gland HU density analysis methods investigated in patients with septic conditions is capable to clearly differentiate between all sepsis stages.
Data variation between ROI and Histogram method was higher for RAG. Therefore, we limited analysis on LAG and suggest doing so when gathering quantitative data. Less HU value variation in LAG may be due to the anatomical proximity of the RAG to the liver, with consequently especially in slim or cachectic patients problems to avoid measuring liver density as partial volume. Another explanation of the differences between LAG and RAG would be due to the fact that the left adrenal veins drain into the left renal vein, while the RAG directly drains into the IVC. As a result, the LAG might be exposed to a higher pressure, thus be more prone to hyperplasia or adenomatous change [24].

4.1. Hyperattenuating Adrenal Glands and Sepsis

According to the definition of hyperattenuating glands by O’ Hara et al. [9] (adrenal density HU equal or greater than the inferior Vena Cava), only 2 out of our 44 patients (5%) showed hyperattenuating glands assessed by ROI. They both died after 1 and 4 days of ICU treatment. In our study population due to ROI analysis, 12 out of 22 (55%) patients with septic shock showed attenuation values of the LAG equal or above 90 HU. This cut-off was highly specific for septic shock (94%). Nine out of these twelve patients (75%) died. As for the methods of Segmentation and Histogram, numbers were similar (52% of septic shock patients above cut-offs, with 84%, respectively, 62% mortality). Therefore, we draw the conclusion that adrenal enhancement is an insensitive but highly specific CT sign in patients with septic shock, indicating poor prognosis, even if adrenal HU values are lower than those measured in IVC.
Several previous studies and case reports have described similar phenomena of hyperattenuating glands in severely ill patients, such as the fluctuating occurrence, its prognostic value and the issue of a generally admitted definition.
Rotondo et al. [25] retrospectively reviewed abdominal CT scans from 15 adult patients with clinical hypovolemia suffering from mostly blunt abdominal trauma. In this case study, none of these patients—of whom, all died within 24 h—showed increased adrenal enhancement. However, the definition of abnormal enhancement was subjective and the pathogenesis between their patient cohort with hypovolemic shock and our cohort with septic shock is different. Hence, patient populations and conclusions may not be comparable.
Cheung et al. [26] reported two patients with septic shock and adrenal enhancement with one of these two patients showing no other signs of visceral hypoperfusion. They concluded that persistent adrenal enhancement may only be observable in the early stages of septic shock, due to the initial adrenal stress response, but diminishes within its course due to circulatory failure worsened by vasoconstriction. However, they evaluated abdominal CT scans acquired during the arterial, and not during the portal-venous, phase for hyperenhancement and only had a small series of patients, so data are too limited to draw definitive analogies.
Bollen et al. [11] observed intense adrenal enhancement—defined as enhancement greater than adjacent vascular structures such as the inferior vena cava—in three out of thirty-eight (8%) patients with acute pancreatitis with early organ failure, proposing that hyperenhancing adrenals may be a new prognostic indicator for poor prognosis. The patients in this study represent a subgroup of our patient cohort, hence, study results are comparable.The shortcoming of their study is, again, the small series of patients, making data too limited to draw firm conclusions.

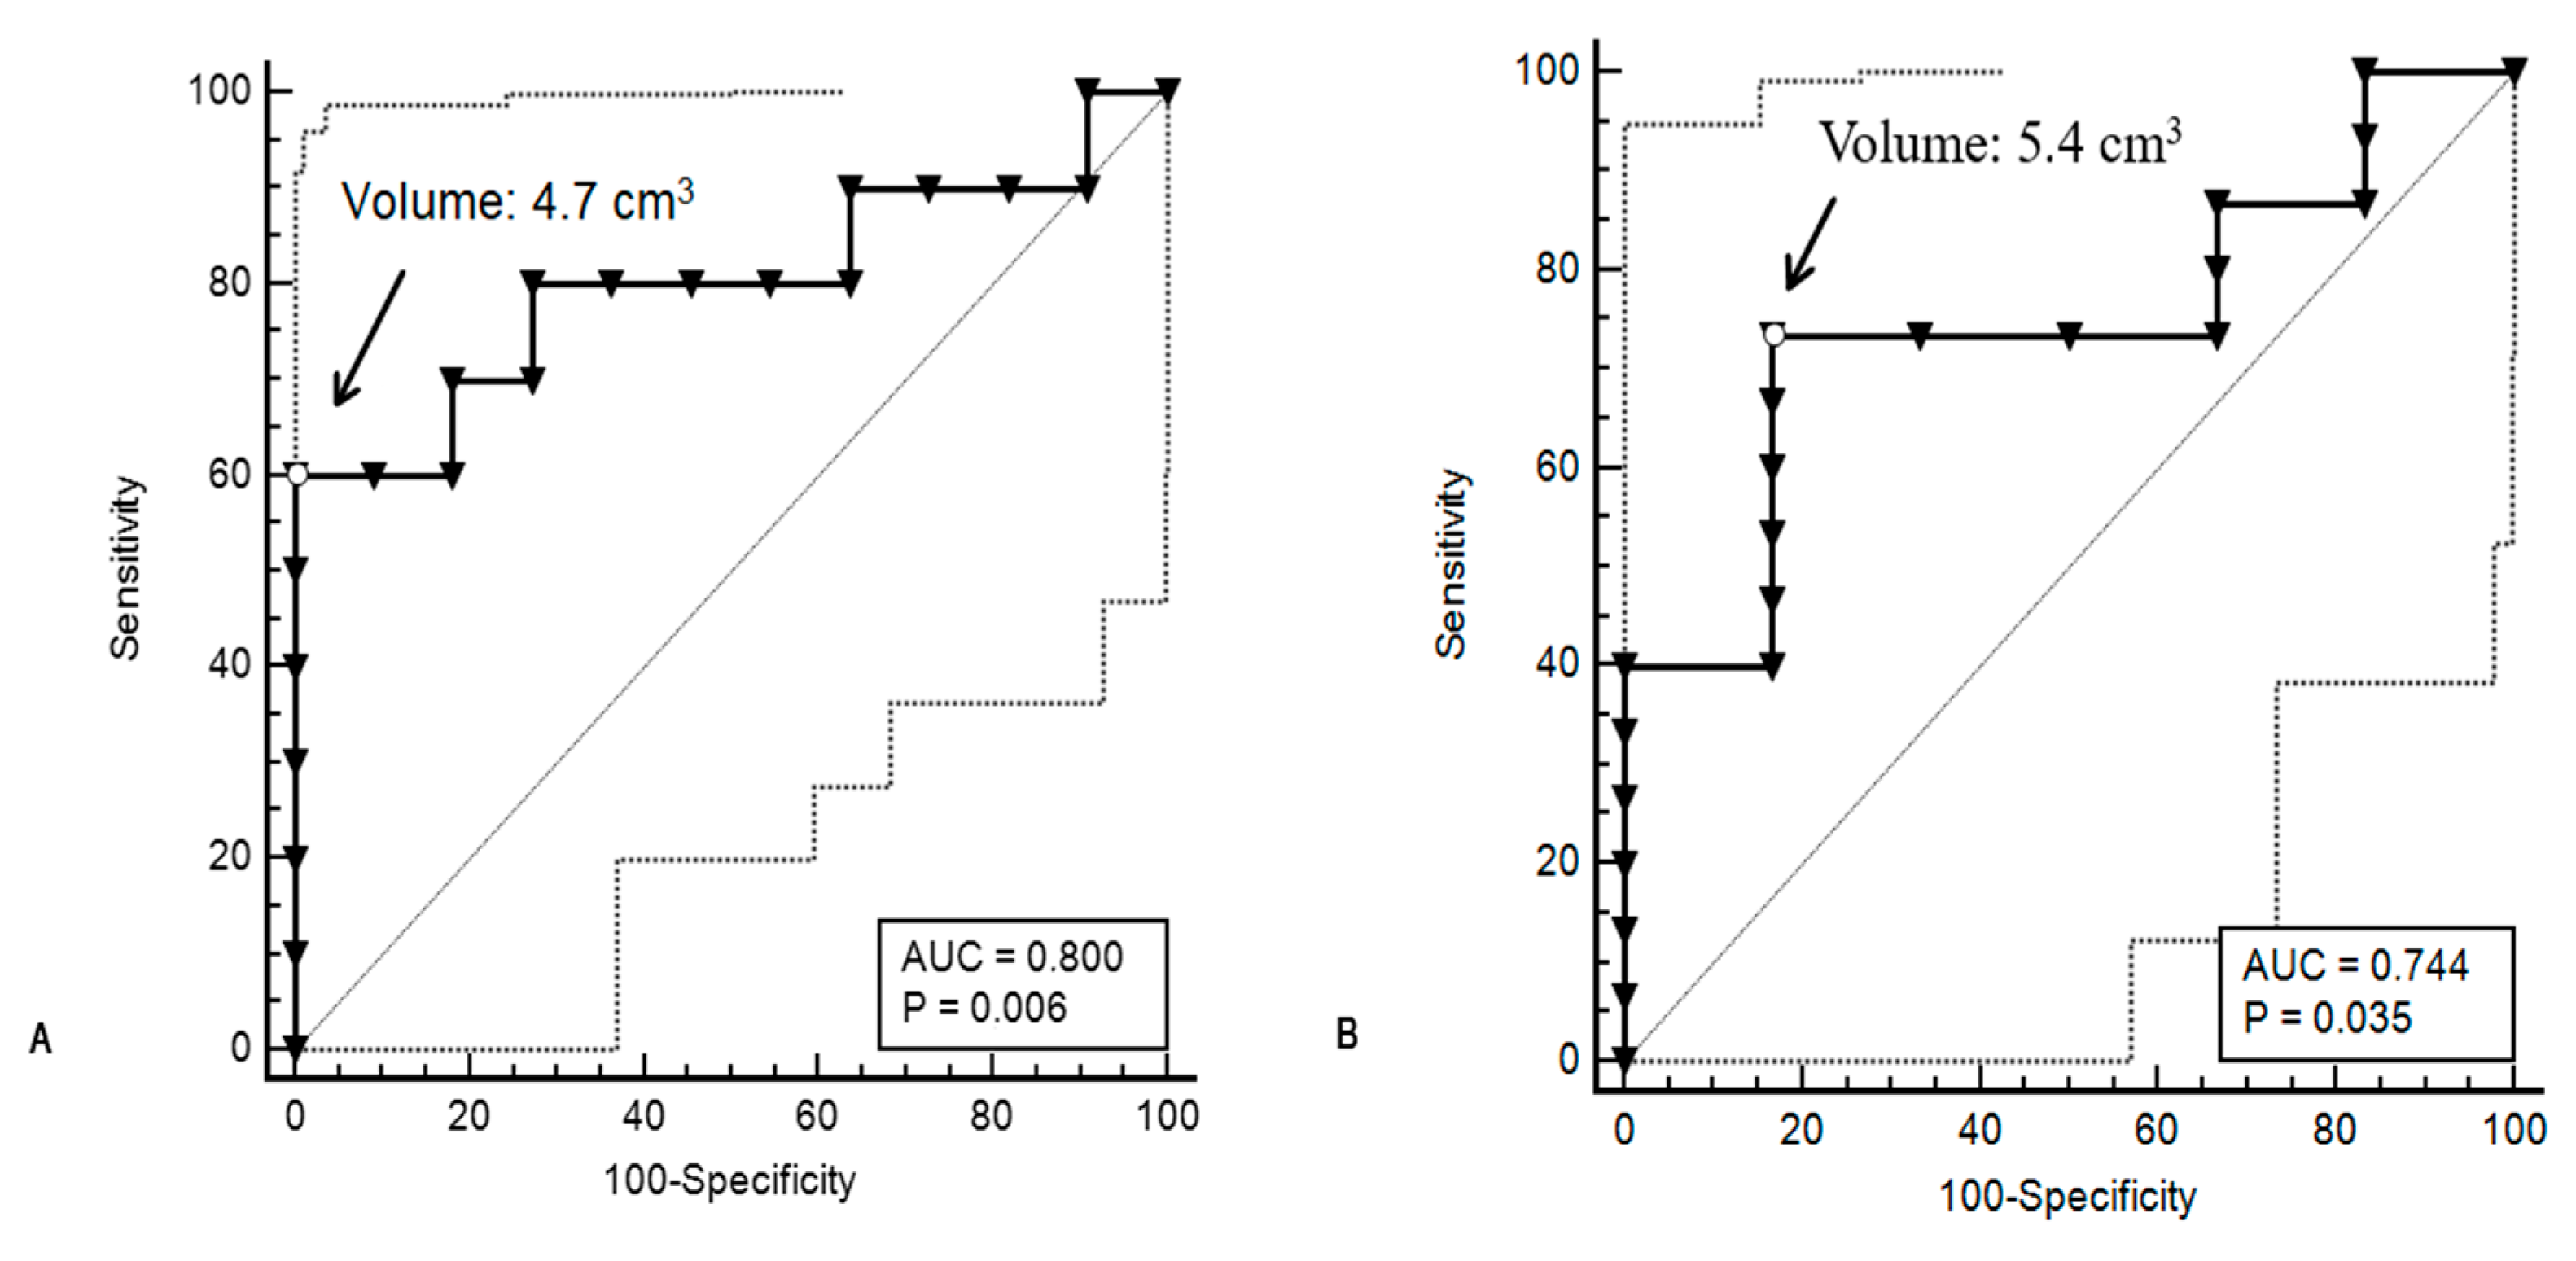
4.2. Adrenal Gland Volume and Septic Shock

Besides the qualitative or semiquantitative CT attenuation assessment of adrenal glands, the diagnostic and prognostic value for quantitative adrenal gland-derived data has been described, namely for adrenal gland volume assessed by segmentation in CT images. In the most severely affected patient group with septic shock, adrenal gland volume seems to be increased significantly and the absence of this enlargement in this subgroup, on the contrary, is associated with an even higher mortality [18,27,28].
One of the mechanisms involved in contributing to better outcomes for patients in septic shock that show adrenal gland enlargement, may be explained by the increased adrenal blood flow in septic conditions in combination with reduced venous drainage, resulting in an increased adrenal volume with a subsequent elevated hormonal response crucial to fight critical illness. However, this effect may only last for a limited time and be dependent on various individual conditions, since other studies have also shown that adrenal gland swelling may be caused by ischemia, edema, microbleeds or necrosis of adrenal glands and that only the early phase of sepsis may be associated with abnormal enlarged adrenals [12,18]. Additionally, Jung et al. [27] showed in their study that the enlarged adrenal glands of some septic shock patients were able to fully reover from their morphologic changes and others did not, underlining the importance of individual factors yet to be assessed in further studies. Although adrenal gland volume, according to our data, seems to be a promising prognostic factor in patients with septic shock, another recently published study by Mongardon et al. [29] suggests that adrenal gland volume is not an adequate surrogate for the outcome of patients with successful cardiopulmonary resuscitation after cardiac arrest, a state sometimes described as a “sepsis-like syndrome” [30].
To inquire about the correlation of hyperattenuating glands and circulatory failure, we plotted patients’ absolute mean values of the LAG with the corresponding values of the IVC. Our results showed that any of our image analysis approaches (ROI, Segmentation, Histogram) showed high specificity for the high mean values of the LAG, alone or in combination with the high mean values of the IVC for patients with septic shock. However, this seemingly only holds true when patients with severe courses of diseases other than septic shock are excluded. In our study population, the combination of ROI and IVC values seemed to provide the highest specificity for patients with septic shock with the least amount of time and effort spent on image analysis. However, this may not seem surprising, as patients with septic shock suffer from circulatory backward heart failure, resulting in retrograde accumulation of the i.v. contrast medium in the IVC with subsequent high attenuation values.
The results furthermore show a significant difference between LAG mean values of sepsis and septic shock groups, which remained significant after correction for confounders only for the analysis approach of AdSegmentation. However, we doubt that this promising finding could become relevant in daily clinical routine, as semi-automated segmentation is time-consuming and, at least in our study, no clear cut-offs could be determined. Surprisingly, the group with no septic conditions showed very high attenuation values, comparable to those of patients with septic shock. This, on the one hand, might be explained by the small number (n = 6) of patients not classified with sepsis, making it difficult to draw firm conclusions. On the other hand, these patients had severe courses of disease other than septic (e.g., myocardial infarction, central pulmonary embolism) with high adrenal attenuation values underlining once more the low sensitivity of adrenal hyperenhancement for septic conditions.
The lack of clear discrimination between the groups may be explained by the very dynamic nature of septic conditions as the maybe most important limiting factor of all: intense adrenal enhancement in adults may only be apparent in the early stages of shock, as vasoconstriction in subsequent stages of septic shock may not cause abnormal enhancement [26]. This would have ruled out our very severely affected patients with prolonged septic shock from positive correlation with high adrenal attenuation values, as overall adrenal enhancement decreases in late stages of circulatory failure.
Lastly, increased density values in adrenals are also measured during acute adrenal hemorrhage [31].

4.3. Limitations

The study design included a follow-up of six months, so a relatively high number of patients dropped out of this endpoint subanalysis, because the follow-up calls failed. These circumstances led to our final rather small study cohort of 44 patients. A larger number of study patients, in particular for the group without sepsis with six patients in it, would have been required to guarantee sufficient statistical power.
Each of our three different image analysis approaches had its pitfalls and limitations. First, drawing a ROI has the advantage of being a fast technique, easily avoiding partial volume effects or organ areas with artefacts [32]. The drawbacks are its high subjectivity and variability.
Second, semi-automatic whole-organ segmentation and volumetry is less subjective and more representative, but a time-consuming method, because of necessary manual adjustments. Among these were the removal of vascular structures, fatty tissue or the manual accurate demarcation of adjacent anatomical structures.
Third, while the main advantage of histogram analysis might be its objectivity, it is prone to deterioration of CT image quality and increased image noise. Several factors may have impacted image quality in our cohort, e.g., patients’ body physique and breathing artifacts, but also the parameters of tube voltage and tube current, collimation, slice thickness, reconstruction kernel, intravenous contrast medium injection flow rate and CT scan delay [20] are known to influence image quality. In our study, however, these limitations only applied to several patients in our study and led to study dropouts or influenced image quality, since not all of these parameters were standardized.
A major finding of our study is that the total adrenal volume computed by semi-automated segmentation seems to be increased by about 20% for patients with septic shock, and LAG volume even increased by around 26% percent. Furthermore, adrenal gland enlargement seems to provide prognostic value for patients with septic shock. We could replicate similar findings of previous studies [18,27,28] and even expand its prognostic value, suggesting that adrenal gland volume could serve as a surrogate for long-term mortality. In our study population, septic shock patients with no increase in LAG volume were approximately four-times more likely to die within eight days and even six months. Interestingly, the LAG volume of patients not classified with sepsis in comparison to those in septic shock, showed the highest difference in LAG volume (26%), although mean attenuation values were comparably high. Therefore, we assume that adrenal enlargement could be a pathomechanism specific for septic shock, not occurring in circulatory failure of another cause (e.g., coronary failure).
Nougaret et al. [28] made a similar assumption and hypothesized that increased adrenal gland volume could be a surrogate for a rather vital response during sepsis, unlike edema or necrosis of the gland. This phenomenon may be explained by the higher metabolic demand for cortisol and the compensatory mechanism for hypovolemia in patients with septic shock, that led to an increased blood flow to the adrenal glands and to their subsequent enlargement [9,18,19].
Jung et. Al. [27] showed that in septic shock, total adrenal gland volume was an independent prognostic factor for 28-day mortality. Their adrenal gland volume was nearly doubled in the septic shock groups in comparison with the nonseptic ambulatory group, and increased by 35% in comparison to the nonseptic ICU group. Viewing this data, we showed similar enlargement values (20%) for our septic shock group compared to the nonseptic ICU group and extended prognostic value of adrenal gland volume to long-term mortality for our follow-up of six months.
However, some limitations should be acknowledged. First, adrenal gland volume may be affected by factors like gender, weight, body surface area, race or even geographical regions. We did, however, not include any of these factors in our calculations. Furthermore, pre-existing conditions like depression and Cushing’s disease are also known to increase adrenal gland volume [12,24,28,33,34,35,36,37]. However, within our study population gender distribution was nearly equal and there were no patients with Cushing’s disease and only two patients with depression, one each from the sepsis and septic shock group, so that systematic bias seems unlikely.

5. Conclusions

This study demonstrates that there is no additional diagnostic value in performing time-consuming semi-automated whole-organ adrenal gland segmentation analysis in patients with sepsis or septic shock. High absolute CT density values assessed by simple ROI analysis—alone or in combination with IVC CT density assessemnt—may provide a high specificity for patients with septic shock, which could be used as an additional decision-making support in evaluating their health status and prognosis. A more time-consuming segmentation image analysis may deliver, however, additional prognostic value, as the adrenal gland volume in our cohort was generally increased in patients with septic shock whilst a smaller volume was associated with a higher mortality within the subgroup, even for the long-term survival of six months. For the method of histogram analysis of adrenal glands in patients with septic conditions, we do not see any diagnostic and/or prognostic value justifying time and effort in clinical routine. However, further studies with larger series of patients will be needed, to determine if these encouraging findings will find their way into clinical practice.

Author Contributions

Conceptualization, M.M. and S.J.; methodology, M.M., S.J., A.K., U.H. and M.B.; software, M.M., A.K. and S.J.; validation, M.M., S.J., A.K., M.B. and U.H.; formal analysis, A.K., M.M. and S.J.; investigation, U.H., M.B., S.J., L.L. and M.M; resources, S.J., U.H., M.B. and S.O.S.; data curation, M.M., S.J., A.K. and L.L.; writing—original draft preparation, M.M., S.J. and A.K.; writing—review and editing, S.J., A.K., M.B. and U.H.; visualization, M.M., A.K. and S.J.; supervision, S.J., S.O.S., U.H. and M.B.; project administration, S.J., S.O.S., U.H. and M.B.; funding acquisition, S.J. All authors have read and agreed to the published version of the manuscript.

Funding

This study was part of the research project SU 962/1-1 funded by the DFG (German Research Foundation) within the framework of the DFG Nachwuchsakademie “Kohortenstudien”. The funding source was not involved in the study design, collection, analysis and interpretation of data, in the writing of the report or the decision to submit the article for publication.

Institutional Review Board Statement

The study was conducted in accordance with the Declaration of Helsinki, and approved by the Ethics Committee of Medizinische Fakultät Mannheim (protocol code: 2011-384N-MA), date of approval: 28 March 2016.

Informed Consent Statement

This prospective single-center study at the University Medical Centre Mannheim (UMM), Germany, was approved by the local ethics committee of the UMM. A total of seventy-six patients were prospectively included into this study. Informed consent was obtained from all participating patients or their legal representatives.

Data Availability Statement

Not applicable.

Conflicts of Interest

The authors declare no conflict of interest.

Appendix A

Table A1. CT attenuation values HU of the left adrenal gland (LAG) for all methods of image analysis.
MethodsGroupsNo Sepsis (1)Sepsis (2)Septic Shock (3)
n = 6n = 16 (15)n = 22 (21)
Region of Interest (ROI)mean9014 *71−10 *965 *
median9724 *72.0−9 *902 *
IQR2623 *2317 *3939 *
p-value 1 < 0.05 p = 0.023
Segmentationmean7212 * 49−10 *715 *
median7615 *49−11 *695 *
IQR2524 *3221 *2923 *
p-value 1 < 0.05 p = 0.013/0.048 *
Histogrammean1016 *90−6 *1053 *
median10612 *91−6 *1023 *
IQR2121 *2113 *253 *
p-value 1 < 0.05 p = 0.042p = 0.010
* = Corrected for confounders: age, sex, evidence for presence of germs, creatinine, APACHE-Score, SOFA-Score; 1 = Bonferroni correction for multiple testing; IQR = Interquartile Range.

References

  1. Engel, C.; Brunkhorst, F.M.; Bone, H.-G.; Brunkhorst, R.; Gerlach, H.; Grond, S.; Gründling, M.; Huhle, G.; Jaschinski, U.; John, S.; et al. Epidemiology of sepsis in Germany: Results from a national prospective multicenter study. Intensive Care Med. 2007, 33, 606–618. [Google Scholar] [CrossRef] [PubMed]
  2. Sepsis und MODS; Springer: Berlin/Heidelberg, Germany, 2016.
  3. Rhodes, A.; Evans, L.E.; Alhazzani, W.; Levy, M.M.; Antonelli, M.; Ferrer, R.; Kumar, A.; Sevransky, J.E.; Sprung, C.L.; Nunnally, M.E.; et al. Surviving Sepsis Campaign: International Guidelines for Management of Sepsis and Septic Shock: 2016. Intensive Care Med. 2017, 43, 304–377. [Google Scholar] [CrossRef] [PubMed]
  4. Shankar-Hari, M.; Phillips, G.S.; Levy, M.L.; Seymour, C.W.; Liu, V.X.; Deutschman, C.S.; Angus, D.C.; Rubenfeld, G.D.; Singer, M.; for the Sepsis Definitions Task Force. Developing a New Definition and Assessing New Clinical Criteria for Septic Shock: For the Third International Consensus Definitions for Sepsis and Septic Shock (Sepsis-3). JAMA 2016, 315, 775–787. [Google Scholar] [CrossRef] [PubMed]
  5. Singer, M.; Deutschman, C.S.; Seymour, C.W.; Shankar-Hari, M.; Annane, D.; Bauer, M.; Bellomo, R.; Bernard, G.R.; Chiche, J.-D.; Coopersmith, C.M.; et al. The Third International Consensus Definitions for Sepsis and Septic Shock (Sepsis-3). JAMA 2016, 315, 801–810. [Google Scholar] [CrossRef] [PubMed]
  6. Lindner, H.A.; Balaban, Ü.; Sturm, T.; Symbol, C.W.B.; Thiel, M.; Schneider-Lindner, V. An Algorithm for Systemic Inflammatory Response Syndrome Criteria–Based Prediction of Sepsis in a Polytrauma Cohort. Crit. Care Med. 2016, 44, 2199–2207. [Google Scholar] [CrossRef]
  7. Vincent, J.L.; De Mendonça, A.; Cantraine, F.; Moreno, R.; Takala, J.; Suter, P.; Sprung, C.; FCCM; Colardyn, F.; Blecher, S. Use of the SOFA score to assess the incidence of organ dysfunction/failure in intensive care units: Results of a multicenter, prospective study. Crit. Care Med. 1998, 26, 1793–1800. [Google Scholar] [CrossRef]
  8. Schlegel, N.; Flemming, S.; Meir, M.; Germer, C.T. Is a different view on the pathophysiology of sepsis the key for novel therapeutic options? Chirurg 2014, 85, 714–719. [Google Scholar] [CrossRef]
  9. O’Hara, S.M.; Donnelly, L.F. Intense contrast enhancement of the adrenal glands: Another abdominal CT finding associated with hypoperfusion complex in children. Am. J. Roentgenol. 1999, 173, 995–997. [Google Scholar] [CrossRef] [Green Version]
  10. Schek, J.; Macht, S.; Klasen-Sansone, J.; Heusch, P.; Kröpil, P.; Witte, I.; Antoch, G.; Lanzman, R.S. Clinical impact of hyperattenuation of adrenal glands on contrast-enhanced computed tomography of polytraumatised patients. Eur. Radiol. 2014, 24, 527–530. [Google Scholar] [CrossRef]
  11. Bollen, T.L.; Dutch Acute Pancreatitis Study Group; Van Santvoort, H.C.; Besselink, M.G.H.; Van Ramshorst, B.; Van Es, H.W.; Gooszen, H.G. Intense adrenal enhancement in patients with acute pancreatitis and early organ failure. Emerg. Radiol. 2007, 14, 317–322. [Google Scholar] [CrossRef]
  12. Peng, Y.; Xie, Q.; Wang, H.; Lin, Z.; Zhang, F.; Zhou, X.; Guan, J. The hollow adrenal gland sign: A newly described enhancing pattern of the adrenal gland on dual-phase contrast-enhanced CT for predicting the prognosis of patients with septic shock. Eur. Radiol. 2019, 29, 5378–5385. [Google Scholar] [CrossRef] [PubMed]
  13. Kanczkowski, W.; Sue, M.; Zacharowski, K.; Reincke, M.; Bornstein, S.R. The role of adrenal gland microenvironment in the HPA axis function and dysfunction during sepsis. Mol. Cell. Endocrinol. 2015, 408, 241–248. [Google Scholar] [CrossRef] [PubMed]
  14. Goodwin, J.E.; Feng, Y.; Velazquez, H.; Sessa, W.C. Endothelial glucocorticoid receptor is required for protection against sepsis. Proc. Natl. Acad. Sci. USA 2013, 110, 306–311. [Google Scholar] [CrossRef] [PubMed] [Green Version]
  15. Turrin, N.P.; Rivest, S. Unraveling the Molecular Details Involved in the Intimate Link between the Immune and Neuroendocrine Systems. Exp. Biol. Med. 2004, 229, 996–1006. [Google Scholar] [CrossRef]
  16. Boonen, E.; Bornstein, S.R.; Berghe, G.V.D. New insights into the controversy of adrenal function during critical illness. Lancet Diabetes Endocrinol. 2015, 3, 805–815. [Google Scholar] [CrossRef]
  17. Boonen, E.; Berghe, G.V.D. Understanding the HPA response to critical illness: Novel insights with clinical implications. Intensive Care Med. 2015, 41, 131–133. [Google Scholar] [CrossRef]
  18. Chanques, G.; Annane, D.; Jaber, S.; Gallix, B. Enlarged adrenals during septic shock. Intensive Care Med. 2007, 33, 1671–1672. [Google Scholar] [CrossRef]
  19. Prasad, K.R.; Kumar, A.; Gamanagatti, S.; Chandrashekhara, S.H. CT in post-traumatic hypoperfusion complex—A pictorial review. Emerg. Radiol. 2010, 18, 139–143. [Google Scholar] [CrossRef]
  20. Bae, K.T.; Fuangtharnthip, P.; Prasad, S.R.; Joe, B.N.; Heiken, J.P. Adrenal Masses: CT Characterization with Histogram Analysis Method. Radiology 2003, 228, 735–742. [Google Scholar] [CrossRef] [Green Version]
  21. Halefoglu, A.M.; Yasar, A.; Bas, N.; Ozel, A.; Erturk, Ş.M.; Basak, M. Comparison of computed tomography histogram analysis and chemical-shift magnetic resonance imaging for adrenal mass characterization. Acta Radiol. 2009, 50, 1071–1079. [Google Scholar] [CrossRef]
  22. Spiriev, T.; Nakov, V.; Laleva, L.; Tzekov, C. OsiriX software as a preoperative planning tool in cranial neurosurgery: A step-by-step guide for neurosurgical residents. Surg. Neurol. Int. 2017, 8, 241. [Google Scholar] [CrossRef] [PubMed]
  23. Wolf, I.; Vetter, M.; Wegner, I.; Nolden, M.; Bottger, T.; Hastenteufel, M.; Schobinger, M.; Kunert, T.; Meinzer, H.P. The medical imaging interaction toolkit (MITK): A toolkit facilitating the creation of interactive software by extending VTK and ITK. In Medical Imaging 2004: Visualization, Image-Guided Procedures, and Display; International Society for Optics and Pho-tonics: 2004; SPIE: San Diego, CA, USA, 2014; Volume 5367, pp. 16–27. [Google Scholar]
  24. Wang, X.; Jin, Z.-Y.; Xue, H.-D.; Liu, W.; Sun, H.; Chen, Y.; Xu, K. Evaluation of Normal Adrenal Gland Volume by 64-slice CT. Chin. Med. Sci. J. 2012, 27, 220–224. [Google Scholar] [CrossRef]
  25. Rotondo, A.; Angelelli, G.; Catalano, O.; Grassi, R.; Scialpi, M.; Stellacci, G.; Derchi, L.E. Abdominal computed tomographic findings in adults with hypovolemic shock. Emerg. Radiol. 1997, 4, 10–15. [Google Scholar] [CrossRef]
  26. Cheung, S.; Lee, R.; Tung, H.; Chan, F. Persistent Adrenal Enhancement may be the Earliest CT Sign of Significant Hypovolaemic Shock. Clin. Radiol. 2003, 58, 315–318. [Google Scholar] [CrossRef]
  27. Jung, B.; Nougaret, S.; Chanques, G.; Mercier, G.; Cisse, M.; Aufort, S.; Gallix, B.; Annane, D.; Jaber, S. The absence of adrenal gland enlargement during septic shock predicts mortality: A computed tomography study of 239 patients. Anesthesiology 2011, 115, 334–343. [Google Scholar] [CrossRef] [Green Version]
  28. Nougaret, S.; Jung, B.; Aufort, S.; Chanques, G.; Jaber, S.; Gallix, B. Adrenal gland volume measurement in septic shock and control patients: A pilot study. Eur. Radiol. 2010, 20, 2348–2357. [Google Scholar] [CrossRef]
  29. Mongardon, N.; Savary, G.; Geri, G.; El Bejjani, M.-R.; Silvera, S.; Dumas, F.; Charpentier, J.; Pène, F.; Mira, J.-P.; Cariou, A. Prognostic value of adrenal gland volume after cardiac arrest: Association of CT-scan evaluation with shock and mortality. Resuscitation 2018, 129, 135–140. [Google Scholar] [CrossRef]
  30. Adrie, C.; Adib-Conquy, M.; Laurent, I.; Monchi, M.; Vinsonneau, C.; Fitting, C.; Fraisse, F.; Dinh-Xuan, A.T.; Carli, P.; Spaulding, C.; et al. Successful Cardiopulmonary Resuscitation After Cardiac Arrest as a “Sepsis-Like” Syndrome. Circulation 2002, 106, 562–568. [Google Scholar] [CrossRef]
  31. Venkatanarasimha, N.; Roobottom, C. Intense Adrenal Enhancement: A Feature of Hypoperfusion Complex. Am. J. Roentgenol. 2010, 195, W82. [Google Scholar] [CrossRef]
  32. Johnson, P.T.; Horton, K.M.; Fishman, E.K. Adrenal Imaging with Multidetector CT: Evidence-based Protocol Optimization and Interpretative Practice. Radiographics 2009, 29, 1319–1331. [Google Scholar] [CrossRef] [Green Version]
  33. Taner, A.T.; Schieda, N.; Siegelman, E.S. Pitfalls in Adrenal Imaging. Semin. Roentgenol. 2015, 50, 260–272. [Google Scholar] [CrossRef] [PubMed]
  34. Freel, E.M.; Nicholas, R.S.; Sudarshan, T.; Priba, L.; Gandy, S.J.; McMillan, N.; Houston, J.G.; Connell, J.M. Assessment of the accuracy and reproducibility of adrenal volume measurements using MRI and its relationship with corticosteroid phenotype: A normal volunteer pilot study. Clin. Endocrinol. 2013, 79, 484–490. [Google Scholar] [CrossRef] [PubMed]
  35. Grant, L.A.; Napolitano, A.; Miller, S.; Stephens, K.; McHugh, S.M.; Dixon, A.K. A pilot study to assess the feasibility of measurement of adrenal gland volume by magnetic resonance imaging. Acta Radiol. 2010, 51, 117–120. [Google Scholar] [CrossRef]
  36. Amsterdam, J.D.; Marinelli, D.L.; Arger, P.; Winokur, A. Assessment of adrenal gland volume by computed tomography in depressed patients and healthy volunteers: A pilot study. Psychiatry Res. 1987, 21, 189–197. [Google Scholar] [CrossRef]
  37. Pojunas, K.; Daniels, D.; Williams, A.; Thorsen, M.; Haughton, V. Pituitary and adrenal CT of Cushing syndrome. Am. J. Roentgenol. 1986, 146, 1235–1238. [Google Scholar] [CrossRef] [PubMed] [Green Version]
Figure 1. Flowchart of the final study cohort.
Anatomia 01 00003 g001
Figure 2. Variation of mean HU values for the left- (AC) and right adrenal gland (DF) comparing inter-methodical correlation of image analysis (HU: Hounsfield unit; ROI: Region of Interest).
Anatomia 01 00003 g002
Figure 3. Boxplot diagrams of absolute mean LAG attenuation values (A) for the method of ROI for patients not classified with sepsis (1), sepsis (2) and septic shock (3). Mean values were significantly different between sepsis (2) and septic shock (3) (p = 0.0020), also significant after multiple testing (p = 0.023); Boxplot diagrams for same values corrected for confounders * (B), showed differences between groups 2 and 3 (p = 0.022) and between groups 1 and 3 (p = 0.044), which were no longer significant after multiple testing (p = 0.104). (ANOVA: Analysis of Variance; LAG: Left adrenal gland; ROI: Region of Interest; * age, sex, evidence for presence of germs, APACHE and SOFA score).
Anatomia 01 00003 g003
Figure 4. Boxplot diagrams of absolute mean LAG attenuation values (A) for the method of segmentation for patients not classified with sepsis (1), sepsis (2) and septic shock (3). Significant difference between sepsis (2) and septic shock (3) (p = 0.0035), also significant after multiple testing (ANOVA, p = 0.013). Same mean attenuation values corrected for confounders * (B). The difference between sepsis (2) and septic shock (3) remained significant (p = 0.018) after multiple testing (ANOVA, p = 0.048). (ANOVA: Analysis of Variance; LAG: Left adrenal gland; ROI: Region of Interest; * age, sex, evidence for presence of germs, APACHE and SOFA score).
Anatomia 01 00003 g004
Figure 5. Receiver operating characteristic curve (ROC) between the left adrenal gland volume (NNL) and mortality at day 8 (A), showing a sensitivity of 70% and a specificity of around 82% with an AUC = 0.80 (p = 0.06) for a cutoff at 4.7 cm3. ROC for 6 months (B), with a sensitivity of 73% and a specificity of 83% with an AUC = 0.744 for a cutoff at 5.4 cm3 (p = 0.035).
Anatomia 01 00003 g005
Figure 6. (A) illustrates the distribution of absolute histogram HU values (negative pixels excluded) for the LAG according to the different groups of sepsis severity at day 1 of their ICU stay. As with the methods of ROI and Segmentation, histogram attenuation values likewise showed a significant difference of mean attenuation values between the sepsis (2) and septic shock (3) group with higher attenuation values for patients with septic shock (p = 0.0021), which was still significant after multiple testing correction (ANOVA, p = 0.0010). The difference between the patients not classified with sepsis (1) and sepsis was also significant (p = 0.018) with higher attenuation values for the no sepsis group, which remained significant after multiple testing correction (p = 0.042). There was no difference between group 1 and 3 (p = 0.71); (B) illustrates the distribution of the corrected histogram HU values, respectively. The significant difference between mean attenuation values of the sepsis (2) and septic shock (3) group (p = 0.040) was no longer significant after multiple testing correction (p = 0.079). There was no significant difference between the other groups (p = 0.079, p = 0.88).
Anatomia 01 00003 g006
Figure 7. Histograms separated by groups: no sepsis (A); sepsis (B); septic shock (C). Two patients with hyperattenuating glands show high frequencies with high attenuation values.
Anatomia 01 00003 g007
Figure 8. (A) A scatterplot of LAG uncorrected mean values HU assessed by ROI (A) and the corresponding mean values HU of the inferior vena cava (IVC) for sepsis and septic shock groups. Patients without septic conditions are excluded in this figure. First cut-off-value of LAG mean values with a threshold of 90 HU or higher (a) with a sensitivity of 55% and a specificity of 94% for patients with septic shock, with a positive predictive value (PPV) of 92% and a negative predictive value (NPV) of 60%. The second cut-off with a threshold of 112 IVC mean values HU or higher (b) with a sensitivity of 82% and a specificity of 75% (PPV = 82%; NPV = 75%. The combination of (a) and (b) (blue area) resulted in a sensitivity of 50% with a specificity of 100% (PPV = 100%; NPV = 59%); (B) A scatterplot of LAG uncorrected mean segmentation values (B) HU and the corresponding mean values HU of the inferior vena cava (IVC) for sepsis and septic shock. Patients without septic conditions are excluded in this figure. The first cut-off-value of LAG mean values with a threshold of 70 HU or higher (a) produced a sensitivity of 52% with a specificity of 92% for patients with septic shock, with a positive predictive value (PPV) of 92% (PPV = 92%; NPV = 58%). The second cut-off with a threshold of 112 IVC mean values HU or higher (b) provided a sensitivity of 81% and a specificity of 73% (PPV = 82%; NPV = 73%). The combination of (a) and (b) (blue area) resulted in a sensitivity of 48% with a specificity of 93% (PPV = 91%; NPV = 56%); (C). A scatterplot of LAG uncorrected positive histogram attenuation values HU and the corresponding mean values HU of the inferior vena cava (IVC) for sepsis and septic shock groups is illustrated in (C). Patients without septic conditions are excluded in this figure. The first cut-off-value of LAG mean values with a threshold of 75 HU or higher (a) produced a sensitivity of 52% with a specificity of 93% for patients with septic shock (PPV = 92%; NPV = 58%). The second cut-off with a threshold of 112 IVC mean values HU or higher (b) provided a sensitivity of 81% and a specificity of 67% (PPV = 77%; NPV = 71%). The combination of (a) and (b) (blue area) resulted in a sensitivity of 48% with a specificity of 93% (PPV = 91%; NPV = 56%).
Anatomia 01 00003 g008aAnatomia 01 00003 g008b
Table 1. Baseline characteristics.
No Sepsis (n = 6)Sepsis (n = 16)Septic Shock (n = 22)
Age, years (mean, range)74 (33 to 89)67 (19 to 87)63 (15 to 82)
Gender, n (%)
Male3 (50)11 (69)10 (46)
Female3 (50)5 (31)12 (54)
Site of infection, n (%)
Lung 4 (67)10 (63)15 (68)
Abdominal1 (33)2 (13)2
Urinary tract-1 (6)1
Skin --1
Heart-1 (6)1
Neck-1 (6)-
Blood---
Others-1 (6)-
Laboratory values, mean ± SEM
White blood cells, 109/L11.0 ± 1.611.5 ± 1.718.1 ± 3.2
Platelets, 109/L175.2 ± 39.8175.6 ± 26.4199.1 ± 30.2
Creatinine, mg/dL1.40 ± 0.32.0 ± 0.48.4 ± 6.6
C-reactive protein, mg/L152.2 ± 30.2188.4 ± 28.5153.8 ± 29.8
pCO2, mmHg34.1 ± 6.144.3 ± 2.343.9 ± 2.8
Lactate, mmol/L1.4 ± 0.21.3 ± 0.24.5 ± 0.4
Positive blood cultures, n (%)2 (33)10 (63)9 (41)
ICU parameters, mean ± SEM
ICU days15 ± 6.520 ± 413 ± 3
Ventilation days13 ± 6.410 ± 411 ± 3
Catecholamine days11 ± 5.611 ± 310 ± 3
Antibiotic treatment days12 ± 4.317 ± 412 ± 3
Renal replacement therapy days5 ± 4.12 ± 13 ± 1
GCS12 ± 27 ± 16 ± 1
APACHE II, mean ± SEM18 ± 422 ± 228 ± 1
SAPS II, mean ± SEM36 ± 640 ± 549 ± 3
SOFA score, mean ± SEM7 ± 29 ± 112 ± 1
All-cause mortality, n (%)
8 days
Death0 (0)4 (25)10 (46)
Survivor6 (100)12 (75)12 (54)
28 days
Death2 (33)6 (38)14 (64)
Survivor4 (66)10 (62)8 (36)
6 months
Death2 (33)6 (38)15 (68)
Survivor4 (66)10 (62)7 (32)
SEM: Standard error of the mean; GCS: Glasgow Coma Scale; APACHE II: Acute physiology and chronic health evaluation II; SAPS: Simplified acute physiology score II; SOFA: Sepsis related organ failure assessment.
Table 2. Adrenal volumes (cm3).
All PatientsNo SepsisSepsisSeptic Shock
n = 42n = 6n = 15n = 21
LAG4.3 ± 1.54.5 ± 1.95.8 ± 2.0
RAG4.7 ± 1.14.2 ± 1.74.5 ± 1.9
Total9.0 ± 1.39.1 ± 1.910.8 ± 2.1
LAG = Left adrenal gland; RAG = Right adrenal gland.
Publisher’s Note: MDPI stays neutral with regard to jurisdictional claims in published maps and institutional affiliations.

