Article

Identifying Priorities for the Development of Waste Management Systems in ASEAN Cities

by
Souphaphone Soudachanh
1,*,
Alessio Campitelli
2 and
Stefan Salhofer
1
1
Department of Water, Atmosphere and Environment, Institute of Waste Management and Circularity, University of Natural Resources and Life Sciences, Vienna (BOKU), Muthgasse 107, 1190 Vienna, Austria
2
Department of Material Flow Management and Resource Economy, Institute IWAR, Technical University of Darmstadt, Franziska-Braun Strasse 7, 64287 Darmstadt, Germany
*
Author to whom correspondence should be addressed.
Waste 2024, 2(1), 102-121; https://doi.org/10.3390/waste2010006
Submission received: 28 December 2023 / Revised: 16 January 2024 / Accepted: 1 February 2024 / Published: 21 February 2024
(This article belongs to the Special Issue Solid Waste Management and Environmental Protection)

Abstract

:
One of the largest issues facing countries, particularly emerging nations with high population, production, and consumption growth, is an inadequate waste management system (WMS). This paper analyzes the development of the waste management systems of nine capital cities in the Association of Southeast Asian Nations (ASEAN) region by using a recently developed approach, the Waste Management System–Development Stage Concept. This concept comprises five development stages and various components, including Collection and Transport, Waste Disposal, Energy Recovery, Waste Recycling, and Waste Prevention and Reuse. The findings indicate that in terms of waste collection, waste disposal, and energy recovery, Singapore is at a higher development stage (Stage 5) and is more advanced than other ASEAN cities. For most of the components, Bangkok, Jakarta, Kuala Lumpur, and Manila fall into stages 2 to 4, whereas the early development stages 1 to 3 are present in Bandar Seri Begawan, Hanoi, Phnom Penh, and Vientiane. The results will be used to determine the next steps in developing the WMSs, including the introduction of separate collection for recycling or the installation of a waste-to-energy plant. The environmental impact of each measure will be later assessed using the LCA approach, and the most effective measures shall be identified in future studies.

1. Introduction

With a high population growth rate and increasing urbanization, the Association of Southeast Asian Nations (ASEAN) is one of the fastest-growing regions in the world. As ASEAN’s economy expands quickly, an increasingly unsustainable trend can be seen in the region’s production and consumption patterns. Although production and efficiency are rising, ASEAN countries still have major challenges in improving their waste management [1].
In 2016, 243 million tons of waste were produced by just six ASEAN member states: Indonesia, Malaysia, the Philippines, Singapore, Thailand, and Vietnam. Only 47% of the waste produced in the ASEAN region is estimated to be collected, and only one-fourth of the amount collected is recycled [2]. Illegal waste disposal (such as open burning and open dumping) is still a serious issue, as it accounts for 34% of collected waste [2]. Illegal disposal causes negative impacts on the environment, including contamination of air, water, and soil, thereby posing a potential risk to human health [3]. Additionally, five ASEAN nations were listed among the world’s top 10 for poor handling of plastic waste, a significant contributor to marine littering [4].
Despite this, ASEAN countries such as Vietnam, Thailand, Indonesia, and Malaysia are among the top importers of plastic waste, as plastic waste shifted to Southeast Asia after China’s waste import ban in 2017 [5]. These countries also play a major role in plastic waste recycling, despite their inadequate waste management system. Furthermore, exporting waste to countries with lower energy and labor costs has aided unsustainable recycling practices in the informal context, with severe consequences in terms of human health and emissions to the environment [6].
Additionally, several tragic accidents have happened in ASEAN landfills in the past decades. The deadliest waste slide occurred in Payatas, the Philippines, in 2000; it killed 278 people. The second deadliest disaster in recorded history occurred in 2005, at the Leuwigajah dumpsite near Bandung, Indonesia; 141 people were killed, and 71 homes were buried by the waste slide [7].
However, landfills and dumpsites continue to be the predominant method of disposal in many ASEAN nations, despite the rise in popularity of waste-to-energy and the 3Rs (Reduce, Reuse, Recycle) strategy. Finding sustainable waste management solutions is challenging, particularly for the vast majority of low- and middle-income countries and their cities, where the majority of the waste management infrastructure needs improvement. To assist decision makers in creating policies that are most suitable for the local environment, it is necessary to identify the first-priority solution to the existing problem, which requires essential data in various dimensions.
In order to obtain the assessment overview of a waste management system (WMS), a number of assessment methods were developed in the past years and have been widely applied in many developed and developing countries and cities [8,9]. For instance, the Wasteaware Integrated Solid Waste Management Benchmark Indicators, an assessment method, provides an online tool and manual for users to evaluate and monitor the WMS performance of cities with key waste-related data, physical components, and governance factors [10]. The nine development bands of WMS allow users to determine the level of a WMS and its characteristics, difficulties, and crucial pressure points that are suitable for governance changes, investment strategies, and creating a development intervention [11]. A similar method can be found in the industry 4.0-based sustainable circular economy approach in which the WMS is categorized into levels, with circular economy (CE) representing the highest achievable level [12,13]. However, when it comes to an in-depth performance evaluation of a WMS, the Waste Management System–Development Stage Concept (WMS-DSC) provides an additional degree of detail and the explicit processes of each development stage. The approach can be used to evaluate a WMS for a variety of purposes, including determining the WMS’s current state to identify potential measures for implementation, determining whether the necessary system requirements for a given measure are met, tracking a WMS’s progress, and comparing WMSs from various cities [14].
Therefore, the objective of this study is to establish baseline data on the current state of waste management and conduct a comparison of the status quo among ASEAN cities by using the WMS-DSC approach. The outcomes of this approach, combined with life cycle assessment (LCA), will be used in later studies to evaluate the next steps in developing their WMSs.

2. Materials and Methods

In this study, WMS-DSC was used for in-depth assessment of the WMSs of the selected case studies. The WMS-DSC approach, WMS-DSC evaluation, and stage determination general information of case studies and the data acquisition are briefly discussed in this section.

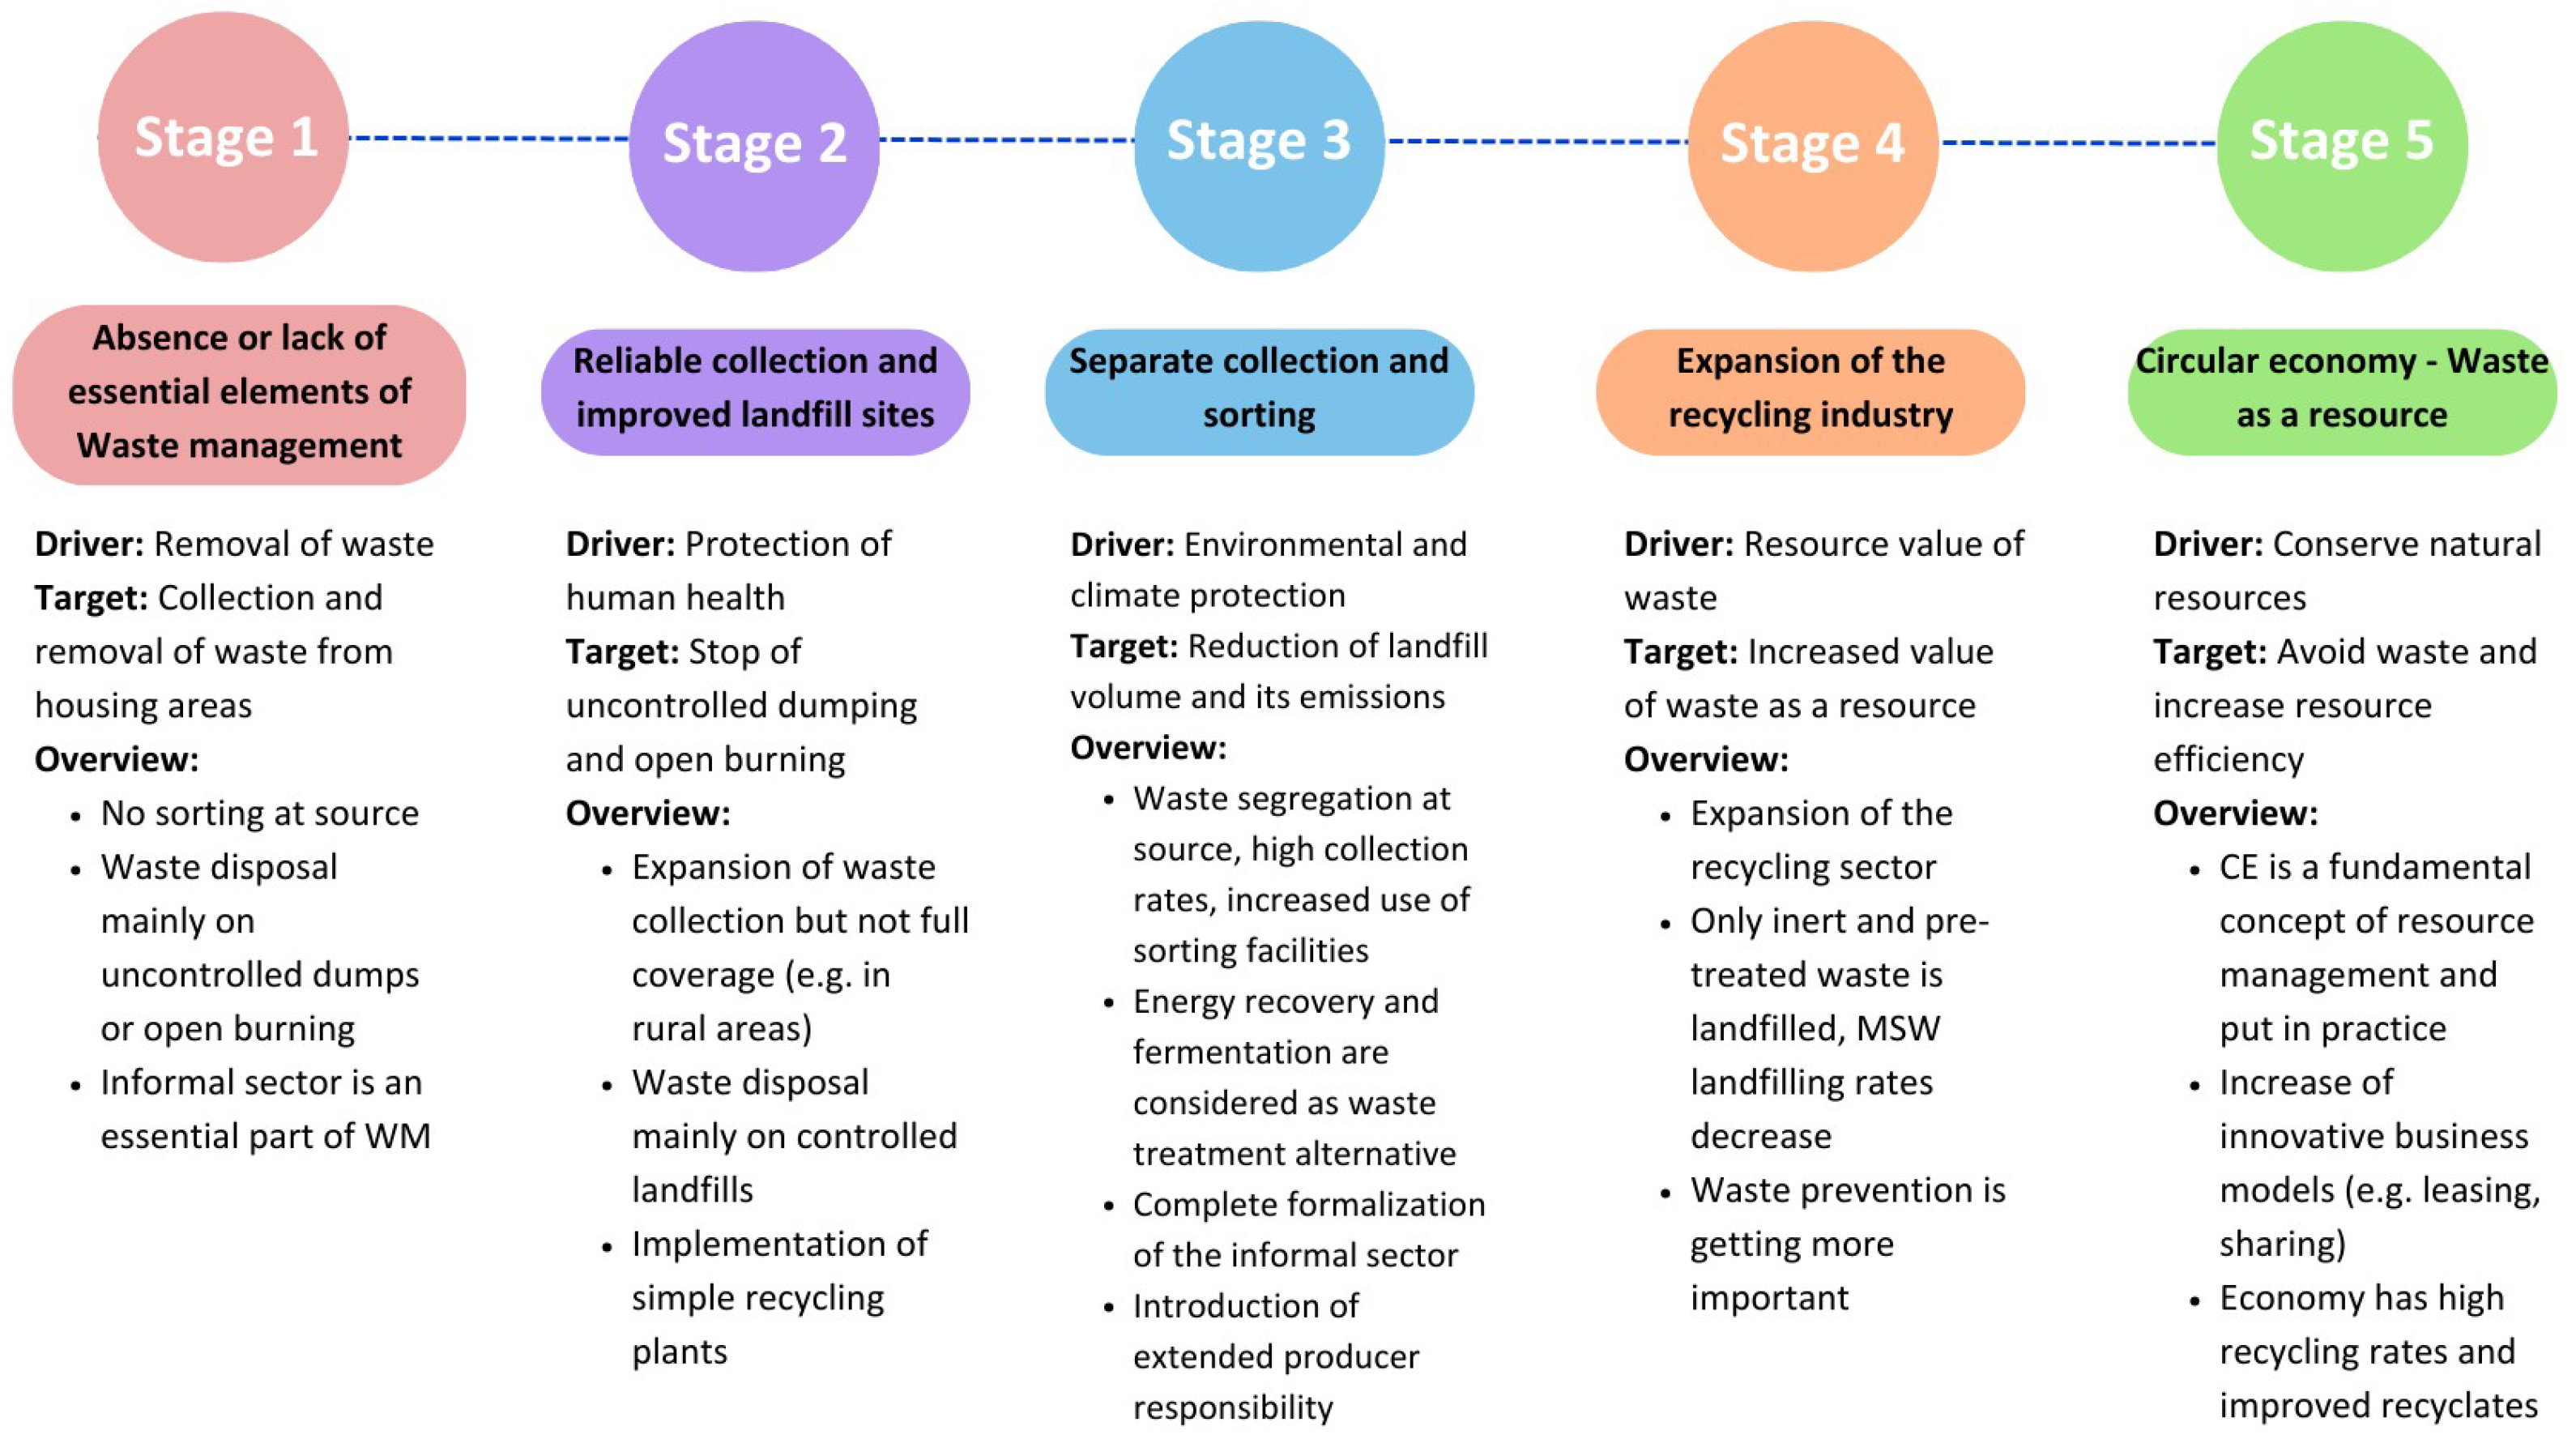
2.1. WMS-DSC Approach

When analyzing the development of WMSs through the years, some typical development stages become visible, ranging from the absence of essential elements of waste management to a CE model, where waste is seen as a resource. This paper analyzes the development of the WMSs for nine capital cities in the ASEAN region. This region has very dynamic characteristics, with similar cultures and lifestyles but distinct geographic constraints and economic development, leading to the diverse development of their WMSs.
To describe and analyze the development stages of these cities, a recently developed approach, WMS-DSC, was used [14]. WMS-DSC is built on five development stages (Figure 1), with stage 1 representing a WMS without essential waste management components and stage 5 illustrating a working CE. The WMS-DSC is relevant to all WMSs, whether urban or rural, and can be adapted to both Global South and Global North nations. It is designed for the evaluation of a WMS by practitioners and decision makers who are familiar with the WMS [14]. The development stages and their drivers and targets are detailed as follows:
  • 1st Stage: “Absence or lack of essential elements of waste management”
  • 2nd Stage: “Reliable collection and improved landfill sites”
  • 3rd Stage: “Separate collection and sorting”
  • 4th Stage: “Expansion of the recycling industry”
  • 5th Stage: “Circular economy—waste as a resource”
The WMS-DSC includes seven relevant waste management components, namely (1) Governance “G”; (2) Sector and market “SM”; (3) Collection and Transport “CT”; (4) Waste disposal “WD”; (5) Energy recovery “ER”; (6) Waste recycling “WR” and (7) Prevention and reuse “PR”. The concept’s structure enables the examination of a single WMS component (for example, collection and transport only), but it must be recognized that this restricts the concept’s ability to be considered as an entire system. However, due to the concept’s recent development, it has only been tested in a few Moroccan cities, including Marrakech and three others (Tétouan, Settat, and El Jadida), as well as the Ivorian city of Abidjan, as part of a master’s thesis for the Biotec2Future project [14]. In this study, only five components are taken into consideration by the authors because they primarily focus on the technical aspects of a WMS; the detailed components and subcomponents to be evaluated are shown in Table 1.

2.2. WMS-DSC Evaluation and Stage Determination

WMS-DSC approach provides the guidelines and template in excel format for each component to facilitate the users. Table 2 shows a single subcomponent of Collection and Transport component, which is CT.1 waste collection and its criteria from stage 1 to 5. To assign each city to the development stages, the evaluator needs to assess each subcomponent and its criteria with rational and source support and decide to select the criterion provided in the concept template. A single criterion is predesigned as a dropdown list consisting of m = met, pm = partially met, nm = not met, or na = not available, which can be assigned to each subcomponent by the evaluator. When statistics and information, like recycling rates, are only available at the national level and not the municipal level, it is possible to use the national data, and when that data is used, it is noted in the evaluation to increase transparency and traceability.
When all subcomponents have been assessed, the evaluator must present the findings by using the result summary, which displays the development stages’ status as met and partially met in a color-coded manner, as shown in Table 3. All subcomponents’ criteria must be ‘met’ in the stage section in order to be marked as ‘subcomponent is fully met’ and color-coded in ‘dark blue’ in the result overview. Once one of the subcomponents is determined to be partially met, the overall result will also reflect this as ‘subcomponent is partly met’ and color-coded in ‘light blue’. For other combinations that include ‘nm’ or ‘na’, the same rules apply for ‘subcomponent is partly met’.
When criteria of a subcomponent are met at several stages, it is not feasible to make an exact determination. Therefore, the range must be specified in this instance (e.g., “CT.1 falls within the range of stage 2 to stage 5”). If a WMS component spans multiple stages, it indicates that the development of the WMS component is in progress.

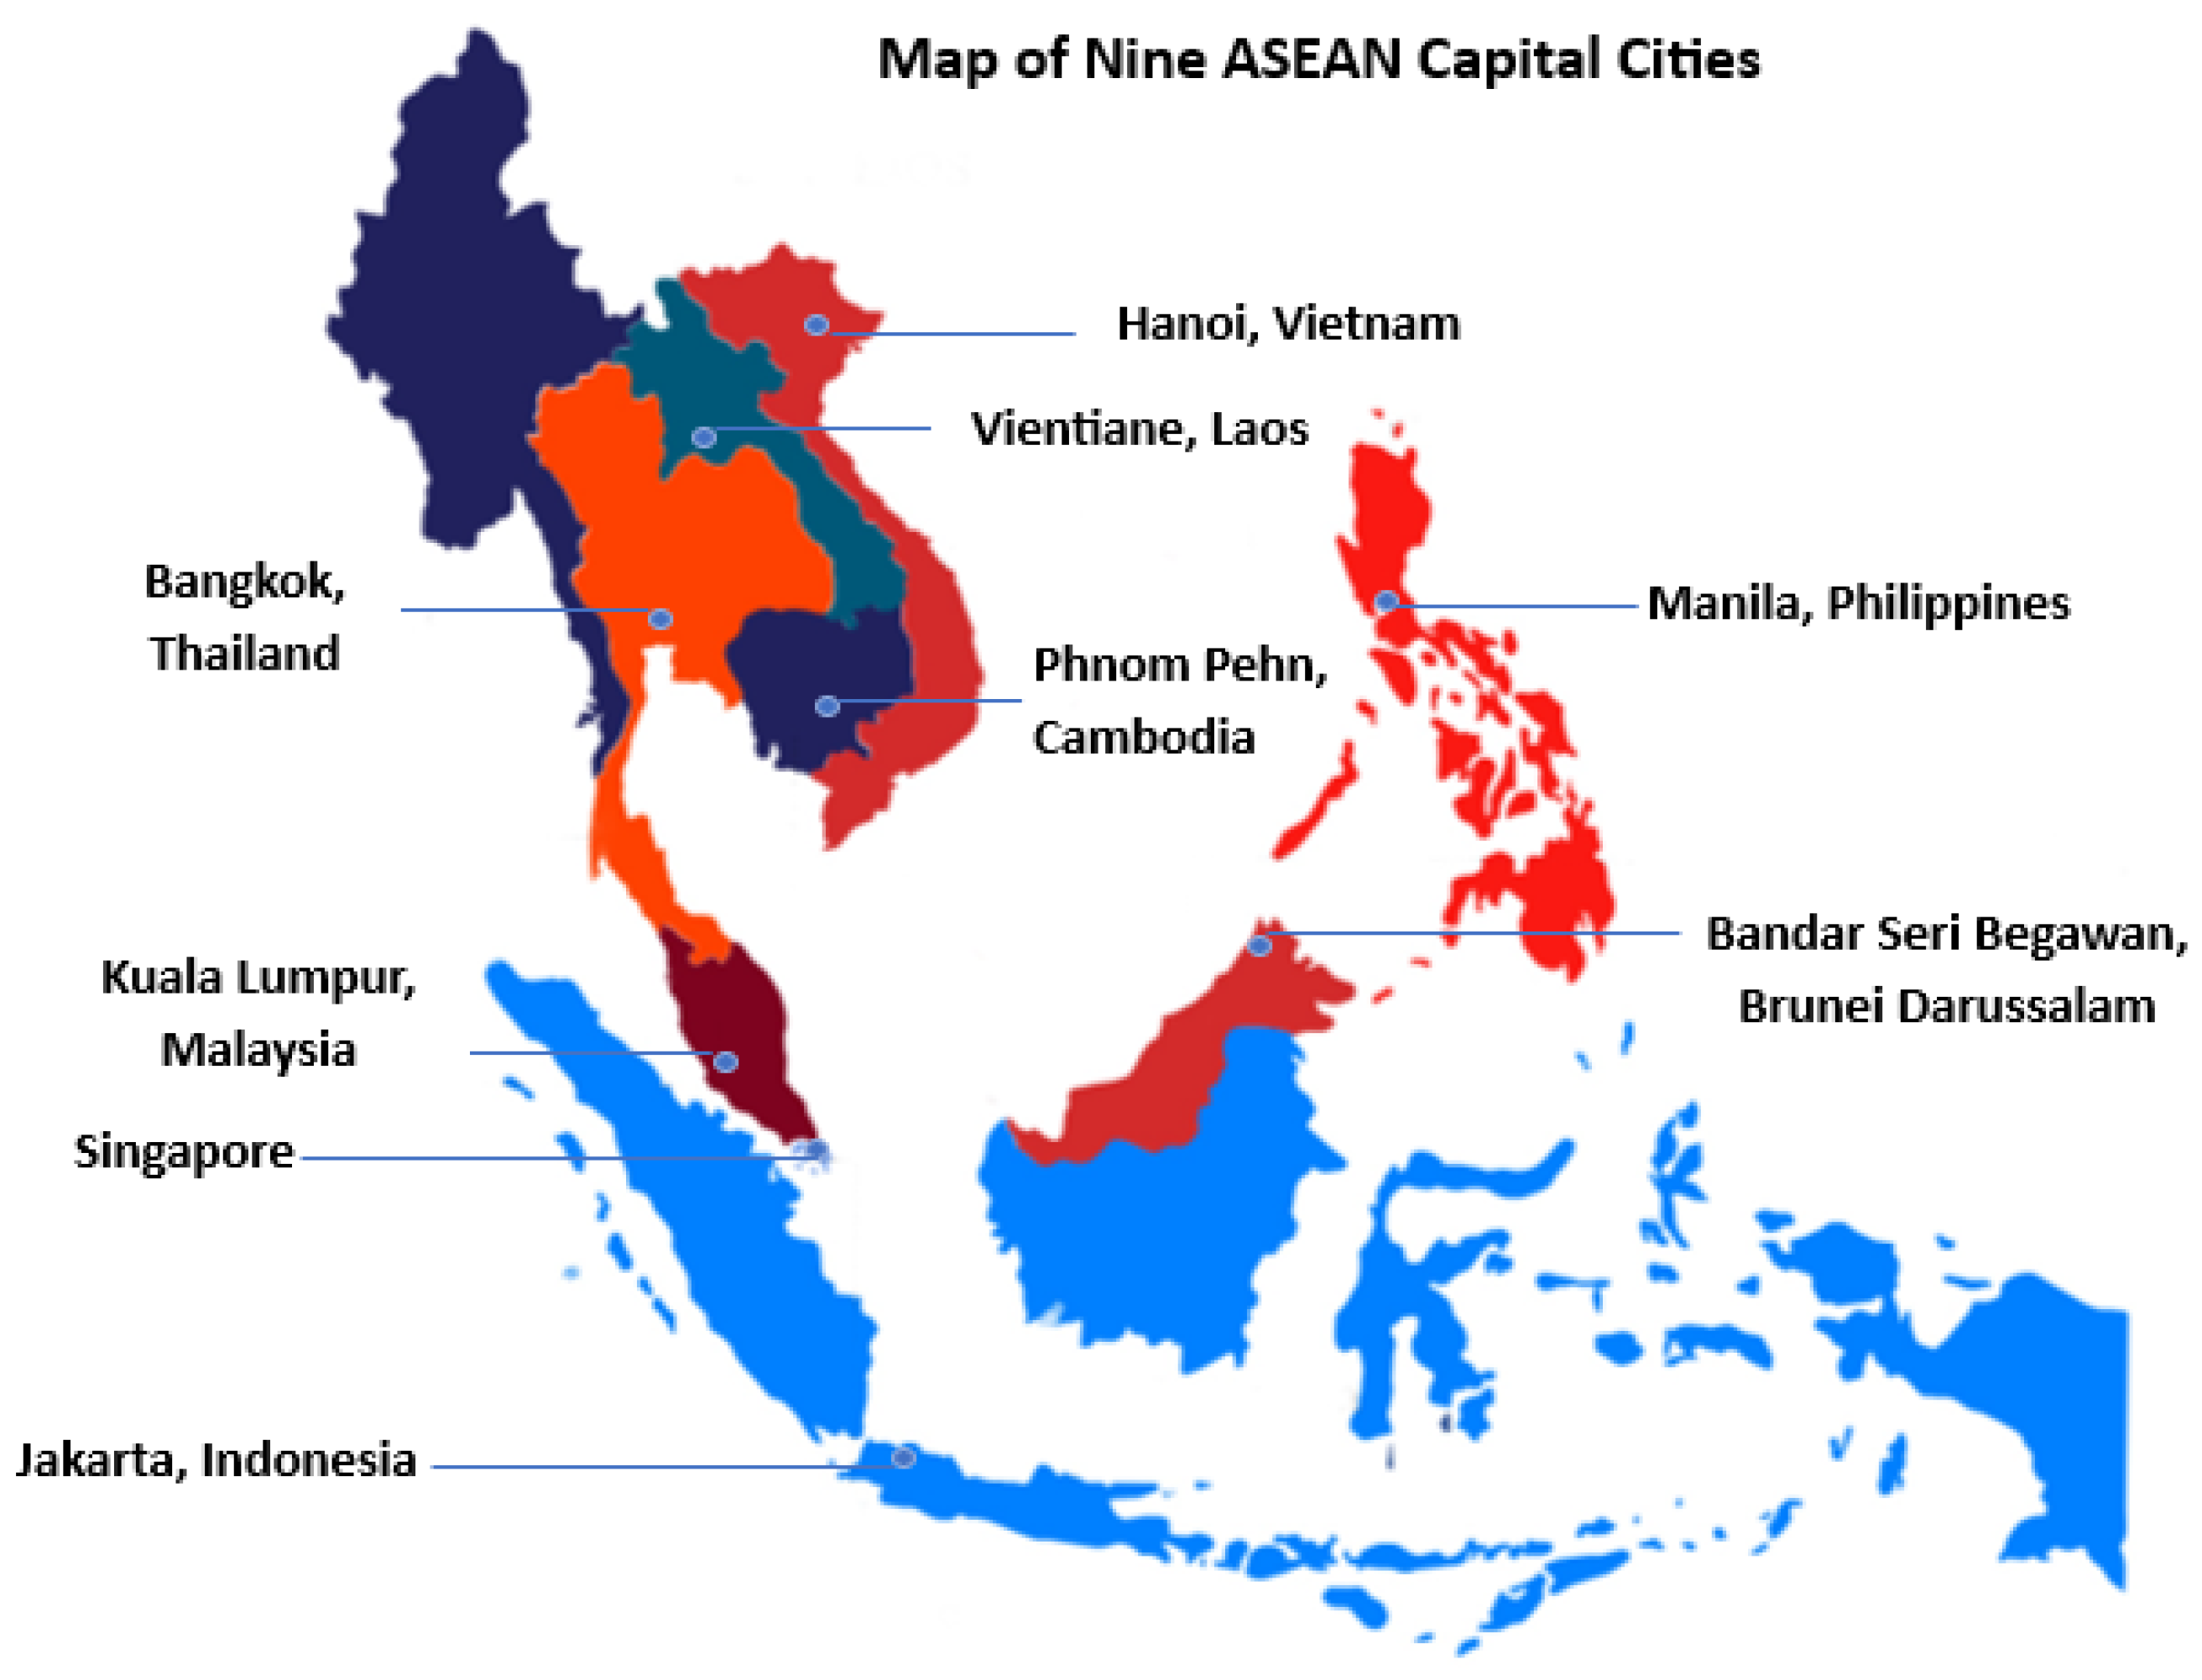
2.3. Overview of the Case Study

Due to data availability at both the city and country levels, only nine out of ten capital cities in the ASEAN region were selected for the assessment (Figure 2), namely Bandar Seri Begawan (Brunei Darussalam), Phnom Pehn (Cambodia), Jakarta (Indonesia), Vientiane (Laos), Kuala Lumpur (Malaysia), Manila (Philippines), Singapore, Bangkok (Thailand), and Hanoi (Vietnam).
The ASEAN cities are relatively diverse, ranging from small cities, like Bandar Seri Begawan and Vientiane, to mega cities, such as Bangkok, Jakarta and Manila. The cities’ income levels comprise lower-middle, upper-middle and high income levels. In addition, the waste generation rates range from 0.63 (Hanoi) to 1.21 (Kuala Lumpur) kg/cap/day and the collection rates in urban areas from <50% (Vientiane) to 100 % (Singapore). Detailed general information on the nine ASEAN cities is shown in Table 4.

2.4. Data Acquisition and Data Analysis

The data for this analysis were gathered through desk research. The authors compiled publicly available documents and material from the internet, such as reports and publications from local government websites, NGOs, relevant research papers, local waste companies, and articles. There are a number of official sites, articles, and research that are available in local languages such as Cambodian, Vietnamese, Malay, Indonesian, and Filipino. However, due to the diversity of official languages used in ASEAN cities and the authors’ linguistic limitations, only information available in English, Thai, and Laotian were considered in the analysis. The available data were, thereafter, utilized to analyze each component and its subcomponents using the WMS-DSC excel sheet provided by the approach’s developer [14]. As stated in the previous section, all criteria were subsequently assigned as met, partially met, not met, or not available. The excel document contains all of the sources utilized for the analysis, the results, and the stage ranking for each WMS (subcomponent). It also contains the reasoning behind the selection of each criterion. Detailed analysis and a list of the references for each city’s evaluation can be found in the Supplementary Documents.

3. Results

In this study, all components of the nine cities were analyzed and assessed. However, due to the complexity and volume, only one part of the full assessment is shown in detail in this result section, which is the component “CT” for Singapore. In addition, this section also presents the result overview of the nine ASEAN cities based on the following five components: “CT”; “WD”; “ER”; “WR”; and “PR”. The full details of the nine-city assessment can be found in the Supplementary Materials.

3.1. WMS Development Stage of Singapore

3.1.1. Collection and Transport (CT.1–CT.8)

The result overview of Collection and Transport (CT.1–CT.8) for Singapore are presented in Table 5. This section contains comprehensive and rational explanations.

CT.1 Waste Collection (Stage 2 to 5)

It was identified that subcomponent “CT.1 waste collection” for Singapore ranges from stage 2 to stage 5. The current state of CT.1 is described as follows.
Singapore’s waste collection is systematic and well organized with uniform bins. A regulation on waste littering has been established, and since 1 April 2012, public cleaning activities fall under the responsibility of the Department of Public Cleanliness, which was recently renamed the Division of Public Cleanliness and is under the National Environment Agency (NEA). The cleaning activities include sweeping, removal of debris and leaf litter, removal of bulky waste, litter picking, cleaning of bins, and de-silting of drains [31].
The waste collection is systematic and efficient; collection points are widely available within a distance of 200 m in different residential areas, condominiums, commercial areas, and public spaces. As Singapore has shifted from housing areas to high-rise apartment buildings, the chute system was introduced in the 1970s and the Central Refuse Chute was set up. NEA ensures that urban hygiene principles are met by continuously focusing and improving on three principles: cleaning of public areas, public education and enforcement [31].
Public waste collectors (PWCs) are contracted through NEA with competitive tender processes. Currently, there are three waste collection companies operating in different zones throughout the city. PWCs ensure efficient waste collection through various measures and concepts, including operational changes such as increasing the collection frequency during peak demands, cleaning up bins, and the use of new bin systems. Additionally, PWCs are routinely monitored by NEA to ensure efficiency, and financial penalties are imposed when necessary [32].
The collection companies provide the best available equipment and services in order to optimize the waste collection and disposal process. Relevant equipment includes mobile and fixed storage equipment, mobile garbage bins, smart bins for waste and recyclables, rear-end loader systems, open-top containers, and compactors. Furthermore, the companies also have several smart solutions in terms of waste collection, such as smart weighing scales, smart bins, smart stationary/mobile compactors, mini dumpsters, the Econic and driver fatigue alert systems [33].

CT.2 Service Provider (Stage 3 to 5)

Currently, municipal solid waste is mostly collected by the public sector and partially by the organized informal sector. PWCs are appointed by NEA through open tenders to serve domestic and trade premises in the different geographical sectors of Singapore. At present, three PWCs operate in Singapore, namely ALBA W&H Smart City Pte Ltd. (Singapore), SembWaste Pte Ltd.(Singapore) and 800 Super Waste Management Pte Ltd.(Singapore), and they serve in the six sectors which represent 99.9% of the population: Jurong, Woodlands-Yishun, Ang Mo Klo-Toa Payoh, Pasir Risbedok, Clementi-Bukit Merah, and City Punggol. There is also a service for bulky items, garden waste, and dead pets upon request [34].
Nonetheless, the semi-informal sector, the so called ‘Karung guni’, plays a significant role in the recyclables trade in Singapore and Malaysia. They are known for gathering discarded items such as e-waste, newspapers, metal cans, cardboard, textiles, toys, and pretty much anything else that is undesired but is seen as valuable. Although they may not have formal contracts with local authorities, they may have informal agreements and develop regular collection services with households and businesses to obtain recyclable materials, which they subsequently trade with recycling companies. Karung guni practitioners traditionally engage in door-to-door collecting, compensating households or businesses with cash or items in exchange for the recyclable materials [35].

CT.3 Collection Rates (Stage 5)

Nearly all municipal solid waste (100%) is collected in high-income nations and economies like Singapore [26].

CT.4 Separate Collection (Stages 2, 3 and 5)

Mixed municipal solid waste and recyclable waste, such as paper, plastic, and metal cans, are collected separately. The informal recycling sector plays an important role in the collection of recyclable waste. The informal sector, the government, and waste collection initiatives and campaigns, such as Reverse Vending Machine [36] and Cash for Trash stations [37], help to increase waste separation awareness and recycling rates.
In accordance with the National Recycling Program, which was introduced in April 2001, all housing and development board estates, private landed properties, condominiums, and private apartments that have decided to participate in the public waste collection program must provide recycling bins and recycling collection services [38].
Paper, glass, plastic, and metal recyclables are deposited in the same blue recycling bin and are collected in a separate truck without the mixed waste. The program encourages all residents to practice separation at the source. A materials recovery facility separates the mixed recyclables after collection. Recycling facilities further process the recyclable materials after sorting them. Despite this, the hospital and hazardous waste are collected separately [38]. However, there is no data regarding the rate of incorrect sorting.

CT.5 Collection of Recyclable (Stage 1)

Despite the high collection rate throughout the country, there are no data on recyclable material collection rates.

CT.6 Waste Transport (Stage 3 to 5)

The formal collection companies use collection trucks that are contemporary, automated, and equipped with compactors. They also use GPS technology to track collection performance, implement feedback mechanisms, and educate the public about how to keep the city clean. There are different waste trucks for different types of waste, and most of them are engineered and automated [33]. Information on the use of vehicles by the (organized) informal sector is not available. However, an assessment of the current waste collection system and vehicle use indicates that handcarts and animal carts are no longer used in Singapore.

CT.7 Transfer Station (Stage 5)

Non-incinerable waste and ash from waste-to-energy plants are first gathered at the Tuas Marine Transfer Station before being transported to the Semakau Landfill. The transfer station was constructed at the same time as the Semakau Landfill and is located near the Tuas South Incineration Plant. All incoming licensed collection vehicles carrying non-incinerable waste are weighed at the weighbridges before being allowed to enter the transfer building. TMTS is a state-of-the-art transfer station [39].

CT.8 Collection of Hazardous Waste (Stages 2 to 4)

There is an adequate collection of hazardous waste; however, there is no data on whether the quantity of hazardous waste is reduced to the minimum. At the household level, people are encouraged to separate hazardous waste, like end-of-life batteries and other electronic waste. There are a number of collection points throughout the city, such as ALBA e-waste recycling bins in public areas, retailer in-store collection services, bulky collections, and doorstep collections by ALBA with a fee [40]. The transportation, treatment, and disposal of industrial hazardous waste are currently under the responsibility of the Environmental Public Health [41].

3.2. WMS Development Stages of ASEAN Cities

In the following sub-chapters, the results of the nine ASEAN cities under study are presented and compared with each other based on five technical components of the WMS-DSC.

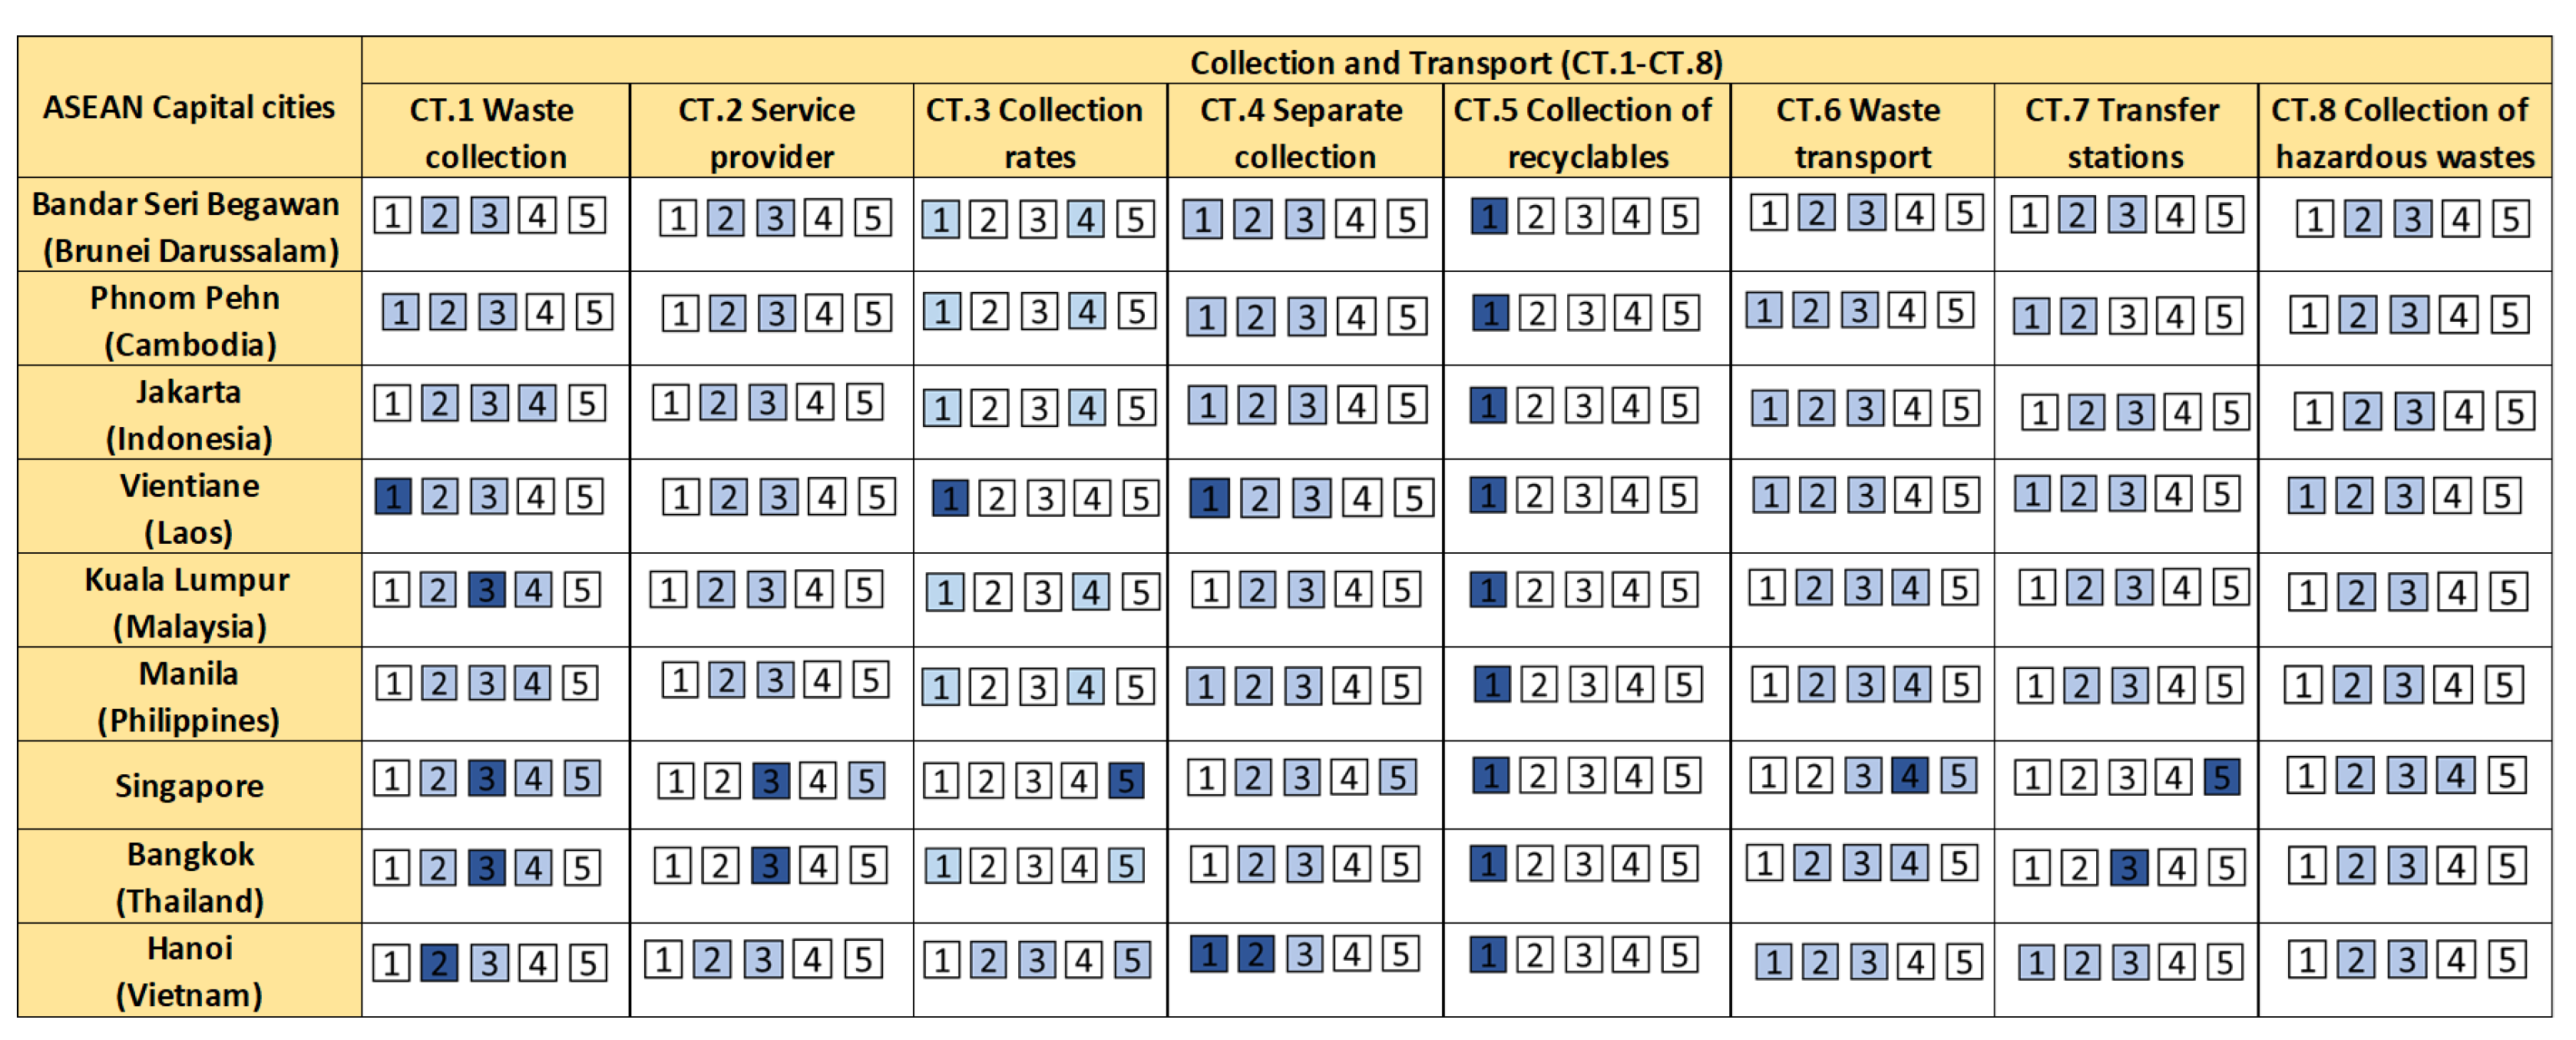
3.2.1. Collection and Transport “CT”

In Figure 3, the nine ASEAN cities are compared with each other based on the component, Collection and Transport, using the WMS-DSC concept. For waste collection, service provider, separate collection, collection of recyclables, waste transport, transfer station, and collection of hazardous waste, the nine ASEAN cities have a similar path of development, whereas Singapore has a more advanced system and facilities due to the introduction of digitalization measures and full maintenance of urban hygiene with no littering in public spaces. Therefore, its waste collection and transport have reached stage 5.
Overall, Bangkok and Hanoi fall under the range of stages 1 to 5 due to high collection rates in Hanoi and Bangkok, the two cities have reached stage 5 (partly met) of CT.3, while Vientiane is still in stages 1–3 due to a low collection rate, which is below 50%. Bandar Seri Begawan, Phnom Penh, Jakarta, Kuala Lumpur, and Manila are considered to be within stages 1 to 4. However, looking at the wider picture, Vientiane, Phnom Penh, and Hanoi still struggle with inadequate facilities for municipal waste collection, with the majority of collectors in the formal sector using simple waste collection vehicles; small vehicles and handcarts are used in both the formal and informal sectors. Bangkok, Kuala Lumpur, and Manila are cities with a predominantly upper-middle income, they have implemented more advanced waste collection vehicles, serving both the formal and informal sectors. Bandar Seri Begawan and Singapore portray different performance sin waste collection and transport, despite both having a high-income status.
The collection rates of recyclable materials (CT.5) for all of the cities are not documented; thus, all of the cities were ranked at the lowest stage, at stage 1. The informal sector still plays an active role in recyclable collection in all the cities, even in Singapore, where Karung Guni (waste collectors) are active in addition to the formal system [35]. Furthermore, the waste bank approach is also widespread among ASEAN cities and contributes to the collection of recyclable materials. About 5500 waste banks have been implemented throughout Thailand in universities, communities, offices, hospitals, army camps, etc. [42]. Also, a total of 1443 waste banks were established in 56 cities spread over 19 provinces in Indonesia back in 2013 [43]. Another example of encouraging people to bring recyclable materials and increase the collection rate is the ‘Cash for Trash’ program, which is implemented in Singapore and Manila. Cash for Trash is an incentive program that encourages people to bring their trash in exchange for cash or rewards [44,45].
Separate collection of municipal, hospital, and industrial waste is widely practiced and regulated in all ASEAN cities. Nevertheless, the efficiency of industrial and hospital waste collection and treatment are difficult to evaluate and are often not documented for public access. For example, in Cambodia, due to an inconsistent collection schedule, industrial waste is often mixed with the municipal waste collection [46].

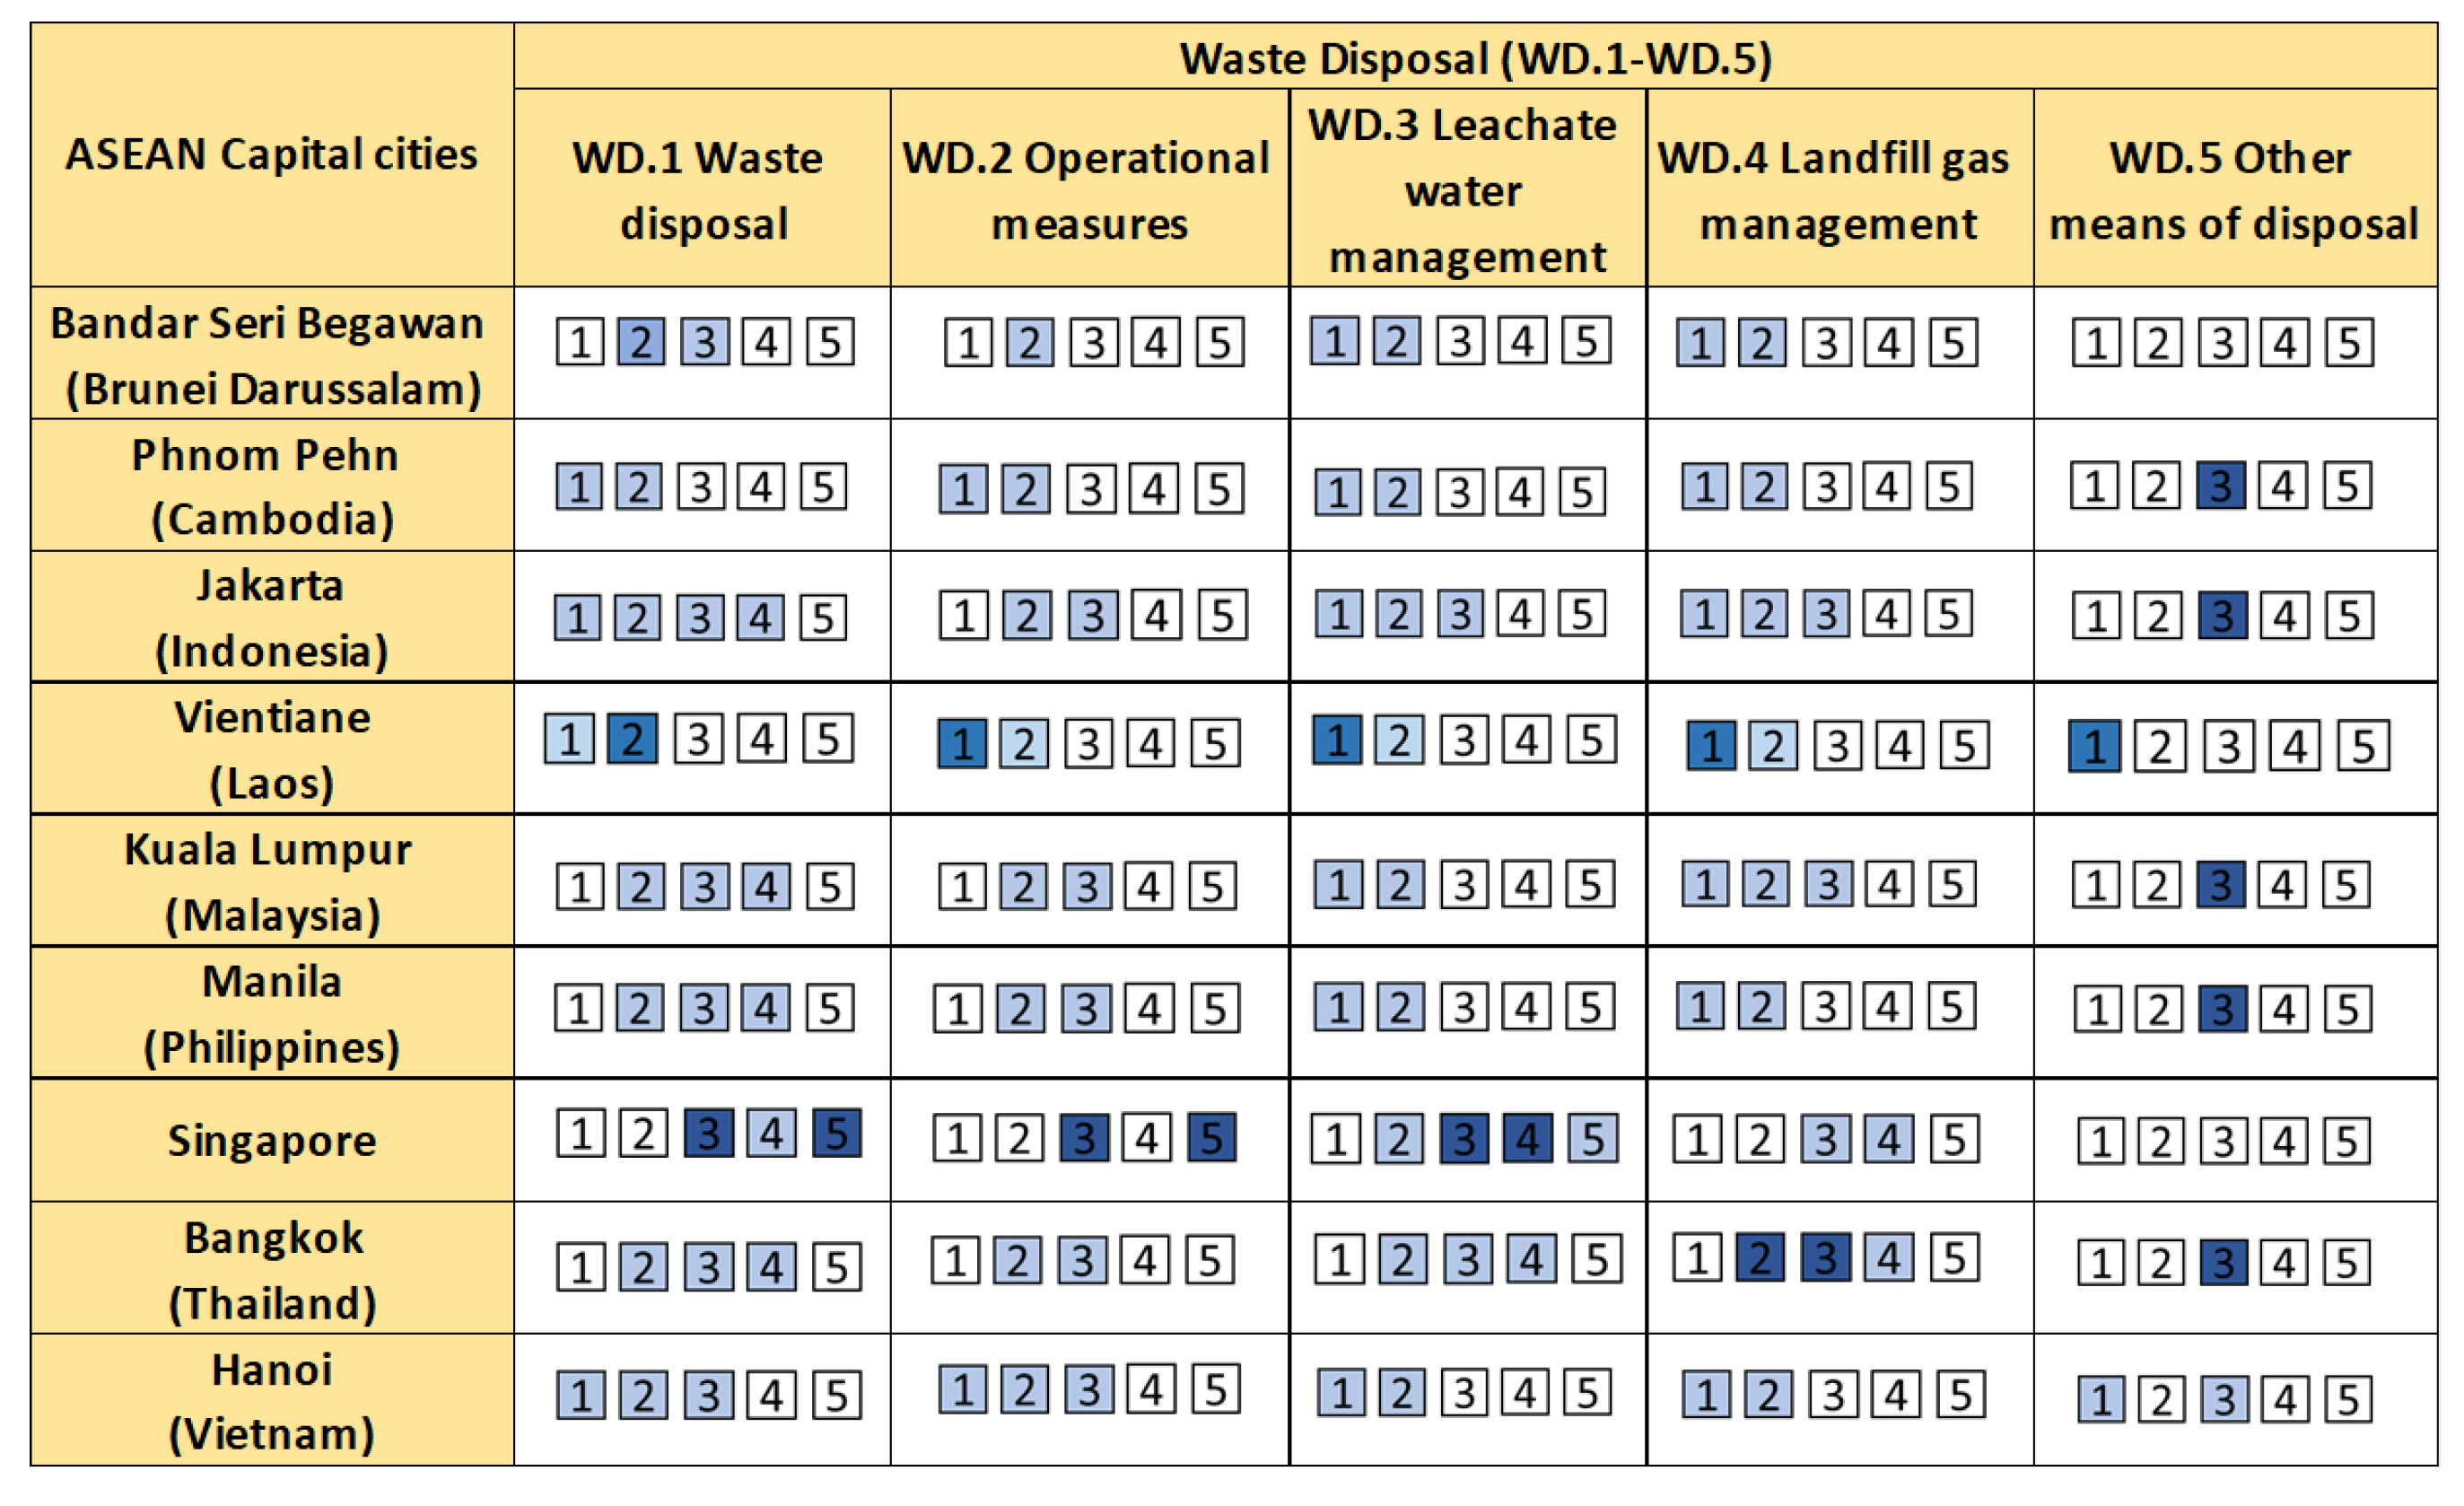
3.2.2. Waste Disposal “WD”

For the waste disposal assessment (Figure 4), the data of the country level were used for most of the cities’ evaluation, as information at the city level is very limited. While some sanitary landfills have recently been established, many ASEAN cities (varying from stage 1 to 4) still rely on controlled landfills, e.g., Malaysia has currently a total of eight sanitary landfills out of 176 landfills [47]; Vietnam has a total of 450 landfills, though only 120 of them follow the adequate sanitary regulations [48].
Open burning still occurs in many parts of the metropolis across the countries, creating climate impacts, e.g., it is estimated that burning municipal solid waste at the household level amounted to 71,763 kg/day in Padang City (Indonesia). In Steung Saen Municipality, Cambodia, nearly 50% of waste is open burned at the dumpsite [49]. Food waste and recyclable waste are still primarily disposed of in landfills.
Waste disposal in ASEAN cities ranges from stage 1 to 3 for Bandar Seri Begawan, Phnom Pehn and Hanoi, stage 1 to 2 for Vientiane, where the landfill technology and regulations are still limited. In Cambodia, the majority of landfills operate with open dumping practices without soil cover, leachate treatment, and landfill gas capture [46]. For Jakarta, Kuala Lumpur, Manila, and Bangkok, the range is from stage 1 to 4. In these cities, open burning at a dump site still partly exists, but the landfill technology is in transition to sanitary landfill standards [50]. Only Singapore has reached the state-of-the-art in waste disposal, as the best available technologies are used at their offshore landfill and transfer station (Stage 5). Only the bottom ash from incineration plants and non-incinerated waste are allowed to be disposed of in the landfill.

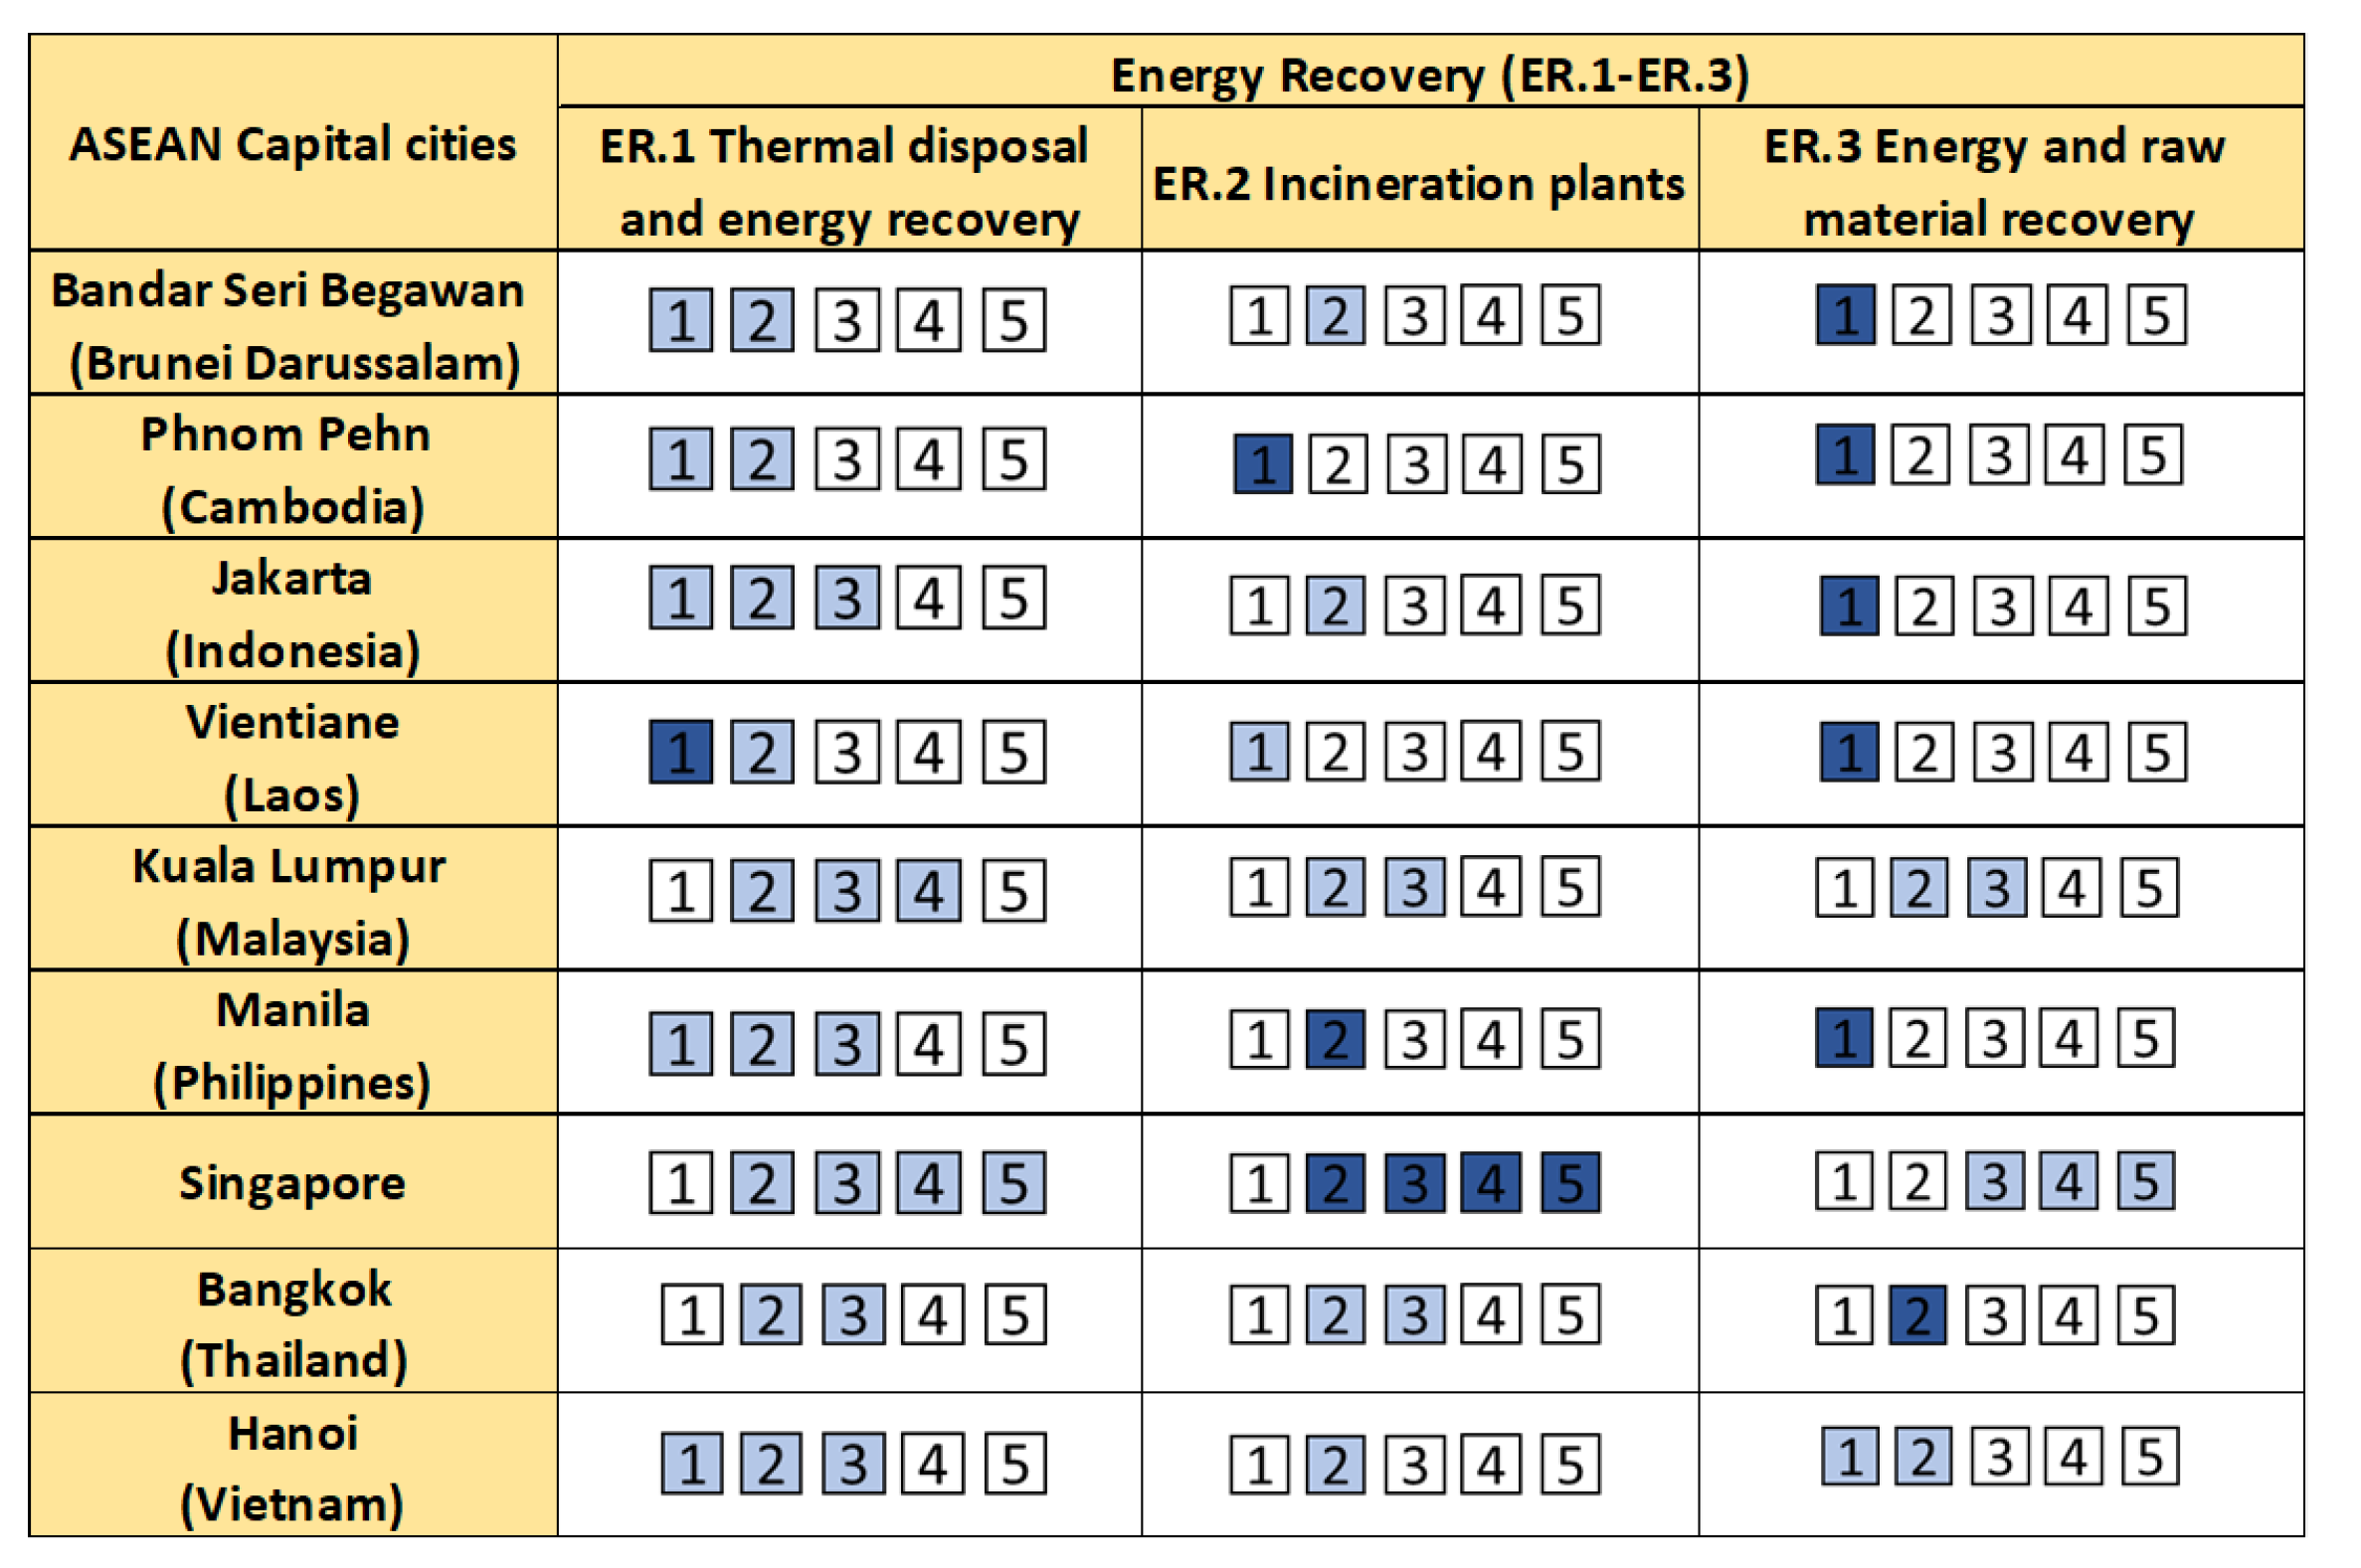
3.2.3. Energy Recovery “ER”

Figure 5 provides the result overview of the stage development for the nine ASEAN cities in terms of energy recovery. Having operated the first incinerator plant in ASEAN back in 1979, thereby having at least 50 years of expertise, Singapore (stage 3 to 5) plays a leading role in energy recovery (ER). Incineration and waste-to-energy (WtE) plants are still emerging in the remaining ASEAN cities due to the lack of financial support and operational experience [51], contradictions to national law and regulations (like in the Philippines) [52], and environmental concerns from activists (like in Thailand and Indonesia) [53]. However, due to the limitations associated with the option of landfills and the fast-growing waste generation, WtE has become an alternative among mega cities, such as Bangkok, Jakarta, Hanoi, Manila, and Kuala Lumpur (stage 1 to 3), where a number of incinerators have been installed, with the technology coming from Japan, Korea, and Europe. In the coming years, Thailand plans to construct 79 WtE plants, whereas Indonesia has 17 projects planned [53]. In the Philippines, the first large scale WtE plant is expected to be built in 2025, after the government’s approval in 2022 [54].
Vientiane, at stage 1 to 2, is still at the starting point of waste incineration, though small-scale waste incinerators for medical waste and the incineration of hazardous waste in cement kilns have been established in recent years. Currently, there are only two incinerators under the superstition of Vientiane municipality, with a total capacity of 876 kg/day [55,56]. Similarly, in Cambodia, only small-scale incinerators without energy recovery plants are operated [46]. Bandar Seri Begawan, at stage 1 to 2, currently plans to build its first waste incineration plant to divert waste from the Sungai Paku engineered landfill site, which is estimated to reach its full capacity by 2030 [57]. However, waste incineration in the ASEAN region remains a cause for concern and has not yet acquired widespread acceptance, despite the government’s willingness to develop such facilities and promote renewable energy supply by WtE plants [53]. Furthermore, the successful operation of WtE plants in ASEAN countries is still hampered by a number of challenges, such as limited financial support, policy support in waste management, and communication between stakeholders and the public [51].

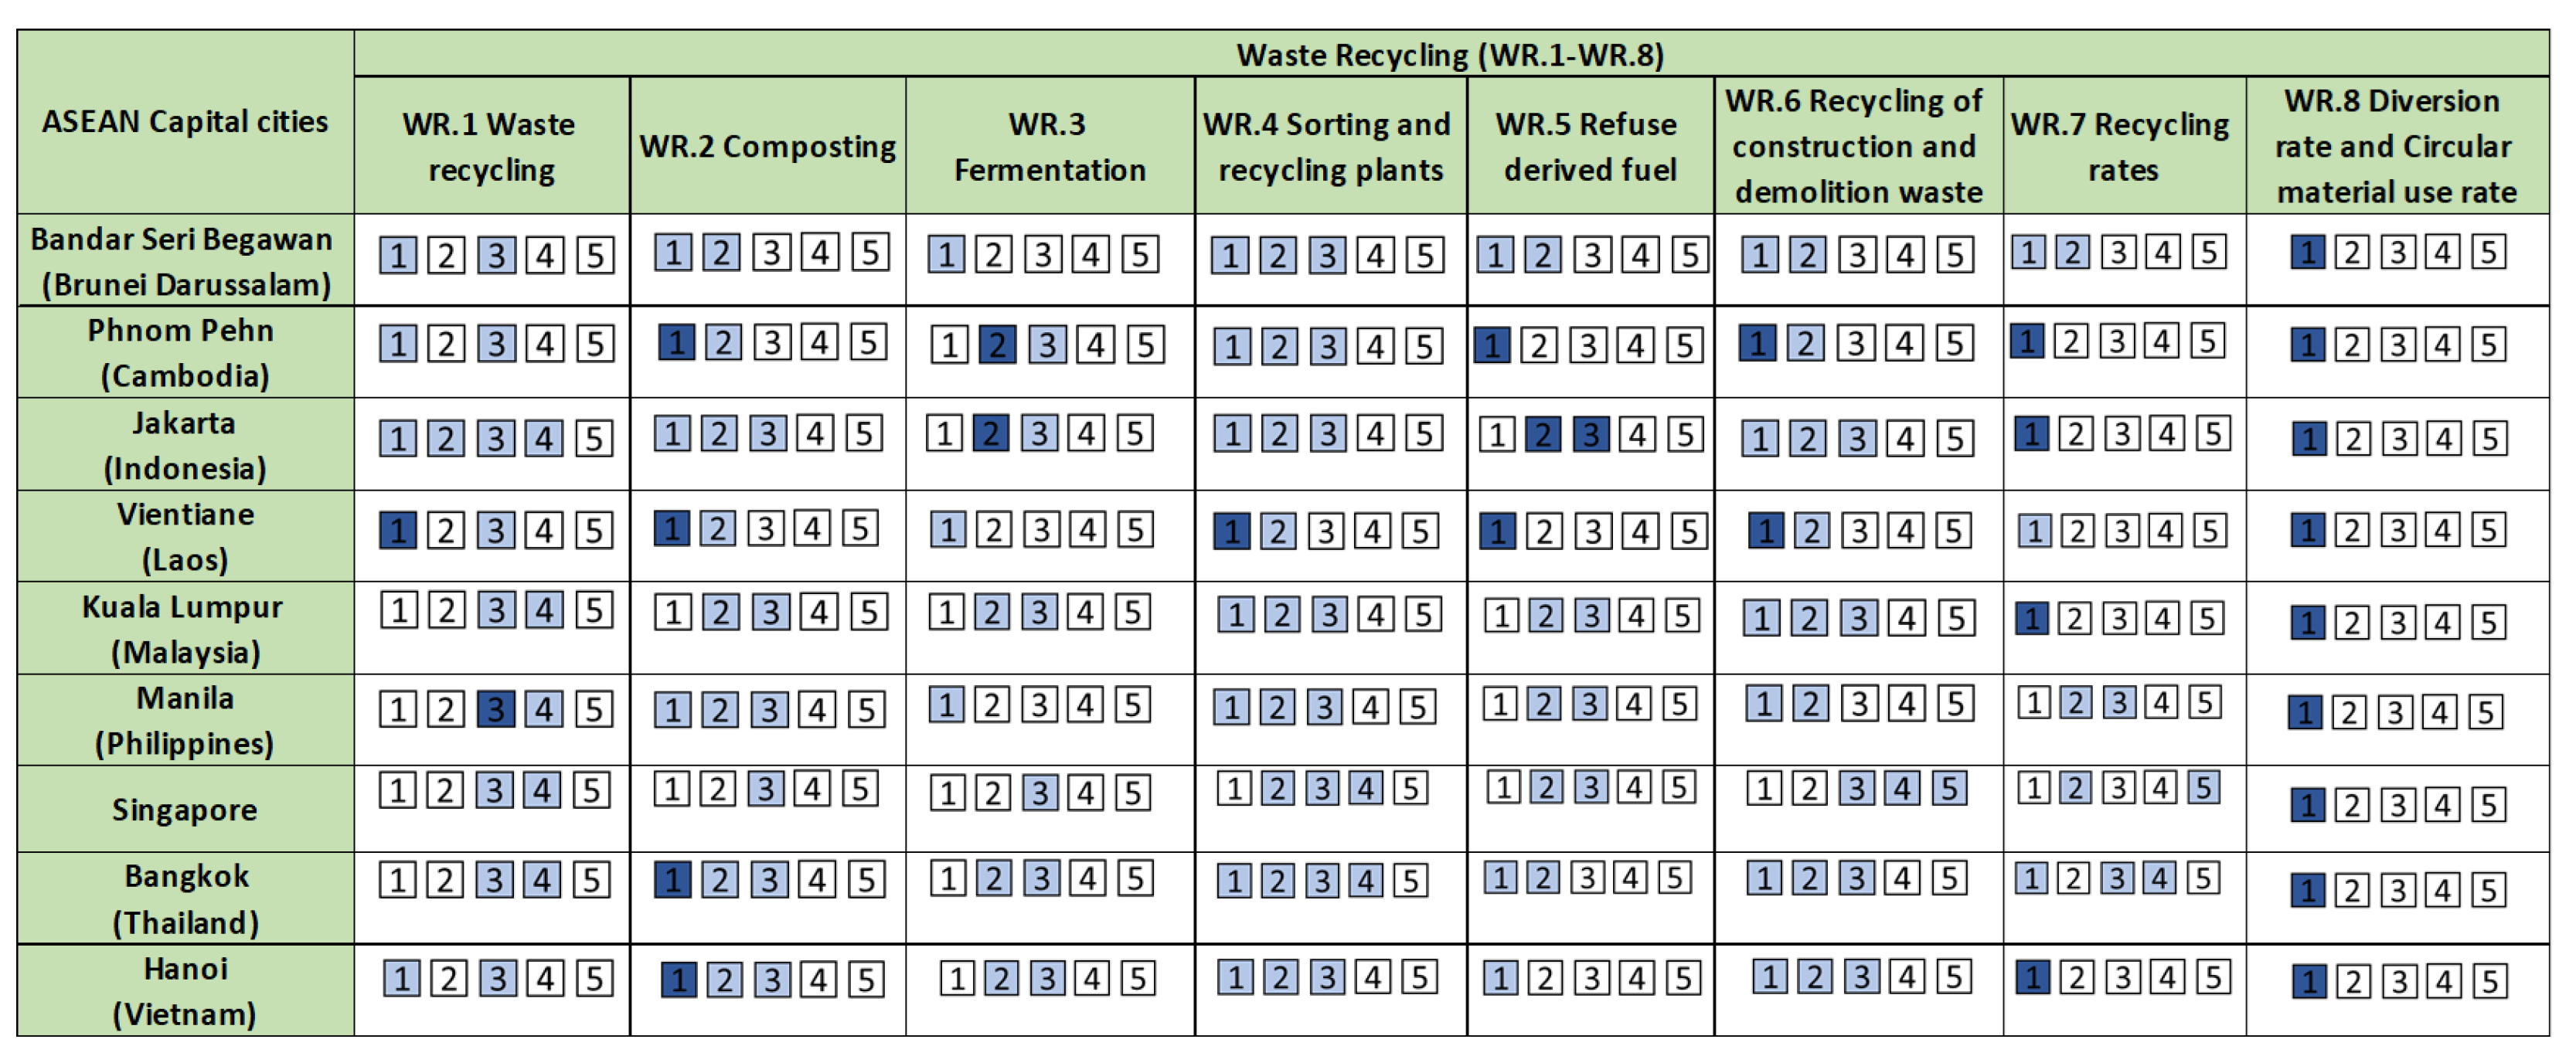
3.2.4. Waste Recycling “WR”

The development state of waste recycling in the nine ASEAN cities are at different development stages (Figure 6). Most cities are trying to raise their waste recycling rates, particularly for food waste, plastic, glass, paper, and metals. Singapore, at stages 2 to 5, has the highest recycling rates for construction and demolition waste in addition to metals, at nearly 100%. However, the recycling rates of other materials, such as food waste, paper, and plastic, are still very low, though a number of campaigns are currently being implemented to increase the recycling rates [36,37,58]. Despite this, formal and informal waste recycling activities can be found in multiple places in Thailand, Vietnam, Malaysia, and Indonesia. For example, there are at least 22 formal plastic recycling businesses in Indonesia. However, Indonesian recycling facilities are still unregulated, and many of them lack adequate health and safety operating procedures [24,59]. Craft villages in Vietnam play an essential role in the treatment of recyclable materials. However, in this informal context, technologies do not represent the state-of-the-art, creating adverse impacts on workers’ health and the environment [6]. Refuse derived fuel (RDF) is not yet commonly established among the ASEAN cities. There are some RDF projects in Indonesia, and approximately 40 to 60 tons of RDF fluff products are used daily as secondary fuel in cement kilns [60]. RDF is currently gaining interest and is being emphasized in Malaysia as an alternative to conventional solid waste management methods [61].
Bandar Seri Begawan, Phnom Pehn, and Vientiane, at stages 1 to 3, are still lacking a recycling industry, and most recyclable materials collected are exported for further treatment. Composting is commonly implemented on small scales, such as home composting and vermicomposting. A remarkable example is ‘Sawain’, a home composter for yard waste and food waste implemented in 1310 villages of the northern part of Thailand [62]. For fermentation, the information is not publicly available in many cities, especially the technical details. However, there are some activities related to fermentation of kitchen waste and livestock manure to produce biogas, for example the activities of the Indonesian Domestic Biogas Program (BIRU program), which involved the building of 24,769 biogas reactors in 13 provinces [63]. For construction and demolition waste, conventional demolition practices without pre-treatment are common in many cities. For example, high numbers of illegal dumping areas of construction waste were reported in many cities in Malaysia [64]. Hanoi is also at stages 1 to 3, due to the high share of informal recycling activities. Jakarta, Kuala Lumpur, Manila and Bangkok range from stages 1 to 4 since higher sorting and recycling technology are adopted.

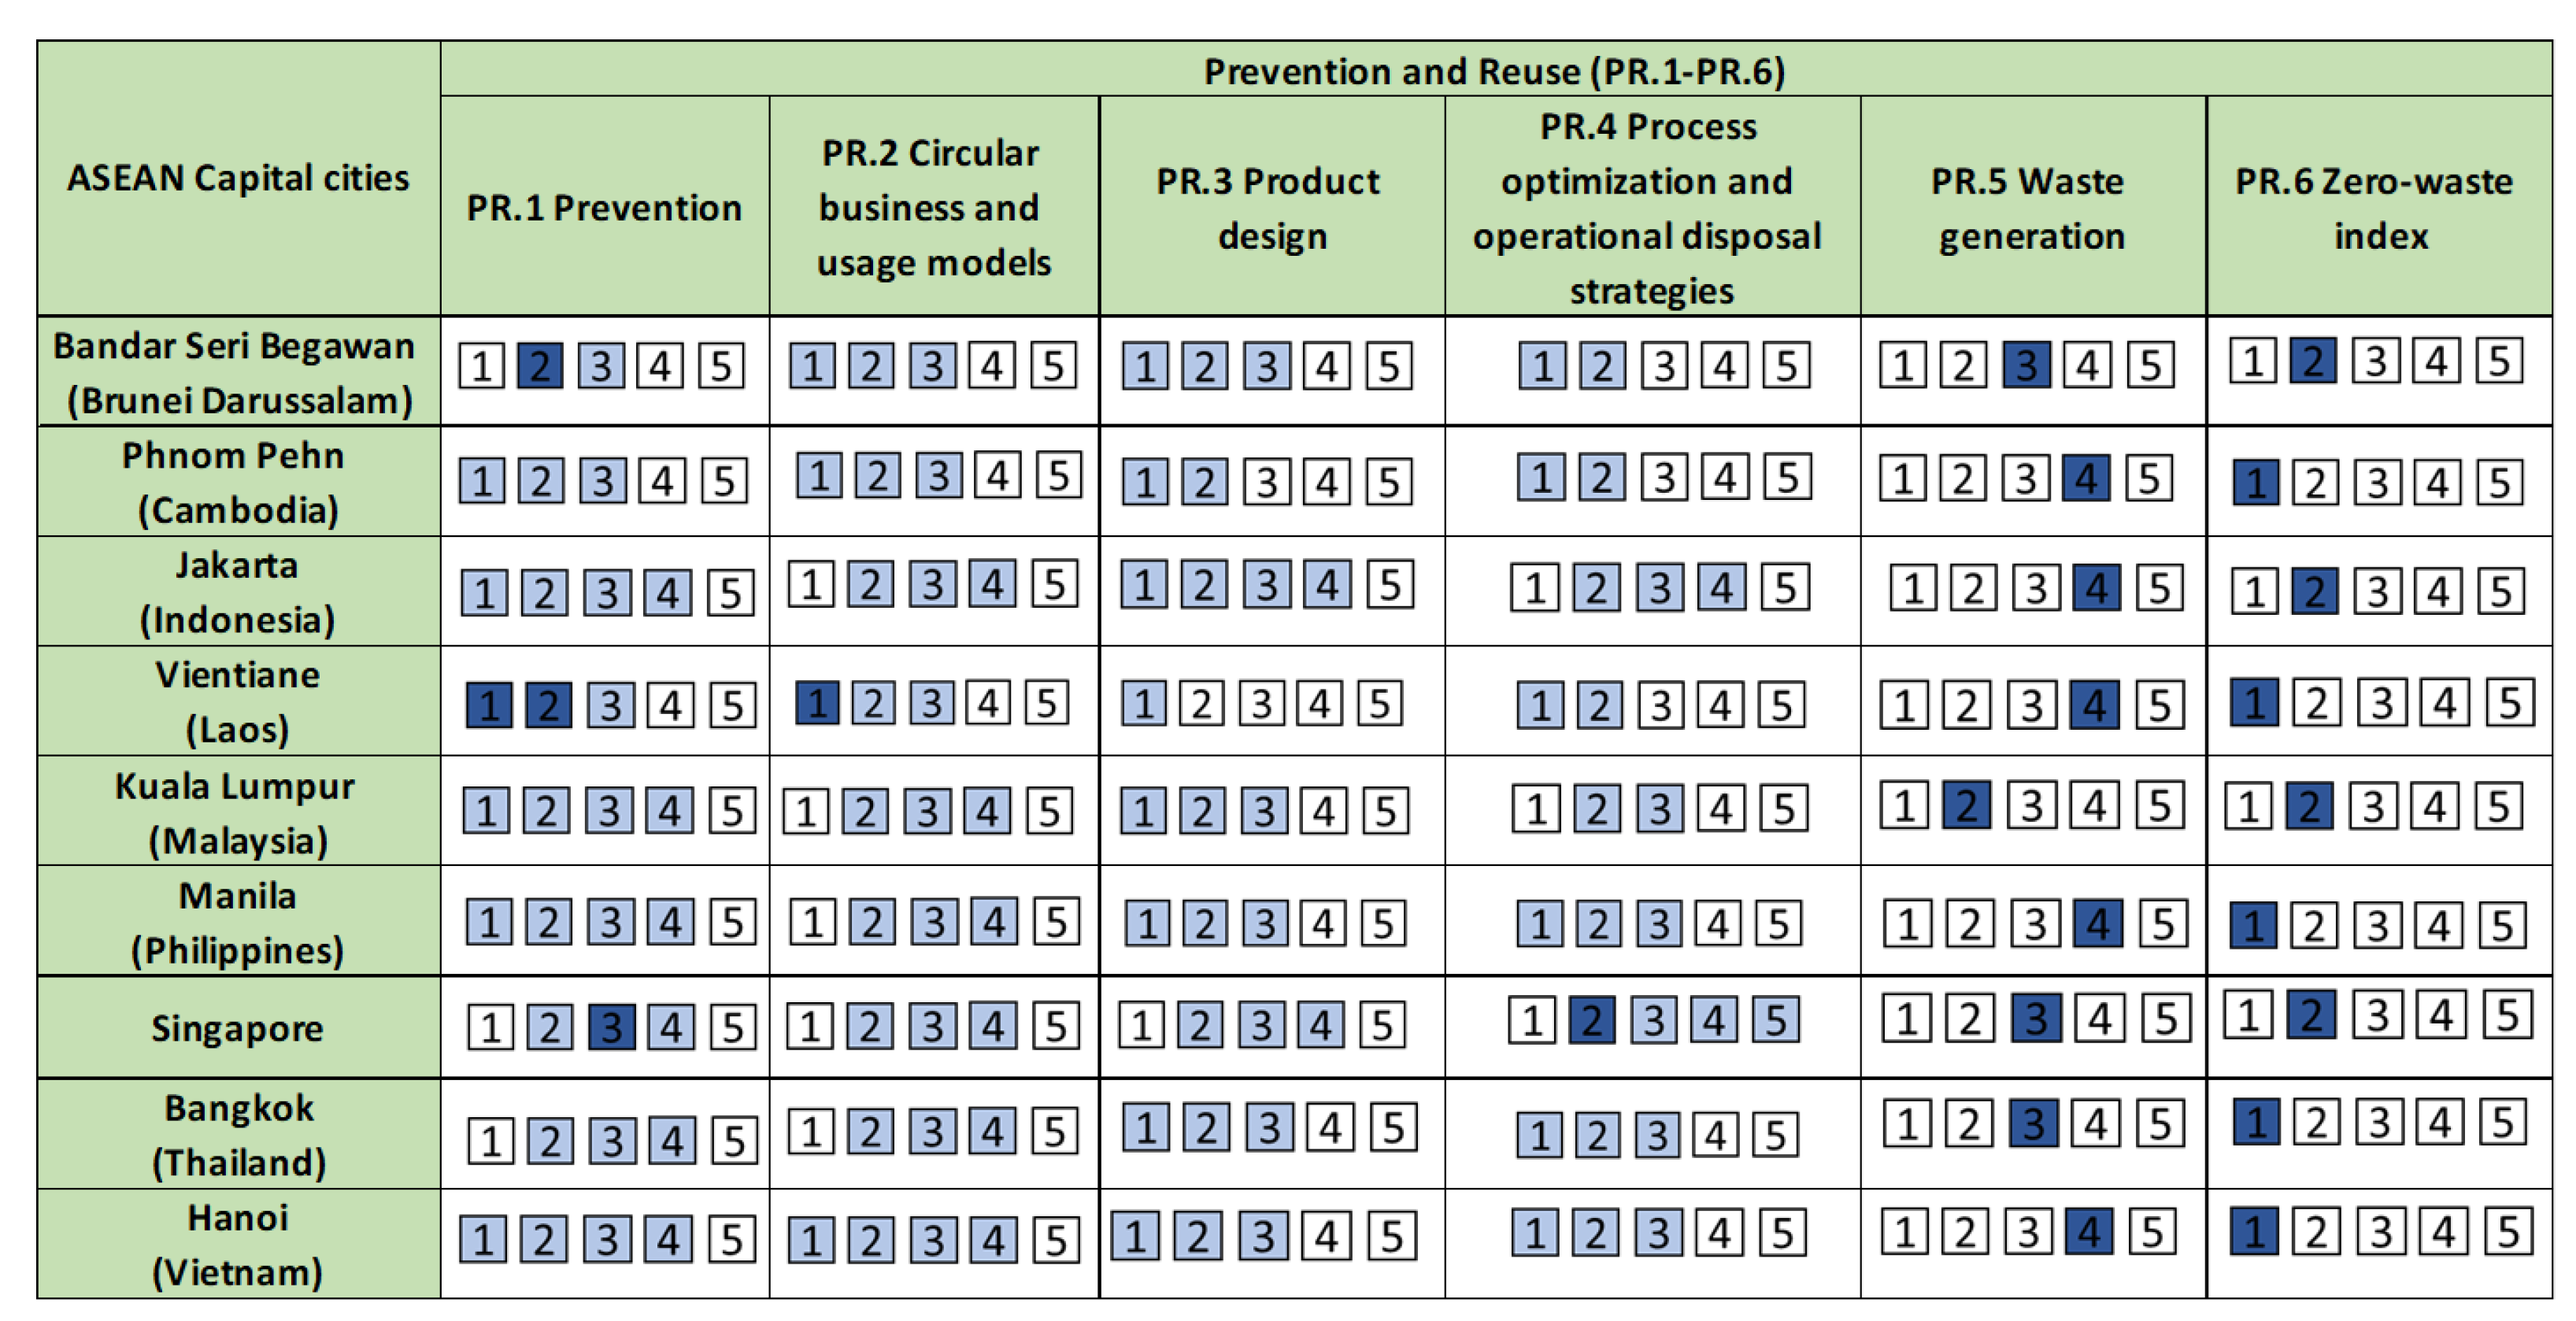
3.2.5. Prevention and Reuse “PR”

Waste prevention is widely encouraged in ASEAN cities where Bandar Seri Begawan is at stages 1 to 3; Phnom Pehn, Jakarta, Vientiane, Kuala Lumpur, Manila, Bangkok, and Hanoi are at stages 1 to 4, while Singapore is at stages 2 to 5 (Figure 7). A number of campaign activities regarding food waste, single-use plastic, and other packaging waste are conducted throughout the countries. An excellent example of how Indonesia is fighting food waste is FoodCycle, a non-profit organization that is passionate about helping the less fortunate by repurposing and distributing food waste. Numerous initiatives exist, including BreadRescue, FoodCycle Farm, FoodCycle Point, and FoodCycle Kitchen [65].
The circular economy concept is being introduced and integrated into waste management policies, e.g., the introduction of an extended producer responsibility (EPR) on plastic packaging into most national plans through various NGOs, local authorities, and funding agencies in Indonesia, Malaysia, the Philippines, Singapore, Thailand, and Vietnam. The Philippine government is seeking private sector participation, recognizing that the industry is best positioned to drive the transition to a circular economy for plastics through innovations in product design, business models, recycling technologies, producer responsibility experience from other markets, and project financing. Leading international companies and large multinational retailers that use plastics have already voluntarily committed to switching to entirely reusable, recyclable, or compostable packaging by 2025 [66].
Similarly, in Singapore, Innovating Curating Better Automation and Technology for Environmental Services aims to bring the public and private sectors together to prototype, pilot, and proffer solutions. Thus, the Sandbox for Environmental Services initiative was introduced in 2018 to assist businesses in developing innovations that have the potential to revolutionize their respective industries, such as a waste management solution that exemplifies circularity. Nevertheless, the government is making an effort to assist businesses and sectors by encouraging innovation through a variety of grants and funding, including the Enterprise Development Grant, the Closing the Waste Loop Initiative, and the Research Incentive Scheme for Businesses [67].
There are a number of platforms, such as the Steam Platform in Thailand, that aim to close the gap between businesses, government, and academia to promote product design, process optimization, and alternatives for the reuse and repair of products, where feasible [68]. Another example is the Circular Economy Hub, which is an online platform in Vietnam, aiming to develop knowledge, improve stakeholder communication, and mobilize group actions for Vietnam’s transition to a circular economy [69].
The number of online shopping platforms, such as Shopee and Lazada, that partly sell repaired and secondhand products are increasing in ASEAN countries, particularly in Indonesia, Thailand, Vietnam, Malaysia, and the Philippines [70]. Despite this, the repair sector is widely present in the ASEAN region, especially in low-income cities, e.g., Vientiane, Phnom Penh, and Hanoi. However, the impact of these activities is not documented and has not been investigated so far. Initiatives of voluntary take-back systems have been implemented in different cities, e.g., return of bottles to a beverage company in Bangkok [71] and the beverage container return scheme in Singapore [72]. Despite these, the zero waste index (ZWI) for Cambodia, Laos, the Philippines, Thailand, and Vietnam are categorized as very low (<0.05), whereas the ZWI of Brunei Darussalam, Indonesia, Malaysia, and Singapore are categorized as low (>0.05 ≤ 0.15) [73].

4. Discussion

4.1. Result Classification

4.1.1. Collection and Transport

Early development: Vientiane is at stages 1 to 3, where the basic elements are inadequate, which also reflects the very low collection rate. Despite the higher urban collection rates in Bandar Seri Begawan, Phnom Pehn, and Hanoi, which influence their development to stage 4 and 5, major elements of the waste collection and transport facilities are in the process of improving; although, the foundation of waste collection have been established, including the separate collection of hazardous waste and municipal solid waste.
Transitional phase: Jakarta, Kuala Lumpur, Manila, and Bangkok fall into development stages 1 to 5, where the foundation of waste collection has been established and improved with systematic collection, high levels of access to service providers, and existing separate collection of municipal solid waste, hospital waste, and hazardous waste.
Transition to mature development: Major elements of waste collection in Singapore have reached the mature stage (stage 5), since digitalization measures have been integrated into the waste collection processes, a state-of-the-art transfer station is present, and mostly modern waste collection vehicles are used.
However, all cities are still in stage 1 when it comes to collection of recyclable materials, and the informal sector still plays a major role in all the investigated cities.

4.1.2. Waste Disposal

Early development: Vientiane and Phnom Penh are at the emerging stage when it comes to waste disposal. The landfills in these cities operate with the minimum requirements of controlled landfills, although the landfill in Vientiane was initially designed as a sanitary landfill.
Transitional phase: Bandar Seri Begawan, Jakarta, Kuala Lumpur, Manila, Bangkok, and Hanoi have improved their landfill sites by replacing their uncontrolled dumping sites with sanitary landfills. Better landfill technologies to decrease the impact on the environment, such as leachate and landfill gas management, have been implemented in a number of existing landfills. However, the technical details regarding the use of technology are not publicly available. Therefore, it is difficult to evaluate the efficiency of the system.
Mature development: Despite this, Singapore’s only landfill has reached the mature stage, where the technology used is the state-of-the-art technology.

4.1.3. Energy Recovery

Early development: Bandar Seri Begawan, Phnom Pehn, and Vientiane are at the emerging stage of energy recovery, ranging from stages 1 to 2. The basic technical and organizational elements are not fully available, and the input material is questionable.
Transitional phase: Jakarta, Kuala Lumpur, Manila, Bangkok, and Hanoi (stage 1 to 4) are in the transition of developing the capacities for WtE, since incineration plants have been planned, recently operating, and material recovery from the incineration residue is still underdeveloped.
Mature development: Singapore has reached the mature stage (stage 2 to 5) in terms of utilizing the most advanced technologies and is now expanding its efforts to recover raw materials from incineration residue.

4.1.4. Waste Recycling

Early development: Overall, the recycling business in Brunei, Cambodia, and Laos are still in the emerging stage, as most recyclable materials are collected, sorted, partly processed and then exported for recycling in other countries.
Transitional phase: A mixture of formal and informal recycling is present in Vietnam, Malaysia, Indonesia, and Thailand, which reflects the varied recycling technologies used in these countries, from manual sorting to mechanical sorting, to generate high-quality recycled materials for the formal recycling sector. Formal recycling presents in Singapore, where the country had the highest recycling rates for metals and construction and demolition waste.
However, when it comes to organic waste, plastic, paper, and glass, e-waste, all cities are still in the developing process which reflect on the very low rate of recycling. Composting is managed on a very small scale and is slowly transitioning to commercialized composting. Similar situations can be observed for fermentation and RDF; they are still at the beginning phase for all of the cities, and very limited information and research are currently available.

4.1.5. Prevention and Reuse

Transitional phase: Despite the increasing popularity of waste prevention and reuse, landfills remain the most used disposal method in many ASEAN countries. Additionally, WtE is becoming progressively recognized for its importance, and many countries are starting to examine it as an alternative to landfilling. All cities conduct campaigns on various waste streams, including food waste, single-use plastics, and e-waste. In Singapore, circular economy concepts are adopted and incorporated into national laws and regulations, reflecting the city’s higher development stage in terms of product design and process optimization by industries than other cities. Vietnam has introduced EPR for packaging recycling obligations, product recycling obligations, and waste treatment obligations. Malaysia, Philippines, and Thailand are in their transition to the circular economy model and have integrated different stakeholders into the process. Reuse and repair are widely observed in all cities, though the impact of these activities is not documented, especially in low-income countries, like Cambodia, Laos, and Vietnam.

4.2. Imrpovement Measures

Regardless of the various stages of growth, cities can incorporate the following improvement measures [14] into their WMSs:
  • Enhance collection efficiency: Increase collection rate in rural areas; integrating informal sectors in collection; ensure the separate collection of municipal waste, hospital waste, and hazardous waste; increase the efficiency of transfer stations; establish standardized methods for collecting waste-related data.
  • Ensure disposal security: Enforce the prohibition of open burning and open dumping in both land and coastal areas; implement strict emission limits and quality standards for landfills and landfill classes; define sites for safety disposal of hazardous waste; mandatory of pre-treatment of waste before disposal.
  • Promote recycling: Implement clear and uniform collection, disposal, and recycling rates; enhance the capabilities of recycling processes to produce a higher quality and quantity of recycled materials through technological advancements; incorporate informal recycling practices into formal systems to safeguard the environment and human health.
  • Promote prevention, reuse, and CE: Promoting waste prevention for all waste streams; enhance the reuse and repair sectors; integrate companies into the CE and eco-design; strengthen and digitalize the market for secondhand products.
  • National and regional cooperation: Establish stakeholder platforms to facilitate the transition to CE; enhance collaboration between universities, practitioners, and recycling companies both national and regional levels; establish a regional control and standards to ensure of transboundary movement of waste and hazardous waste.

4.3. Limitations

The WMS-DSC provides a good overview of the development stages of relevant parts of a WMS. Moreover, the pathway to step up into higher stages is detailed, which is very beneficial for practitioners in planning the development of a WMS as well as monitoring the progress. Moreover, it has been demonstrated that it is feasible to categorize the stages of development, despite the absence of sufficient information which is very suitable for the cities of the Global South.
However, there are some limitations that need to be considered. The results are relatively highly dependent on the concept user during the interpretation of data. Qualitative data, specifically, allows for interpretation when not all components and subcomponents can be assigned using quantitative data. Furthermore, the data obtained for this study are not all peer-reviewed, which may limit the accuracy of the results. In addition, the lack of information also presents uncertainty in the results, as a number of subcomponents are assigned as ‘data not available’. In this study, additional interviews, or validation of data from local stakeholders, were not feasible for each of the cities due to the limitation of time and financial constraints. Therefore, it is advisable for further studies to allocate the time and resources for the second level of data validation.

5. Conclusions and Outlook

Overall, nine ASEAN cities are moving towards the same direction regarding the WMS development stages, starting from simple waste removal to ensure a safe environment and human health, and going towards CE. The development stages of each component were influenced by external factors, such as population size, income level, economic development, geographical location, and technical capacities, which are all interconnected. Bandar Seri Begawan is a good example for explaining the complexity of how external factors contribute to the development of a WMS. In this regard, a high-income country does not always reflect a high stage performance of WMS. Also, lower-middle to upper-middle income countries can reach higher stages of development and have more experience in recycling due to the active recycling activities of the formal and informal sectors and the concept of economies of scale.
The results of this study also reflect the similarities of difficulties that each of the cities face regardless of their income level or population size, particularly regarding low recycling rates and difficulties in waste disposal management and monitoring. Hence, only addressing budgetary constraints and technical limitations may not always provide an optimal solution. Public participation and political will are also key to improving a WMS.
Due to the fact that the WMS-DSC is not designed to provide results on environmental impact, to identify priorities for further development, in the next step of this research, selected local case studies of different waste streams will be analyzed using the published LCA studies. For instance, in Vientiane, Laos, a mobile phone repair service is being studied as part of the Prevention and Reuse aspect. Local case study data will be combined with published LCA studies to evaluate different treatment options, such as disposal, recycling, and repair, within the framework of LCA analysis.

Supplementary Materials

The following supporting information can be downloaded at: https://www.mdpi.com/article/10.3390/waste2010006/s1.

Author Contributions

Conceptualization, S.S. (Souphaphone Soudachanh); methodology, formal analysis, S.S. (Souphaphone Soudachanh); investigation, S.S. (Souphaphone Soudachanh); data curation, S.S. (Souphaphone Soudachanh); writing—original draft preparation, S.S. (Souphaphone Soudachanh); writing—review and editing, S.S. (Stefan Salhofer) and A.C.; visualization, S.S. (Souphaphone Soudachanh) and A.C.; supervision, S.S. (Stefan Salhofer). All authors have read and agreed to the published version of the manuscript.

Funding

This research received no external funding.

Institutional Review Board Statement

Not applicable.

Informed Consent Statement

Not applicable.

Data Availability Statement

Data are contained within the article and Supplementary Materials.

Conflicts of Interest

The authors declare no conflicts of interest.

References

  1. GIZ. ASEAN Municipal Solid Waste Management Enhancement (AMUSE); GIZ: Jakarta, Indonesia, 2022. [Google Scholar]
  2. ASEAN. ASEAN Regional Action Plan for Combating Marine Debris in the ASEAN Member States—Action Plan Summary; ASEAN Secretariat: Jakarta, Indonesia, 2021. [Google Scholar]
  3. Ferronato, N.; Torretta, V. Waste Mismanagement in Developing Countries: A Review of Global Issues. Int. J. Environ. Res. Public Health 2019, 16, 1060. [Google Scholar] [CrossRef] [PubMed]
  4. Jambeck, J.R.; Andrady, A.; Geyer, R.; Narayan, R.; Perryman, M.; Siegler, T.; Wilcox, C.; Lavender Law, K. Plastic waste inputs from land into the ocean. Science 2015, 347, 768–771. [Google Scholar] [CrossRef] [PubMed]
  5. Greenpeace, Southeast Asia’s Struggle against Plastic Waste Trade. 2019. Available online: https://www.greenpeace.org/southeastasia/publication/2559/southeast-asias-struggle-against-the-plastic-waste-trade/ (accessed on 15 January 2023).
  6. Salhofer, S.; Jandric, A.; Soudachanh, S.; Thinh, L.X.; Tran, T.D. Plastic recycling practices in Vietnam and related hazards for health and environment. Int. J. Environ. Res. Public Health 2021, 18, 4203. [Google Scholar] [CrossRef] [PubMed]
  7. Lavigne, F.; Wassmer, P.; Gomez, C.; Davies, T.A.; Sri Hadmoko, D.; Iskandarsyah, T.Y.W.; Gaillard, J.C.; Fort, M.; Texier, P.; Boun Heng, M.; et al. The 21 February 2005, catastrophic waste avalanche at Leuwigajah dumpsite, Bandung, Indonesia. Geoenviron. Disasters 2014, 1, 10. [Google Scholar] [CrossRef]
  8. Allesch, A.; Brunner, P.H. Material Flow Analysis as a Decision Support Tool for Waste Management: A Literature Review. J. Ind. Ecol. 2015, 19, 753–764. [Google Scholar] [CrossRef]
  9. Campitelli, A.; Schebek, L. How is the performance of waste management systems assessed globally? A systematic review. J. Clean. Prod. 2020, 272, 122986. [Google Scholar] [CrossRef]
  10. Wilson, D.C.; Rodic, L.; Cowing, M.J.; Velis, C.; Whiteman, A.; Scheinberg, A.; Vilches, R.; Masterson, D.; Stretz, J.; Oelz, B. ‘Wasteaware’ Benchmark Indicators for Integrated Sustainable Waste Management in Cities. Waste Manag. 2015, 35, 329–342. [Google Scholar] [CrossRef]
  11. Whiteman, A.; Webster, M.; Wilson, D.C. The nine development bands: A conceptual framework and global theory for waste and development. Waste Manag. Res. 2021, 39, 1218–1236. [Google Scholar] [CrossRef]
  12. Fatimah, Y.; Govindan, K.; Murniningsih, R.; Setiawan, A. Industry 4.0 based sustainable circular economy approach for smart waste management system to achieve sustainable development goals: A case study of Indonesia. J. Clean. Prod. 2020, 269, 122263. [Google Scholar] [CrossRef]
  13. Campitelli, A.; Aryoug, O.; Ouazzani, N.; Bockreis, A.; Schebek, L. Assessing the performance of a waste management system towards a circular economy in the Global South: The case of Marrakech (Morocco). Waste Manag. 2023, 166, 259–269. [Google Scholar] [CrossRef]
  14. Campitelli, A.; Kannengießer, J.; Schebek, L. Approach to assess the performance of waste management systems towards a circular economy: Waste management system development stage concept (WMS-DSC). MethodsX 2022, 9, 101634. [Google Scholar] [CrossRef] [PubMed]
  15. Slide Egg. ASEAN Maps. Available online: https://www.slideegg.com/southeast-asia-map-ppt (accessed on 17 August 2023).
  16. City Population. Available online: https://www.citypopulation.de/en (accessed on 9 August 2023).
  17. World Bank. Group Country Classifications by Income Level. Available online: https://blogs.worldbank.org/opendata/new-world-bank-group-country-classifications-income-level-fy24 (accessed on 9 August 2023).
  18. UNEP. Waste Management in ASEAN Countries: Summary Report. 2017. Available online: https://www.unep.org/resources/report/waste-management-asean-countries-summary-report (accessed on 17 January 2023).
  19. Ministry of Finance and Economy. Voluntary National Review Report of Brunei Darussalam. 2020. Available online: https://sustainabledevelopment.un.org/content/documents/26412VNR_2020_Brunei_Report.pdf (accessed on 6 January 2023).
  20. Chinda, T.; Thay, S. Long-term food waste management in Phnom Penh utilizing a system dynamic modeling approach. Environ. Eng. Res. 2022, 27, 200603. [Google Scholar] [CrossRef]
  21. Aprilia, A. Waste management in Indonesia and Jakarta: Challenges and Way Forward. In Proceedings of the 23rd ASEF Summer University, Virtual, 20 September–15 November 2021. [Google Scholar]
  22. World Bank. Get Clean and Green—Solid and Plastic Waste Management in Lao PDR. 2022. Available online: https://documents1.worldbank.org/curated/en/099100002182296296/pdf/P17101101230c40bc096bf0a757bd16eb65.pdf (accessed on 10 March 2023).
  23. Global Green Growth Institute. Solid Waste Management in Vientiane, Lao PDR. 2018. Available online: https://gggi.org/wp-content/uploads/2018/09/Solid-Waste-Management-in-Vientiane-Lao-P.D.R_Publication-3.pdf (accessed on 15 March 2023).
  24. ESCAP Closing the Loop on Plastic Pollution in Kuala Lumpur, Malaysia. 2020. Available online: https://www.unescap.org/sites/default/d8files/event-documents/KL%20Baseline%20Report-English.pdf (accessed on 20 March 2023).
  25. World Bank. An Assessment of Municipal Solid Waste Plans, Collection, Recycling and Disposal of Metro Manila. Washington, DC, USA. 2020. Available online: https://elibrary.worldbank.org/doi/abs/10.1596/37766 (accessed on 30 March 2023).
  26. World Bank. What a Waste. 2019. Available online: https://datatopics.worldbank.org/what-a-waste/ (accessed on 10 January 2023).
  27. Toward Zero Waste. How Do We Manage Waste Sustainably? Available online: https://www.towardszerowaste.gov.sg/zero-waste-masterplan/chapter2/managing-waste-sustainably/ (accessed on 5 February 2023).
  28. GIZ Circular Economy Briefing Series—Country Profile Thailand. 2017. Available online: https://www.giz.de/en/downloads/giz2018_Thailand-Country-Profile_web.pdf (accessed on 17 February 2023).
  29. United Nations Centre for Regional Development. Country Chapter State of the 3Rs in Asia and the Pacific—The Socialist Republic of Vietnam. 2017. Available online: https://www.uncrd.or.jp/content/documents/5696%5BNov%202017%5D%20Vietnam.pdf (accessed on 1 March 2023).
  30. Phuong, N.T.L.; Yabar, H.; Mizunoya, T. Characterization and Analysis of Household Solid Waste Composition to Identify the Optimal Waste Management Method: A Case Study in Hanoi City, Vietnam. Earth 2021, 2, 1046–1058. [Google Scholar] [CrossRef]
  31. National Environmental Agency. Public Cleanliness. Available online: https://www.nea.gov.sg/our-services/public-cleanliness/overview (accessed on 4 March 2023).
  32. National Environment Agency. Frequently Asked Questions on Revised Refuse Collection Fees for Households. Available online: https://www.nea.gov.sg/docs/default-source/wcd/faqs-on-revised-refuse-collection-fees-for-households_30-november-20218056a1daf2be4dd3b79f3a7bad1dc2ef.pdf (accessed on 7 March 2023).
  33. Sembcorb. Solid Waste Management. Available online: https://www.sembcorpenergy.com.sg/residential/solid-waste-management/ (accessed on 7 March 2023).
  34. National Environmental Agency. Waste Collection System. Available online: https://www.nea.gov.sg/our-services/waste-management/waste-collection-systems (accessed on 9 March 2023).
  35. Wong, A.M. Valued waste/wasted value: Waste, value and the labour process in electronic waste recycling in Singapore and Malaysia. Geogr. Compass 2022, 16, e12616. [Google Scholar] [CrossRef]
  36. National Environmental Agency. Reverse Vending Machine. Available online: https://www.nea.gov.sg/our-services/waste-management/reverse-vending-machines (accessed on 9 March 2023).
  37. National Environmental Agency. Cash for Trash. Available online: https://www.nea.gov.sg/our-services/waste-management/3r-programmes-and-resources/recycling-collection-points (accessed on 10 March 2023).
  38. National Environmental Agency. National Recycling Program. Available online: https://www.nea.gov.sg/our-services/waste-management/3r-programmes-and-resources/national-recycling-programme (accessed on 10 March 2023).
  39. National Environment Agency. Tuas Marine Transfer Station. Available online: https://www.nea.gov.sg/our-services/waste-management/3r-programmes-and-resources/waste-management-infrastructure/tuas-marine-transfer-station (accessed on 11 March 2023).
  40. National Environment Agency. E-Waste Management. Available online: https://www.nea.gov.sg/our-services/waste-management/3r-programmes-and-resources/e-waste-management/where-to-recycle-e-waste (accessed on 7 March 2023).
  41. National Environment Agency. Toxic Waste Control. Available online: https://www.nea.gov.sg/our-services/pollution-control/hazardous-waste/toxic-waste-control (accessed on 11 March 2023).
  42. Fang, E. One Man’s Trash Is Another Man’s Treasure: The Success of Thailand’s Waste Bank Initiative. John Hopskin. Available online: http://www.saisperspectives.com/2020-issue/2020/2/10/one-mans-trash-is-another-mans-treasure-the-success-of-thailands-waste-bank-initiative#_ftn26 (accessed on 15 March 2023).
  43. Fatmawati, F.; Mustari, N.; Haerana, H.; Niswaty, R.; Abdillah, A. Waste Bank Policy Implementation through Collaborative Approach: Comparative Study—Makassar and Bantaeng, Indonesia. Sustainability 2022, 14, 7974. [Google Scholar] [CrossRef]
  44. National Environmental Agency. Recycling/Collection Points. Available online: https://www.nea.gov.sg/our-services/waste-management/3r-programmes-and-resources/recycling-collection-points#:~:text=Cash%2Dfor%2DTrash%20is%20an,contact%20your%20Public%20Waste%20Collector (accessed on 13 March 2023).
  45. Trashcash. Cash for Trash Program. Available online: https://www.trashcash.ph/ (accessed on 17 March 2023).
  46. Pheakdey, D.V.; Quan, N.V.; Khanh, T.D.; Xuan, T.D. Challenges and Priorities of Municipal Solid Waste Management in Cambodia. Int. J. Environ. Res. Public Health 2022, 19, 8458. [Google Scholar] [CrossRef]
  47. International Trade Administration, U.S. Department of Commerce. Malaysia Waste Management Solutions. Available online: https://www.trade.gov/market-intelligence/malaysia-waste-management-solutions (accessed on 19 March 2023).
  48. Global Recycling. Waste Management in Vietnam. The Race Is On. Available online: https://global-recycling.info/archives/4167 (accessed on 6 January 2023).
  49. Singh, R.; Gamaralalage, P.; Tatsuno, M.; Inoue, M. Open Waste Burning in Asian Cities: Challenges and Opportunity. Available online: https://www.iges.or.jp/en/pub/open-waste-burning-asian-cities/en (accessed on 8 March 2023).
  50. Arumdani, S.; Puspita, A.; Budihardjo, M. MSW handling of top 5 leading waste producing countries in Southeast Asia. IOP Conf. Ser. Earth Environ. Sci. 2021, 896, 012003. [Google Scholar] [CrossRef]
  51. Tun, M.; Palacky, P.; Juchelkova, D.; Sitar, V. Renewable Waste-to-Energy in Southeast Asia: Status, Challenges, Opportunities, and Selection of Waste-to-Energy Technologies. Appl. Sci. 2020, 10, 7312. [Google Scholar] [CrossRef]
  52. Phillstar Global. Waste to Energy: Boon or Bane for Philippines. Available online: https://www.philstar.com/business/2022/06/01/2185085/waste-energy-boon-or-bane-philippines (accessed on 7 April 2023).
  53. Mongabay. As Waste to Energy Incinerators Spread in Southeast Asia, so Do Concerns. Available online: https://news.mongabay.com/2022/12/as-waste-to-energy-incinerators-spread-in-southeast-asia-so-do-concerns/ (accessed on 9 April 2023).
  54. Eco-Business. Philippines Approves First Large-Scale Waste to Energy Plant. Available online: https://www.eco-business.com/news/philippines-approves-first-large-scale-waste-to-energy-plant/ (accessed on 17 March 2023).
  55. EMAC Hazardous Waste Management of Special Economic Zones of Laos. Available online: https://rkcmpd-eria.org/job/medical-and-industrial-plastic-waste-management-for-laos/ (accessed on 12 February 2023).
  56. JICA Data Collection Survey on Waste Management Sector in Lao PDR. 2021. Available online: https://openjicareport.jica.go.jp/pdf/12345914.pdf (accessed on 15 August 2023).
  57. Vietnamplus. Brunei Plans to Build Waste to Electricity Incinerator Plant. Available online: https://en.vietnamplus.vn/brunei-plans-to-build-wastetoelectricity-incinerator-plant/250137.vnp (accessed on 3 March 2023).
  58. National Environmental Agency. Waste Statistics and Overall Recycling. Available online: https://www.nea.gov.sg/our-services/waste-management/waste-statistics-and-overall-recycling (accessed on 11 March 2023).
  59. Organization for Economic Cooperation and Development. Marine Plastics Pollution Indonesia. Available online: https://www.oecd.org/ocean/topics/ocean-pollution/marine-plastics-pollution-Indonesia.pdf (accessed on 7 April 2023).
  60. Ismawati, Y.; Proboretno, N.; Septiono, M.; Zaki, K. Refuse Derived Fuel in Indonesia. 2022. Available online: https://ipen.org/sites/default/files/documents/ipen-rdf-pef-indonesia-v1_5aw-en.pdf (accessed on 15 April 2023).
  61. Yong, Z.J.; Bashir, M.J.K.; Ng, C.A.; Sethupathi, S.; Lim, J.W.; Show, P.L. Sustainable Waste-to-Energy Development in Malaysia: Appraisal of Environmental, Financial, and Public Issues Related with Energy Recovery from Municipal Solid Waste. Processes 2019, 7, 676. [Google Scholar] [CrossRef]
  62. Mae Fah Luang University. Circular Economy for Waste Free Thailand. Available online: https://en.mfu.ac.th/en-quick-menu/research-and-innovation/research-for-u/research-group/circular-economy-for-waste-free-thailand-cewt.html (accessed on 9 March 2023).
  63. Rumah Energy. Indonesian Domestic Biogas Program-BIRU Program. Available online: https://www.rumahenergi.org/en/programs/renewable-energy/biru-program#:~:text=The%20Indonesian%20Domestic%20Biogas%20Programme%20(IDBP)%20or%20BIRU%20is%20a,pulp)%20as%20a%20natural%20fertilizer (accessed on 10 March 2023).
  64. Rahim, M.; Kasim, N.; Mohamed, I.; Zainal, I.; Sarpin, N.; Saikah, M. Construction waste generation in Malaysia construction industry: Illegal dumping activities. IOP Conf. Ser. Mater. Sci. Eng. 2017, 271, 012040. [Google Scholar] [CrossRef]
  65. Foodcycle. About the Organization. 2023. Available online: https://www.foodcycle.id/about (accessed on 13 March 2023).
  66. World Bank Group. Market Study for the Philippines: Plastics Circularity Opportunities and Barriers; Marine Plastics Series, East Asia and Pacific Region, Ed.; World Bank: Washington, DC, USA, 2021. [Google Scholar]
  67. Toward Zero Waste. Chapter 5—Transforming the Environmental Services Industry. Available online: https://www.towardszerowaste.gov.sg/zero-waste-masterplan/chapter5/ (accessed on 5 February 2023).
  68. Steam Platform. Circular Economy Education. Available online: https://www.steamplatform.org/education (accessed on 7 March 2023).
  69. Vietnam Circular Economy. About Us—What Is Circular Economy? Available online: https://vietnamcirculareconomy.vn/about/?lang=en (accessed on 16 March 2023).
  70. Webretailer. Online Marketplaces in Southeast Asia: A Unique Region for Ecommerce. Available online: https://www.webretailer.com/marketplaces-worldwide/online-marketplaces-southeast-asia/ (accessed on 2 April 2023).
  71. ThaiBev. Waste and Packaging Management and Circular Economy. 2023. Available online: https://sustainability.thaibev.com/2020/en/waste_management.php (accessed on 2 April 2023).
  72. National Environmental Agency. Beverage Container Return Scheme. Available online: https://www.nea.gov.sg/our-services/waste-management/beverage-container-return-scheme (accessed on 2 April 2023).
  73. Zaman, A.; Swapan, M. Performance evaluation and benchmarking of global waste management systems. Resour. Conserv. Recycl. 2016, 114, 32–41. [Google Scholar] [CrossRef]
Figure 1. Five development stages along with relevant drivers and targets of WMS-DSC [14].
Waste 02 00006 g001
Figure 2. An overview map of nine ASEAN capital cities. Map adjusted from Slide Egg [15].
Waste 02 00006 g002
Figure 3. Result Overview for collection and transport in the nine ASEAN cities.
Waste 02 00006 g003
Figure 4. Result overview for waste disposal in the nine ASEAN cities.
Waste 02 00006 g004
Figure 5. Result overview for energy recovery in the nine ASEAN cities.
Waste 02 00006 g005
Figure 6. Result overview for waste recycling in the nine ASEAN cities.
Waste 02 00006 g006
Figure 7. Result overview for Prevention and Reuse in the nine ASEAN cities.
Waste 02 00006 g007
Table 1. WMS components and subcomponents [14].
WMS ComponentsSubcomponent 1
Collection and Transport “CT”CT.1 Waste collection
CT.2 Service provider
CT.3 Collection rates
CT.4 Separate collection
CT.5 Collection of recyclables
CT.6 Waste transport
CT.7 Transfer stations
CT.8 Collection of hazardous wastes
Waste disposal “WD”WD.1 Waste disposal
WD.2 Operational measures
WD.3 Leachate water management
WD.4 Landfill gas management
WD.5 Other means of disposal
Energy recovery “ER”ER.1 Thermal disposal and energy recovery
ER.2 Incineration plants
ER.3 Energy and raw material recovery
Waste recycling “WR”WR.1 Waste recycling
WR.2 Composting
WR.3 Fermentation
WR.4 Sorting and recycling plants
WR.5 RDFs
WR.6 Recycling of construction and demolition waste
WR.7 Recycling rates
WR.8 Diversion rate (DR) and circular material use rate (CMUR)
Prevention and reuse “PR”Pr.1 Prevention
PR.2 Circular business and usage models
PR.3 Product design; process optimization and operational disposal strategies
PR.4 Waste generation
PR.5 Zero Waste Index (ZWI)
1 Full detail of the indicators and sub-indicators are provided in the Supplementary Materials.
Table 2. An example of assigning a single criterion for collection and transport component [14].
Stage 1Stage 2Stage 3Stage 4Stage 5
Collection and transport (CT.1–CT.8)
CT.1CT.1.1.1 Lack of systematic collection; limited collectionnmCT.1.2.1 Collection is systematic, but inefficientnmCT.1.3.1 Efficient collection through optimizing measures and conceptsmCT.1.4.1 Underground systems in public spaces pmCT.1.5.1 Waste bins have no negative effect on landscapepm
CT.1.1.2 Lack of uniform collection binsnmCT.1.2.2 Use of uniform aboveground systemsmCT.1.3.2 Use of new bin systems (e.g., waste locks)mCT.1.4.2 Waste bins with fill level sensorspmCT.1.5.2 Avoid of container overfilling (smart bins)pm
CT.1.2.3 Collection points are within 200m distance mCT.1.3.3 Service provision of cleaning up binsmCT.1.4.3 Introduction of digitalization measuresmCT.1.5.3 Smart waste container separation nm
CT.1.1.3 Missing of basic principles of urban hygiene, major littering exists nmCT.1.2.4 Urban hygiene principles are partially met, but littering in public spaces remains a problem nm CT.1.5.4 Full maintainance of urban hygiene principles and no littering in public spacesm
Table 3. An example of a result overview where ‘light blue’ means ‘subcomponent is partly met’, ‘dark blue’ means ‘subcomponent is fully met’ and ‘white’ means ‘subcomponent is not met, or data are not available’ [14].
Stage 1Stage 2Stage 3Stage 4Stage 5
Collection and transportCT.1 Waste collection
CT.2 Service provider
CT.3 Collection rates
CT.4 Separate collection
CT.5 Collection of recyclables
CT.6 Waste transport
CT.7 Transfer stations
CT.8 Collection of hazardous wastes
Table 4. General information on the nine ASEAN capital cities [16,17,18,19,20,21,22,23,24,25,26,27,28,29,30].
ASEAN Capital CitiesGeneral Information
Population Income Level Waste Generation Rate (kg/cap/day)Collection Rate (Urban) %
Bandar Seri Begawan (Brunei Darussalam)318,530High1.1590
Phnom Pehn
(Cambodia)
2,281,951Lower middle0.9183-92
Jakarta
(Indonesia)
10,562,088Upper middle0.780-98
Vientiane
(Laos)
948,477Lower middle0.68< 50
Kuala Lumpur
(Malaysia)
1,945,200Upper middle1.2180
Manila
(Philippines)
13,484,482Lower middle0.6981
Singapore5,685,807High1.02100
Bangkok
(Thailand)
10,944,863Upper middle1.3599
Hanoi
(Vietnam)
8,053,663Lower middle0.6398
Table 5. The result overview of Collection and Transport (CT.1–CT.8) of Singapore. Light blue’ means ‘subcomponent is partly met’, ‘dark blue’ means ‘subcomponent is fully met’ and ‘white’ means ‘subcomponent is not met, or data are not available’.
Stage 1Stage 2Stage 3Stage 4Stage 5
Collection and transportCT.1 Waste collection
CT.2 Service provider
CT.3 Collection rates
CT.4 Separate collection
CT.5 Collection of recyclables
CT.6 Waste transport
CT.7 Transfer stations
CT.8 Collection of hazardous wastes
Disclaimer/Publisher’s Note: The statements, opinions and data contained in all publications are solely those of the individual author(s) and contributor(s) and not of MDPI and/or the editor(s). MDPI and/or the editor(s) disclaim responsibility for any injury to people or property resulting from any ideas, methods, instructions or products referred to in the content.

