Article

Carbon Footprint of Mechanical Recycling of Post-Industrial Plastic Waste: Study of ABS, PA66GF30, PC and POM Regrinds

1
Technische Hochschule Mittelhessen, University of Applied Sciences, 35390 Gießen, Germany
2
Kunststoff-Institut für die Mittelständische Wirtschaft NRW, 58507 Lüdenscheid, Germany
*
Author to whom correspondence should be addressed.
Waste 2023, 1(1), 127-139; https://doi.org/10.3390/waste1010010
Submission received: 30 September 2022 / Revised: 5 December 2022 / Accepted: 6 December 2022 / Published: 8 December 2022

Abstract

:
In view of the increasing amount of plastic waste due to a yearly rise in production volume, mechanical recycling of post-industrial waste offers a way to use the scarce resources on earth more efficiently in addition to reducing the global warming potential in the production of raw materials. Therefore, this study addresses the calculation of the product carbon footprint for sorted industrial waste according to the specifications of ISO 14067. The plastics acrylonitrile–butadiene–styrene copolymer (ABS), polyamide 6.6 with 30% glass fiber (PA66GF30), polycarbonate (PC) and polyoxymethylene (POM) were balanced in Umberto LCA+ using the Ecoinvent v3.8 and GaBi SP40 2020 databases and primary data collection from the recycling company Occhipinti. A cut-off approach was applied as an allocation method for evaluating the industrial waste so that the plastic for grinding was imported without burdens from the previous product system. The results show that for all plastics under study, one of the main drivers of the carbon footprint is plastic dust from the grinding process. This insight was used in sensitivity analyses to optimize the modelled processes for a more sustainable production. Improvement potentials were identified by using solar power and disposing of the plastic dust separately according to the type of plastic.

1. Introduction

Engineering plastics are so multifunctional due to their special mechanical, chemical and optical properties that we find them everywhere in our daily lives. Therefore, it is not surprising that the demand for plastics is increasing exponentially, including the associated burdens on our environment [1]. In order to ensure that this important commodity can continue to be used in the future, it is necessary to minimize the ecological impact of its production and use. For this purpose, it is essential to increase the recycling of plastic waste, so that the use of recycled material can save resources, reduce waste and decrease the global warming potential in the manufacturing of products [2]. Mechanical recycling of industrial waste is in line with the European Union’s climate neutrality targets and the Paris Climate Agreement to save raw materials and reduce CO2 emissions so that plastics continue to enable the benefits valued by society [3]. With a view to support the necessary transformation of linear production chains to a circular economy, this study investigates the global warming potential of plastic regrind from a mechanical recycling process of post-industrial waste for the substitution of virgin material. The objective is to improve the weak data situation for plastic recyclates by calculating the Product Carbon Footprint (PCF) and using sensitivity analyses to validate the results for the application in further life cycle assessments (LCAs).

1.1. Material Flows in the Processing of Plastics

One way to reduce the carbon footprint of products is to increase the sustainability of the materials by using them in different product systems through an open-loop recycling of the material flow. This can be achieved by using recycled materials such as regrind from mechanical recycling instead of virgin materials. In 2019, 1.9 million tonnes of recyclate was processed for plastic products in Germany. This corresponds to a share of 13.7%, which is distributed almost equally between recyclate from post-industrial and post-consumer waste [4]. However, there is still potential for a higher share of processed recyclates in the production of new plastic parts, especially since mechanical recycling was considered to be the most efficient recycling method in terms of time, economic cost, carbon footprint and environmental impact in general [5].

1.2. Classification of Recycling Processes

Recycling describes the reprocessing of recoverable waste into a new product, and the different types of recycling processes for plastics can be classified into four stages according to ISO 15270 [6]. The first stage is defined as primary recycling, which includes the treatment of post-industrial waste or pure polymer streams and represents per definition the proceeding of this study. Following this standard, mechanical recycling can be also used in the next stage of secondary recycling, which describes the processing of post-consumer waste in an open-loop recycling system. The recycling of used plastic parts in this stage at the end of their lifetime carries the risk of downcycling the material flow to a lower-quality product. Contaminants in post-consumer waste require sorting of polymer waste streams, and exposure to UV light during the lifetime of the product could damage the chemical structure of the plastics [7]. In addition, high temperatures and shearing forces during grinding, extrusion or injection molding lead to a reduction in the polymer chain length as well as lower mechanical properties and process stability [8]. Therefore, after a finite number of primary and secondary recycling steps, only chemical recycling at the stage of tertiary recycling can restore the material flow to its monomeric feedstock via pyrolytic or hydrocracking strategies [9]. With the monomers obtained from these time- and cost-intensive processes, the original polymer chains can be completely restored via a new polymerization. However, if chemical recycling is neither economically nor ecologically reasonable, the only remaining option is the final stage of quaternary recycling, in which the material is incinerated for energy recovery [10].

1.3. Product Carbon Footprint of Mechanical Recycling

From the perspective of the classification of recycling processes, it should be highlighted that mechanical recycling has some advantages over chemical recycling and energy recovery. Grinding plastic parts into regrind requires only a minimum number of working steps, and the chemical structure of the polymers remains almost intact during this process. Furthermore, the energy that has already gone into the production of the plastic is retained partially in the plastic regrind [11]. Thus, a scenario from a recent study shows that the use of ABS regrind in injection molding can reduce the product costs by 28.1% and the carbon footprint by 29.3% compared to production with virgin material [12]. However, in view of the large number of possible recycling processes, the often incomplete characterization of the recyclate as regrind, granulate or compound complicates the transfer of research results into material databases, particularly when a quality factor has been added as a correction in the calculation of the carbon footprint for the general assumption of downcycling in an open-loop material flow [13]. Even if the decreasing product quality of recyclate has to be taken into account for the product environmental footprint according to the European Commission [14], a decline in product quality cannot generally be assumed for open-loop recycling [15]. Therefore, this work is focused on the calculation of the PCF according to ISO 14067 for regrind of widely used engineering plastics from post-industrial waste [16]. In this way, transparency and comparability are to be created so that these research results can also be applied in life cycle assessments of future products made from the regrinds under study.

2. Materials and Methods

2.1. Goal and Scope

The goal of this LCA was to calculate the PCF of plastic regrind from a mechanical recycling process of post-industrial waste using the LCA software Umberto LCA+ with the integrated material databases Ecoinvent 3.8 and GaBi SP40 2020. This method supports an LCA according to ISO 14040 [17] with climate change as the midpoint factor following ReCiPe 2016 and ISO 14067 [18]. By using result datasets from Ecoinvent 3.8 [19] as an additional background system, it was possible to calculate a system boundary from cradle to gate across the life cycle phases of raw material extraction and production until distribution. A cut-off approach was applied as an allocation method for evaluating the industrial waste in this open-loop recycling system so that the plastic waste for grinding was imported without burdens from the previous production system. An allocation of heat and electricity from an energy recovery process for incinerated plastic waste was not taking into account.
The inventory for the LCA of the mechanical recycling process was calculated as a part of the research project SekÄqui at the company “Kunststofferzeugnisse Occhipinti”, which is specialized in the recycling of pure polymer streams following the classification of primary recycling. This analysis investigates the plastics acrylonitrile–butadiene–styrene (ABS), polyamide 6.6 GF30 (PA66GF30), polycarbonate (PC) and polyoxy-methylene (POM).
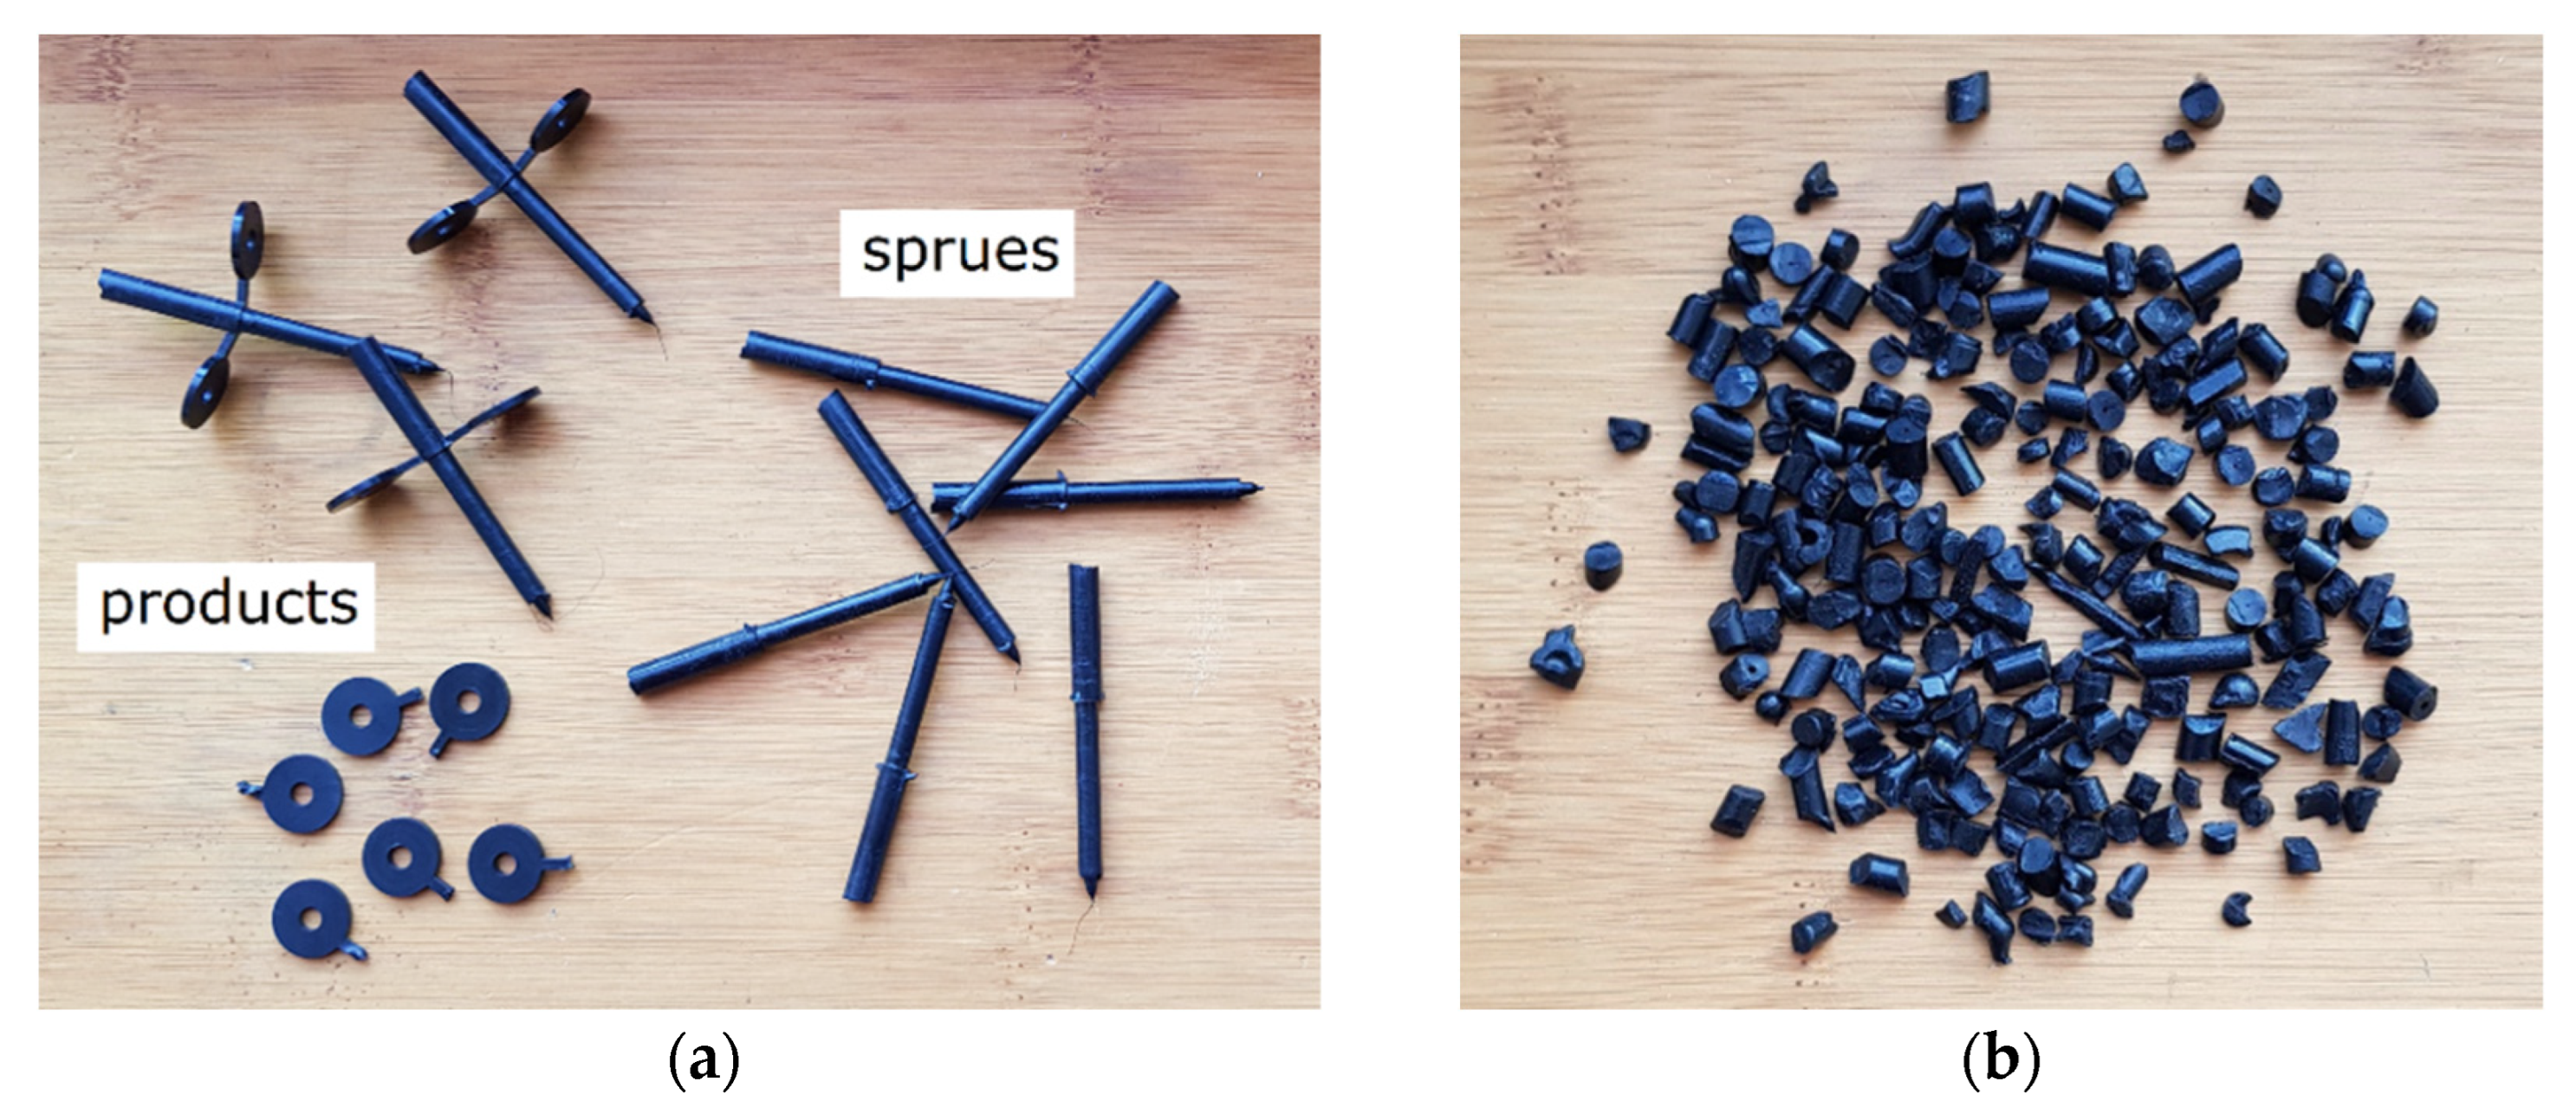
Thus, 1 kg of the respective plastic regrind was defined as the functional unit for the reference flow. As post-industrial waste for the mechanical recycling process, sprues produced during an injection molding process for the manufacture of an arbitrary product, as shown in Figure 1a, were used. The sprues were processed into regrind until the rotor and stator knives of the mill have crushed the sprues sufficiently to be passed through an 8 mm sieve. As shown in Figure 1b, this process results in the requested regrind with various particle sizes in addition to separated plastic dust.
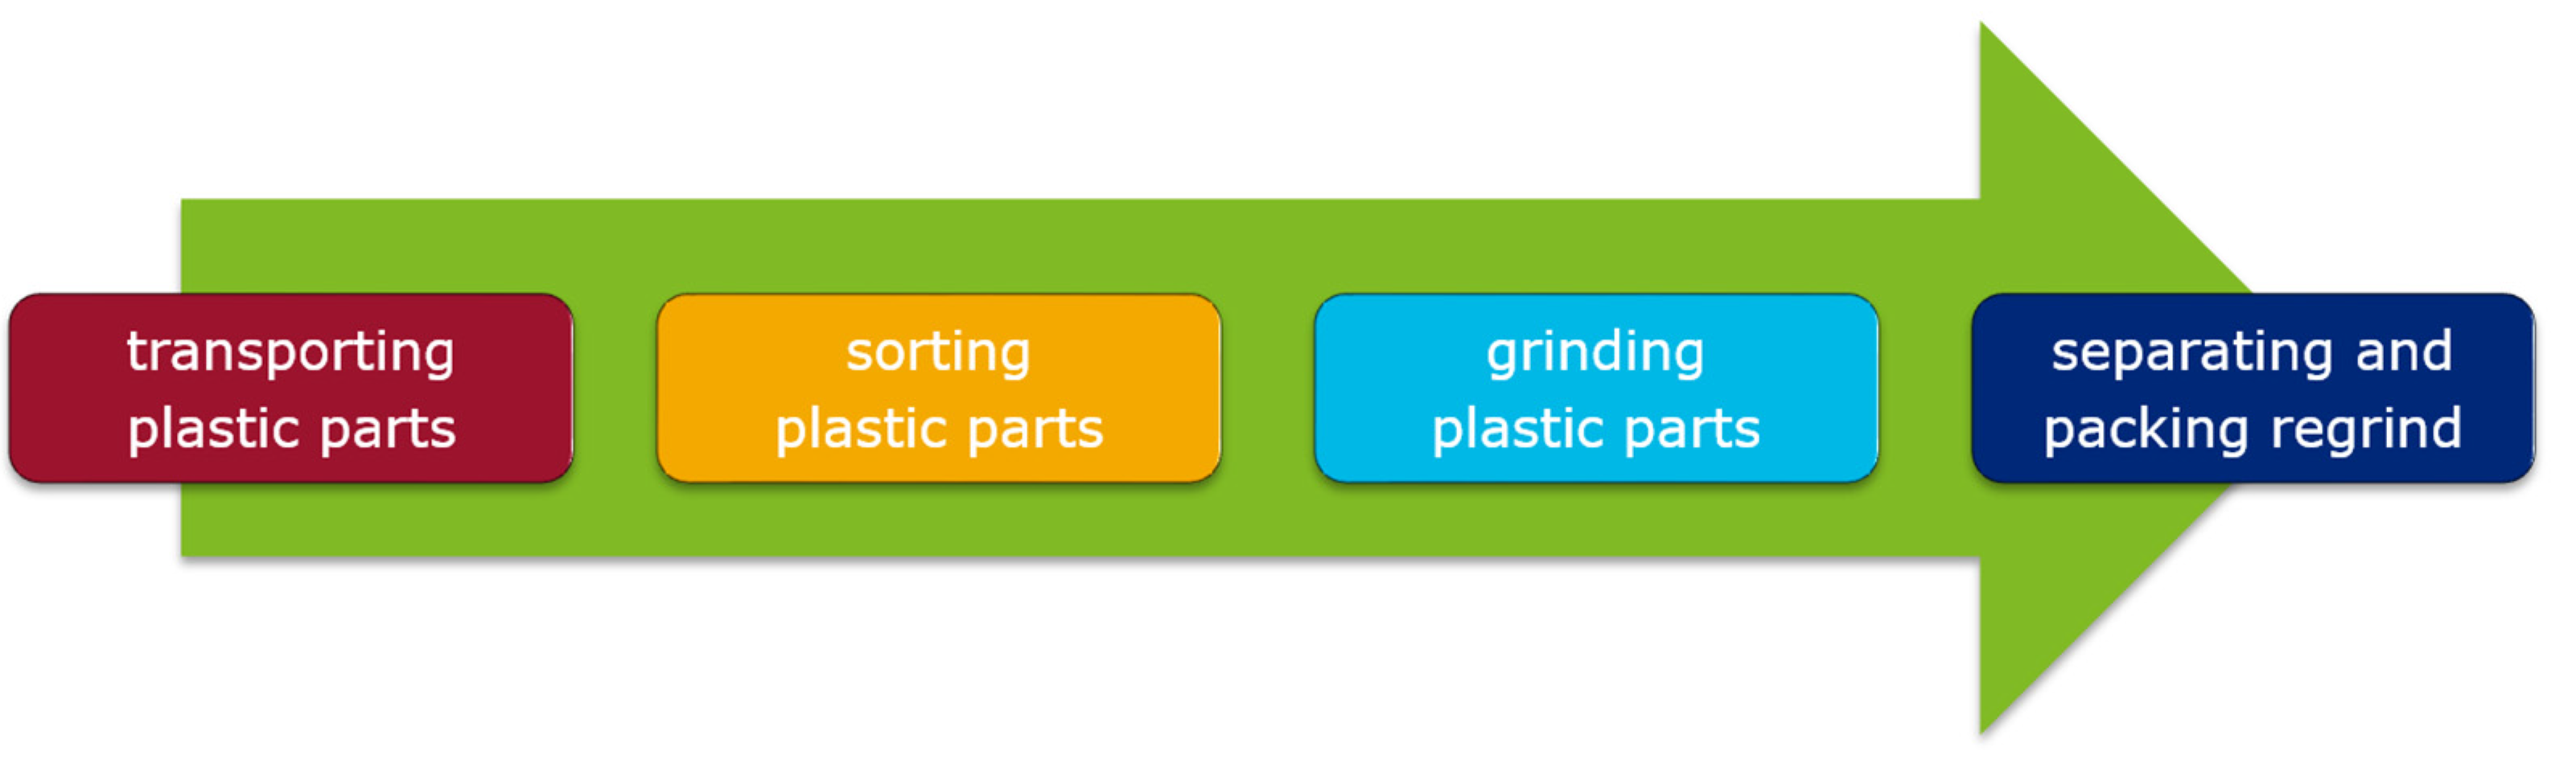
For the modeling of the foreground system, the mechanical recycling process was divided into the four subprocesses “transporting plastic parts”, “sorting plastic parts”, “grinding plastic parts” and “separating and packing regrind”. This subdivision is highlighted in Figure 2.
By defining individual process steps, the inputs and outputs of these process modules were identified, forming the life cycle inventory used in this LCA. The electricity consumption of the entire recycling process was measured for a production time of 1 hour in order to reduce the effect of start-up losses at the beginning of the grinding process in the data acquisition. In addition, the total amount of milled plastic was weighted to calculate the specific electricity consumption of each plastic type.

2.2. Inventory Analysis

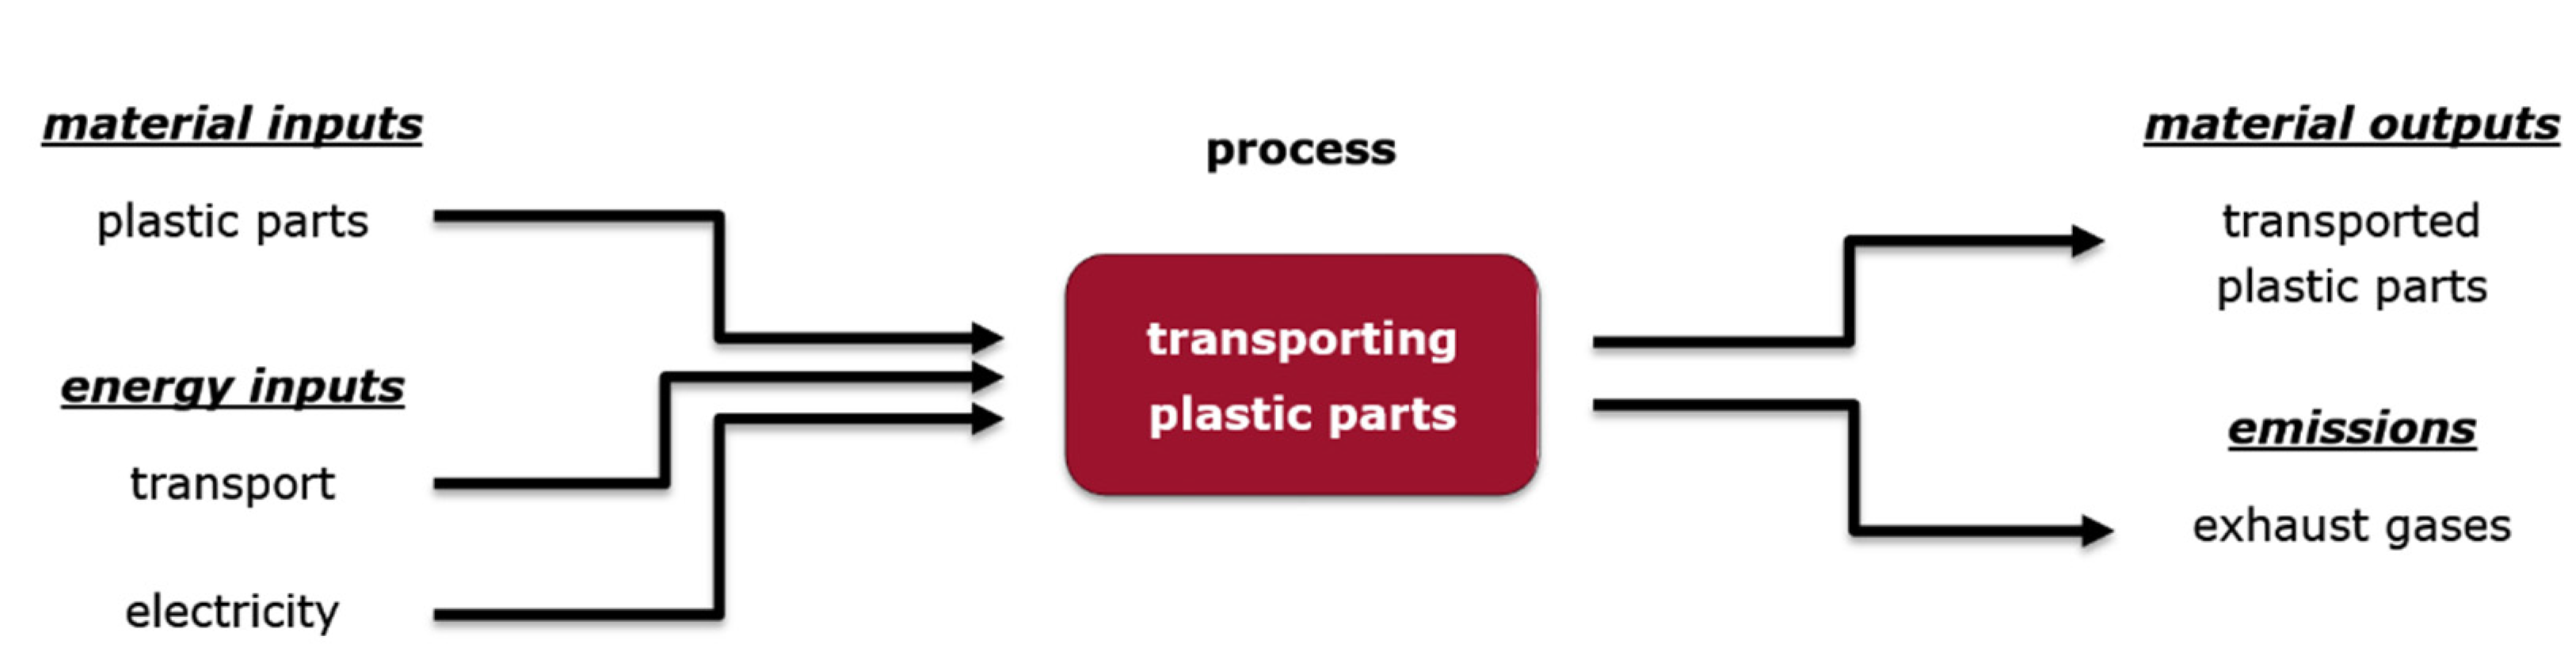
The first subprocess defined as "transporting plastic parts" includes the transport of sorted plastic parts as freight with an average mass of 5 t in a truck over a distance of 25 km to the factory gate as well as the internal transport per pallet truck from the incoming storage area to a lifting platform of the production line. This subprocess is represented by the following process module in Figure 3, which captures the described energy and material flows in terms of process inputs and outputs.
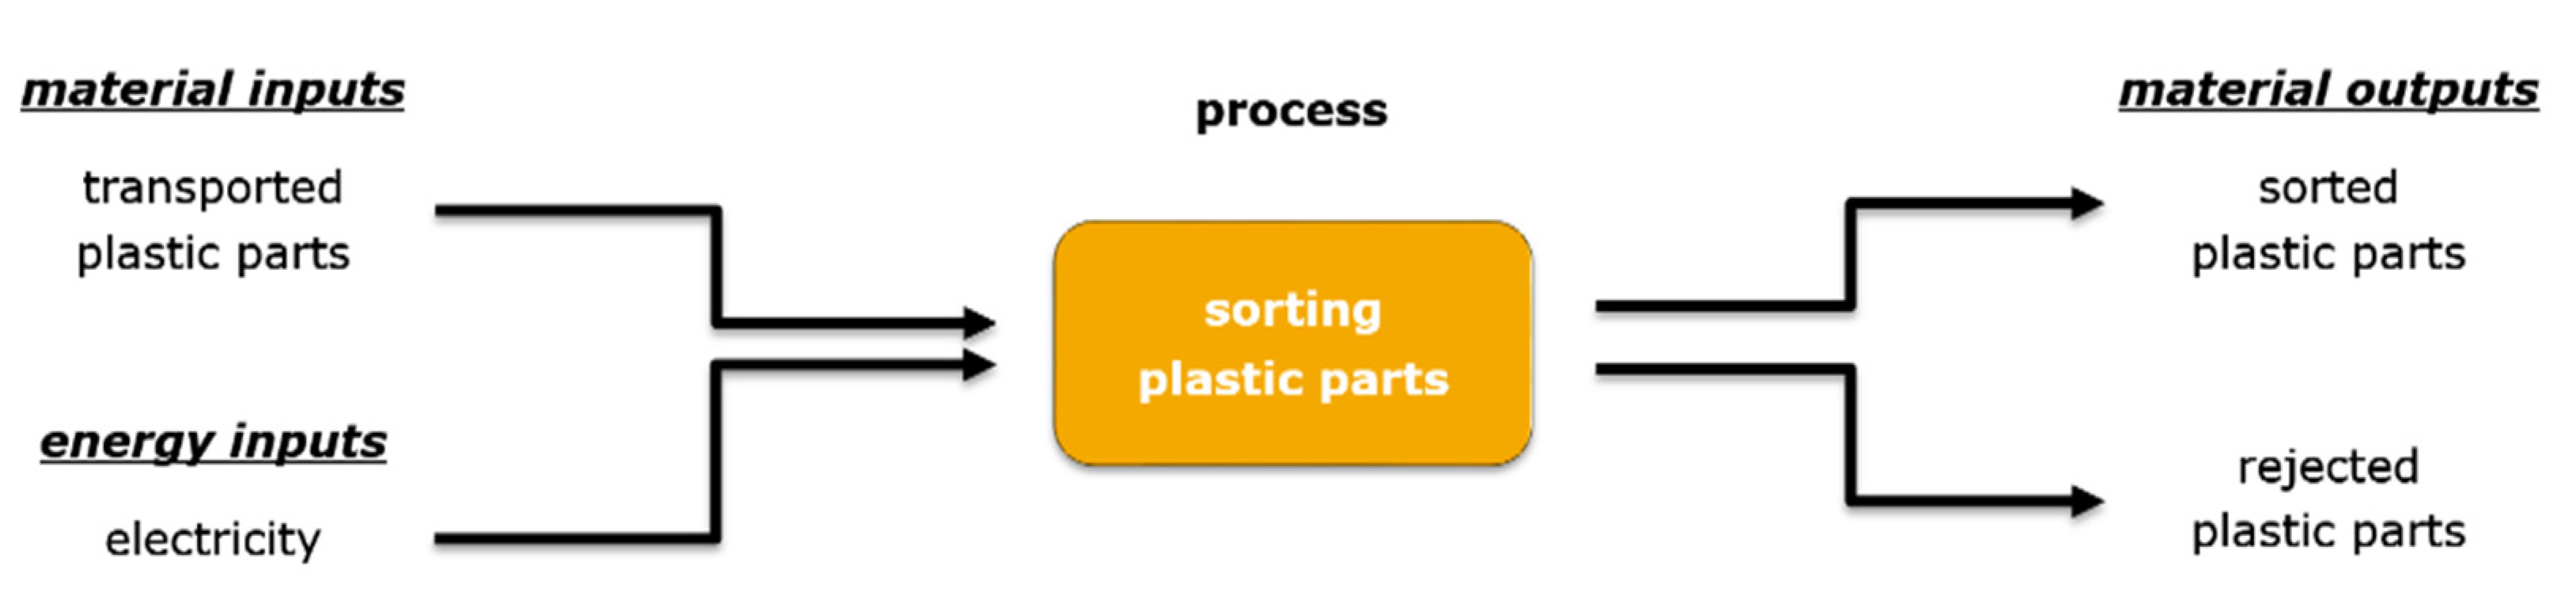
In the next step, shown in Figure 4, the transported plastic parts were inspected for impurities on an assembly line. In this way, foreign materials or even labeled plastic parts were rejected so that only a material flow of the pure plastic type remained. In contrast to post-consumer waste, the material flow of each production line consists of one pure plastic type from a previous production process such as injection molding with virgin pellets. Therefore, the sorting process eliminates on average only 0.1% of the incoming material flow due to the almost non-existent impurities in the post-industrial waste. These rejected plastic parts will not be recycled into regrind. Instead, this part of the material flow has to be disposed of via municipal incineration.
The third subprocess describes the main process of the mechanical recycling by grinding the now transported and sorted plastic parts on a large scale via rotor and stator knives in a grinding mill. After the processing of around 100 t of plastic waste, five rotor knives with a weight of 5.5 kg as well as two stator knives with a mass of 7.3 kg have to be resharpened. This procedure can be repeated about 10 times before a new set of rotor and stator knives has to be installed. In Figure 5, the proportional wear of the knives is taken into account together with all other inputs and outputs for the grinding process.
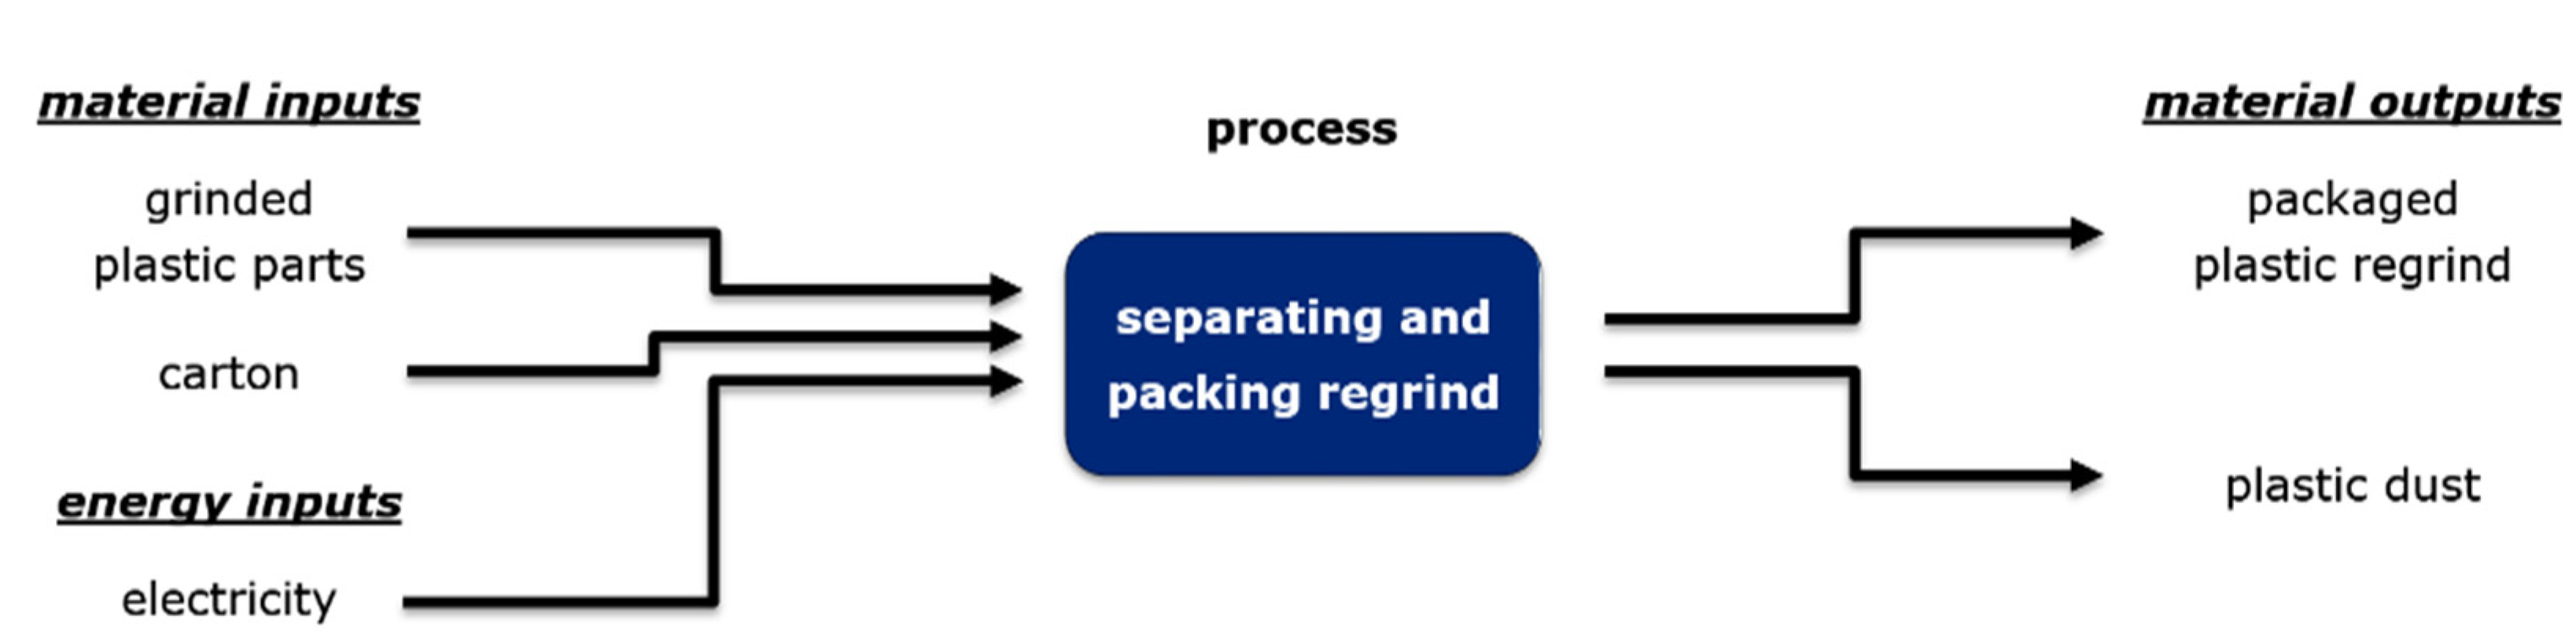
During the grinding of sorted plastic parts, 4% plastic dust was produced, which is separated from the regrind by a conveyor fan with a centrifugal cyclone. Together with the previously rejected plastic parts, this plastic dust has to be disposed of in a municipal waste incineration plant. However, the regrind was packed in an octabin container made of a carton with a fine PE film, which holds a mass of 1 t. This packaging for distribution at the factory was included in the defined system boundary. All inputs and outputs of the last subprocess are highlighted in Figure 6 in one process module.
The energy and material flow determined by the process modules from Figure 3, Figure 4, Figure 5 and Figure 6 formed the life cycle inventory in order to calculate the PCF. The full name of all applied datasets from the database Ecoinvent 3.8 are listed in Table 1 together with the geographical information.

2.3. Impact Assessment

Following ISO 14067, only climate change is addressed as a single impact category in this work to calculate the carbon footprint of the product by applying the IPCC 2013 method for the global warming potential over a 100-year period. The global warming potential of the life cycle inventory builds the PCF expressed in CO2 equivalents (CO2e), which was calculated using the datasets listed in Table 1. In addition, a specific dataset for electricity consumption was used to evaluate the actual state at the plant, so the electricity consumption for the company was quantified at 203 g CO2e/kWh based on data from the municipal energy supplier “Stadtwerke Lüdenscheid”. The results of the LCA are presented in the following Section 3.
Furthermore, the impact of the electricity from the local electricity supplier and the disposal of the plastic waste in a municipal waste incineration plant on the calculation of the PCF were investigated for each type of plastic. Therefore, different datasets for electricity consumption and disposal were used in sensitivity analyses 1 to 3, which are listed in Table 2.
This choice of parameters results from their influence on the PCF and takes into account that these input variables can be adjusted directly by the company as required. The single use of the packaging carton by customers, in contrast, is outside of the producer’s corporate control and is required for risk prevention, as no impurities from the previous use of the packaging are contained. The purpose of the sensitivity analyses is to validate the calculated PCF and to achieve an overall understanding of the main drivers as well as to identify its optimization potential.
Therefore, electricity from the local power supplier was substituted with electricity from renewable sources in the first sensitivity analysis. The dataset "market for electricity, medium voltage, renewable energy products" from the Ecoinvent 3.8 database was implemented accordingly. In contrast to the analysis of the actual state, where plastic dust from different production lines with different types of plastics was collected in a bag, sensitivity analysis 2 shows the effects of incinerating a pure polymer stream via sorted disposal in a municipal waste incineration plant. Thus, the dataset "market for waste plastic, mixture" from Ecoinvent 3.8 was replaced by the material-specific datasets for waste incineration from GaBi SP 40 2020, with the exception of POM, as no dataset for sorted incineration is available for this type of plastic in the databases Ecoinvent 3.8 and GaBi SP 40 2020.
Finally, in a third sensitivity analysis, the optimization potential for reducing the PCF was investigated by applying both datasets from analyses 1 and 2 in combination for all possible types of plastics under study.

3. Results

3.1. Specific Energy Requirement vs. Product Carbon Footprint

By dividing the measured power consumption for grinding the four types of plastic by the weighted mass of milled plastic parts, a specific energy requirement was calculated. In line with other studies [20], the results show that large-scale plastic mills with a high grinding volume per hour have a lower energy requirement per ground mass of plastic, leading to a very low specific energy requirement in comparison to beside-the-machine granulators, which can be integrated into an inline injection molding process. Table 3 highlights the specific energy requirement together with the calculated PCF per 1 kg of regrind for each plastic type. Depending on the strength of the plastic type, the power consumption for grinding the same components varied widely.
A comparison between the calculated PCF of regrind and virgin granulate from the Ecoinvent 3.8 and GaBi SP40 2020 databases shows that the global warming potential of regrind is more than 20 times lower, regardless of which type of plastic is being considered. The results from Table 3 are even much lower than the PCF from studies of other mechanical recycling processes [13]. This is because energy-intensive post-treatments, such as a subsequent extrusion of regrind into regranulate, are not absolutely necessary for the further processing of regrind. Therefore, these post-treatments are excluded from the mechanical recycling process under study, as the regrind can be processed into new products via injection molding. In this case, the regrind directly replaces virgin granulate, so that the energy for a previous melting of the plastic has been saved. However, the calculation of the specific energy requirement also shows that despite the strong increase from POM to PA66GF30, the PCF of the regrind, in contrast, rises only slightly. The following sensitivity analysis illustrates that the electricity consumption of the grinding mill is only responsible for up to 10% of the PCF. Instead, the main driver of the PCF is the incineration of sorted plastic parts together with the plastic dust produced during grinding in a municipal waste incineration plant.

3.2. Sensitivity Analysis of ABS

The investigation of acrylonitrile–butadiene–styrene (ABS) in sensitivity analyses 1 to 3 specifies the impact of different process inputs on the total PCF compared to the actual state of the recycling process. In addition to the consumed electricity and the disposal of dust, Table 4 also lists the use of the packaging cardboard as well as the wear of the knives in the mill and the transport of the plastic parts to the factory gate.
As already mentioned, the results from Table 4 show that the incineration of plastic dust is the main driver of the PCF. However, the single use of the octabin container made of cardboard also has also a strong effect. To illustrate the global warming potential of the life cycle inventory from 1 kg ABS regrind in the sensitivity analyses compared to the actual state of the mechanical recycling process, Figure 7 shows the individual process inputs in CO2 equivalents (CO2e).
Figure 7 shows that the impact of transport as well as the consumption of the carton remains constant across all analyses. In contrast, the sum of all amounts, which corresponds to the PCF, decreases continuously from the actual state of the production process to sensitivity analysis 3. Thus, the environmental impact in the production of ABS regrind can be reduced by about 6% using electricity from regenerative energy sources and by about 7% through the incineration of sorted plastic dust.

3.3. Sensitivity Analysis of PA66GF30

The effects of replacing datasets in the calculation of the PCF of polyamide 6.6 GF30 (PA66GF30) are summarized in Table 5 for sensitivity analyses 1 to 3. As before, the individual components of the life cycle inventory are specified with their global warming potential. To ensure the comparability of the results, the same procedure was used for all types of plastics, so that only the effects caused by electricity consumption and incineration of the plastic waste are evaluated with different CO2 equivalents.
As a result, Table 5 shows an even greater optimization potential for the plastic type PA66GF30 than for ABS in each individual step of the sensitivity analyses 1 to 3. This is illustrated in Figure 8 by the sum of all inputs in green.
Plastic parts made of polyamide have a high mechanical strength, which is further increased by the addition of glass fibers. This leads to a low grinding volume per hour and a high energy consumption of the plastic mill, which is also shown by the specific energy requirement in Table 3. Thus, this plastic type has the highest reduction potential of 10% by using regenerative energies among all evaluated plastics. Due to the chemical composition of the fiber–plastic composite, the glass fiber content also ensures lower CO2 emissions when the plastic dust is burned compared to pure plastics whose polymer chains are based on organic carbon bonds. Therefore, the PCF could be reduced by an additional 19% by changing the recycling process to sorted plastic waste disposal. As shown in Figure 8, sensitivity analysis 3 combines both previous approaches to reach the largest optimization potential of 29%.

3.4. Sensitivity Analysis of PC

Like before, the influence of the individual process inputs on the PCF of 1 kg of regrind was also calculated for polycarbonate (PC). The results are presented together with the sensitivity analyses 1 to 3 in Table 6.
In contrast to all other plastics under study, the calculated PCF for PC in sensitivity analysis 2 is the highest of all four calculated cases. This is highlighted in Figure 9.
Based on the stoichiometric composition of PC, its incineration produces a higher amount of CO2 emissions than the average greenhouse gas potential of exhaust gases from the combustion of unsorted plastic waste in a municipal waste incineration plant. The PCF in sensitivity analysis 2 increases even more than it can be reduced by the use of regenerative energies in sensitivity analysis 1, so even in a combination of both datasets in sensitivity analysis 3, the PCF is increased by 5% compared to the actual state.

3.5. Sensitivity Analysis of POM

Since no dataset for sorted disposal of polyoxymethylene (POM) is available in the material databases, only the change of the local power supplier to regenerative energy is investigated in sensitivity analysis 1. The comparison with the results of the actual production process of regrind is listed in Table 7.
A comparison of sensitivity analysis 1 with the actual state shows that the change to green electricity has only a minor impact of just under −4% on the total PCF, since as shown in Table 3, the grinding of POM has by far the lowest specific energy requirement.

4. Discussion

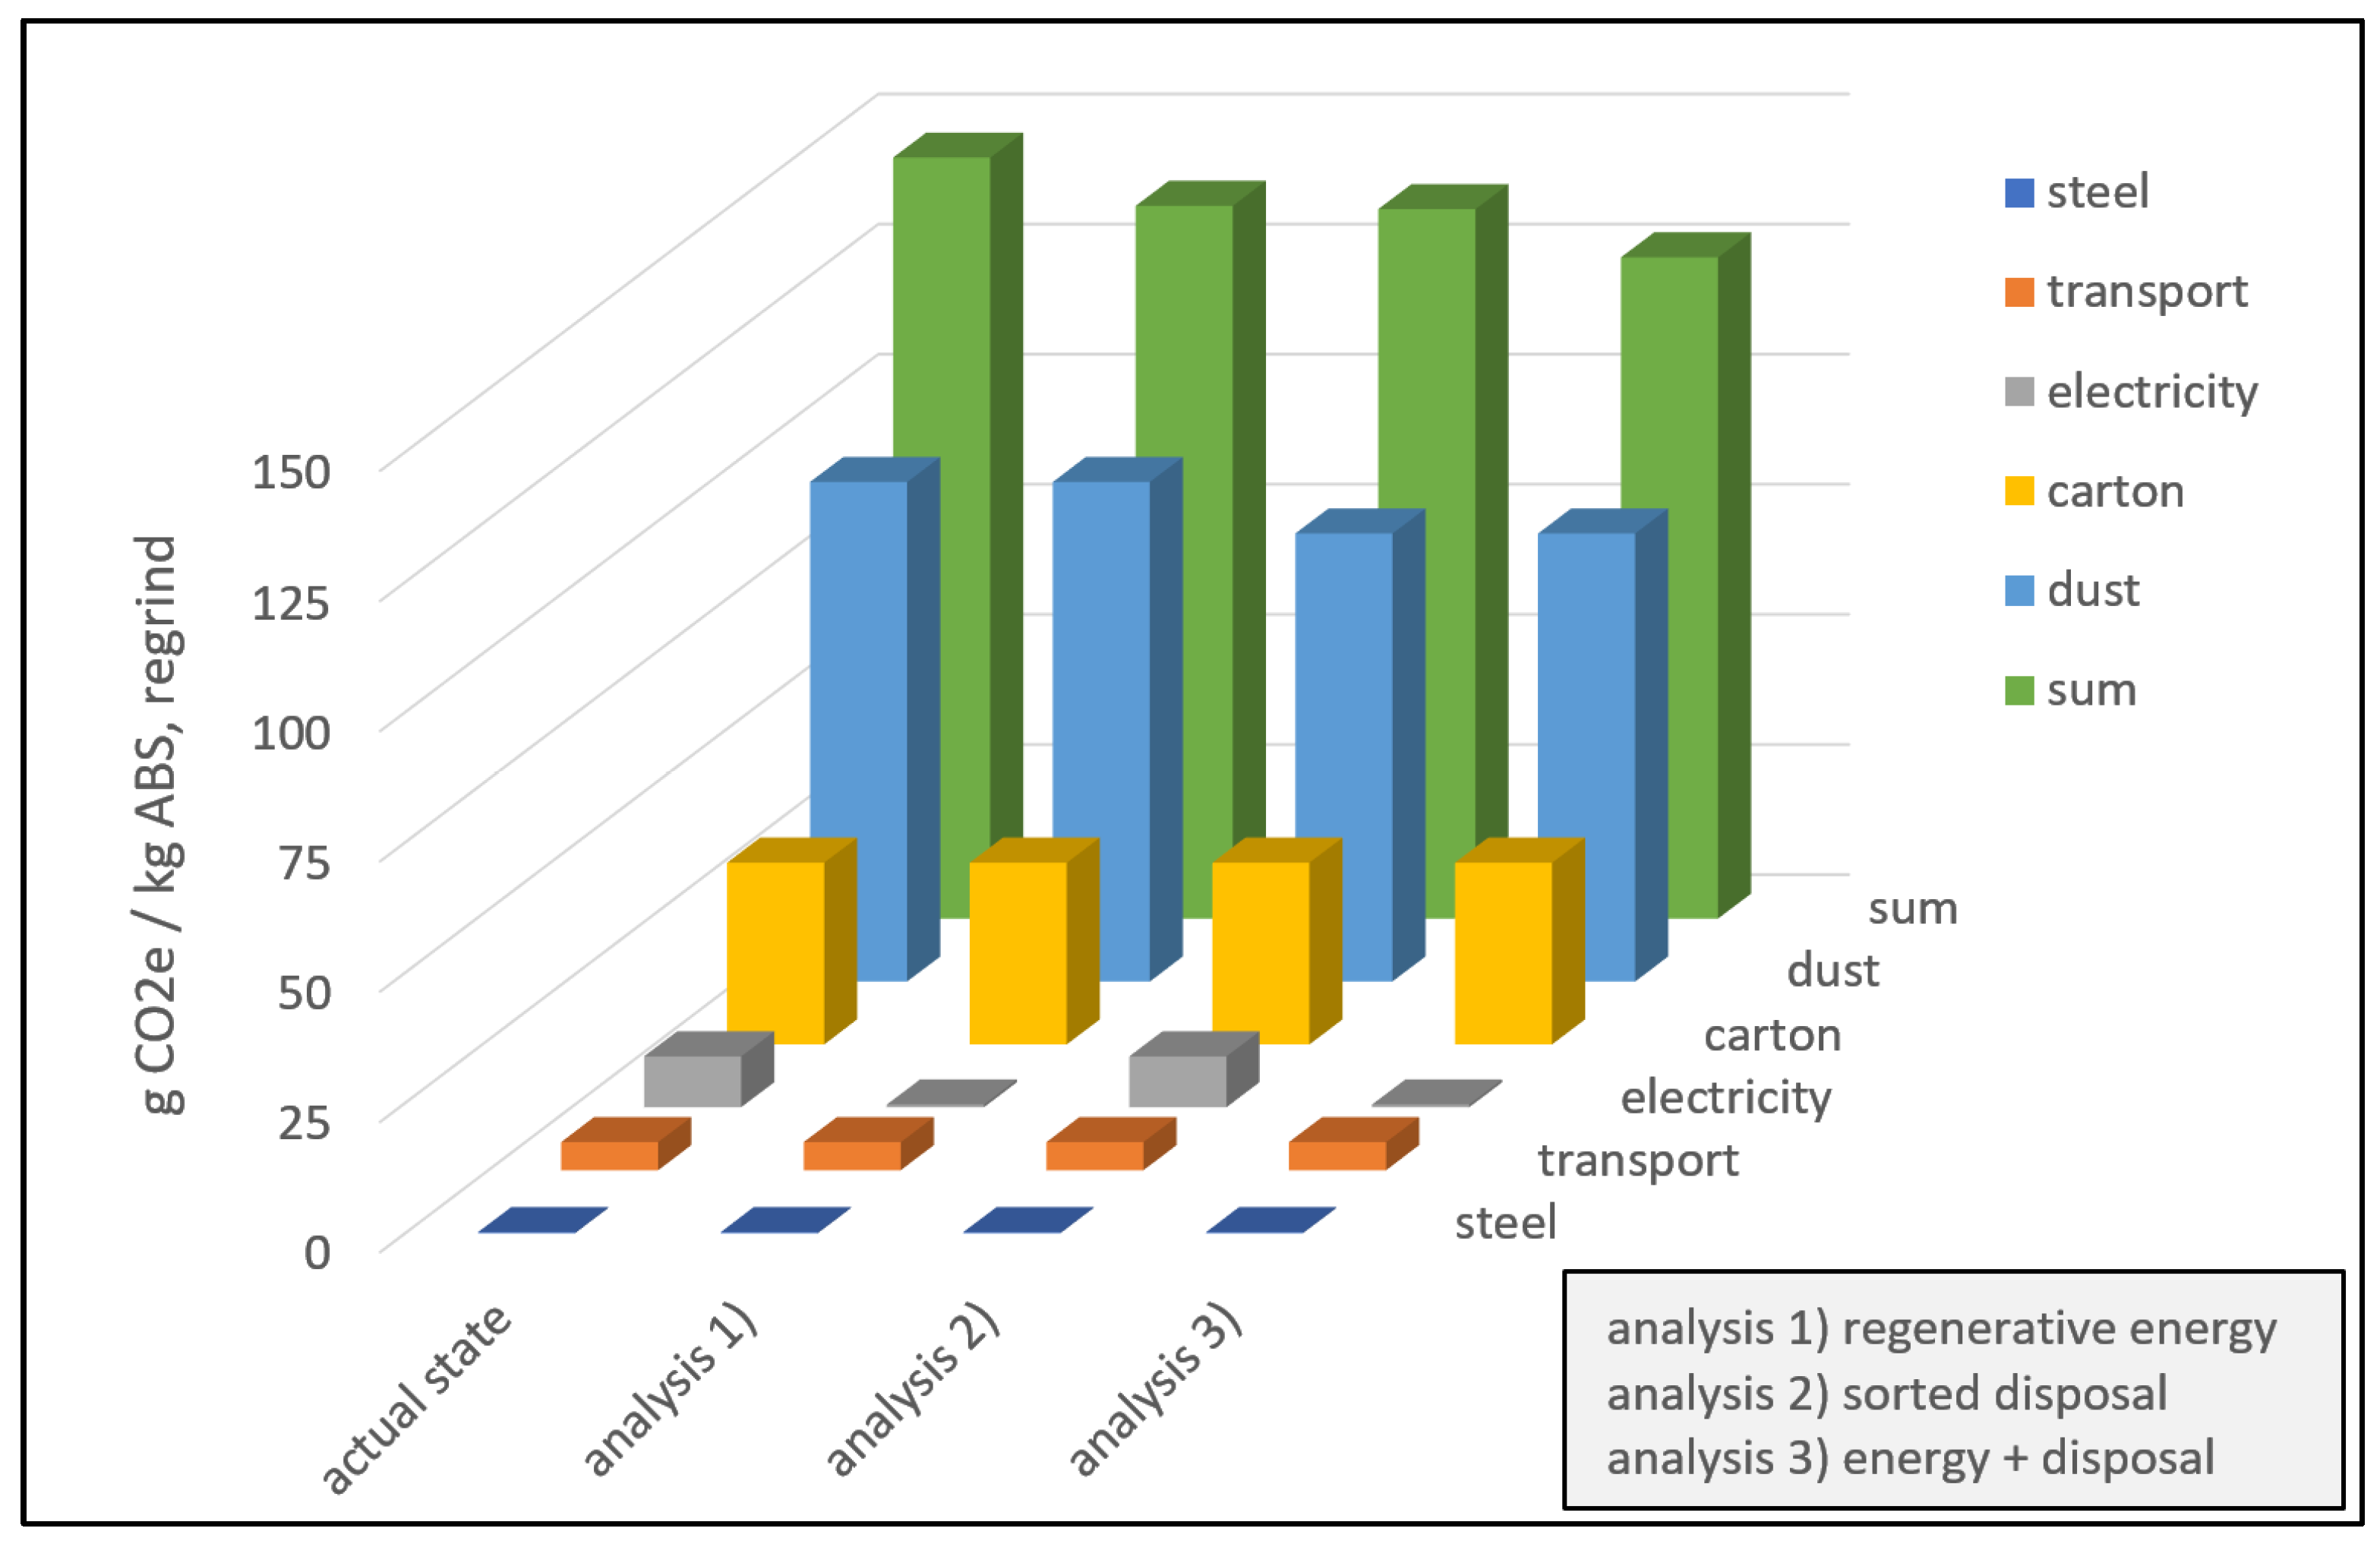
The sensitivity analyses 1 to 3 have shown how strongly the calculated PCF for the plastics ABS, PA66GF30, PC and POM depends on the datasets for electricity as well as for the type of waste disposal. This reflects the validity of the results for their use in other LCAs and the potential to reduce the global warming potential of the recycling process as well. For this purpose, the calculation of the PCF according to the actual state followed the guidelines of a consequential LCA, where the effects of decisions in the product system, such as the collection of dust from different plastic types in one bag, are recorded in the life cycle inventory. Sensitivity analysis 2, on the other hand, corresponds to the exclusive evaluation of the pure material flow in terms of an attributional LCA [21]. In this regard, a summary of the sensitivity analyses compared to the actual state of the recycling process is presented in Table 8.
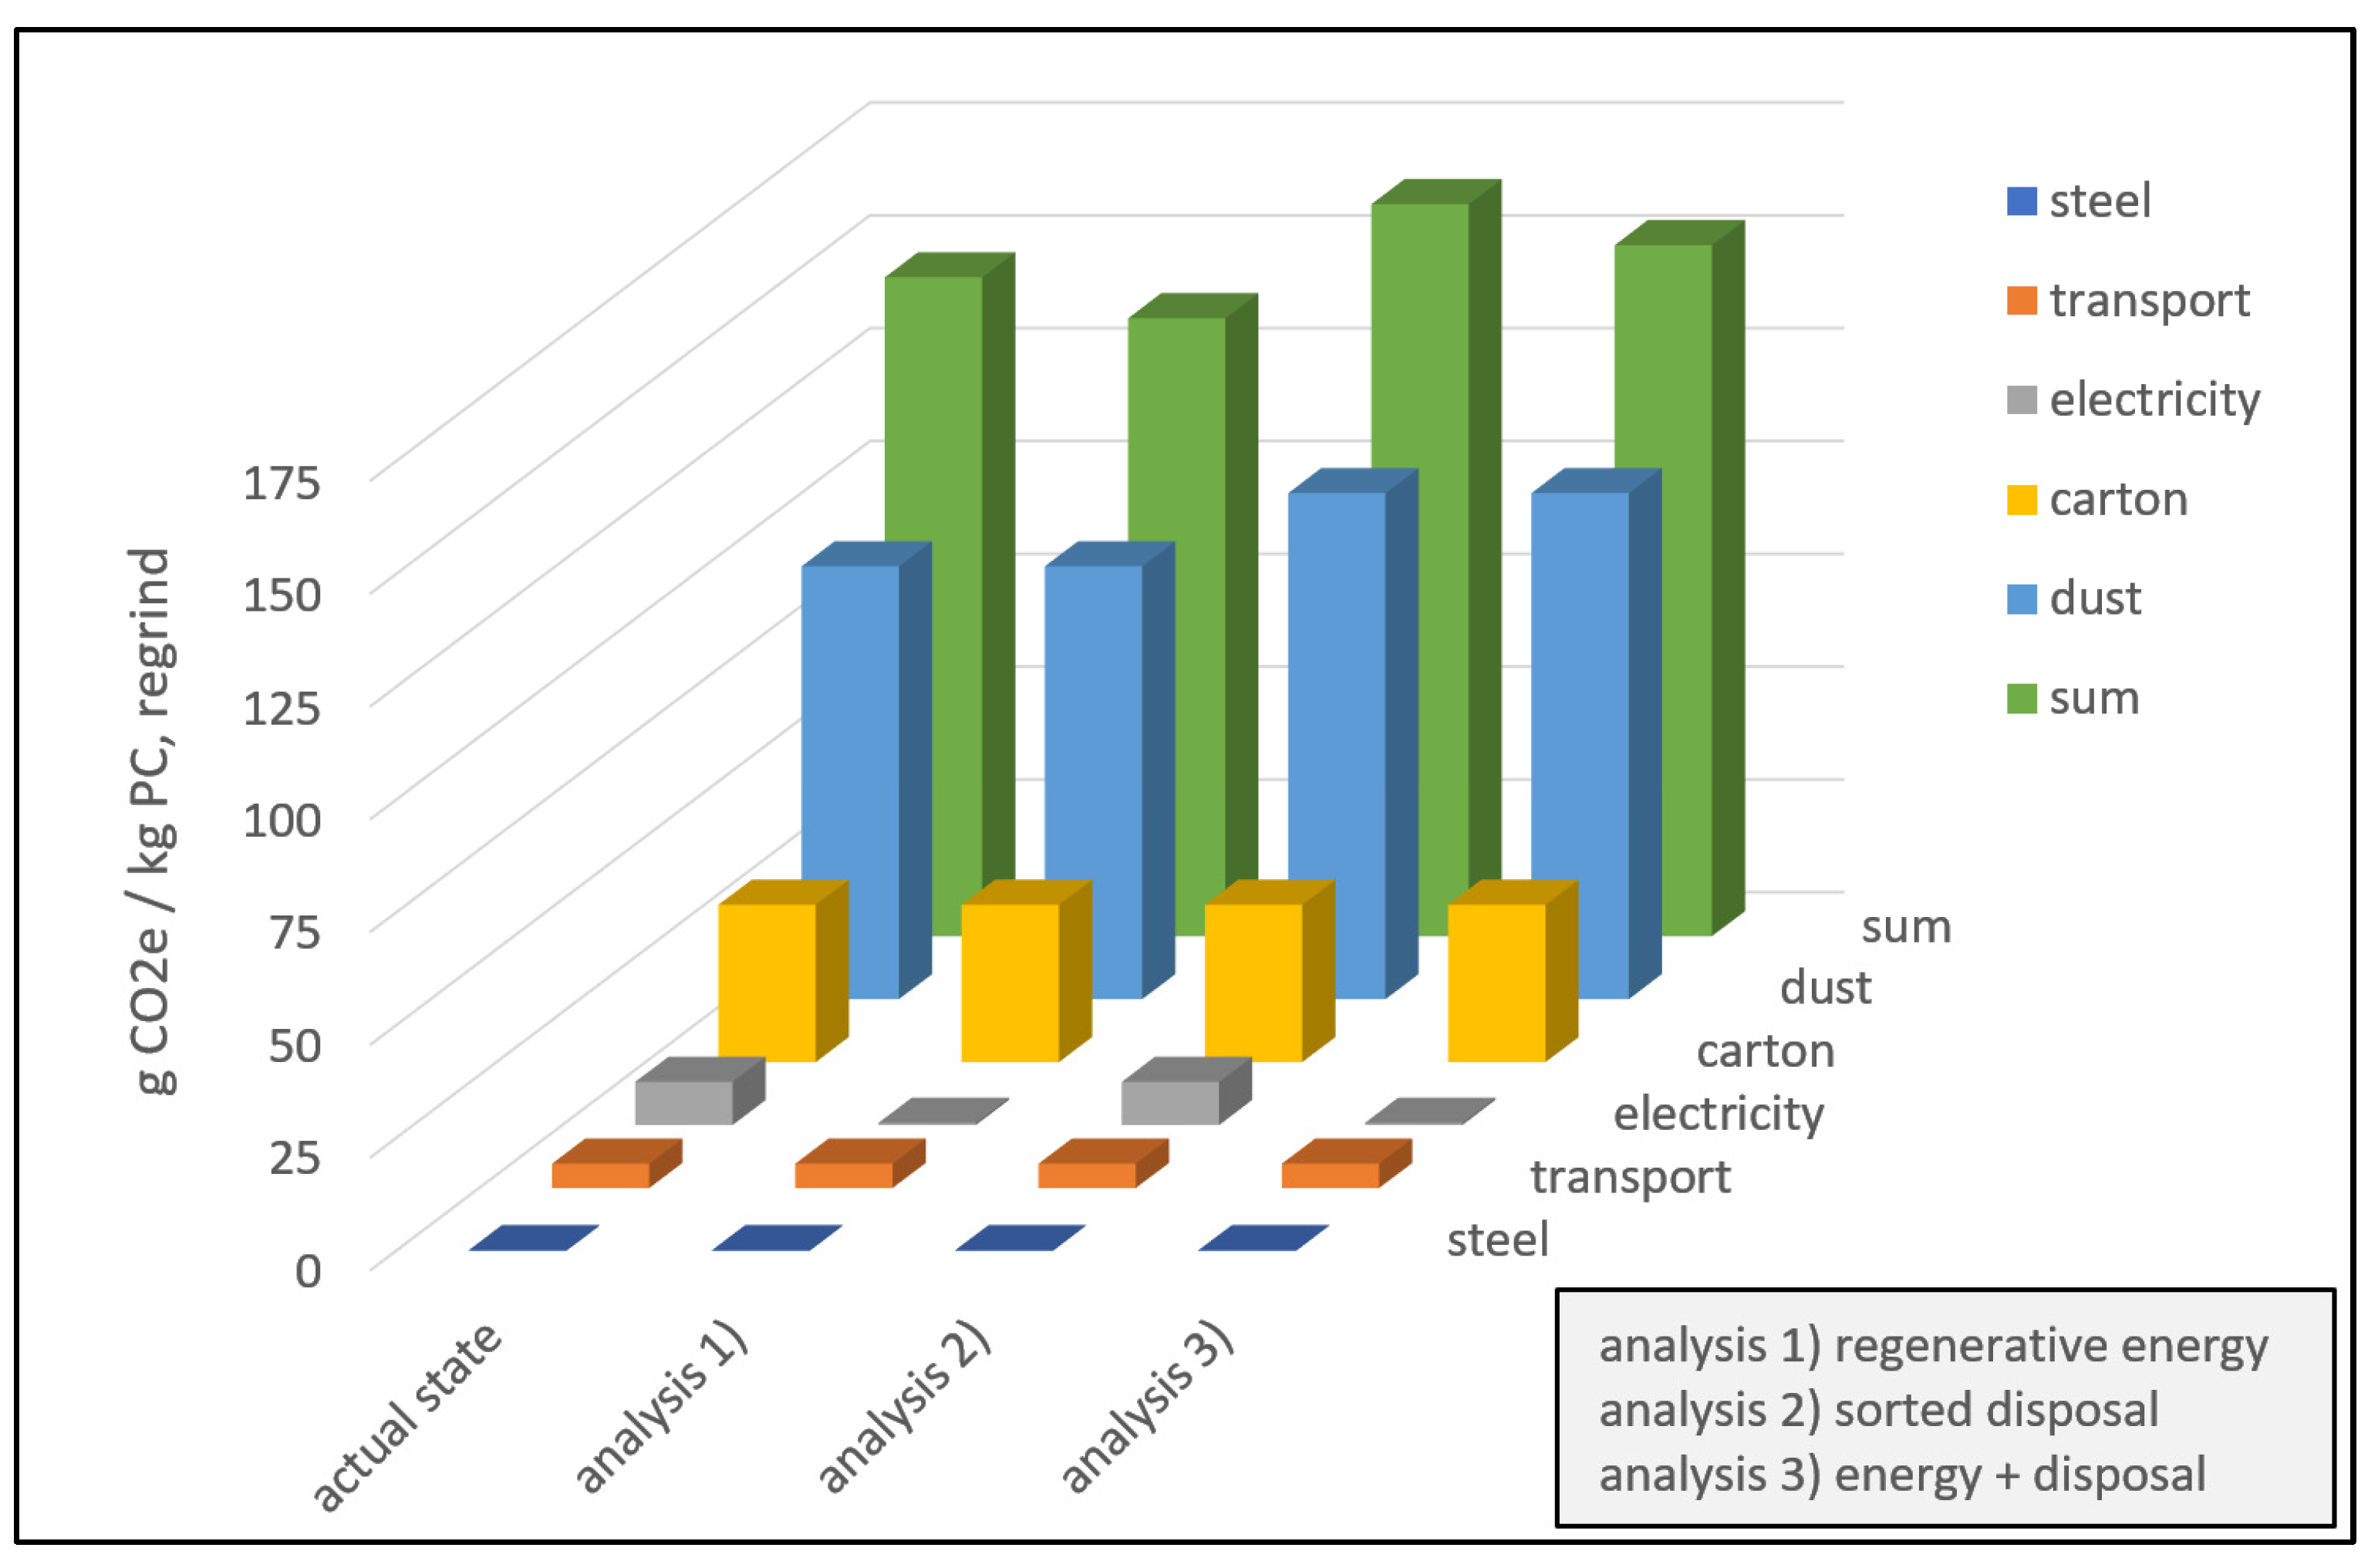
Based on the results for PC in Table 8, it is considered that a safety margin of 11% should be applied when using the calculated PCF, since the balancing of sorted disposal in sensitivity analysis 2, which may be applied in the production of regrind by other manufacturers, leads to an increased global warming potential. Due to the incomplete data on the plastic POM in terms of sorted disposal, it is also suggested to adopt the safety margin of 11% from PC following the chemical composition based on organic carbon bonds. In contrast, the plastics ABS and PA66GF30 show an optimization potential when the sorted disposal in sensitivity analysis 2 is applied to the actual state, so a safety margin for the PCF of these plastic types is not required. Sensitivity analysis 1 in Table 8 presents a reduction in the PCF of all plastic types, with an increasing reduction in line with the specific energy requirement from Table 3. However, it remains to be seen that the electricity used in the actual state already has a low global warming potential, so the optimization is more limited than that with other manufacturers. Nevertheless, for the combined effects of renewable energy and sorted disposal, PA66GF30 shows the highest optimization potential of 28.9% for reducing the PCF of 1 kg of regrind in sensitivity analysis 3.
The main driver for the PCF of all investigated plastic types was identified as the incineration of plastic dust, which is produced in the subprocess of grinding plastic parts. Knife wear, on the other hand, contributes less than 1% to the PCF of regrind. Therefore, from an ecological point of view, it could be useful to resharpen the knives of the mill more frequently, if this can significantly reduce the amount of plastic dust.
Overall, the results for regrind of the actual state and the sensitivity analyses show a reduction in the global warming potential of at least 95% compared to virgin granulate according to the datasets from Ecoinvent 3.8 and GaBi SP40 2020, regardless of which type of plastic is considered. Based on the macroscopic view in the introduction of this work, around 1 million tons of plastic recyclates from post-industrial waste were processed in 2019 in Germany [4]. Starting from a general approximation of 0.15 kg CO2e/kg regrind, the current substitution of virgin granulate with recyclate already results in a saving of 2.85 million tons of CO2e as shown in Equation (1).
( 3   kgCO 2 e / kg 0.15   kgCO 2 e / kg ) · 10 9   kg = 2.85 × 10 6   tCO 2 e
By scaling the share of 6.5% [4] of recyclate from post-industrial waste processed in 2019 up to 20% until the year 2030, there is an savings potential from the substitution of virgin granulate of about 8.77 million tons of CO2e, illustrated by Equation (2).
2.85 × 10 6   tCO 2 e · 20   % 6.5   % = 8.77 × 10 6   tCO 2 e
In this context, it is important to note that a mass fraction of 20% of recycled material can be still processed by injection molding without losses in product quality [7]. Consequently, the mechanical recycling of post-industrial waste represents a valid contribution to the achievement of the greenhouse gas reduction targets, which amount to a maximum of 118 million tons of CO2e in the industrial sector in 2030 according to the German Federal Climate Change Act [22].

5. Conclusions

For the investigated types of plastics ABS, PA66GF30, PC and POM, it was shown that the calculated product carbon footprint (PCF) of regrind is lower than the PCF of virgin granulate by at least a factor of 20. In production processes such as injection molding, this regrind can replace virgin material without a prior extrusion to granulate. This offers great potential for reducing the PCF of various plastic products and achieving greenhouse gas reduction targets. For an improved transparency, all drivers of the PCF were identified based on an individual collected life cycle inventory for each type of plastic in this study. Thus, the calculated PCF of regrind can be adapted in further LCAs by using the measured specific energy requirement for grinding the respective type of plastic together with the global warming potential from customized electricity consumption. In addition, the results of several sensitivity analyses highlight further opportunities to optimize the mechanical recycling process to reduce the PCF of PA66GF30 regrind by up to 29% and demonstrate the validity of the results from the analyzed manufacturing process.
As an outlook for further studies, the formation of plastic dust should be investigated as a function of the sharpness of knives in the grinding mill, since plastic dust has been identified as by far the main driver for the PCF of regrind.

Author Contributions

Conceptualization, J.T. and H.R.; methodology, J.T. and H.R.; software, J.T.; validation, T.d.A. and H.R.; formal analysis, J.T.; investigation, J.T.; resources, H.R.; data curation, J.T. and T.d.A.; writing—original draft preparation, J.T.; writing—review and editing, J.T.; visualization, J.T.; supervision, H.R.; project administration, H.R.; funding acquisition, H.R. All authors have read and agreed to the published version of the manuscript.

Funding

As part of the project “SekÄqui” (35250/01), this research was funded by the German Federal Environmental Foundation. https://www.dbu.de/english (accessed on 5 December 2022).

Institutional Review Board Statement

Not applicable.

Informed Consent Statement

Not applicable.

Data Availability Statement

Restrictions apply to the availability of these data. Data was obtained from “Kunststofferzeugnisse Occhipinti” and are available from the authors with the permission of “Kunststofferzeugnisse Occhipinti”.

Acknowledgments

The authors would like to thank all partners in the research project “SekÄqui” for their professional support, especially for the expertise of the “Effizienz-Agentur NRW” on resource efficiency. Furthermore, we would like to thank “Kunststoff-Institut Lüdenscheid” for measuring the specific energy requirement for grinding the plastics under investigation. Finally, our special thanks go to the company “Kunststofferzeugnisse Occhipinti” for the detailed description of their production processes as well as for the permission to publish the collected data.

Conflicts of Interest

The authors declare no conflict of interest.

References

  1. Geyer, R.; Jambeck, J.R.; Law, K.L. Production, use, and fate of all plastics ever made. Sci. Adv. 2017, 3, e1700782. [Google Scholar] [CrossRef] [Green Version]
  2. Braun, N.; Wilts, H.; Zeher, C.; Loth, J.; Tesch, M. Kunststoff: Auf dem Weg zur Kreislaufwirtschaft. Available online: https://redaktion.hessen-agentur.de/publication/2021/3662_Kunststoff_Kreislauf_2021_WEB.pdf (accessed on 23 August 2022).
  3. Plastics Europe. Plastics-the Facts 2021: An Analysis of European Plastics Production, Demand and Waste Data. Available online: https://plasticseurope.org/wp-content/uploads/2021/12/AF-Plastics-the-facts-2021_250122.pdf (accessed on 23 August 2022).
  4. Conversio Market & Strategy GmbH. Stoffstrombild Kunststoffe in Deutschland 2019. Available online: https://www.conversio-gmbh.com/res/News_Media/2020/Kurzfassung_Stoffstrombild_2019.pdf (accessed on 23 August 2022).
  5. Schyns, Z.O.G.; Shaver, M.P. Mechanical Recycling of Packaging Plastics: A Review. Macromol. Rapid Commun. 2021, 42, 2000415. [Google Scholar] [CrossRef] [PubMed]
  6. ISO 15270:2008; Plastics-Guidelines for the Recovery and Recycling of Plastics Waste. Technical Committee ISO/TC 61; International Organization for Standardization: Geneva, Switzerland, 2008.
  7. Archodoulaki, V.-M.; Lüftl, S.; Koch, T.; Seidler, S. Property changes in polyoxymethylene (POM) resulting from processing, ageing and recycling. Polym. Degrad. Stab. 2007, 92, 2181–2189. [Google Scholar] [CrossRef]
  8. Oblak, P.; Gonzalez-Gutierrez, J.; Zupančič, B.; Aulova, A.; Emri, I. Processability and mechanical properties of extensively recycled high density polyethylene. Polym. Degrad. Stab. 2015, 114, 133–145. [Google Scholar] [CrossRef]
  9. Vollmer, I.; Jenks, M.J.F.; Roelands, M.C.P.; White, R.J.; van Harmelen, T.; De Wild, P.; van der Laan, G.P.; Meirer, F.; Keurentjes, J.T.F.; Weckhuysen, B.M. Beyond Mechanical Recycling: Giving New Life to Plastic Waste. Angew. Chem. Int. Ed. 2020, 59, 15402–15423. [Google Scholar] [CrossRef] [PubMed] [Green Version]
  10. Shamsuyeva, M.; Endres, H.-J. Plastics in the context of the circular economy and sustainable plastics recycling: Comprehensive review on research development, standardization and market. Compos. Part C Open Access 2021, 6, 100168. [Google Scholar] [CrossRef]
  11. Jeswani, H.; Krüger, C.; Russ, M.; Horlacher, M.; Antony, F.; Hann, S.; Azapagic, A. Life cycle environmental impacts of chemical recycling via pyrolysis of mixed plastic waste in comparison with mechanical recycling and energy recovery. Sci. Total Environ. 2021, 769, 144483. [Google Scholar] [CrossRef]
  12. Tanti, K.; Rochman, A.; Refalo, P. Analysing the Sustainability of Cascade Recycling in Plastic Manufacturing. IOP Conf. Ser. Mater. Sci. Eng. 2021, 1196, 12021. [Google Scholar] [CrossRef]
  13. Schwarz, A.E.; Ligthart, T.N.; Godoi Bizarro, D.; De Wild, P.; Vreugdenhil, B.; van Harmelen, T. Plastic recycling in a circular economy; determining environmental performance through an LCA matrix model approach. Waste Manag. 2021, 121, 331–342. [Google Scholar] [CrossRef]
  14. European Comission. PEFCR Guidance document: Guidance for the Development of Product Environmental Footprint Category Rules. Version 6.3. Available online: https://ec.europa.eu/environment/eussd/smgp/pdf/PEFCR_guidance_v6.3.pdf (accessed on 24 August 2022).
  15. Geyer, R.; Kuczenski, B.; Zink, T.; Henderson, A. Common Misconceptions about Recycling. J. Ind. Ecol. 2016, 20, 1010–1017. [Google Scholar] [CrossRef]
  16. ISO 14067:2018; Greenhouse Gases—Carbon Footprint of Products—Requirements and Guidelines for Quantification. European Committee for Standardization: Brussels, Belgium, 2018.
  17. ISO 14040:2006 + Amd 1:2020; Environmental Management—Life Cycle Assessment—Principles and Framework. European Committee for Standardization: Brussels, Belgium, 2020.
  18. Huijbregts, M.A.J.; Steinmann, Z.J.N.; Elshout, P.M.F.; Stam, G.; Verones, F.; Vieira, M.; Zijp, M.; Hollander, A.; van Zelm, R. ReCiPe2016: A harmonised life cycle impact assessment method at midpoint and endpoint level. Int. J. Life Cycle Assess 2017, 22, 138–147. [Google Scholar] [CrossRef]
  19. Wernet, G.; Bauer, C.; Steubing, B.; Reinhard, J.; Moreno-Ruiz, E.; Weidema, B. The ecoinvent database version 3 (part I): Overview and methodology. Int. J. Life Cycle Assess 2016, 21, 1218–1230. [Google Scholar] [CrossRef]
  20. Shuaib, N.A.; Mativenga, P.T. Energy demand in mechanical recycling of glass fibre reinforced thermoset plastic composites. J. Clean. Prod. 2016, 120, 198–206. [Google Scholar] [CrossRef]
  21. Kousemaker, T.M.; Jonker, G.H.; Vakis, A.I. LCA Practices of Plastics and Their Recycling: A Critical Review. Appl. Sci. 2021, 11, 3305. [Google Scholar] [CrossRef]
  22. Bundesministerium für Umwelt, Naturschutz, Nukleare Sicherheit und Verbraucherschutz. Bundes-Klimaschutzgesetz: KSG. Available online: https://www.bmuv.de/gesetz/bundes-klimaschutzgesetz (accessed on 29 September 2022).
Figure 1. Inputs and outputs for the mechanical recycling process: (a) Sprues from an injection molding process were used as input; (b) regrind with different particle sizes as the requested output.
Waste 01 00010 g001
Figure 2. Subdivision of the mechanical recycling process.
Waste 01 00010 g002
Figure 3. Inputs and outputs of the process module: “transporting plastic parts”.
Waste 01 00010 g003
Figure 4. Inputs and outputs of the process module: “sorting plastic parts”.
Waste 01 00010 g004
Figure 5. Inputs and outputs of the process module: “grinding plastic parts”.
Waste 01 00010 g005
Figure 6. Inputs and outputs of the process module: “separating and packing regrind”.
Waste 01 00010 g006
Figure 7. Global warming potential in CO2 equivalents (CO2e) of 1 kg ABS regrind.
Waste 01 00010 g007
Figure 8. Global warming potential in CO2 equivalents (CO2e) of 1 kg PA66GF30 regrind.
Waste 01 00010 g008
Figure 9. Global warming potential in CO2 equivalents (CO2e) of 1 kg PC regrind.
Waste 01 00010 g009
Table 1. Applied datasets to calculate the Product Carbon Footprint.
DatasetLocationDatabase
market for transport, freight, lorry 7.5–16 metric tonEuropeEcoinvent 3.8
steel production, electric, chromium steel 18/8EuropeEcoinvent 3.8
market for scrap steelEurope without SwitzerlandEcoinvent 3.8
market for folding boxboard cartonEuropeEcoinvent 3.8
packaging film production, low-density polyethyleneEuropeEcoinvent 3.8
market for waste plastic, mixtureGermanyEcoinvent 3.8
Table 2. Applied datasets in the sensitivity analyses.
DatasetLocationDatabase
sensitivity analysis 3sensitivity analysis 1market for electricity, medium voltage, renewable energy productsSwitzerlandEcoinvent 3.8
sensitivity
analysis 2
acrylonitrile–butadiene–styrene (ABS) in waste incineration plantGermanyGaBi SP40 2020
professional database
polyamide (PA) 6.6 GF30 in waste incineration plantEuropeGaBi SP40 2020
professional database
polycarbonate (PC) in waste incineration plantEuropeGaBi SP40 2020
professional database
Table 3. Specific Energy Requirement and Product Carbon Footprint per 1 kg regrind.
Plastic TypeSpecific Energy
Requirement
Product Carbon Footprint
acrylonitrile–butadiene–styrene (ABS)0.172 MJ/kg146 g CO2e/kg
polyamide 6.6 GF30 (PA66GF30)0.278 MJ/kg152 g CO2e/kg
polycarbonate (PC)0.169 MJ/kg146 g CO2e/kg
polyoxymethylene (POM)0.098 MJ/kg142 g CO2e/kg
Table 4. Life cycle inventory of the Product Carbon Footprint from 1 kg ABS regrind.
CO2e in gSteelTransportElectricityCartonDustSum
actual state0.205.409.7934.8895.95146.21
analysis 1)0.205.400.5234.8895.95136.95
analysis 2)0.205.409.7934.8886.05136.31
analysis 3)0.205.400.5234.8886.05127.05
Table 5. Life cycle inventory of the Product Carbon Footprint from 1 kg PA66GF30 regrind.
CO2e in gSteelTransportElectricityCartonDustSum
actual state0.205.4015.8734.8895.95152.30
analysis 1)0.205.400.8534.8895.95137.28
analysis 2)0.205.4015.8734.8866.59122.94
analysis 3)0.205.400.8534.8866.59107.92
Table 6. Life cycle inventory of the Product Carbon Footprint from 1 kg PC regrind.
CO2e in gSteelTransportElectricityCartonDustSum
actual state0.205.409.6034.8895.95146.02
analysis 1)0.205.400.5134.8895.95136.94
analysis 2)0.205.409.6034.88112.16162.23
analysis 3)0.205.400.5134.88112.16153.15
Table 7. Life cycle inventory of the Product Carbon Footprint from 1 kg POM regrind.
CO2e in gSteelTransportElectricityCartonDustSum
actual state0.205.405.5934.8895.95142.02
analysis 1)0.205.400.3034.8895.95136.73
Table 8. Product Carbon Footprint of the sensitivity analyses compared with the actual state.
CO2e in g/kg RegrindABSPA66GF30PCPOM
actual state146152146142
analysis 1) renewable energy137 (−6.2%)137 (−9.9%)137 (−6.2%)137 (−3.5%)
analysis 2) sorted disposal136 (−6.9%)123 (−19.1%)162 (+11.0%)-
analysis 3) energy + disposal127 (−13.0%)108 (−28.9%)153 (+4.8%)-
Disclaimer/Publisher’s Note: The statements, opinions and data contained in all publications are solely those of the individual author(s) and contributor(s) and not of MDPI and/or the editor(s). MDPI and/or the editor(s) disclaim responsibility for any injury to people or property resulting from any ideas, methods, instructions or products referred to in the content.

