Proceeding Paper

Contribution to the Characterization of the Kidney Ultrasound Image Using Singularity Levels †

by
Mustapha Tahiri Alaoui
1,2,* and
Redouan Korchiyne
3
1
Laboratoire d’Informatique, Mathématique Appliquées, Intelligence Artificielle et Reconnaissance de Formes (LIMIARF), Analysis and Conception of Systems (ACSYS), Faculty of Sciences, Mohammed V University, Rabat 10140, Morocco
2
Hassan II Academy of Science and Technology, Rabat 10100, Morocco
3
Computer Research Laboratory, Superior School of Technology, Ibn Tofaïl University, Kenitra 14000, Morocco
*
Author to whom correspondence should be addressed.
Presented at the 3rd International Day on Computer Science and Applied Mathematics, Errachidia, Morocco, 13 May 2023.
Comput. Sci. Math. Forum 2023, 6(1), 12; https://doi.org/10.3390/cmsf2023006012
Published: 28 September 2023
(This article belongs to the Proceedings of The 3rd International Day on Computer Science and Applied Mathematics)

Abstract

:
The aim to improve diagnosis decision systems of kidneys led to the concept of many methods of texture characterization of kidneys from ultrasound images. Here, as a first main contribution, we propose a texture characterization method based on the singularity defined by the Hölder exponent, which is multifractal local information. Indeed, the originality of our contribution here is to build a singularity-level matrix corresponding to different levels of regularities, from which we extract new texture features. Finally, as a second main contribution, we will evaluate the potential of our proposed multifractal features to characterize textured ultrasound images of the kidney. Having more reproducibility of the texture features first requires a good choice of Choquet capacity to calculate the irregularities and a selection of a more representative region of interest (ROIs) to analyze by carrying out an adapted virtual puncture in the kidney components. The results of the supervised classification, using three classes of images (young, healthy, and glomerulonephritis), are interesting and promising since the classification accuracy reaches about 80%. This encourages conducting further research to yield better results by overcoming the limitations and taking into account the recommendations made in this article.

1. Introduction

Ultrasound imagery is a useful, convenient, and safe diagnosis modality of kidneys, and the analysis of the information contained in the ultrasound image is within the competence of the clinician. Unfortunately, the quality of ultrasound images is considered poor due to a large amount of noise, mainly speckles that are due to the interference of backscattered signals, which distorts the information sought in the image. This is why the clinician’s perception must be complemented by automatic recognition based on texture characterization using image processing tools, such as multifractal analysis, which is becoming increasingly efficient. Indeed, most of those techniques are using statistical texture analysis approaches based on the extraction of texture features that allow the kidneys to be classified as a normal or abnormal organ. Clinicians mainly use statistical texture analysis methods [1,2,3,4,5]. Generally, these research works have two disadvantages, namely that they not only remain, unfortunately, manual in the selection of the region of interest to be studied but also have difficulty carrying out a complete classification accounting for different pathologies in their several stages. These disadvantages are probably the reason for the lack of papers aimed at classifying the kidney from ultrasound images via texture analysis based on the multifractal approach, unlike the characterization of other human organs such as the liver or bone. This is why we attempt in our work to characterize the kidney with an adapted multifractal method based on the extraction of texture features from an ultrasound image of the kidney. Indeed, all texture feature extraction methods based on multifractal analysis reported in all fields of image processing exist in two types: those based on local information given by the singularity [6,7,8] and others based on global information given by the multifractal spectrum [9,10,11,12,13].
The aim of this work is to propose a new multifractal approach for texture characterization by introducing new texture features extracted from a singularity in the first stage. Afterward, the second goal is to perform texture characterization of kidney ultrasound images using the proposed set of texture features.

2. Image Analysis Based on Local Information

The study of the local regularity at each point of the texture image can be a means of texture analysis because it can simply be seen as a particular combination of Hölder exponent values  α i , j  [6,14]. This amounts to saying that a texture is made up of a set of singularities and that the value and the spatial arrangement of these singularities can provide features to characterize the texture.

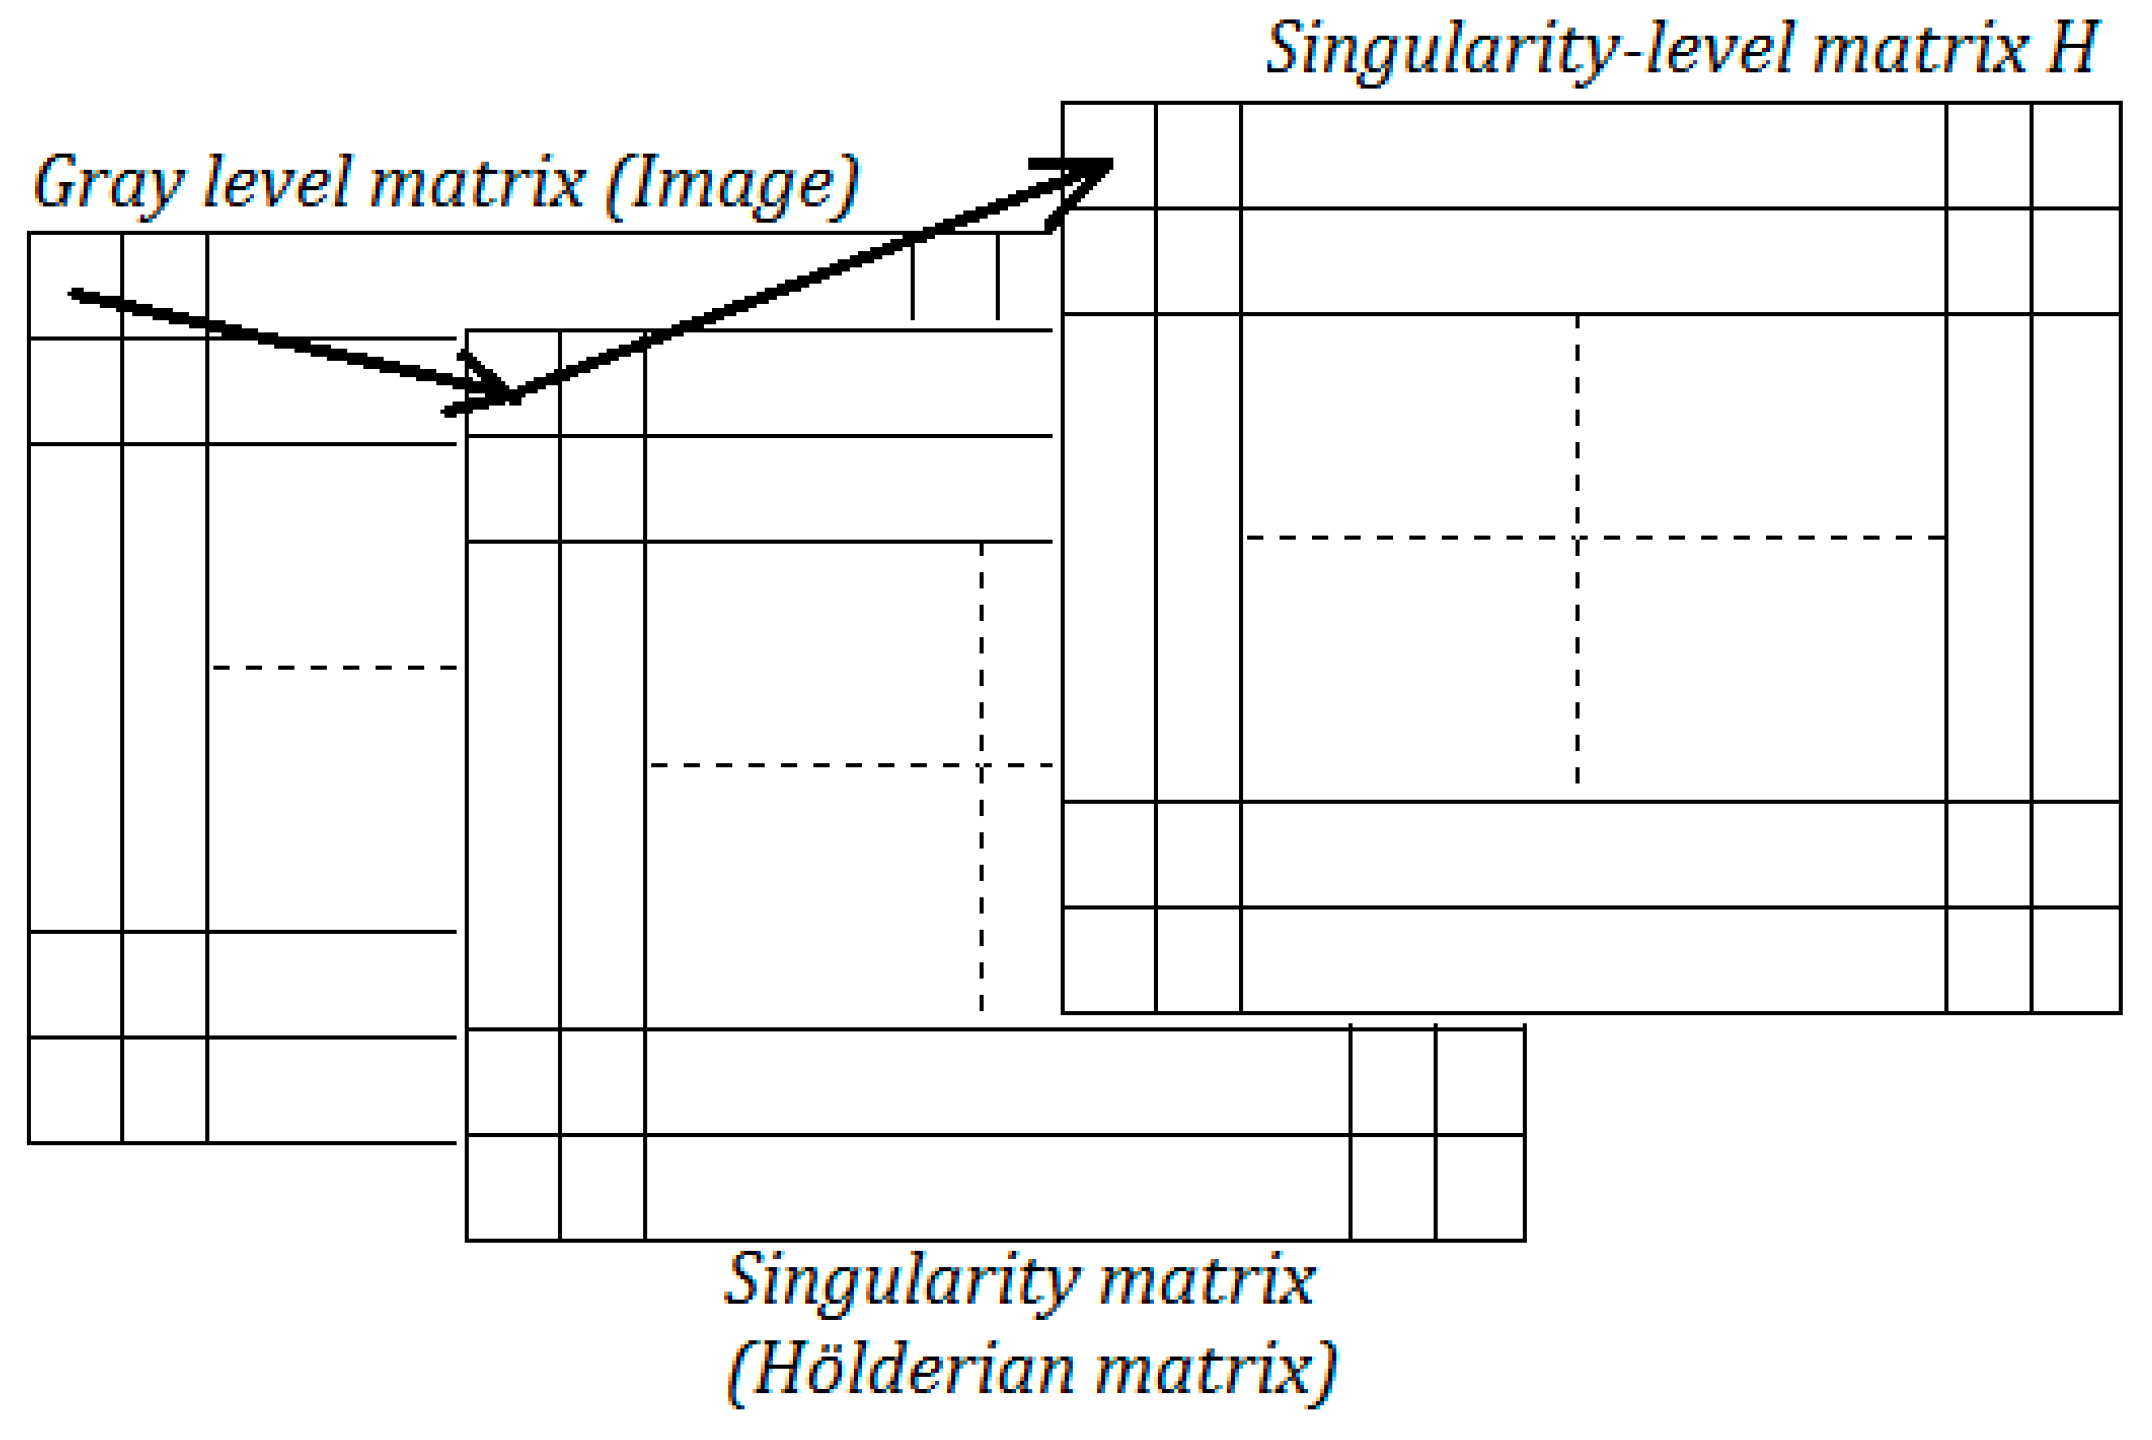
2.1. The Image of Singularities

The Hölder function calculated on an image  m × n  is stored in an array of the same size  m × n , where each point  i , j  carries the value of the Hölder exponent  α i , j  estimated on the pixel  i , j  (Figure 1). The realization of the image of the singularities can be carried out from a sampling of the values of singularities, which consists of calculating the maximum value of the singularities  α m a x  and covering the interval  α m i n ,   α m a x  with the set of intervals  I i  defined by the following:
I i = i α u ,   i + 1 α u  for  i = 1 , , 14  with  α u = α a , m a x α a , m i n 16 ;
I 0 = α m i n , α u  and  I 15 = [ 15 α u , α m i n ] .
α u  is the reference step defined, in a normalized way, to establish irregularity level classes within the image of the singularities. Indeed,  α a , m a x  (resp.  α a , m i n ) is the mean maximum (resp. mean minimum) calculated on  N  images.
α a , m a x = i = 0 N 1 α m a x i N  and  α a , m a x = i = 0 N 1 α m a x i N , where  α m a x i  is the singularity maximum (resp. the singularity minimum) calculated on the ith image of the  N  training images. The Hölder image (of singularities)  H  is given by the following:
k = 1,2 , , m  and  l = 1,2 , , n  we have:  H k , l = j   i f   α k , l I j j = 0,1 , 2 , 15 .

2.2. Singularity-Level Run-Length Matrix

This method, using the singularity level matrix  H  containing irregularity information  α x , y  at each point  x , y , is based on the definition of statistical parameters expressing the distribution of the levels of singularities existing in the image. A run of irregularity level is a consecutive set of collinear pixels having the same level of irregularity. The run-length matrix  p θ i , j  is given via counting the runs of irregularity levels i and size j.
The run-length matrix involves two textural information, namely the direction and the coarseness in terms of irregularities. The direction generally used to define run-length matrix are 0°, 45°, 90° and 135°.
The reduced number of singularity levels will make it possible to avoid a large number of runs of irregularities, which contain only one point. This is how we consider the coding of singularity levels on 16 levels sufficient for texture analysis with the run-length matrix.
Thus, the generalized parameter defining the statistical distribution of the various runs of irregularity levels is given by the following:
G R L S L F = 1 n θ i = 1 G j = 1 N θ i k i j k j p θ i , j ,  
where GRLSLF is Generalized Run-Length Singularity-Level Feature;  n θ  is the total number of runs existing in the singularity-level matrix  H  along a  θ  direction;  G  is the number of singularity-level;  N θ  is the size of singularity-level matrix  H  along the  θ  direction.
Several texture features can be defined from the GRLSLF parameter by giving  k i  and  k j  different values. The principle in the extraction of the features is to exclusively measure the accentuation of different types of singularity-level and run-length via the coefficients  k i  and  k j . We propose some features, namely:
-
Short-Run Low-Level Singularity Emphasis (SRLLSE) given by  k i = 2  and  k j = 2 ;
-
Short-Run High-Level Singularity Emphasis (SRHLSE) given by  k i = 2  and  k j = 2 ;
-
Long-Run High Singularity Emphasis (LRHSE) given by  k i = 2  and  k j = 2 ;
-
Long-Run Low Singularity Emphasis (LRLSE) given by  k i = 2  and  k j = 2 ;
Other run length statistics are defined, namely:
-
Run-Length Non-Uniformity (RLNU):
R L N U = 1 n θ j = 1 N θ i = 1 G p θ i , j 2   ;
-
Singularity Level Non-Uniformity (SLNU):
S L N U = 1 n θ j = 1 G i = 1 N θ p θ i , j 2 ;
-
Runs Percentage (RP):
R P = 1 i = 1 G j = 1 N θ j p θ i , j .

2.3. First-Order Statistics

First-order statistics are estimated on singularity levels without taking into account their relative distribution. The consideration of these amounts calculated on the Hölderian image allows an evaluation of the different irregularities without taking into account their relative distribution in the image. However, we will consider the most used first-order statistics, namely:
The average singularity level value:
a v e r h = i = 0 15 i . h i ;
Variance:
v a r h = 1 m . n i = 1 m j = 1 n a v e r h H i , j 2 ;    
The skewness (centered space moment of order):
S k e w h = 1 m . n i = 1 m j = 1 n H i , j a v e r h 3 ;
The Kurtosis (centered space moment of order 4):
K u r t h = 1 m . n i = 1 m j = 1 n H i , j a v e r h 4 .  
h is the histogram of the singularity levels of the image of the singularities  H .
Other first-order statistics extracted from the singularities image  H  will be used, such as energy, entropy, etc.

3. Application for Characterization of Kidney Ultrasound Images

To evaluate our proposed texture characterization approach, by applying it to the ultrasound image, we use the image slice representing the longitudinal section of the right kidney that provides a large amount of information on the kidney and achieves pseudo-reproducibility (Figure 2). Thus, the region of interest ROI(s) to study the kidney images will be windows selected over the three following regions: parenchyma, central, and “whole” kidney [15].
To perform a local multifractal description of the ultrasound images of the kidney, we will use texture features calculated from the singularity level matrix (see Section 2.2 and Section 2.3) of the three following selected regions of interest: parenchyma, central, and representative region of the “whole” kidney. Indeed, we will use the supervised K-nn classifier, which allows both the selection of all the most representative features and the evaluation of the discriminating power of the approach that will be given by the correct classification accuracy rate obtained by the selected subset of features.

Results and Discussion

The results obtained by considering the representative window of each of the three regions are noted in Table 1. Analyzing the results allows us to make the following remarks:
  • Singularity-level run-length matrix methods, compared to the method using the first order statistics, provide a better classification accuracy rate, whereas the best result is obtained using the combined method applied on the ROI representative of the “whole” kidney, and the classification rate reaches 80% obtained with eight features and a test accuracy classification of about 78%.
  • The impact of the choice of the number K (K = 6, 7, 8) remains not significant with the mean, on the all the iterative process, of the variation classification accuracy less than 5.8%.
  • As a region of interest, the parenchyma remains more representative than the central region. Indeed, for the parenchyma ROI, the best classification accuracy rate, which reaches about 76%, is obtained using the combined method with seven features, while the test classification, using the subset of seven features, is 73.3%.
  • The central region remains the least representative with the best classification accuracy obtained using the combined method. Indeed, the classification accuracy rate reached about 62.6%, and test classification is about 60%.
By comparing the informational contribution of the parenchyma and the central region, we find that that of the parenchyma is even more interesting, while the third region, containing both parts of the parenchymal and part of the central, gives a little, but not sensitively, better classification accuracy. It appears that the informational contribution of parenchyma is the most predominant in the contained representative window of the whole kidney, where the highest discriminating power obtained reaches about 84%, which shows low complementarity of the characterization of the texture of parenchyma and central regions of interest.
The results obtained using the proposed approach are interesting and promising for the realization of a diagnostic aid system for ultrasound images of the kidney. However, the perspectives of our work will take into account several points, some of which constitute the limitations of our contribution as follows:
  • Increasing the size of the database so that it contains other classes of images corresponding to different pathologies while carrying out image acquisitions in the most standard conditions;
  • Setting the parameters that most influence the reproducibility of the texture features;
  • Combining the multifractal with other texture classification approach to improve the results;
  • Applying this approach for the characterization of texture images of other human organs such as the liver;
  • Improving a selecting puncture for considering all the kidney images.

4. Conclusions

This work was devoted to the presentation of a new multifractal approach based on the calculation of the levels of singularity, which we used for the characterization of texture images. The results obtained with this method applied for the characterization of ultrasound images of the kidney are quite interesting and promising. Indeed, our perspectives are mainly to optimize this approach by developing other more discriminating multifractal features and also taking into account the limits of this work.

Author Contributions

The conceptualization and methodology are carried out by M.T.A. M.T.A. and R.K. contributed equally to the other parts of this work. All authors have read and agreed to the published version of the manuscript.

Funding

This research received no external funding.

Institutional Review Board Statement

Not applicable.

Informed Consent Statement

Not applicable.

Data Availability Statement

Not applicable.

Conflicts of Interest

The authors declare no conflict of interest.

References

  1. Sharma, K.; Virmani, J. Haralick’s Texture Descriptors for Classification of Renal Ultrasound Images. In Hybrid Intelligent Techniques for Pattern Analysis and Understanding; Chapman and Hall: London, UK, 2017. [Google Scholar] [CrossRef]
  2. Akkasaligar, P.T.; Biradar, S. Classification of Ultrasound Images of Kidney. IJCA Proc. Int. Conf. Inf. Commun. Technol. 2014, 3, 24–28. [Google Scholar]
  3. Ahmad, R.; Mohanty, B.K. Chronic Kidney Disease Stage Identification Using Texture Analysis of Ultrasound Images. Biomed. Signal Process. Control 2021, 69, 102695. [Google Scholar] [CrossRef]
  4. Iqbal, F.; Pallewatte, A.S.; Wansapura, J.P. Texture Analysis of Ultrasound Images of Chronic Kidney Disease. In Proceedings of the Seventeenth International Conference on Advances in ICT for Emerging Regions (ICTer), Colombo, Sri Lanka, 6–9 September 2017; pp. 299–303. [Google Scholar] [CrossRef]
  5. Garelnabi, M.; Abdullah, I.; Bakry, A.H.A.; Abdulla, E.A.; Adam, M. Characterization of Kidney Infection in Ultrasound B-mode Images Using Texture Analysis. Int. J. Sci. Res. 2016, 5, 2319–7064. [Google Scholar] [CrossRef]
  6. Vehel, J.L.; Mignot, P.; Berrior, J.-P. Texture and Multifractals: New Tools for Image Analysis; Technical Report 1706; Institut National de Recherche en Informatique et en Automatique: Le Chesnay-Rocquencourt, France, 1992. [Google Scholar]
  7. Ranjan, U.S.; Narayana, A. Classification of Objects in SAR Images Using Scaling Feature, ICVGIP, 16–18 December; Space Applications Centre Ahmedaba: Ahmedabad, India, 2002. [Google Scholar]
  8. Saucier, A.; Richer, J.; Muller, J. Assessing the scope of the multifractal approach to textural characterization with statistical reconstructions of images. Phys. A Stat. Mech. Its Appl. 2002, 311, 231–259. [Google Scholar] [CrossRef]
  9. Chaudhuri, B.; Sarkar, N. Texture segmentation using fractal dimension. IEEE Trans. Pattern Anal. Mach. Intell. 1995, 17, 72–77. [Google Scholar] [CrossRef]
  10. Xu, Y.; Ji, H.; Fermüller, C. Viewpoint Invariant Texture Description Using Fractal Analysis. Int. J. Comput. Vis. 2009, 83, 85–100. [Google Scholar] [CrossRef]
  11. Florindo, J.B.; Bruno, O.M.; Landini, G. Multifractal Texture Analysis Using a Dilation-Based Hölder Exponent. In Proceedings of the 10th International Conference on Computer Vision Theory and Applications (VISAPP-2015), Berlin, Germany, 11–14 March 2015; pp. 505–511. [Google Scholar] [CrossRef]
  12. Sailhac, P.; Seyler, F. Texture Characterization of ERS-1 Images by Regional Multifractal Analysis; Springer: Berlin, Germany, 1997; pp. 32–41. [Google Scholar] [CrossRef]
  13. Stanczyk, P.; Sharpe, P. Classification of Natural Texture Images from Shape Analysis of the Legendre Multifractal Spectrum. Fractals 1999, 67–79. [Google Scholar] [CrossRef]
  14. Véhel, J.L.; Vojak, R. Multifractal Analysis of Choquet Capacities: Preliminary Results; Rapport de Recherche de INRIA; INRIA: Le Chesnay-Rocquencourt, France, 1995. [Google Scholar]
  15. Muzzolini, R. A Volumetric Approach to Segmentation and Texture Characterization of Ultrasound Images. Ph.D. Thesis, Université de Saskatchewan, Saskatoon, SA, Canada, 1 April 1997. [Google Scholar]
Figure 1. Obtaining singularity-level matrix.
Csmf 06 00012 g001
Figure 2. The kidney US image and the three ROI windows.
Csmf 06 00012 g002
Table 1. (1) Classification accuracy rates of the three regions (P: Parechyma, C: Central, W: “Whole” kidney), with K = 6, 7, 8. (2) The number of texture features used to obtain the best classification accuracy rate. (3) Results of the test classification.
(1) (P, C, W)
K = 6
(1) (P, C, W)
K = 7
(1) (P, C, W)
K = 8
(2) Number
of Features
(P, C, W)
(3) Test Classification
Accuracy Rate
(P, C, W)
First order statistics(50.6%, 37.3%, 64.5%)(52%, 38.6%, 73.3%)(49.3%, 34.6%, 73.3%)(3, 2, 4)(60%, 41.3%, 72%)
Singularity-level Run-length matrix(72%, 60%, 76%)(70.6%, 54.6%, 73.3%)(69.3%, 58.6%, 76%)(6, 3, 6)(72%, 58.6%, 74.6%)
Combined method(76%, 62.6%, 80%)(73.3%, 54.6%, 78.6%)(73.3%, 60%, 74.6%)(7, 5, 8)(73.3%, 60%, 78%)
Disclaimer/Publisher’s Note: The statements, opinions and data contained in all publications are solely those of the individual author(s) and contributor(s) and not of MDPI and/or the editor(s). MDPI and/or the editor(s) disclaim responsibility for any injury to people or property resulting from any ideas, methods, instructions or products referred to in the content.

