Article

Analysis of Osteosarcoma Cell Lines and Patient Tissue Using a 3D In Vivo Tumor Model—Possible Effects of Punicalagin

1
Institute for Molecular and Cellular Anatomy, University of Regensburg, 93053 Regensburg, Germany
2
Department for Orthopaedics and Sports Orthopaedics, Hospital of the Technical University of Munich, Ismaninger Straße 22, 81675 Munich, Germany
3
Department for Surgery, University Hospital of Hamburg Eppendorf, 20246 Hamburg, Germany
4
Department for Sarcoma and Musculoskeletal Tumors, Hospital Barmherzige Brüder Regensburg, 93049 Regensburg, Germany
5
Department for Pathology, University of Regensburg, 93053 Regensburg, Germany
6
KML Vision GmbH., A8020 Graz, Austria
7
Faculty of Applied Healthcare Sciences, Deggendorf Institute of Technology, 94469 Deggendorf, Germany
*
Author to whom correspondence should be addressed.
Organoids 2024, 3(1), 35-53; https://doi.org/10.3390/organoids3010004
Submission received: 15 November 2023 / Revised: 17 February 2024 / Accepted: 27 February 2024 / Published: 4 March 2024

Abstract

:
Osteosarcomas are the most common primary malignant bone tumors and mostly affect children, adolescents, and young adults. Despite current treatment options such as surgery and polychemotherapy, the survival of patients with metastatic disease remains poor. In recent studies, punicalagin has reduced the cell viability, angiogenesis, and invasion in cell culture trials. The aim of this study was to examine the effects of punicalagin on osteosarcomas in a 3D in vivo tumor model. Human osteosarcoma biopsies and SaOs-2 and MG-63 cells, were grown in a 3D in vivo chorioallantoic membrane (CAM) model. After a cultivation period of up to 72 h, the tumors received daily treatment with punicalagin for 4 days. Weight measurements of the CAM tumors were performed, and laser speckle contrast imaging (LSCI) and a deep learning-based image analysis software (CAM Assay Application v.3.1.0) were used to measure angiogenesis. HE, Ki-67, and Caspase-3 staining was performed after explantation. The osteosarcoma cell lines SaOs-2 and MG-63 and osteosarcoma patient tissue displayed satisfactory growth patterns on the CAM. Treatment with punicalagin decreased tumor weight, proliferation, and tumor-induced angiogenesis, and the tumor tissue showed pro-apoptotic characteristics. These results provide a robust foundation for the implementation of further studies and show that punicalagin offers a promising supplementary treatment option for osteosarcoma patients. The 3D in vivo tumor model represents a beneficial model for the testing of anti-cancer therapies.

1. Introduction

Osteosarcoma is the most common primary bone tumor, despite being an overall rare type of cancer with a global incidence of about 2–5 per million [1,2]. Osteosarcomas mostly form in the metaphysis of long bones in the extremities, in particular the distal femur and the proximal tibia [3,4]. Characteristics of these solid tumors are the production of tumor–osteoid and osteoblastic differentiation [5]. They arise from primitive cells of mesenchymal origin and produce tumor–bone, and in some cases, tumor–cartilage. The disease mainly affects children, adolescents, and young adults [6]. It appears to have a bimodal incidence with a first peak in adolescence and a second peak later in life. The tumors are typically characterized by high heterogeneity, complexity, aggressive local growth, and high levels of tumor-induced angiogenesis [7]. Histologically, osteosarcomas are classified into three subtypes: osteoblastic, chondroblastic, and fibroblastic [8].
The symptoms of advanced osteosarcomas are relatively unspecific. The most common symptoms include local pain with tenderness and a restricted mobility in the affected joints [9].
For many tumor cells, the ability to develop malignancy depends on the tumor microenvironment (TME). The production and circulation of many angiogenic factors, such as VEGF-A, leads to angiogenesis, subsequent tumor growth, and metastasis [10]. It has been shown in previous studies that increased levels of VEGF-A were associated with lung metastasis. This makes antiangiogenic inhibitors that target VEGF-A a promising option for tumor therapy [11].
Osteosarcomas are associated with a poor general 5-year survival rate of 50 to 60% for people of all ages. The standard treatment of osteosarcoma incorporates neoadjuvant chemotherapy and a complete surgical resection of the tumor. In the case of high-grade osteosarcoma, the resection is followed by adjuvant chemotherapy. Operation methods can be divided into limb-sparing surgery and amputation. Methotrexate, doxorubicin, and cisplatin are established drug treatments for osteosarcoma and are often administered together. However, chemotherapy generally causes severe side effects [12]. Radiation therapy has not shown a significant effect for the treatment of osteosarcoma [9].
With the introduction of chemotherapy, the 5-year survival rate has increased significantly in patients with non-metastatic tumors. For metastatic patients, the survival rate has remained poor over recent years. Currently, surgery is still an obligatory treatment and limb-sparing procedures have decreased the number of amputations performed on these patients [9].
The CAM model is widely established for the 3D in vivo cultivation of multiple different types of tissue, such as polycystic kidney tissue [13], osteosarcoma [14], and pancreatic cancer [15]. Also, investigations of biocompatible materials like hemostyptics or vascular prostheses have been described using this model [16]. In recent decades, the CAM model has become increasingly important for the testing of angiogenic potential of biomaterials [17]. Recent studies have shown that the CAM can be used for the cultivation of vascularized brain and kidney organoids [18,19] and pre-vascularized cardiac organoids [20]. In 2022, Ribatti et al. [21] proposed the CAM model as a tool for cultivating organoids due to its extensive vascular network.
Punicalagin is an ellagitannin (ellagic acid, EA) that is naturally found in the shell of pomegranates. According to novel studies, punicalagin has an anti-inflammatory and antioxidant effect [22]. Cell culture and xenograft mouse model experiments have shown a pro-apoptotic effect and the inhibition of angiogenesis and tumor-associated inflammation in conjunction with a reduction in tumor size [23].
Several experiments show anti-proliferative effects of punicalagin when used as a single agent and an enhanced antitumor activity of mitomycin C, which is a common antitumor antibiotic used for the treatment of bladder cancer. EA reduces VEGFR-2 expression. It also inhibits tumor invasion and chemotaxis induced by VEGF-A. In vivo studies showed a significant reduction of infiltration, growth rate, and tumor-associated angiogenesis of human bladder cancer xenografts. Therefore, EA may have a potential role as an adjunct therapy for bladder cancer [24].
Moreover, recent studies have shown a reduced viability of osteosarcoma cell lines, as well as decreased tumor-associated inflammation, angiogenesis, and invasion in cell culture experiments, after exposure to punicalagin [23]. Therefore, the aim of this study was to examine the effects of punicalagin on osteosarcoma cell lines and primary osteosarcomas in an in vivo tumor model.

2. Materials and Methods

2.1. Cell Culture

SaOs-2 cells (reference ACC-243) were purchased from DSMZ (German collection of microorganisms and cell cultures, GmbH, Braunschweig, Germany). MG-63 cells were purchased from TU München, Germany. SaOs-2 cells were cultivated in McCoy’s medium (Sigma-Aldrich Chemie GmbH, Munich, Germany), containing 10% FCS (Biowest, Nuaillé, France), 2% HEPES (Sigma-Aldrich, St. Louis, MO, USA), and 1% Penicillin/Streptomycin (Sigma-Aldrich, St. Louis, MO, USA), whereas MG-63 cells were grown in MEM (α-Modification) (Sigma-Aldrich Chemie GmbH, Munich, Germany), 10% FCS, 2% HEPES, 1% L-Glutamine, and 1% Penicillin/Streptomycin. Both cell lines were cultured in an incubator at 37.0 °C and 5% CO2. After washing the cell culture medium with PBS, Trypsin in EDTA buffer (Sigma-Aldrich, St. Louis, MO, USA) was used to split the cells by trypsinization. Prior to counting the cells, they were first stained with trypan blue (Thermo Fisher Scientific, Waltham, MA, USA) and subsequently applied to a Neubauer-improved counting chamber (Paul Marienfeld GmbH & Co. KG, Lauda-Königshofen, Germany). For each engraftment, aliquots of 1 × 10⁶ cells were formed with 30 μL of Corning® Matrigel® (OMNILAB-LABORZENTRUM GmbH & Co. KG, Bremen, Germany). To promote the Matrigel to harden, the aliquots were incubated for 10 min. Subsequently, cells and Matrigel were applied to the CAM using a spatula. In between experiments, cells were either maintained in culture or frozen in a cryomedium (McCoy’s medium, 50% FCS, and 20% DMSO) at −80 °C.

2.2. MTT Assay

SaOs-2 and MG-63 cells were seeded in a 96-well plate and then incubated at 37.0 °C for 24 h to ensure cellular attachment. Subsequently, the cells were treated with various concentrations of punicalagin (≤100 µM) diluted in McCoy’s (SaOs-2) or MEM (MG-63) medium. Viability was determined after 24 h, 48 h, and 72 h. Following the application of MTT (BIOMOL GmbH, Hamburg, Germany), the cells were incubated for 1 h at 37.0 °C, and DMSO (Sigma-Aldrich, St. Louis, MO, USA) was added subsequently after the aspiration of the old medium. The absorbance of the plates was measured at 594 nm with a microplate reader (Thermo Scientific, Multiskan FC, Waltham, MA, USA). Additionally, the percentage of cell viability and the half-maximal inhibitory concentrations (IC50) were calculated.

2.3. Patient Material

Tissue samples of excised primary sarcoma tumors were kindly provided by the University Hospital of Hamburg Eppendorf, the Hospital of the Technical University of Munich, and the Hospital Barmherzige Brüder Regensburg. The first patient tissue was a recurrence of a low-grade parosteal osteosarcoma, localized in the proximal humerus. Prior to the resection of the relapsed osteosarcoma, no neoadjuvant chemotherapy was conducted. For the second patient, a rare parosseous dedifferentiated osteosarcoma of the humerus was diagnosed histologically. The third patient showed a recurrence of a high-grade osteoblastic osteosarcoma of the distal femur. Neoadjuvant chemotherapy with methotrexate was conducted prior to amputation. The fourth tumor, from the proximal fibula, histologically showed the features of a spindle-shaped osteoblastic osteosarcoma. Prior to amputation, neoadjuvant chemotherapy was conducted. Written consent was obtained from all patients and experiments were approved by the ethics committee of the University of Regensburg (no. 19-1552-101).

2.4. The CAM Model

According to previous studies using the CAM model, fertilized chicken eggs were incubated in a ProCon-Egg-Incubator (Grumbach, Asslar, Germany) at a constant temperature of 37.8 °C and a humidity of 63% for four days [13,25,26,27]. The air entrapment was localized with a gooseneck lamp and a small window was cut into the overlying eggshell to allow air to escape. Subsequently, a second window was cut into the eggshell to access the CAM. For further incubation, the windows were sealed with Leukosilk® (BSN Medical GmbH, Hamburg, Germany).
The CAMs were engrafted with either primary tumor tissue or tumor cells (SaOs-2 cells or MG-63 cells) between the 7th and 9th day of incubation. These were then incubated for another two or three days, respectively. Afterwards, the treatment, which consisted of 50 µM of punicalagin (Sigma-Aldrich, St. Louis, MO, USA) in a 30 µL cell culture medium and 0.2% DMSO, was applied topically for four days. Within the control group, punicalagin was replaced with DMSO. The tissue or cell pellet was explanted 24 h after the final treatment.
Parts of the tumor were frozen in pieces suitable for engraftment on the CAM to perform multiple experiments with the same tumor. Therefore, tissue pieces were placed in McCoy’s cryomedium (McCoy’s medium + 50% FCS + 20% DMSO). The freezing period ranged from zero to a maximum of 19 weeks. After defrosting, the tumor pieces were washed three times in PBS to remove the DMSO.

2.5. Angiogenesis Measurement with LSCI

To assess angiogenesis, laser speckle contrast imaging (LSCI) was performed with the PeriCAM perfusion speckle imager (PSI) system, high-resolution model (Perimed, Järfälla, Sweden). LSCI is a non-invasive, laser-based method that measures blood perfusion through motion-induced changes in the speckle pattern [28,29]. The LSCI measurements were performed as previously described [25,26]. The perfusion was recorded for ten consecutive measurements (20 s) during which the embryo had to be static. The measurements were performed before the treatment and immediately before explantation. A perfusion filter of 300–3000 perfusion units (PU) was applied for the calculation of the perfusion surrounding the tumor.

2.6. Angiogenesis Measurement with the CAM Assay Application on the IKOSA Platform

Angiogenesis was additionally evaluated using a deep learning-based angiogenesis quantification software on the IKOSA platform, the CAM Assay Application (v.3.1.0) (KML Vision, Graz, Austria). Previous studies have established and trained this automated image analysis software, which evaluates angiogenesis in the in ovo CAM model [27]. The parameters of the total vessel length and number of branching points were used for evaluation.

2.7. Histological Staining

The explanted cell and tumor tissue was fixed in 4% paraformaldehyde (PFA) in PBS (phosphate-buffered saline) for five to seven days. Subsequently, the tissue was washed three times with PBS, dehydrated, and embedded in paraffin. The paraffin blocks were cut into 6 µm thick tissue samples with a microtome. Later, the samples were stained with hematoxylin (Gill No. 3 Sigma-Aldrich St. Louis, MO, USA) and eosin (Chroma®, Waldeck GmbH & Co. KG, Münster, Germany) (HE staining) or with antibodies against Ki-67 using the ZytoChem Plus (HRP) Anti-Rabbit Kit (Biozol, Eching, Germany) and a rabbit monoclonal Anti-Ki67 antibody (antibody 16667 Abcam, Cambridge, UK). Caspase-3 staining was performed and manually evaluated by a pathologist using a Cleaved Caspase-3 (Asp175) antibody (Cell Signaling Technology, Danvers, MA, USA). Histological staining was evaluated by standardized digital microscopy with a Caseviwer 2.4. (3D Histech, Budapest, Hungary) and a Viewpoint Light (PreciPoint, Munich, Germany).

2.8. Statistical Evaluation

The statistical analysis and the creation of graphs were performed with GraphPad Prism 8.0.2. (GraphPad Software, Boston, MA, USA). For the comparison of the control and treatment groups, regarding statistically significant differences, an unpaired t-test with Welch correction was conducted.

3. Results

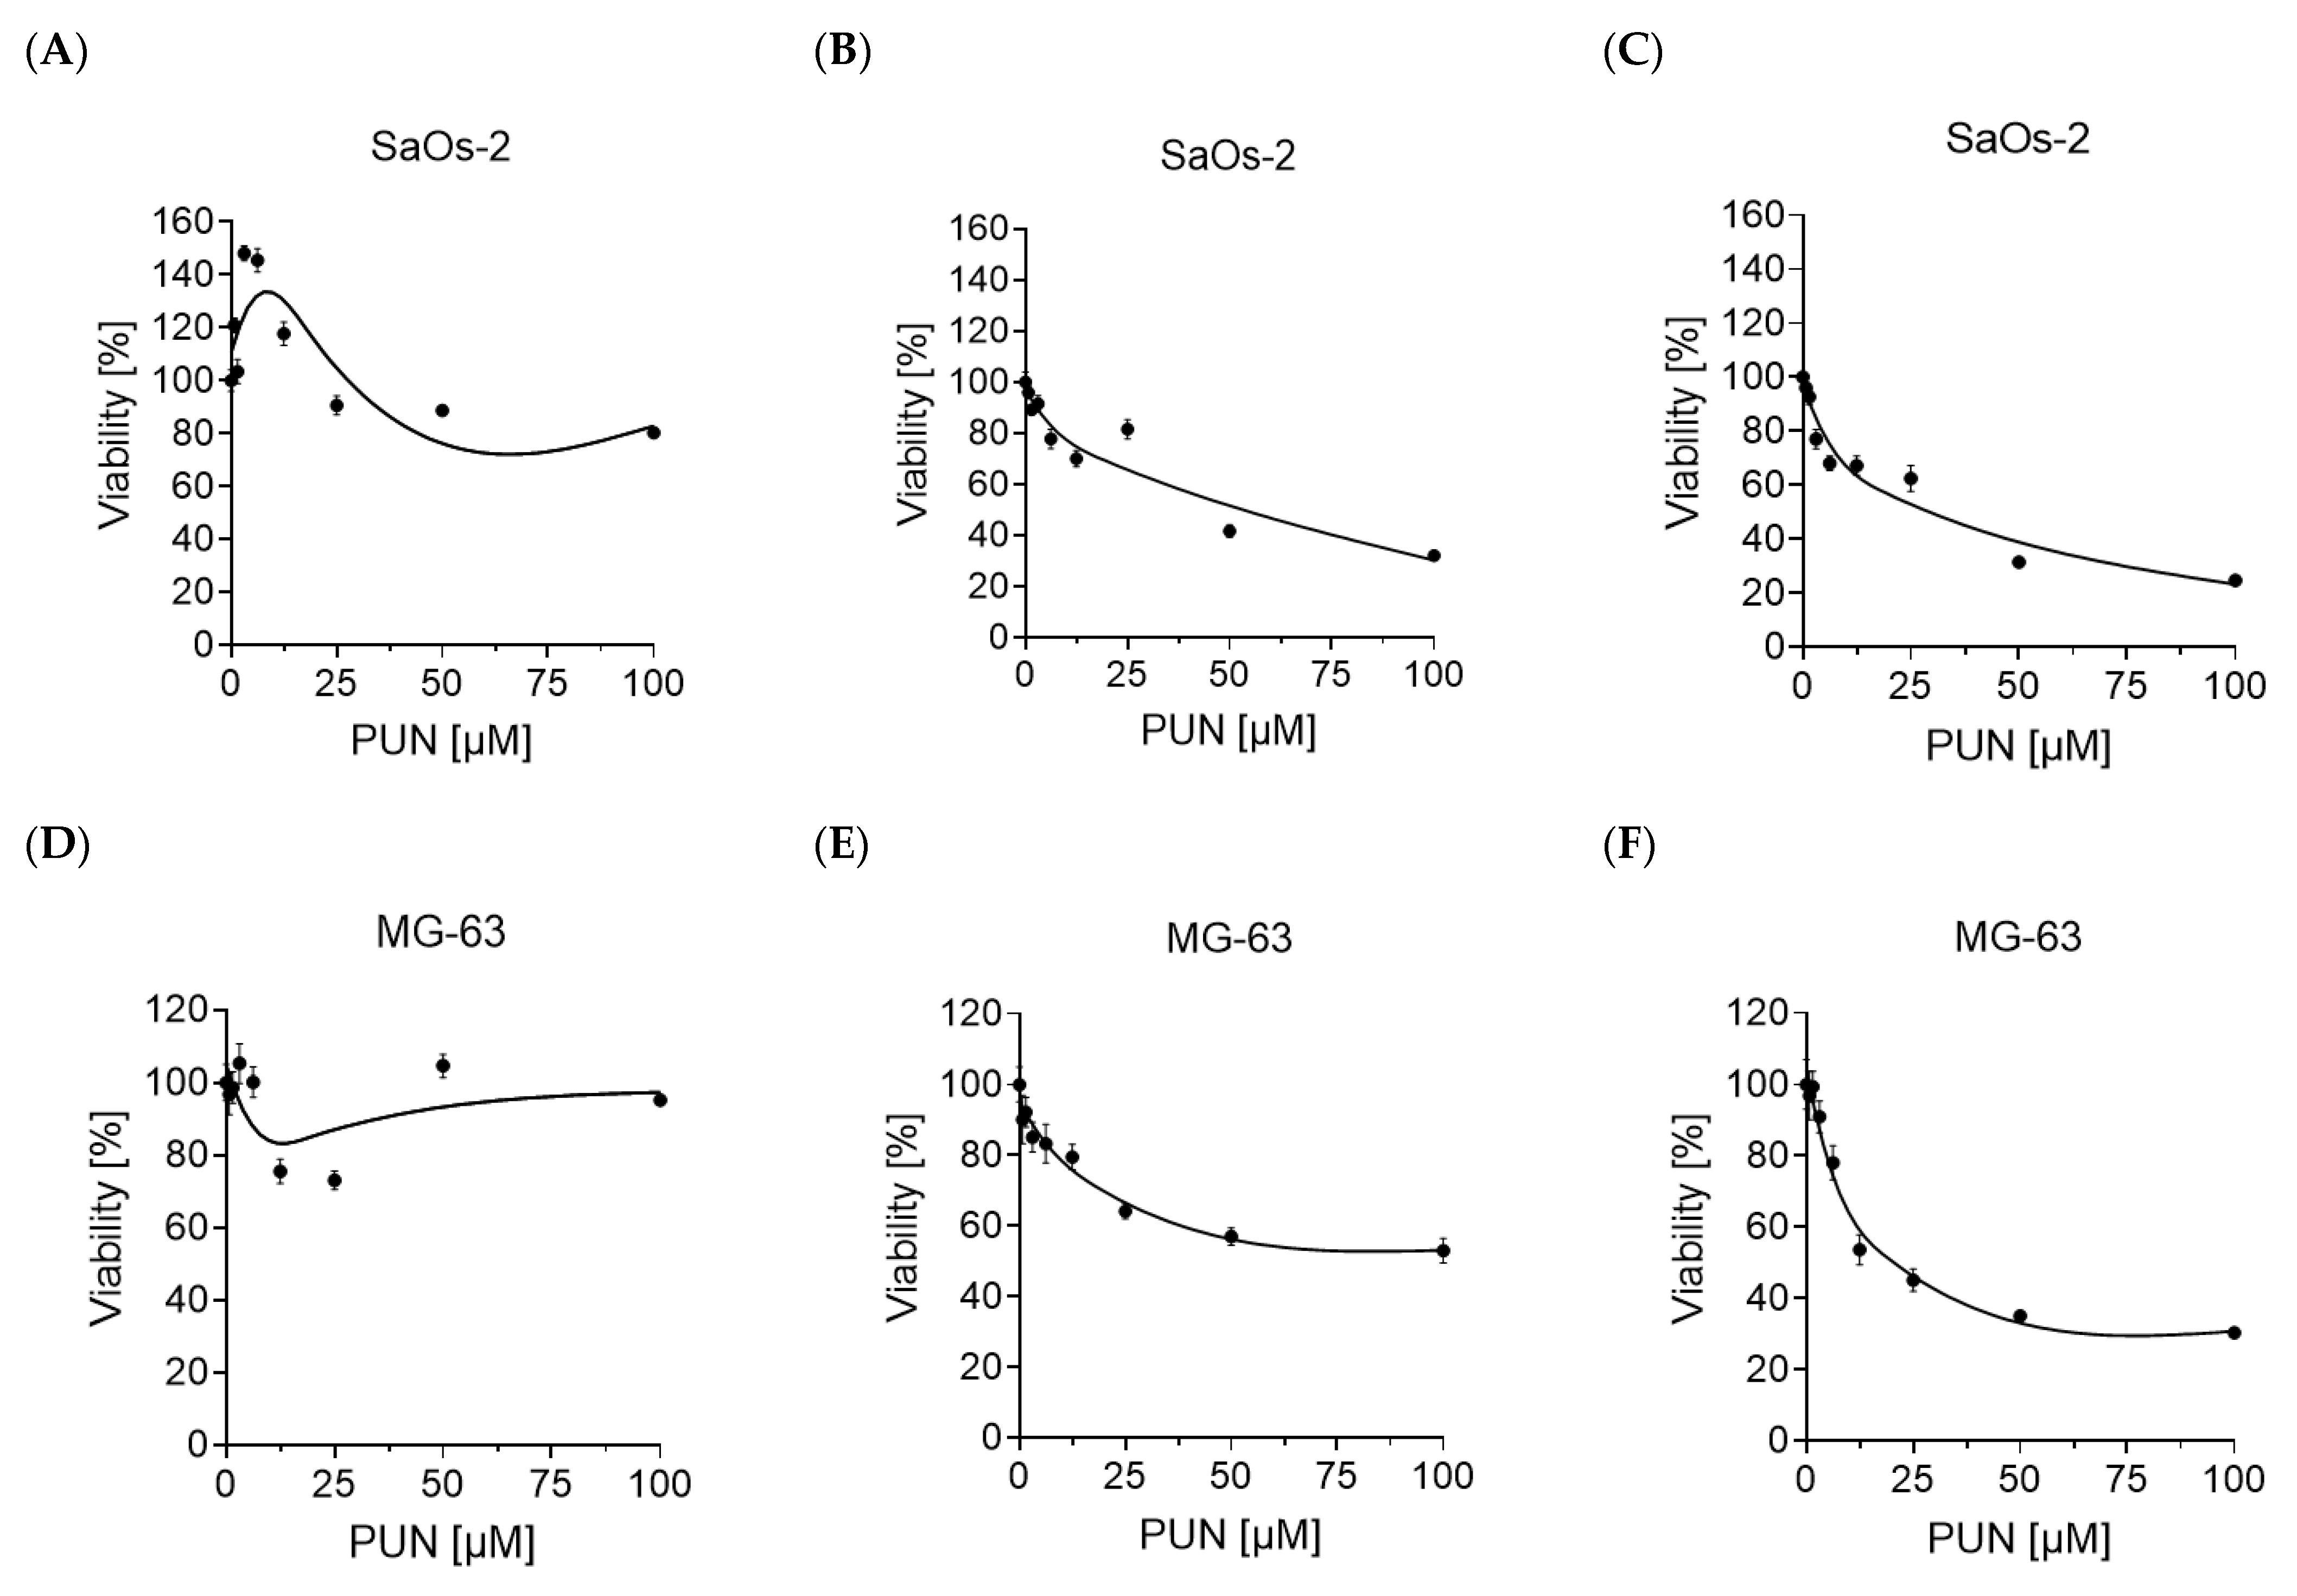
3.1. Effects of Punicalagin on the Viability of SaOs-2 and MG-63 Cells

The viability of SaOs-2 and MG-63 cells, depending on the applied concentration of punicalagin, was determined using MTT assays (n = 3). The results indicate that cell viability decreases with increasing punicalagin concentrations.
For the SaOs-2 cells, measurements 24 h after treatment showed only a slight decrease in viability, with no concentration exceeding the IC50 value (Figure 1A). The IC50 value was found to be at punicalagin concentrations of 52.94 to 54.90 µM for the evaluation after 48 h (Figure 1B), and 27.45 to 29.41 µM after 72 h (Figure 1C).
For the MG-63 cells, measurements 24 h after treatment did not show a significant effect of punicalagin on viability (Figure 1D). Although the IC50 value was not reached 48 h after treatment, punicalagin still had a strong effect on viability (Figure 1E). The IC50 value was observed at punicalagin concentrations of 19.61 to 21.57 µM for the evaluation after 72 h (Figure 1F).
For both cell lines, a strong dependence of viability on exposure time could be observed.

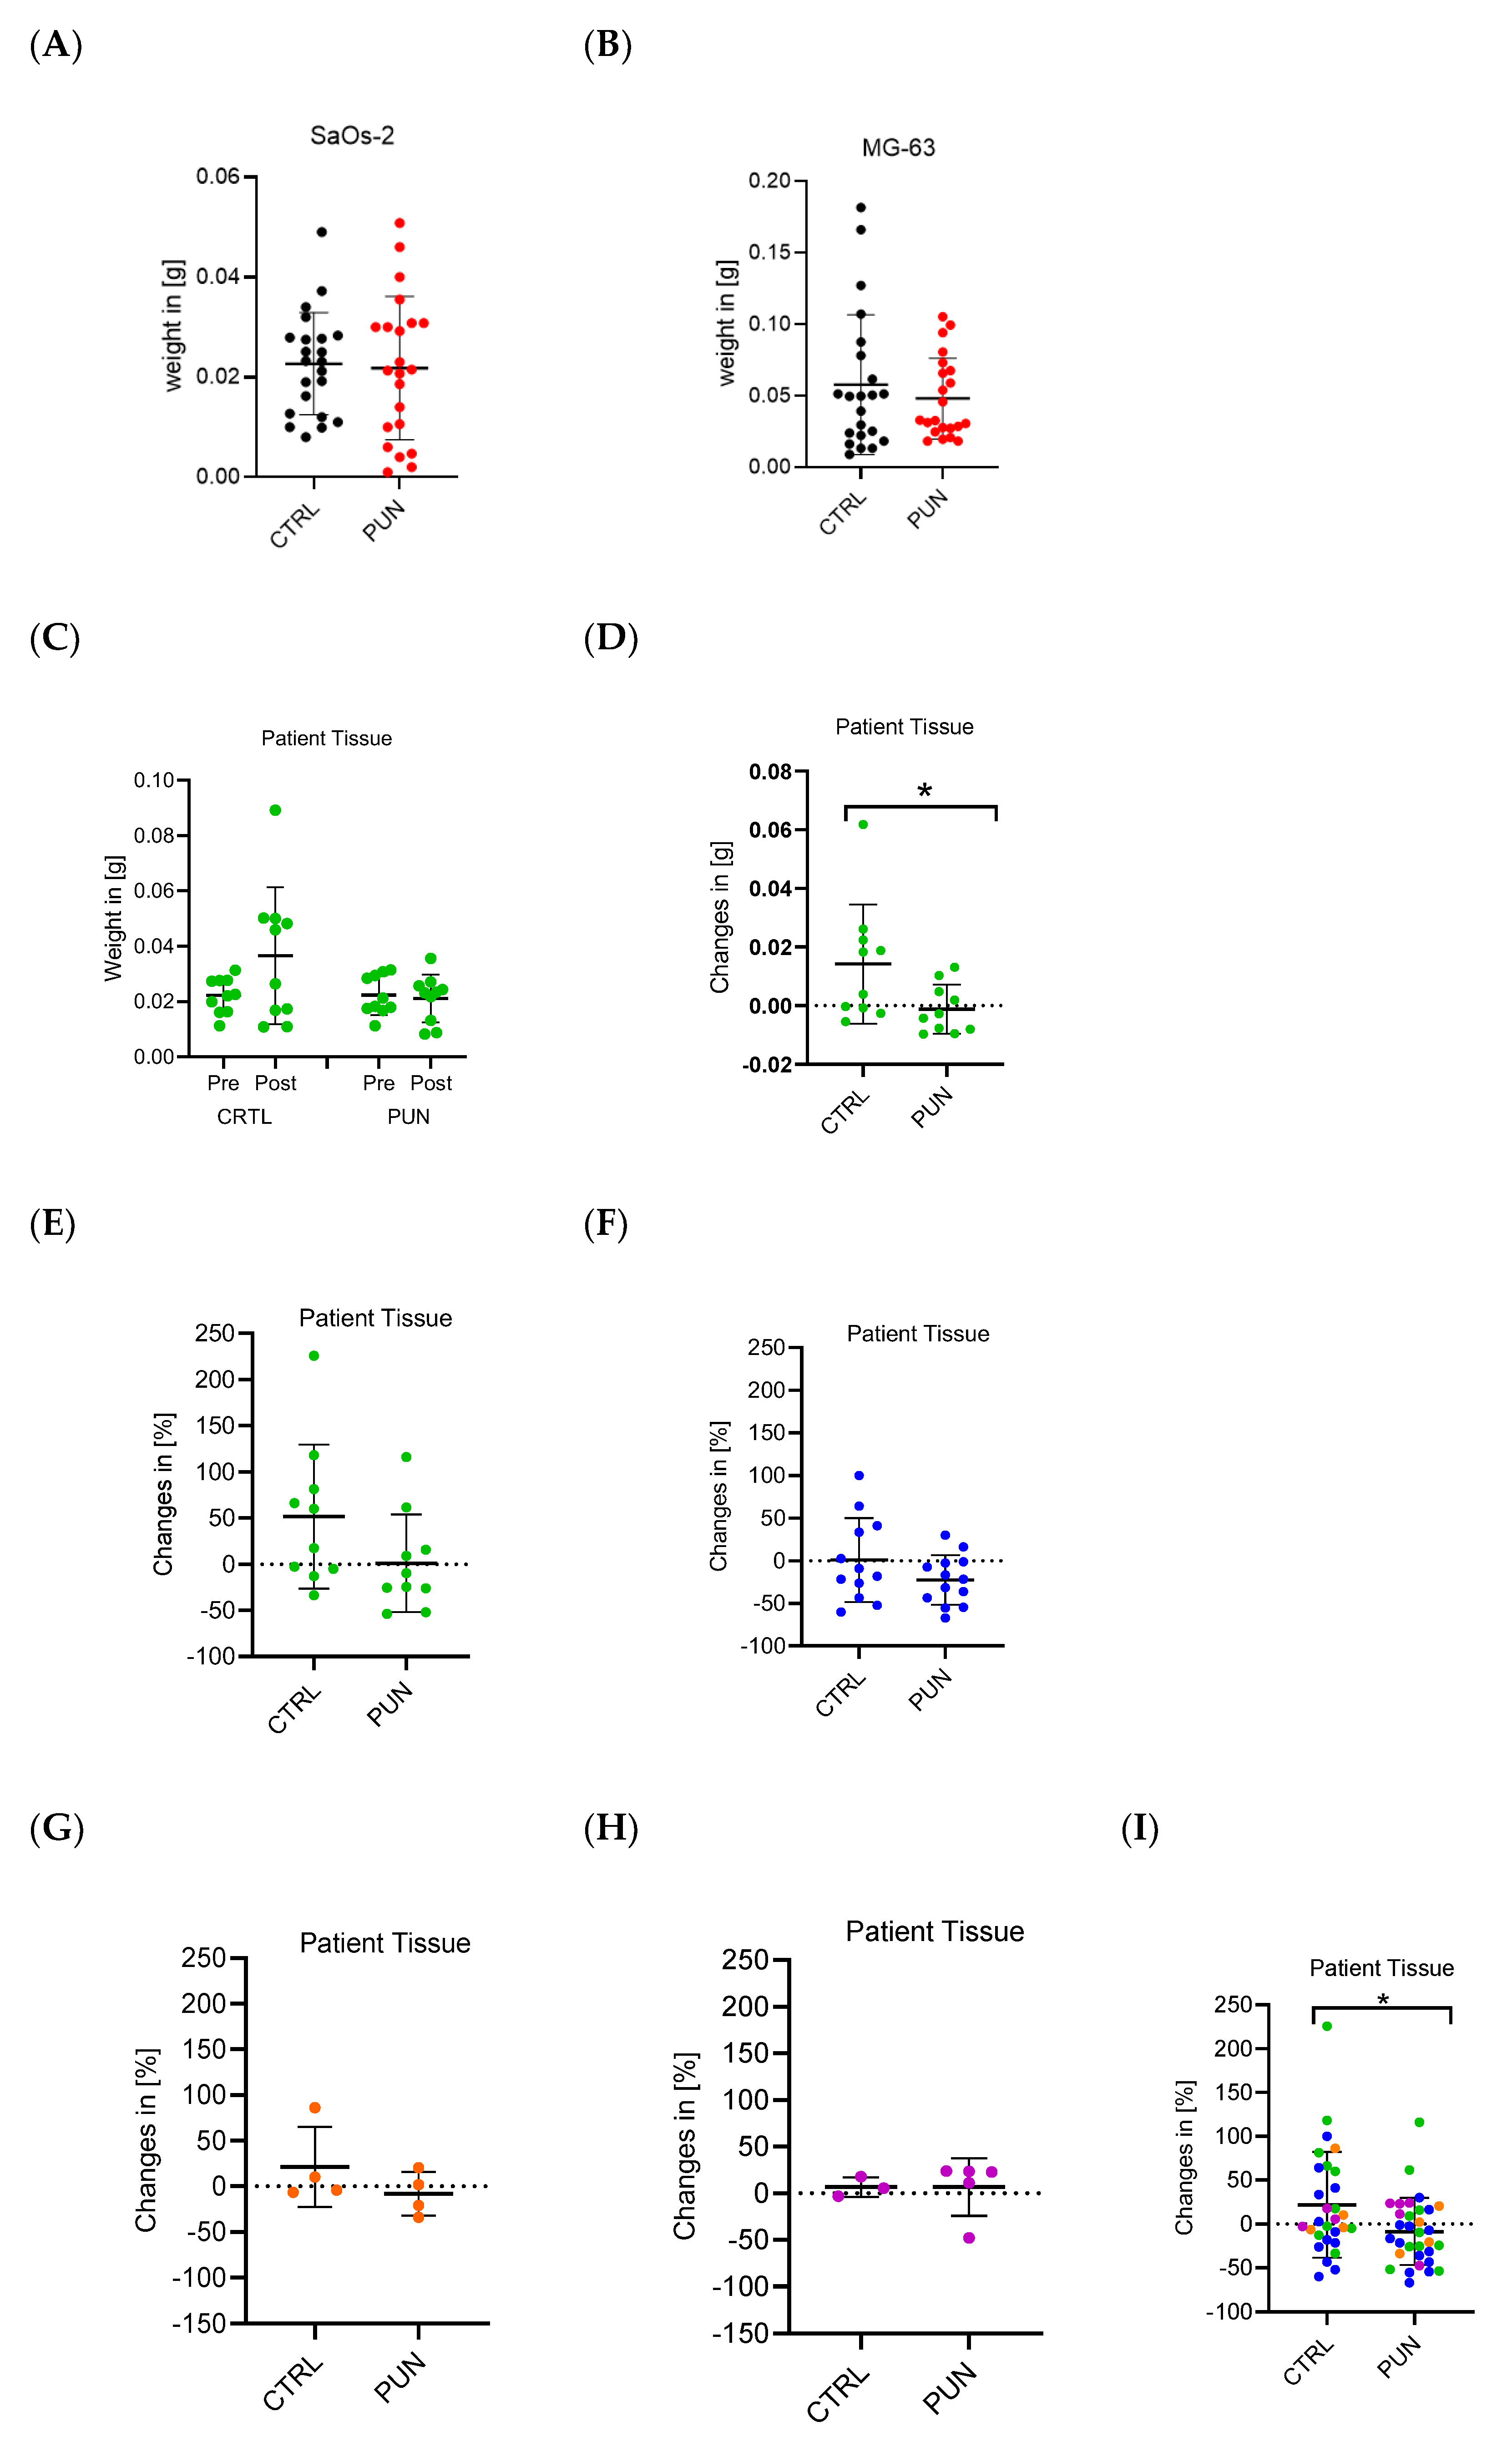
3.2. Effect of Punicalagin on the Weight of SaOs-2 and MG-63 Cell Line Tumors and Osteosarcoma Primary Tissue

After growing osteosarcoma cell lines on the CAM for one week, the weight of SaOs-2 (n = 44) and MG-63 (n = 44) cell line tumors was measured. The treatment with punicalagin caused a decrease in tumor growth compared to the control group for both cell line tumors, SaOs-2 and MG-63. After explantation, the mean weight of the SaOs-2 cell line tumors was 22.69 × 10⁻³ ± 2.18 × 10⁻³ g for the control group (n = 22) and 21.84 × 10⁻³ ± 3.06 × 10⁻³ g for the cells treated with punicalagin (n = 22) (Figure 2A). The mean weight of the MG-63 cell line tumors was 57.98 × 10⁻³ ± 10.42 × 10⁻³ g for the control group (n = 22) and 48.21 × 10⁻³ ± 6.02 × 10⁻³ g for the group treated with punicalagin (n = 22) (Figure 2B). These results show a trend of decreasing tumor weight after treatment but are not statistically significant.
Before and after growing the osteosarcoma patient tissue on the CAM for one week, the weight of the human osteosarcoma tissue (n = 61) was measured. The changes in weight for tissue from one representative patient are shown in Figure 2C, D. In the control group (n = 10), the mean weight increased from 22.26 × 10⁻³ ± 2.02 × 10⁻³ g before engraftment to 36.63 × 10⁻³ ± 7.84 × 10⁻³ g post-explantation. Conversely, the mean weight of the treatment group (n = 10) decreased from 22.35 × 10⁻³ ± 2.25 × 10⁻³ g to 21.16 × 10⁻³ ± 2.72 × 10⁻³ g (Figure 2C). The absolute weight differences were 14.21 × 10⁻³ ± 6.43 × 10⁻³ g for the control group and −1.19 × 10⁻³ ± 2.63 × 10⁻³ g for the treated group (Figure 2D). These results are applicable to all engrafted human osteosarcoma tissue parts. For three out of four representative patients, a reduction in the mean relative changes in weight before engraftment versus post-explantation was observed (Figure 2E–H). Only the data depicted in purple showed nearly no difference between both the control and the treatment group (Figure 2H).
The mean relative weight change of the tissue from all four patients was 21.70 ± 11.21% for the control group and −8.81 ± 6.77% for the tissue treated with punicalagin. Hence, for all four patients together, punicalagin had a significant weight-reducing effect on osteosarcoma tissue (Figure 2E).

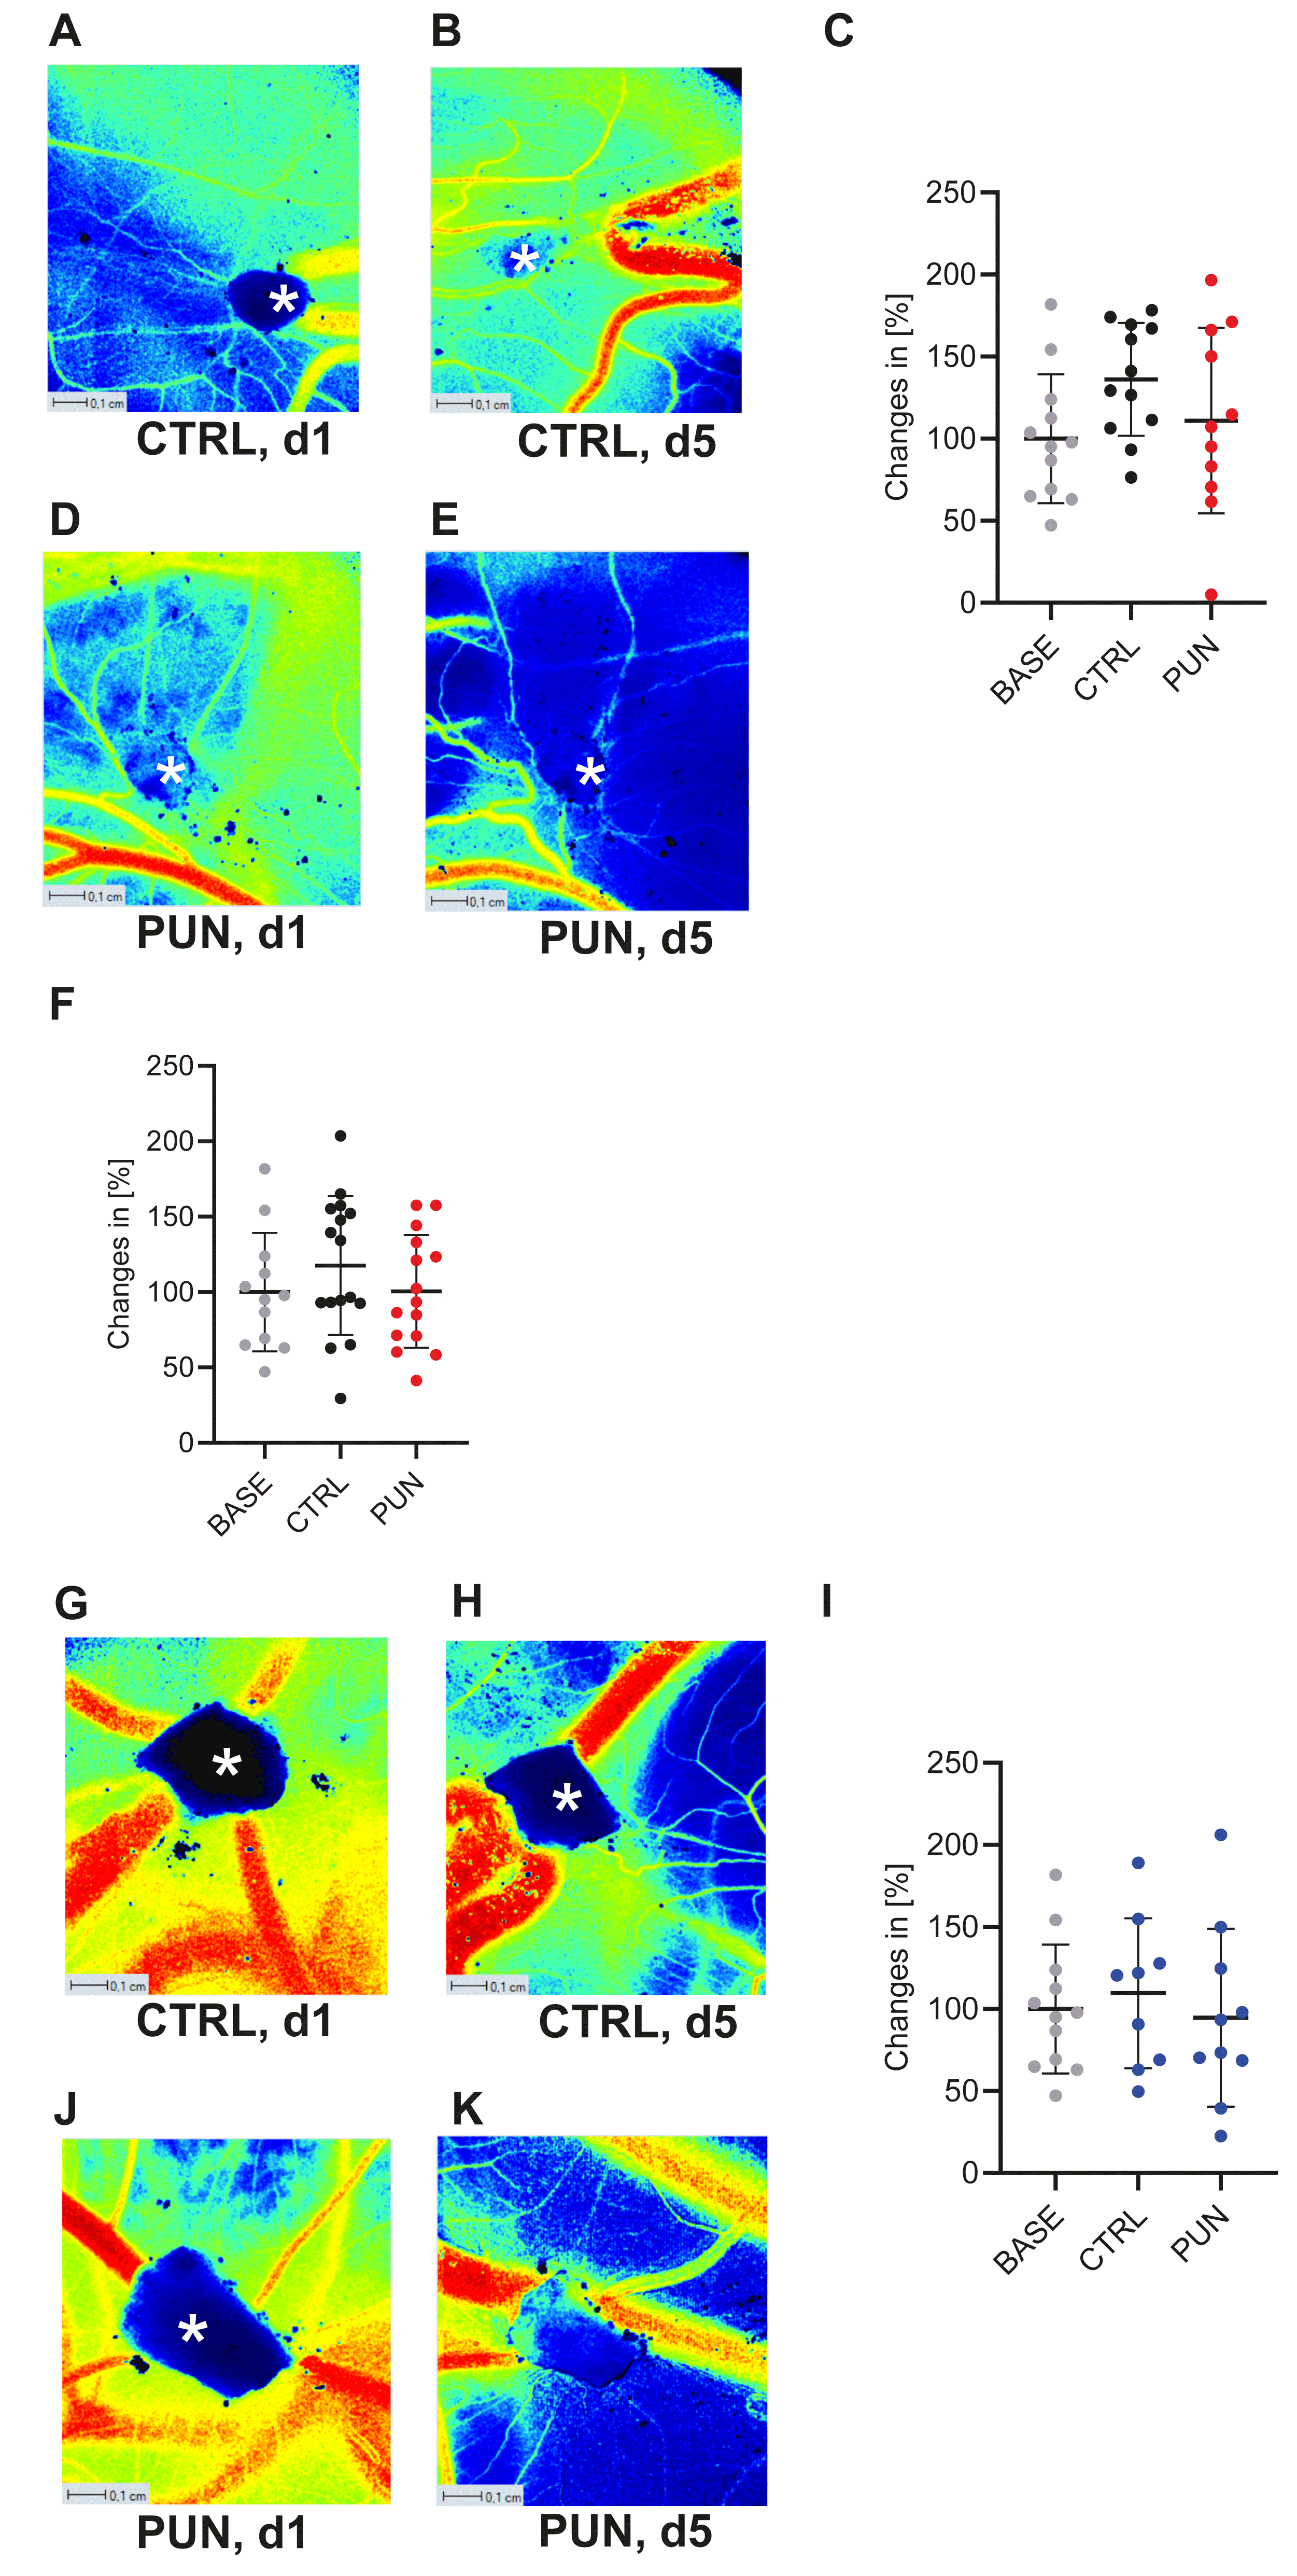
3.3. Assessment of Punicalagin-Induced Changes in Perfusion Using LSCI

The perfusion of CAMs engrafted with SaOs-2 and MG-63 cell line tumors was measured prior to treatment and immediately before explantation (5 days after the start of the treatment). Baseline angiogenesis was assessed on non-engrafted CAMs (n = 12) on the matching days but without any treatment. All experiments were compared to this baseline group. The treated group (n = 11) showed a more distinct reduction in perfusion than the control group (n = 12) (Figure 3C) for the SaOs-2 cell line tumors. Tumors that migrated underneath the eggshell and were consequently no longer visible to the camera were excluded for both cell lines and primary tissue.
Representative LSCI perfusion images confirmed a reduction in perfusion surrounding SaOs-2 cell line tumors over the course of 5 days after the start of the treatment with punicalagin. The mean blood flow increased from 34.568 to 39.304 PU for the controls over time (Figure 3A,B). In contrast, the perfusion decreased from 34.805 to 13.993 PU after treatment with punicalagin (Figure 3D,E). These findings suggest a downregulating effect of punicalagin on the perfusion surrounding SaOs-2 cell line tumors.
For the CAMs engrafted with MG-63 cell line tumors, a reduction in perfusion was observed for both the control group (n = 16) and the CAMs treated with punicalagin (n = 18) over the course of 5 days. A more distinct reduction in perfusion surrounding the tumor was observed for the group treated with punicalagin (Figure 3F).
After engrafting CAMs with osteosarcoma primary tissue, measurements with LSCI were conducted prior to treatment and before explantation. Freezing the tissue prior to the experiments did not decrease the perfusion surrounding the tumor after the cultivation period and before start of the treatment (Supplementary Figure S1). The relative changes in perfusion were calculated for all tumors, comparing day 5 (shortly before explantation) and day 1 (before start of the treatment). For the high-grade osteoblastic osteosarcoma that is shown representatively, relative changes in perfusion were more distinct for the treated group (n = 11) compared to the control group (n = 9) (Figure 3I).
Without correlation to the baseline measurements, three out of four tumors from representative patients showed a more distinct reduction in perfusion surrounding the tumor after treatment with punicalagin (Supplementary Figure S2A–D). Overall, the relative perfusion of the control groups from all four patients (n = 37) decreased by −5.28 % ± 15.10%, while the treated groups (n = 45) displayed a relative perfusion reduction of −21.67% ± 5.64% (Supplementary Figure S2E).
The LSCI images of CAMs engrafted with primary material from a representative patient confirmed a larger decrease in the mean blood flow after the treatment with punicalagin. A reduction in perfusion from 48.575 to 30.367 PU over the course of 5 days was detected for the control (Figure 3G,H). After the treatment, a more distinct perfusion reduction from 46.725 to 22.699 PU was observed (Figure 3J,K). In combination, the results indicate a downregulating effect of punicalagin on the perfusion surrounding osteosarcoma patient tissue.

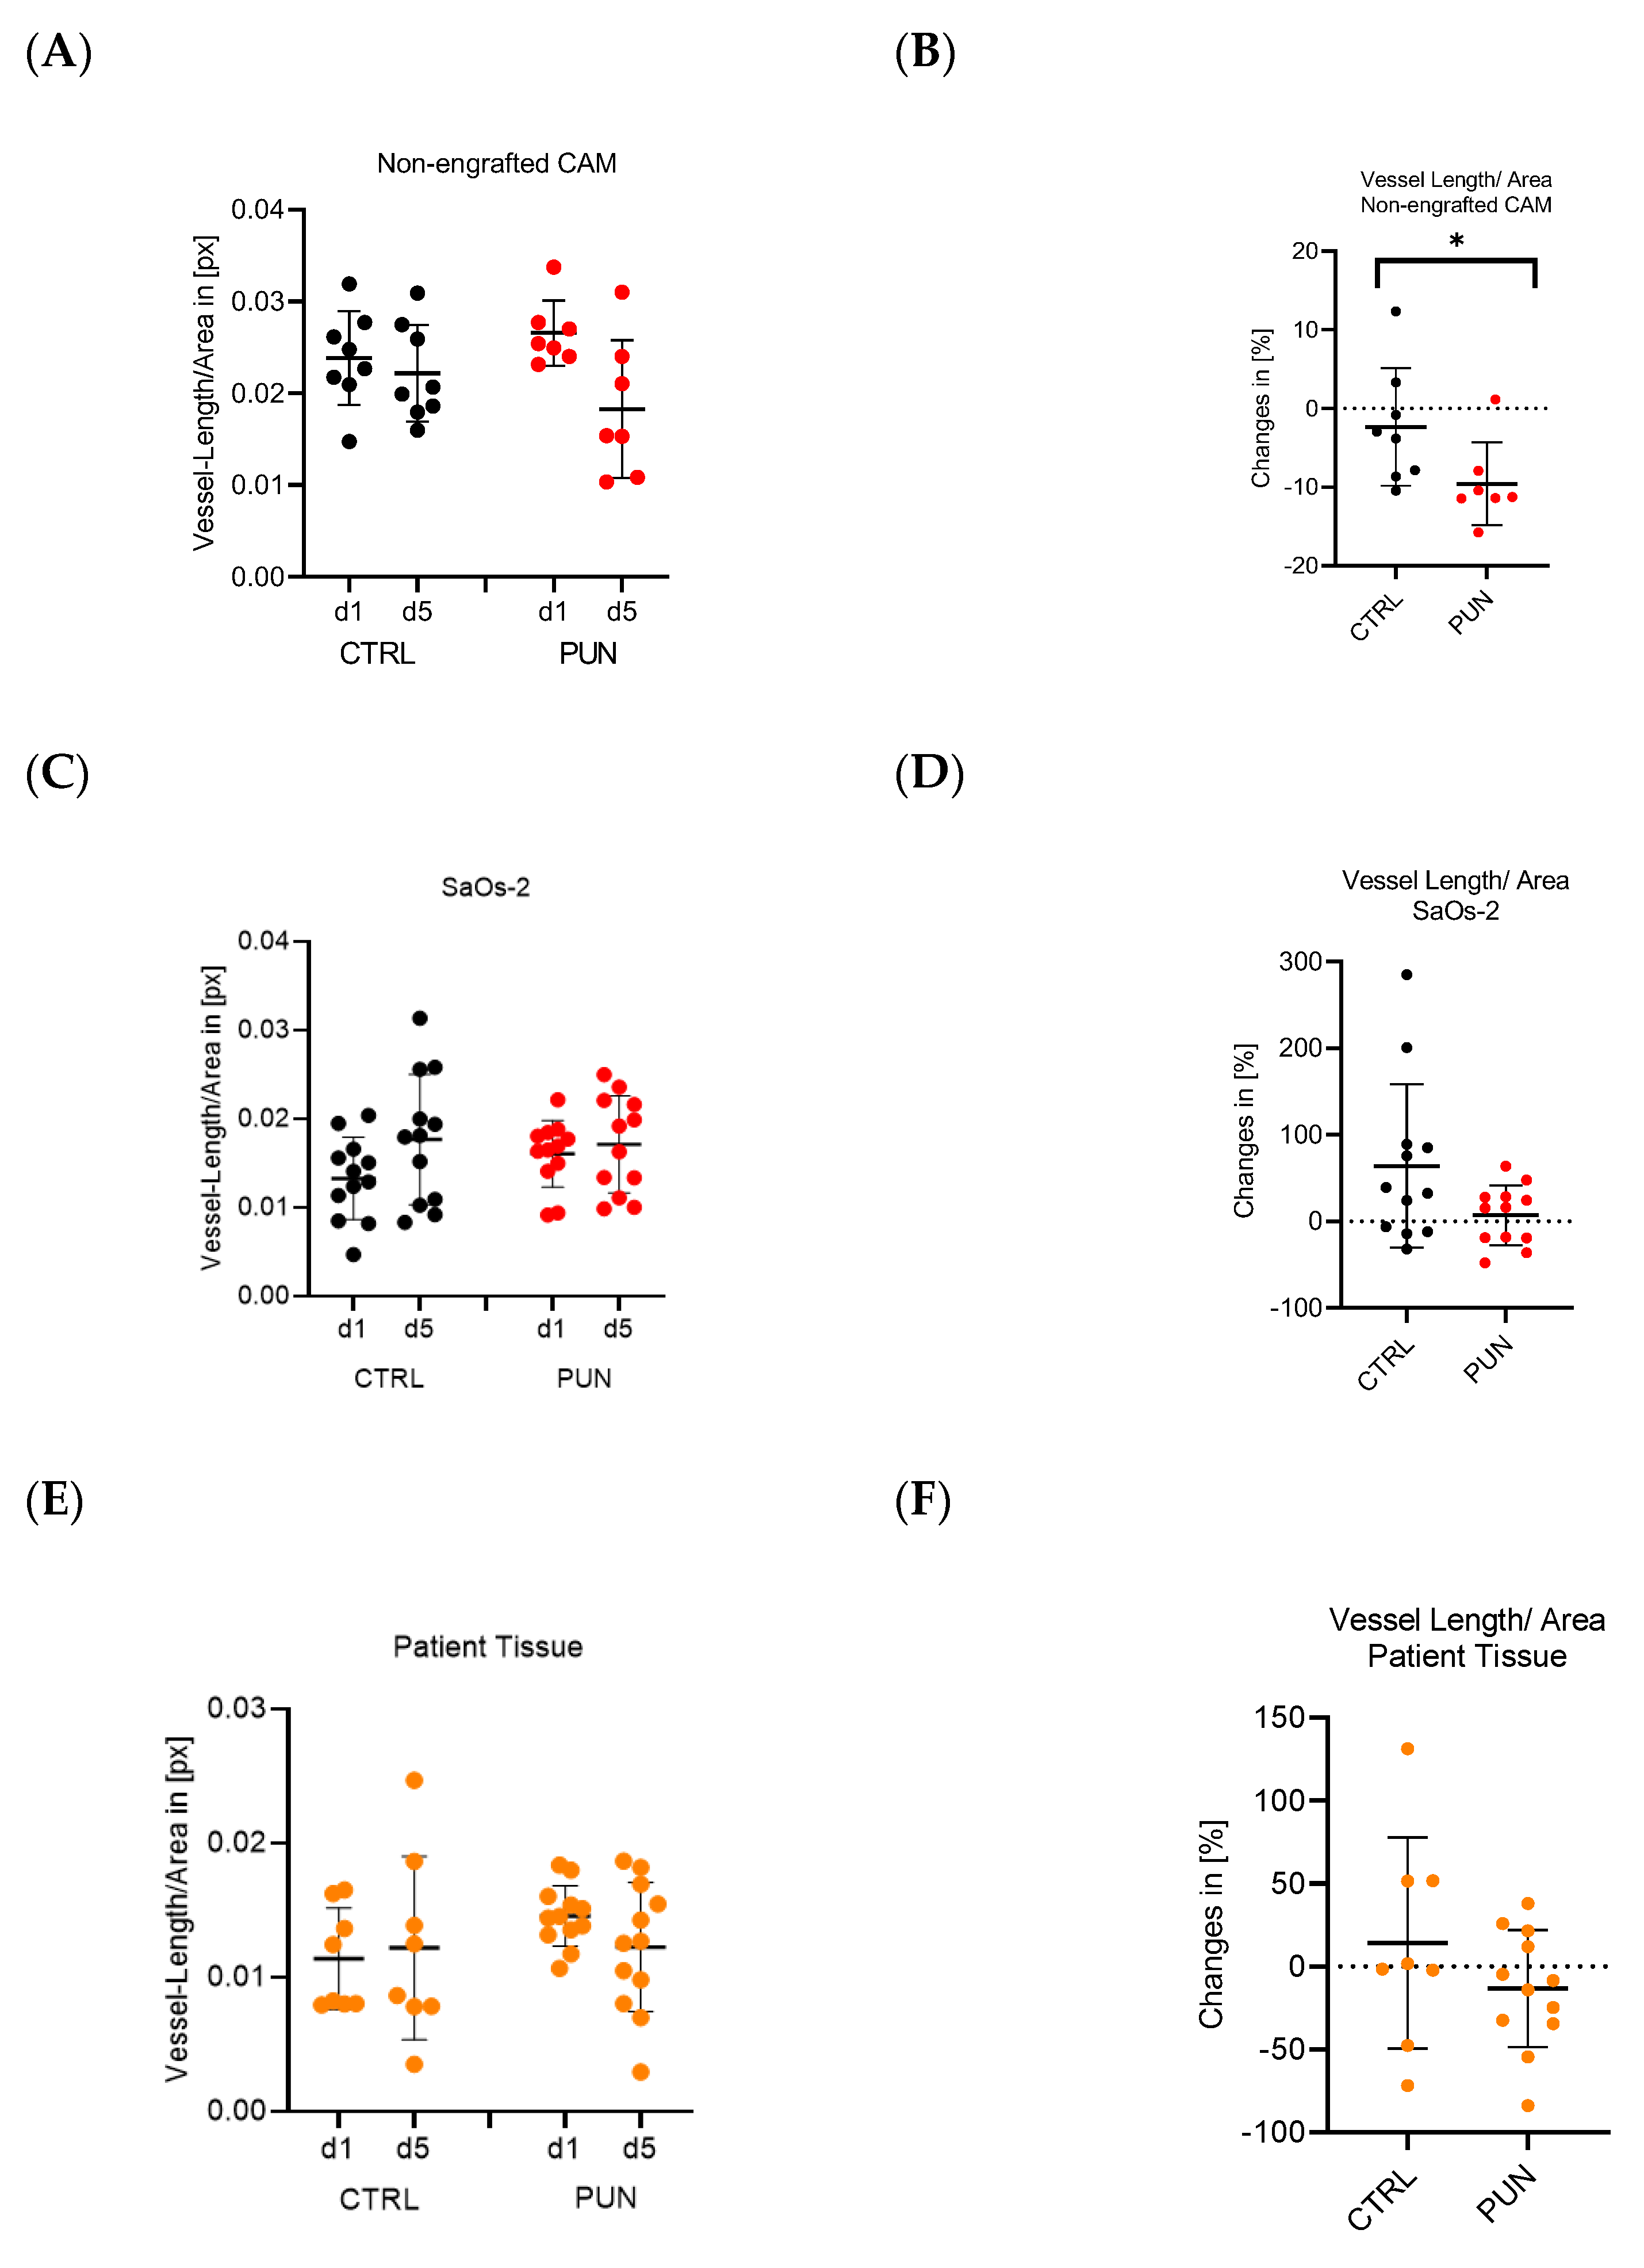
3.4. Assessment of Angiogenesis after Punicalagin Treatment Using the CAM Assay Application

3.4.1. Assessment of Angiogenesis after Treatment with Punicalagin

The angiogenic development of the CAMs engrafted with SaOs-2 cell line tumors and patient tissue was measured with the CAM Assay Application before the first treatment and five days after the start of treatment. The application marked all detected blood vessels in purple and branching points in red (Supplementary Figure S3A,B).

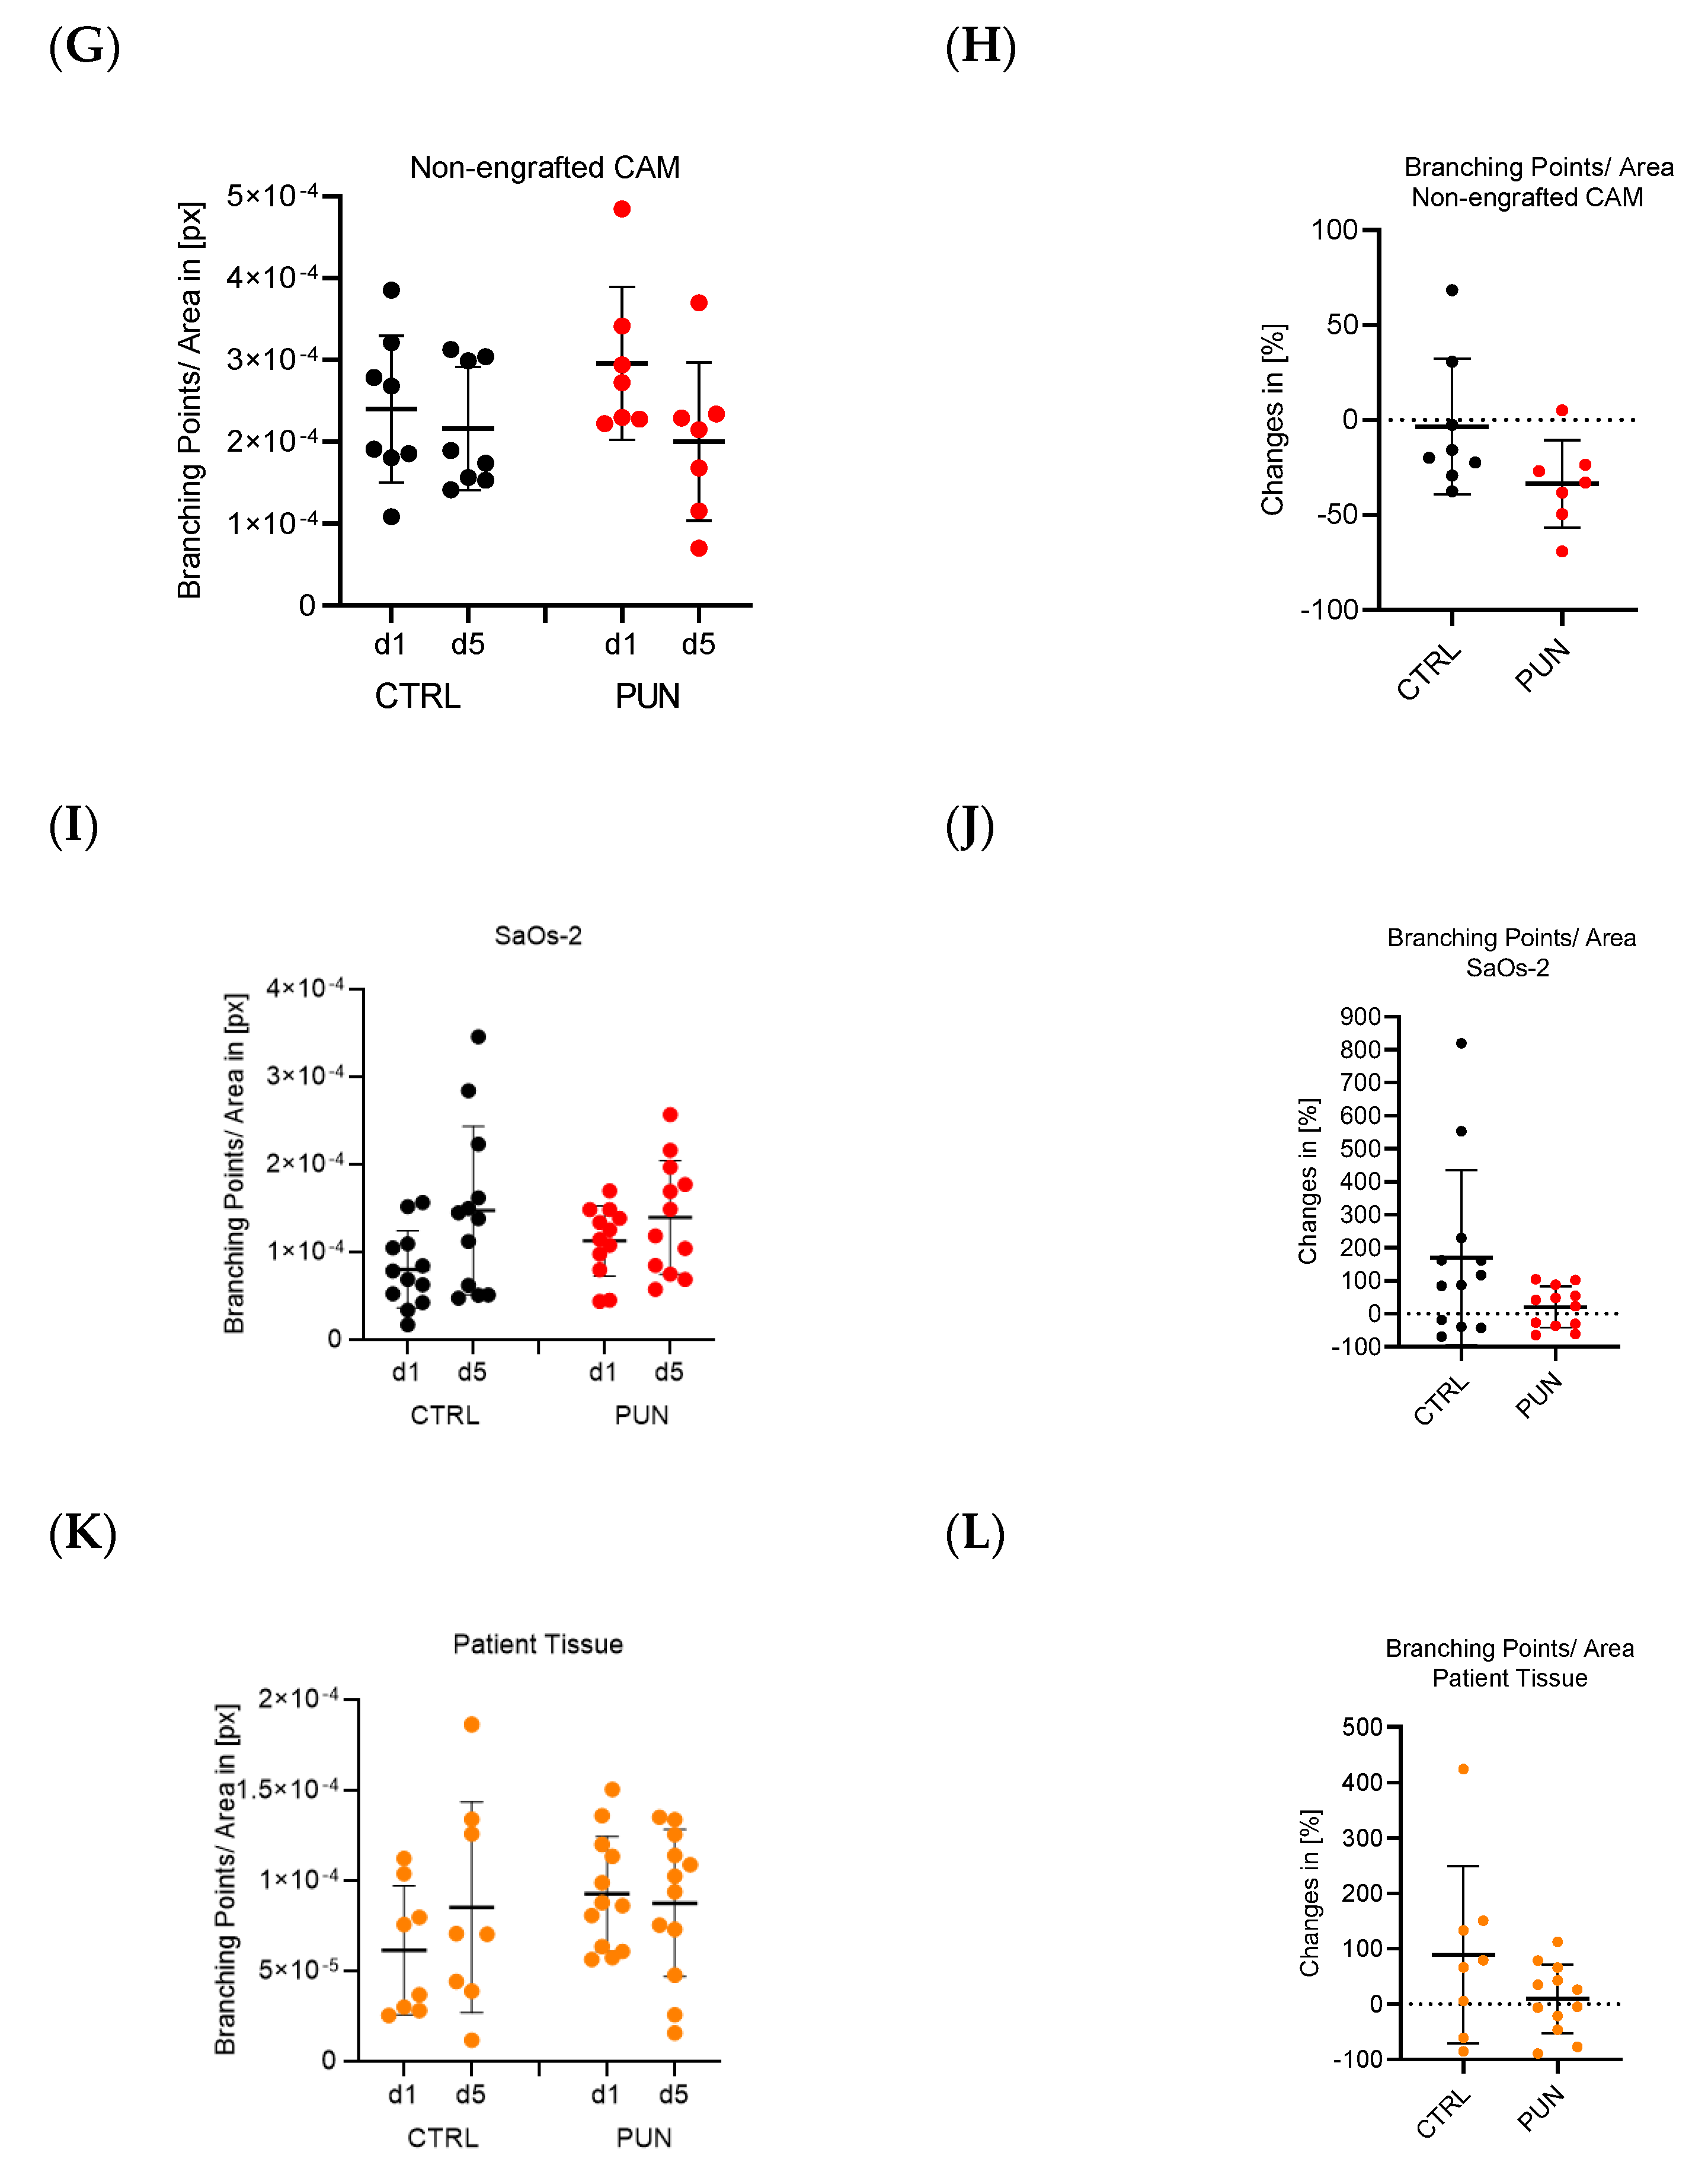
3.4.2. Effect of Punicalagin on Vessel Length and Branching Points

The length of vessels per area and the number of branching points on CAMs engrafted with either SaOs-2 cell line tumors or osteosarcoma patient tissue was determined using the CAM assay application. CAMs without engrafted cell line tumors or patient tissue, a stronger decrease in vessel length per area was observed in the treatment group compared to the control (Figure 4A). The reduction in vessel length in the treatment group (n = 7, −9.57% ± 1.99 %) compared to the control group (n = 8, −2.35% ± 2.46%) was statistically significant (Figure 4B).
For the CAMs engrafted with SaOs-2 cell line tumors, the group treated with punicalagin (n = 12) showed a smaller increase in vessel length than the control group (n = 12) (Figure 4C). The relative change in vessel length was 7.05% ± 9.95% for the treatment group and 63.99% ± 27.24% for the control group (Figure 4D). Measurements from one representative patient are displayed for the CAMs engrafted with osteosarcoma tissue (Figure 4E,F). For the treated group (n = 12, PUN), the vessel length decreased by −13.31% ± 10.21%. In contrast, a relative increase of 14.19% ± 22.53% was detected in the control group (n = 8, CTRL). The duration of the freezing period did not decrease the vessel length per area before start of the treatment (Supplementary Figure S7). Due to severe damage to the CAM by the MG-63 cell line tumors, the vessel length per area could not be assessed properly. However, the control group showed a decrease in vessel length per area of −32.36 ± 10.31% compared to the treatment group, which showed a decrease of −48.87 ± 8.54% (Supplementary Figure S4). There was a significantly higher increase in vessel length per area for CAMs engrafted with the SaOs-2 cell line tumors compared to non-engrafted CAMs of the control group (Supplementary Figure S5A).
Overall, the results suggest a smaller increase in vessel length after the treatment with punicalagin for the CAMs with SaOs-2 cell line tumors. Additionally, for the CAMs engrafted with patient tissue, a decrease in vessel length after treatment was observed. The stimulation of angiogenesis by engrafted tissue was confirmed by comparison with non-engrafted CAMs.
Regarding the number of branching points per area, the non-engrafted CAM showed a stronger decrease in the group treated with punicalagin (Figure 4G). The mean decrease observed in the control group was −3.54% ± 12.65% compared to a decrease of −33.63% ± 8.72% in the treated group (Figure 4H). Regarding CAMs engrafted with SaOs-2 cell line tumors, the group treated with punicalagin (n = 12) showed a smaller increase than the control group (n = 12) (Figure 4I). The relative change in branching points was 20.26% ± 17.98% for the treatment group and 170.30% ± 76.49% for the control group (Figure 4J). For the CAMs engrafted with osteosarcoma tissue, measurements from a representative patient are shown. The patient tissue tumors generated a smaller increase in the number of branching points for the treatment group (n = 12) compared to the control group (n = 8) (Figure 4K). The relative change in branching points was 9.50% ± 17.96% for the treatment group and 89.25% ± 56.49% for the control group (Figure 4L). The duration of the freezing period did not have a decreasing effect on the branching points per area (Supplementary Figure S6). For MG-63, a decrease of −10.74% ± 17.86% was observed for the control group, compared to a decrease of −43.35% ± 10.42% in the treatment group (Supplementary Figure S4). Due to severe damage on the CAM by the MG-63 tumors, the results cannot be considered completely reliable. A non-significant decrease in branching points per area was observed between the control group of the non-engrafted CAMs and the treatment group of the non-engrafted CAMs. In comparison to the non-engrafted CAM of the control and the SaOs-2-tumors of the control, the SaOs-2 tumors showed a significantly higher increase in branching points per area (Supplementary Figure S5B).
Both the CAMs with SaOs-2 cell line tumors and patient primary tissue suggest a smaller increase in the number of branching points after the treatment with punicalagin. Stimulation of angiogenesis by engrafted tissue was confirmed.

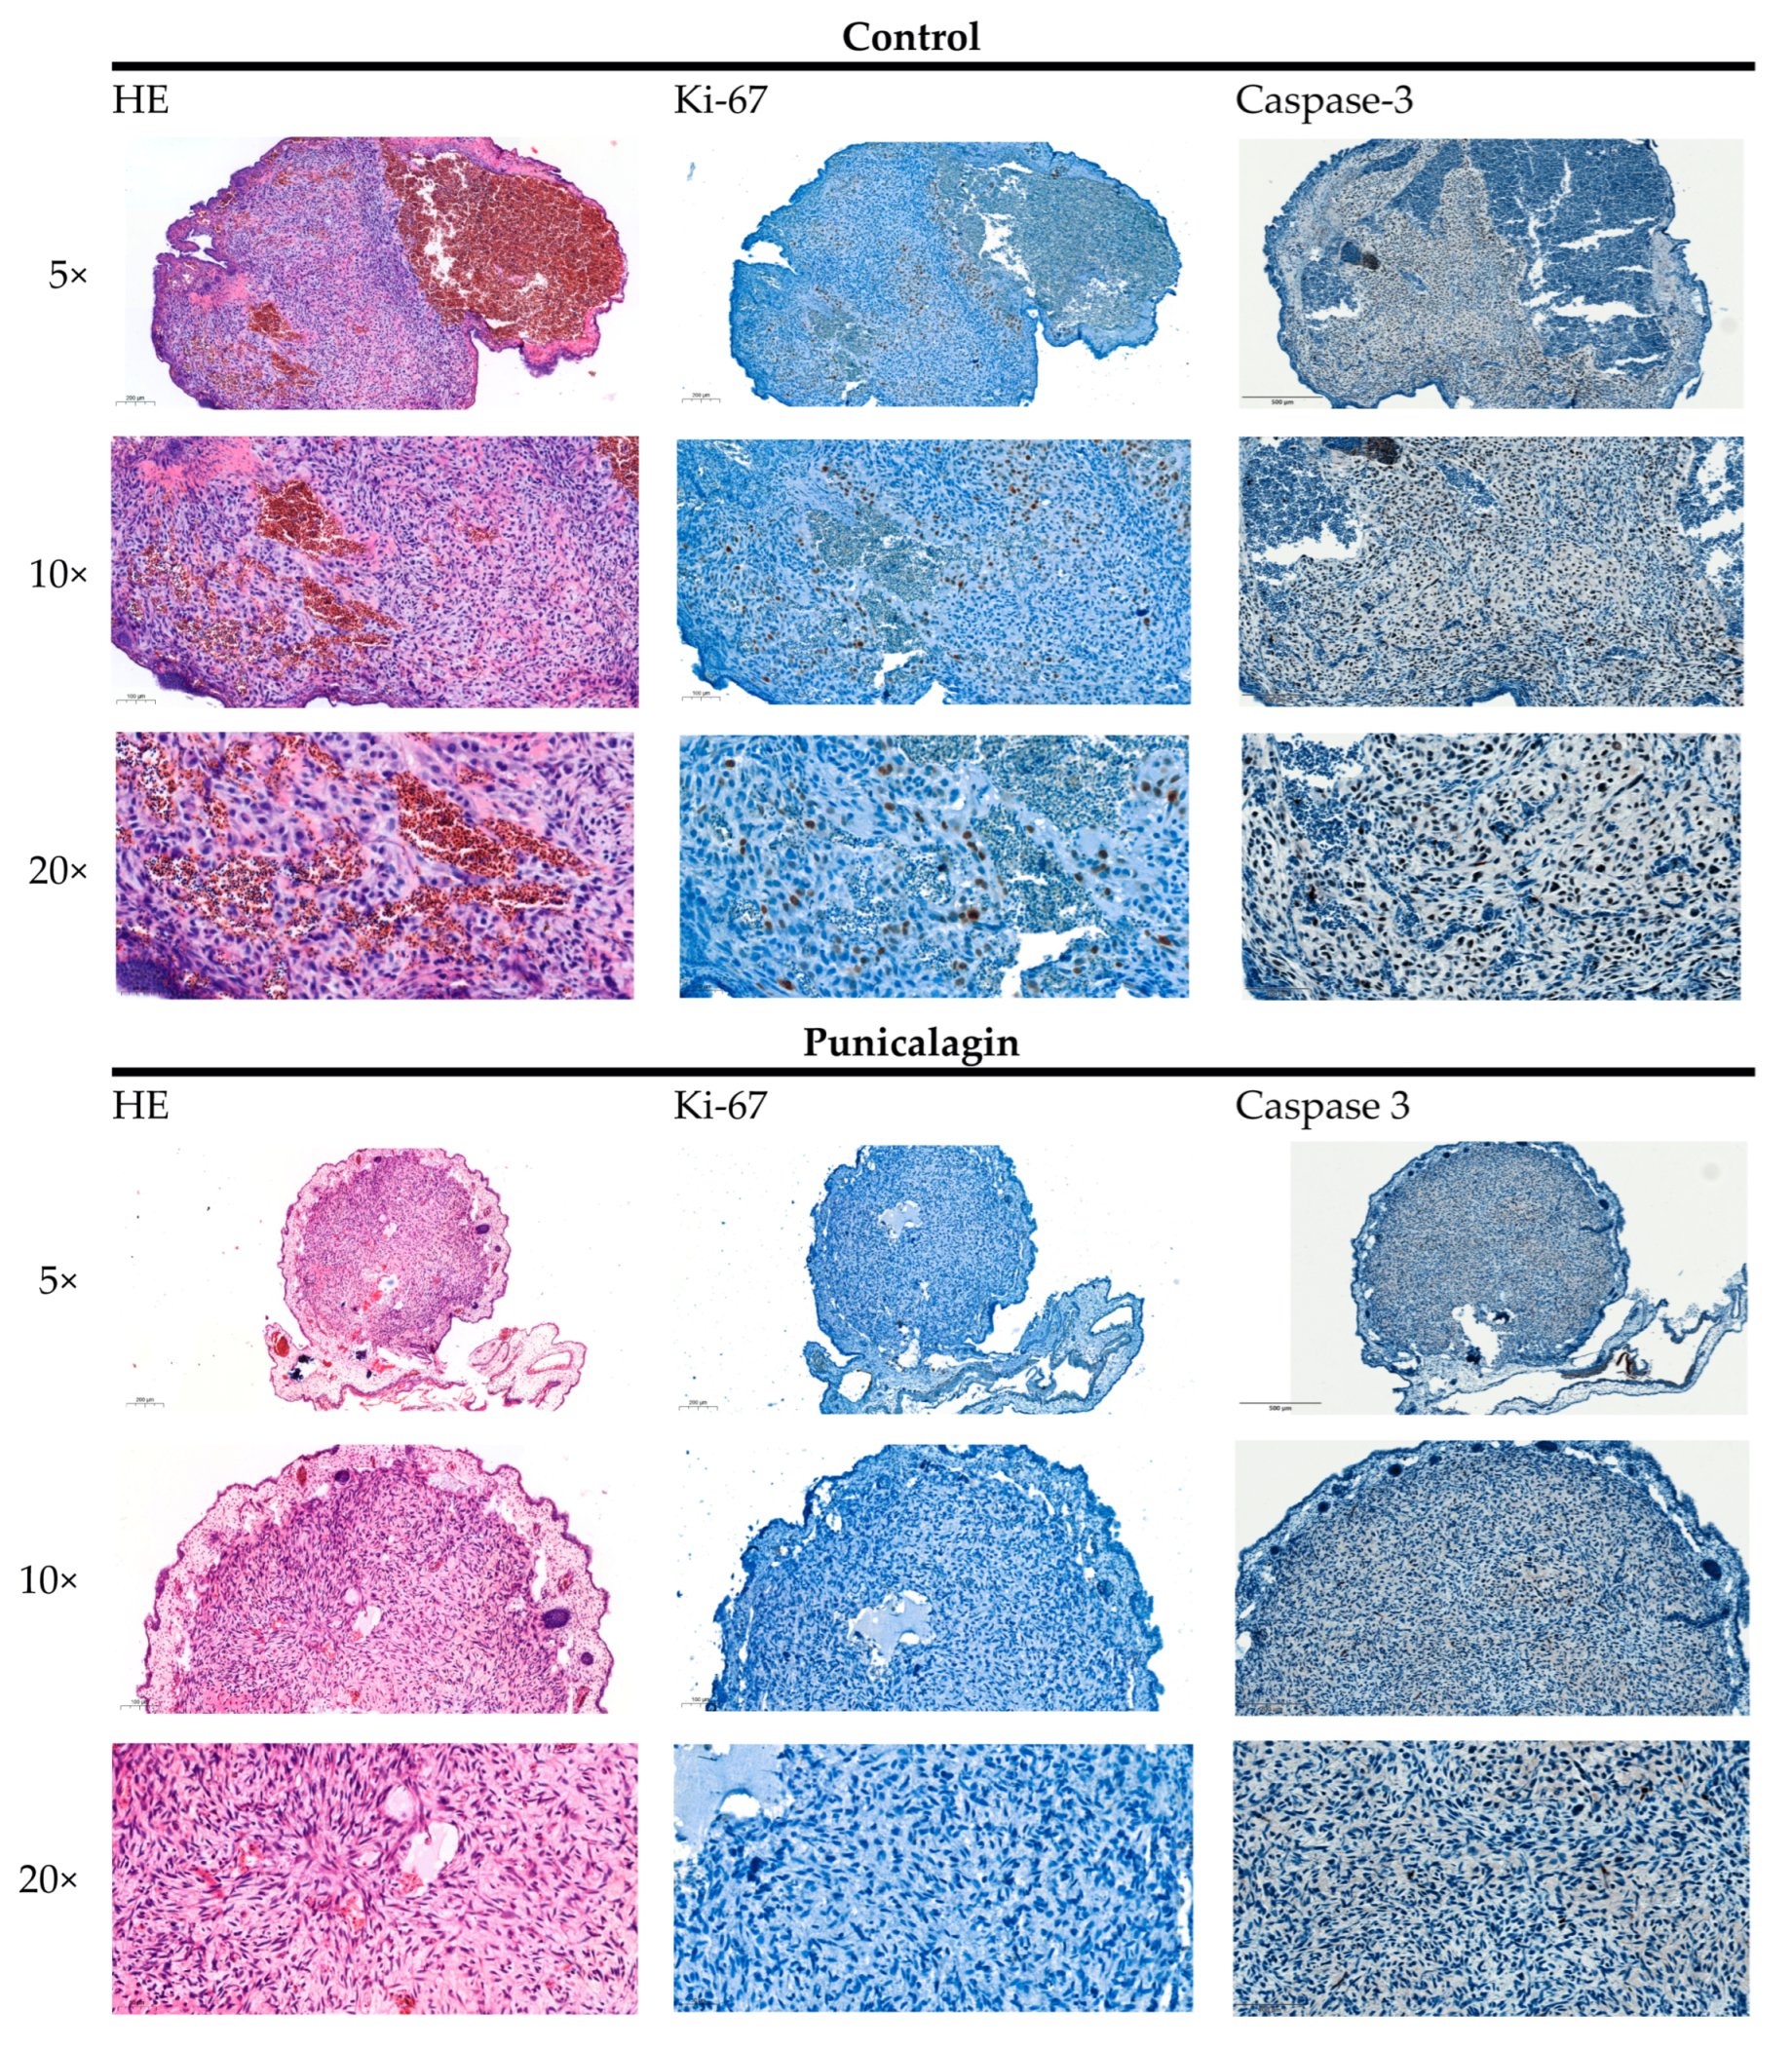
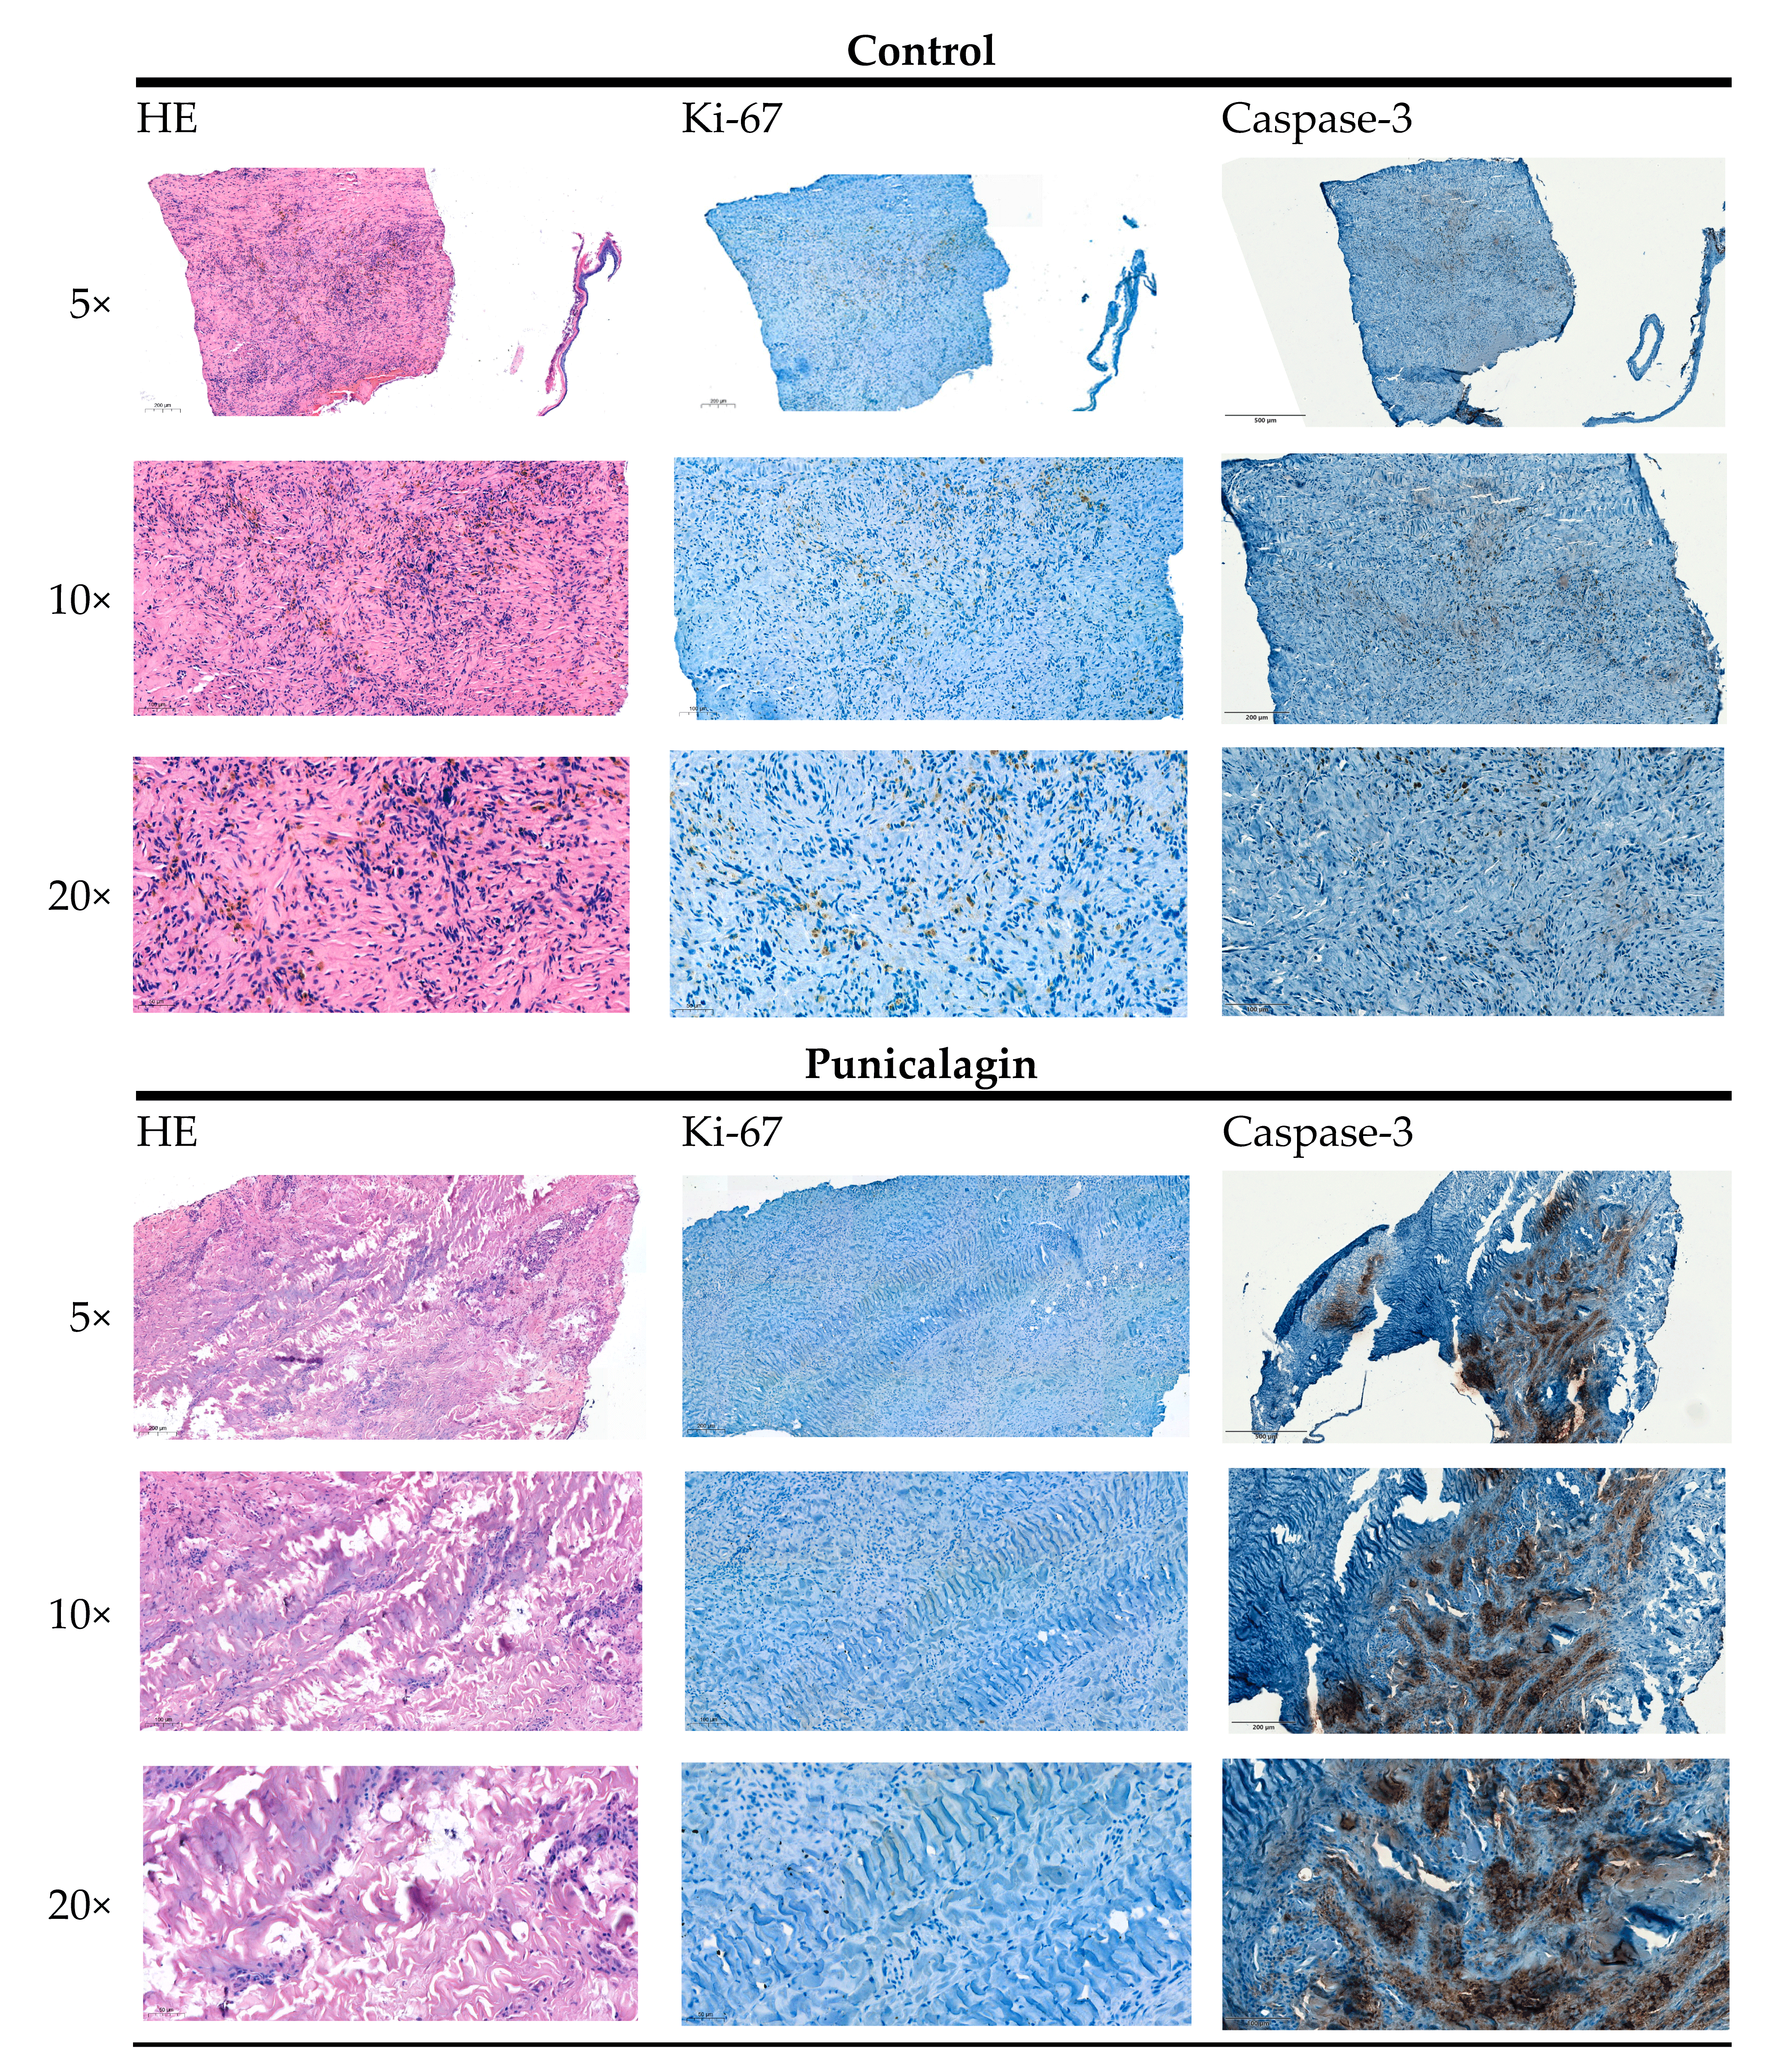
3.5. Vitality and Proliferation Assessed with HE and Ki-67 Staining

The vitality and proliferation of the engrafted SaOs-2 and MG-63 cell pellets as well as the osteosarcoma patient tissue were assessed using histological staining. HE and Ki-67 staining showed that the transplanted MG-63 cell pellets were vital and proliferated in both the control group and the group treated with punicalagin (Figure 5). Erythrocytes containing nuclei that migrated from the chicken embryo are present in all stains imaged and suggest penetrating tissue growth into the CAM. The Ki-67 staining of the treatment group shows a smaller number of Ki-67-positive cells than the control group, indicating an antiproliferative effect of punicalagin. In the staining against Caspase-3, the extracellular matrix showed an unspecific diffuse signal in both the control and the treated group, as Caspase-3 should only occur in nuclei or cytoplasm. Many nuclei in the control sample failed to show a distinct signal, which could be an early sign of Caspase-3 expression. In the treated sample, Caspase-3-positive and -negative cells were more distinct (Figure 5). This indicates a reduction in cellular turnover caused by punicalagin.
Cell vitality and proliferation were confirmed for the control and treatment groups of SaOs-2 cell line tumors using histological staining. The control group displayed more erythrocytes than the treated samples, indicating a superior blood supply within the control group. Furthermore, signs of cell damage in the treated group were recognizable by desiccation and the presence of more small, spherical cells compared to the control group. This indicates apoptosis. In addition, Ki-67 staining showed greater proliferation in the control group. Caspase-3 staining showed a non-specific positive signal in the extracellular matrix in both the control and the treated group. Nuclei showed a higher expression of Caspase-3 in the treated group compared to the control. In the CAM, nearly no expression of Caspase-3 was observed. Taken together, these results indicate an inhibition of proliferation and blood flow, as well as a possible proapoptotic effect of punicalagin on tumor cells (Supplementary Figure S7).
The CAMs with osteosarcoma patient tissue revealed vital and proliferative tumors in HE and Ki-67 staining after explantation (Figure 6). Macroscopically, the control group exhibited a higher number of nuclei-containing erythrocytes that migrated from the chicken embryo and more Ki-67-positive cells, implying higher blood flow and proliferation. This indicates that punicalagin may have had an inhibitory effect on proliferation and blood flow. Overall, the primary material proliferated less than the two cell line tumors. In addition, Caspase-3 staining revealed a higher expression after treatment with punicalagin, which correlates with a higher apoptosis rate. In these images, abundant pro-apoptotic bodies with a granular brown stain within the tumor proliferation, as is known from apoptotic cells or cell nuclei, were observed.

4. Discussion

Previous studies on osteosarcoma cell lines and tumor xenograft mouse models found that punicalagin has anti-proliferative effects on tumors, inhibiting tumor invasion, which results in a significant reduction in tumor size [23]. In vivo studies showed a significant decrease in the infiltrative growth patterns, growth rate, and tumor-associated angiogenesis of human bladder cancer xenografts after treatment with punicalagin [24]. In this study, we investigated the effect of punicalagin on osteosarcoma cell lines and primary tissue with the 3D in vivo CAM model. The results of this study provide strong evidence that support the anti-angiogenic and anti-proliferative effects of punicalagin in an additional in vivo model. Additionally, the methods used for the measurement of angiogenesis and proliferation, e.g., LSCI, the IKOSA CAM Assay Application, weight measurements, MTT assay, and immunohistology, enable a profound insight into the mechanism of tumor proliferation.
The CAM of the developing chicken embryo is a highly vascularized, extra-embryonic membrane that can be used as a platform to study tumor growth, angiogenesis, and the efficacy of chemotherapeutic drugs [28,30,31]. Previous research on human osteosarcoma and the CAM model implemented successful protocols for the grafting and investigation of cell lines [7,29], as well as patient tissue [6,14]. In this study, the challenging cultivation of osteosarcomas, due to their calcified structure, was not only successful for cell lines SaOs-2 and MG-63, but also for patient tissue. The SaOs-2-derived cell line tumors and the osteosarcoma patient tissue stimulated angiogenesis on the CAM. These results confirm the feasibility of grafting osteosarcoma patient tissue onto the CAM. Especially for rare cancers, such as osteosarcomas, that lack a standard therapy regimen (especially regarding non-responders and patients with metastasis), testing possible therapeutic agents with the CAM model could benefit the search for personalized therapies [32]. Since it is an affordable and easy-to-handle model that delivers quick results (short cultivation period), the CAM model is suitable for potentially broad-scale clinical use [33].
Engrafted onto the CAM, SaOs-2 and MG-63 cell line tumors histologically showed some characteristics of osteosarcoma patient tissue such as the production of tumor osteoid and anastomoses with CAM-vessels. This study shows that the engrafted SaOs-2 and MG-63 cells were able to form a functional unit. The co-engraftment of tumor-associated fibroblasts and osteosarcoma cell lines could be the next step. The formation of more complex structures such as organoids could also be possible due to ideal growing conditions on the CAM. Organoids are defined as cellular aggregates that re-organized after the dissociation of tissue-specific cells [21]. In recent decades, organoids have enabled researchers to gain valuable insights into the physiology and pathophysiology of several tissues such as the gastrointestinal tract [34], the choroid plexus [35], or the retina [36]. Future studies are strongly recommended.
The results of the angiogenesis measurements demonstrate that one method alone is not sufficient for the in-depth evaluation of angiogenesis, and LSCI and the IKOSA CAM Assay Application should be combined. These methods have been well established and have been published already by Feder et al., Pion et al., Kuri et al., and Bichlmayer et al., in studies regarding osteosarcoma, angiosarcoma, and cystic kidney tissue. Kuri et al. found that LSCI mostly detects thicker and deeper blood vessels, while the IKOSA CAM Assay Application reliably detects thin, superficial vessels [27]. A combination of both methods makes the assessment of angiogenesis more efficient, because microscopic images are taken into consideration in addition to actual blood flow measurements. Further, the CAM assay has repeatedly provided valuable insight into tissue-induced angiogenesis [37]. The observation of reductions in perfusion, not only for the treated group but also for the control group, might be due to irritations on the CAM. These are caused by the treatment itself and cytotoxic effects of DMSO, the solvent of punicalagin used in both the control and the treatment solution. The results of the conducted measurements in this study provide evidence that confirm the anti-angiogenic effects of punicalagin, which support the results of previous xenograft mouse model studies [38]. Different responses of the patient tissue to treatment with punicalagin were observed. Three out of four patients showed a more distinct decrease in perfusion after treatment, measured with LSCI. The only patient that showed an increase in perfusion surrounding the tumor also showed the strongest decrease in vessel length and branching points per area. These different reactions may be due to the histopathological heterogeneity of the four patients, of whom two had received neoadjuvant chemotherapy prior to resection. Nevertheless, the different results of cell lines and patient tissue strongly support the necessity of investigating each osteosarcoma individually, due to the high levels of heterogeneity.
The results of the histological staining suggest that punicalagin induced the inhibition of cell proliferation, since osteosarcoma cell lines SaOs-2 and MG-63, as well as patient tissue, displayed less Ki-67 cells after treatment. Moreover, a smaller number of nuclei containing erythrocytes were detected within the treated groups of MG-63, SaOs-2, and primary tissue compared to the respective control groups. This is indicative of a decrease in blood supply after punicalagin treatment. The treated patient tissue showed a high expression of Caspase-3-positive cells, which could be due to the pro-apoptotic effect of punicalagin [23].
The synopsis of the MTT assay results for SaOs-2 and MG-63, as well as the histological staining, support the apoptotic characteristics of punicalagin. After 48 h and 72 h, punicalagin had a cytotoxic effect. A higher concentration than the IC50 of the SaOs-2 was required for the trials in the CAM model due to the inhomogeneous exposure of the tissue on the CAM to punicalagin. These findings confirm the results of Huang et al. that suggest an increased apoptosis rate among osteosarcoma cell lines SaOs-2, MG-63, and U2-OS [23].
A different sensitivity of SaOs-2, MG-63, and patient tissue to punicalagin was observed. Regarding the cell lines, this difference could be due to a higher proliferation rate of 28.3–38 h for MG-63 compared to 35–48 h for SaOs-2. The aggressive invasion of the MG-63 cells led to severe damage to the blood vessels of the CAM. In this study, angiogenesis measurements with the IKOSA CAM Assay Application were also conducted for the MG-63 cell line tumors and suggested an angiogenesis-reducing effect of punicalagin.
The anti-angiogenic effects of punicalagin were less distinct for the CAM models engrafted with patient tissue, which highlights the importance of using patient tissue in future experiments. Continuous cell lines offer an insight into anti-tumor effects; however, their ability to fully replicate the complexity observed in authentic tumor settings may be limited. A weaker anti-angiogenic effect in patient tissue can be attributed to the stabilizing effect of the tumor’s microenvironment with vascular endothelial cells and fibroblasts that promote angiogenesis [39]. The exact effect of punicalagin on the molecular pathways associated with tumor growth and angiogenesis within osteosarcomas still requires further investigation. However, it was shown that targeting both the tumor cells and their microenvironment is mandatory to achieve the best results in osteosarcoma treatment [40]. For example, Lowery et al. conducted experiments targeting vascular endothelial growth factor receptor 2 (VEGFR-2), which is important for tumor angiogenesis and is expressed in osteosarcoma tumor cells [41]. Their results showed promising anti-angiogenic effects in vitro, but were insufficient in preclinical osteosarcoma models. This highlights the necessity for translational models, such as the CAM model.
Although the CAM is useful to assess tumor growth, angiogenesis, and metastasis, limitations of accuracy arise as the thin membrane has an impact on the weight measurements. Therefore, it is important to remove as little of the CAM as possible when explanting the tumors from it. Regarding the CAM vasculature, vessel remodeling due to the growth of the embryo may have had an additional impact on perfusion, vessel length, and branching points. This can be addressed by using adequate controls.
Another issue is the pharmacokinetics of punicalagin: the low enteral bioavailability also represents a limitation for the therapeutic usage of punicalagin [23], but intravenous application may overcome this issue. There is little knowledge on the pharmaceutical modulation and molecular structure of punicalagin, which is necessary to enable the clinical use of this substance. Due to its promising effects, not only on osteosarcoma but also on cervical cancer and lung, colon, and breast cancer, further studies should be conducted on this agent [42].

5. Conclusions

The 3D in vivo tumor model represents a beneficial methodology for the investigation of novel cancer therapies. There is significant potential for the assessment of chemosensitivity, especially for rare tumor entities such as osteosarcomas. Punicalagin has been shown to be a potential supplementary therapeutic substance for osteosarcomas by decreasing the tumor weight, tumor-induced angiogenesis, proliferation, and viability of tumor cells. Further studies are necessary to test possible substances in the CAM model and to study the effect of punicalagin on different osteosarcoma types.

Supplementary Materials

The following supporting information can be downloaded at https://www.mdpi.com/article/10.3390/organoids3010004/s1: Figure S1: LSCI-based perfusion measurements surrounding the tumor of four different patients per time of the tissue being frozen; Figure S2: Relative changes in LSCI-assessed perfusion for untreated and punicalagin-treated CAMs of all four patients; Figure S3: Measurement of the angiogenic development with the IKOSA CAM assay application v3.1.0; Figure S4: Vessel length and branching point measurements of CAMs engrafted with MG-63 cell line tumors; Figure S5: Measurements of changes in vessel length per area and branching points per area with the IKOSA for non-engrafted CAM and SaOs-2 tumors using CAM assay application v3.1.0; Figure S6: Vessel length and branching points of CAMs engrafted with patient tissue of a representative patient per time the tissue was frozen; Figure S7: HE, Ki-67, and Caspase-3 staining of two representative CAMs engrafted with SaOs-2 cell line tumors.

Author Contributions

Conceptualization, A.R.D., T.A. and S.H. (Silke Haerteis); methodology, A.R.D., S.N., S.H. (Sophia Hupp), M.E., E.P., U.L., C.K., A.D., S.S., M.W., C.W., A.H., F.W., P.C., P.K., A.R.D., T.A. and S.H. (Silke Haerteis); software, P.K.; formal analysis, A.R.D., S.N., S.H. (Sophia Hupp), M.E., E.P., T.A. and S.H. (Silke Haerteis); investigation, A.R.D., U.L., C.K., A.D., S.S., M.W., F.W., C.W., A.H. and S.H. (Silke Haerteis); resources, T.A. and S.H. (Silke Haerteis); writing—original draft preparation, A.R.D., S.N., S.H. (Sophia Hupp), M.E., E.P., T.A. and S.H. (Silke Haerteis); writing—review and editing, A.R.D., S.N., S.H. (Sophia Hupp), M.E., E.P., U.L., C.K., A.D., S.S., M.W., C.W., A.H., P.K., T.A. and S.H. (Silke Haerteis); supervision, T.A. and S.H.; project administration, T.A. and S.H. (Silke Haerteis); funding acquisition, T.A. and S.H. (Silke Haerteis). All authors have read and agreed to the published version of the manuscript.

Funding

This research received no external funding.

Institutional Review Board Statement

This study was conducted in accordance with the Declaration of Helsinki and approved by the Ethics Committee of the University of Regensburg (positive ethics committee vote: 19-1552-101).

Informed Consent Statement

Informed consent was obtained from all subjects involved in this study.

Data Availability Statement

Data are contained within the article or supplementary material. The data presented in this study are available in Effects of Punicalagin on Osteosarcoma Cell Lines and Patient Tissue in the 3D in vivo tumor model.

Acknowledgments

We thank Lucia Denk and Andreas Ziesch for their excellent technical support.

Conflicts of Interest

P.K. is co-founder and CEO, and P.C. an employee of KML Vision GmbH.

References

  1. Bielack, S.; Carrle, D.; Jost, L. Osteosarcoma: ESMO Clinical Recommendations for Diagnosis, Treatment and Follow-Up. Ann. Oncol. 2008, 19, ii94–ii96. [Google Scholar] [CrossRef]
  2. Sadykova, L.R.; Ntekim, A.I.; Muyangwa-Semenova, M.; Rutland, C.S.; Jeyapalan, J.N.; Blatt, N.; Rizvanov, A.A. Epidemiology and Risk Factors of Osteosarcoma. Cancer Investig. 2020, 38, 259–269. [Google Scholar] [CrossRef] [PubMed]
  3. Eaton, B.R.; Schwarz, R.; Vatner, R.; Yeh, B.; Claude, L.; Indelicato, D.J.; Laack, N. Osteosarcoma. Pediatr. Blood Cancer 2021, 68, e28352. [Google Scholar] [CrossRef] [PubMed]
  4. Huang, X.; Zhao, J.; Bai, J.; Shen, H.; Zhang, B.; Deng, L.; Sun, C.; Liu, Y.; Zhang, J.; Zheng, J. Risk and Clinicopathological Features of Osteosarcoma Metastasis to the Lung: A Population-Based Study. J. Bone Oncol. 2019, 16, 100230. [Google Scholar] [CrossRef] [PubMed]
  5. Adler, C.-P. Knochenkrankheiten; Springer: Berlin/Heidelberg, Germany, 2005; ISBN 978-3-540-21962-0. [Google Scholar]
  6. Guder, W.K.; Hartmann, W.; Trautmann, M.; Hardes, J.; Wardelmann, E.; Balke, M.; Streitbürger, A. Analysis of Drug Sensitivity of Human High-Grade Osteosarcoma in a Chick Chorioallantoic Membrane (CAM) Model: A Proof of Principle Study. BMC Res. Notes 2020, 13, 432. [Google Scholar] [CrossRef] [PubMed]
  7. Kunz, P.; Schenker, A.; Sähr, H.; Lehner, B.; Fellenberg, J. Optimization of the Chicken Chorioallantoic Membrane Assay as Reliable in Vivo Model for the Analysis of Osteosarcoma. PLoS ONE 2019, 14, e0215312. [Google Scholar] [CrossRef] [PubMed]
  8. Heymann, M.-F.; Brown, H.K.; Heymann, D. Drugs in Early Clinical Development for the Treatment of Osteosarcoma. Expert Opin. Investig. Drugs 2016, 25, 1265–1280. [Google Scholar] [CrossRef] [PubMed]
  9. Ferguson, J.L.; Turner, S.P. Bone Cancer: Diagnosis and Treatment Principles. Am. Fam. Physician 2018, 98, 205–213. [Google Scholar]
  10. Tsai, H.-C.; Cheng, S.-P.; Han, C.-K.; Huang, Y.-L.; Wang, S.-W.; Lee, J.-J.; Lai, C.-T.; Fong, Y.-C.; Tang, C.-H. Resistin Enhances Angiogenesis in Osteosarcoma via the MAPK Signaling Pathway. Aging 2019, 11, 9767–9777. [Google Scholar] [CrossRef]
  11. Xie, L.; Ji, T.; Guo, W. Anti-Angiogenesis Target Therapy for Advanced Osteosarcoma (Review). Oncol. Rep. 2017, 38, 625–636. [Google Scholar] [CrossRef]
  12. Carrle, D.; Bielack, S.S. Current Strategies of Chemotherapy in Osteosarcoma. Int. Orthop. 2006, 30, 445–451. [Google Scholar] [CrossRef]
  13. Bichlmayer, E.-M.; Mahl, L.; Hesse, L.; Pion, E.; Haller, V.; Moehwald, A.; Hackl, C.; Werner, J.M.; Schlitt, H.J.; Schwarz, S.; et al. A 3D In Vivo Model for Studying Human Renal Cystic Tissue and Mouse Kidney Slices. Cells 2022, 11, 2269. [Google Scholar] [CrossRef]
  14. Feder, A.-L.; Pion, E.; Troebs, J.; Lenze, U.; Prantl, L.; Htwe, M.M.; Phyo, A.; Haerteis, S.; Aung, T. Extended Analysis of Intratumoral Heterogeneity of Primary Osteosarcoma Tissue Using 3D-in-Vivo-Tumor-Model. Clin. Hemorheol. Microcirc. 2020, 76, 133–141. [Google Scholar] [CrossRef]
  15. Ettner-Sitter, A.; Montagner, A.; Kuenzel, J.; Brackmann, K.; Schäfer, M.; Schober, R.; Weber, F.; Aung, T.; Hackl, C.; Haerteis, S. Visualization of Vascular Perfusion of Human Pancreatic Cancer Tissue in the CAM Model and Its Impact on Future Personalized Drug Testing. Organoids 2024, 3, 1–17. [Google Scholar] [CrossRef]
  16. Spanel-Borowski, K. The Chick Chorioallantoic Membrane as Test System for Biocompatible Materials. Res. Exp. Med. 1989, 189, 69–75. [Google Scholar] [CrossRef] [PubMed]
  17. Ribatti, D.; Annese, T.; Tamma, R. The Use of the Chick Embryo CAM Assay in the Study of Angiogenic Activiy of Biomaterials. Microvasc. Res. 2020, 131, 104026. [Google Scholar] [CrossRef] [PubMed]
  18. Wörsdörfer, P.; Dalda, N.; Kern, A.; Krüger, S.; Wagner, N.; Kwok, C.K.; Henke, E.; Ergün, S. Generation of Complex Human Organoid Models Including Vascular Networks by Incorporation of Mesodermal Progenitor Cells. Sci. Rep. 2019, 9, 15663. [Google Scholar] [CrossRef]
  19. Garreta, E.; Prado, P.; Tarantino, C.; Oria, R.; Fanlo, L.; Martí, E.; Zalvidea, D.; Trepat, X.; Roca-Cusachs, P.; Gavaldà-Navarro, A.; et al. Fine Tuning the Extracellular Environment Accelerates the Derivation of Kidney Organoids from Human Pluripotent Stem Cells. Nat. Mater. 2019, 18, 397–405. [Google Scholar] [CrossRef] [PubMed]
  20. Varzideh, F.; Pahlavan, S.; Ansari, H.; Halvaei, M.; Kostin, S.; Feiz, M.-S.; Latifi, H.; Aghdami, N.; Braun, T.; Baharvand, H. Human Cardiomyocytes Undergo Enhanced Maturation in Embryonic Stem Cell-Derived Organoid Transplants. Biomaterials 2019, 192, 537–550. [Google Scholar] [CrossRef]
  21. Ribatti, D. Two New Applications in the Study of Angiogenesis the CAM Assay: Acellular Scaffolds and Organoids. Microvasc. Res. 2022, 140, 104304. [Google Scholar] [CrossRef]
  22. Venusova, E.; Kolesarova, A.; Horky, P.; Slama, P. Physiological and Immune Functions of Punicalagin. Nutrients 2021, 13, 2150. [Google Scholar] [CrossRef]
  23. Huang, T.; Zhang, X.; Wang, H. Punicalagin Inhibited Proliferation, Invasion and Angiogenesis of Osteosarcoma through Suppression of NF-κB Signaling. Mol. Med. Rep. 2020, 22, 2386–2394. [Google Scholar] [CrossRef]
  24. Ceci, C.; Tentori, L.; Atzori, M.G.; Lacal, P.M.; Bonanno, E.; Scimeca, M.; Cicconi, R.; Mattei, M.; de Martino, M.G.; Vespasiani, G.; et al. Ellagic Acid Inhibits Bladder Cancer Invasiveness and In Vivo Tumor Growth. Nutrients 2016, 8, 744. [Google Scholar] [CrossRef]
  25. Pion, E.; Asam, C.; Feder, A.-L.; Felthaus, O.; Heidekrueger, P.I.; Prantl, L.; Haerteis, S.; Aung, T. Laser Speckle Contrast Analysis (LASCA) Technology for the Semiquantitative Measurement of Angiogenesis in in-Ovo-Tumor-Model. Microvasc. Res. 2021, 133, 104072. [Google Scholar] [CrossRef]
  26. Pion, E.; Haerteis, S.; Aung, T. Application of Laser Speckle Contrast Imaging (LSCI) for the Angiogenesis Measurement of Tumors in the Chorioallantoic Membrane (CAM) Model. In Tumor Angiogenesis Assays: Methods and Protocols; Ribatti, D., Ed.; Methods in Molecular Biology; Springer: New York, NY, USA, 2023; pp. 141–153. ISBN 978-1-07-162703-7. [Google Scholar]
  27. Kuri, P.M.; Pion, E.; Mahl, L.; Kainz, P.; Schwarz, S.; Brochhausen, C.; Aung, T.; Haerteis, S. Deep Learning-Based Image Analysis for the Quantification of Tumor-Induced Angiogenesis in the 3D In Vivo Tumor Model—Establishment and Addition to Laser Speckle Contrast Imaging (LSCI). Cells 2022, 11, 2321. [Google Scholar] [CrossRef] [PubMed]
  28. Rovithi, M.; Avan, A.; Funel, N.; Leon, L.G.; Gomez, V.E.; Wurdinger, T.; Griffioen, A.W.; Verheul, H.M.W.; Giovannetti, E. Development of Bioluminescent Chick Chorioallantoic Membrane (CAM) Models for Primary Pancreatic Cancer Cells: A Platform for Drug Testing. Sci. Rep. 2017, 7, 44686. [Google Scholar] [CrossRef]
  29. Balke, M.; Neumann, A.; Kersting, C.; Agelopoulos, K.; Gebert, C.; Gosheger, G.; Buerger, H.; Hagedorn, M. Morphologic Characterization of Osteosarcoma Growth on the Chick Chorioallantoic Membrane. BMC Res. Notes 2010, 3, 58. [Google Scholar] [CrossRef] [PubMed]
  30. Lokman, N.A.; Elder, A.S.F.; Ricciardelli, C.; Oehler, M.K. Chick Chorioallantoic Membrane (CAM) Assay as an In Vivo Model to Study the Effect of Newly Identified Molecules on Ovarian Cancer Invasion and Metastasis. Int. J. Mol. Sci. 2012, 13, 9959–9970. [Google Scholar] [CrossRef] [PubMed]
  31. Vu, B.T.; Shahin, S.A.; Croissant, J.; Fatieiev, Y.; Matsumoto, K.; Le-Hoang Doan, T.; Yik, T.; Simargi, S.; Conteras, A.; Ratliff, L.; et al. Chick Chorioallantoic Membrane Assay as an in Vivo Model to Study the Effect of Nanoparticle-Based Anticancer Drugs in Ovarian Cancer. Sci. Rep. 2018, 8, 8524. [Google Scholar] [CrossRef] [PubMed]
  32. Tamanoi, F. Recent Excitements in the Study of the CAM Assay. In The Enzymes; Academic Press: Cambridge, MA, USA, 2019; Volume 46, pp. 1–9. [Google Scholar] [CrossRef]
  33. Schneider-Stock, R.; Ribatti, D. The CAM Assay as an Alternative In Vivo Model for Drug Testing. Handb. Exp. Pharmacol. 2021, 265, 303–323. [Google Scholar] [CrossRef] [PubMed]
  34. Sato, T.; Vries, R.G.; Snippert, H.J.; van de Wetering, M.; Barker, N.; Stange, D.E.; van Es, J.H.; Abo, A.; Kujala, P.; Peters, P.J.; et al. Single Lgr5 Stem Cells Build Crypt-Villus Structures In Vitro without a Mesenchymal Niche. Nature 2009, 459, 262–265. [Google Scholar] [CrossRef] [PubMed]
  35. Pellegrini, L.; Bonfio, C.; Chadwick, J.; Begum, F.; Skehel, M.; Lancaster, M.A. Human CNS Barrier-Forming Organoids with Cerebrospinal Fluid Production. Science 2020, 369, eaaz5626. [Google Scholar] [CrossRef] [PubMed]
  36. Eiraku, M.; Takata, N.; Ishibashi, H.; Kawada, M.; Sakakura, E.; Okuda, S.; Sekiguchi, K.; Adachi, T.; Sasai, Y. Self-Organizing Optic-Cup Morphogenesis in Three-Dimensional Culture. Nature 2011, 472, 51–56. [Google Scholar] [CrossRef] [PubMed]
  37. Nowak-Sliwinska, P.; Alitalo, K.; Allen, E.; Anisimov, A.; Aplin, A.C.; Auerbach, R.; Augustin, H.G.; Bates, D.O.; van Beijnum, J.R.; Bender, R.H.F.; et al. Consensus Guidelines for the Use and Interpretation of Angiogenesis Assays. Angiogenesis 2018, 21, 425–532. [Google Scholar] [CrossRef] [PubMed]
  38. Wang, X.Z.; Zhang, S.F.; Yang, Z.H.; Ye, Z.W.; Liu, J. Punicalagin Suppresses Osteosarcoma Growth and Metastasis by Regulating NF-κB Signaling. J. Biol. Regul. Homeost. Agents 2020, 34, 1699–1708. [Google Scholar] [CrossRef] [PubMed]
  39. Klemm, F.; Joyce, J.A. Microenvironmental Regulation of Therapeutic Response in Cancer. Trends Cell Biol. 2015, 25, 198–213. [Google Scholar] [CrossRef] [PubMed]
  40. Corre, I.; Verrecchia, F.; Crenn, V.; Redini, F.; Trichet, V. The Osteosarcoma Microenvironment: A Complex but Targetable Ecosystem. Cells 2020, 9, 976. [Google Scholar] [CrossRef]
  41. Lowery, C.D.; Blosser, W.; Dowless, M.; Renschler, M.; Perez, L.V.; Stephens, J.; Pytowski, B.; Wasserstrom, H.; Stancato, L.F.; Falcon, B. Anti-VEGFR2 Therapy Delays Growth of Preclinical Pediatric Tumor Models and Enhances Anti-Tumor Activity of Chemotherapy. Oncotarget 2019, 10, 5523–5533. [Google Scholar] [CrossRef]
  42. Xie, X.; Hu, L.; Liu, L.; Wang, J.; Liu, Y.; Ma, L.; Sun, G.; Li, C.; Aisa, H.A.; Meng, S. Punicalagin Promotes Autophagic Degradation of Human Papillomavirus E6 and E7 Proteins in Cervical Cancer through the ROS-JNK-BCL2 Pathway. Transl. Oncol. 2022, 19, 101388. [Google Scholar] [CrossRef]
Figure 1. Viability of SaOs-2 and MG-63 cells after exposure to different concentrations of punicalagin (≤100 µM) measured in an MTT assay after 24 h (A,D), 48 h (B,E), and 72 h (C,F).
Organoids 03 00004 g001
Figure 2. Weight of SaOs-2 (A) and MG-63 (B) cell line tumors and osteosarcoma primary tissue (CE) after explantation. Absolute weight (C) and absolute weight differences (D) of one representative patient’s tissue before engraftment (pre) and after explantation (post). (EI) Relative weight differences of the tissue from all four patients represented in different colors. Tissue weight changes of 51.38% ± 24.63% (CRTL) and 1.01% ± 16.71% (PUN) for green (E), 0.80% ± 14.22% (CTRL) and −22.54% ± 8.09% (PUN) for blue (F), 21.42% ± 21.92% (CTRL) and −8.10% ± 12.02% (PUN) for orange (G), and 6.70% ± 6.03% (CTRL) and 6.71% ± 13.83% (PUN) for purple (H). Data were analyzed using Welch’s t-test (* p < 0.05).
Organoids 03 00004 g002
Figure 3. Representative LSCI perfusion images of CAMs engrafted with SaOs-2 cell line tumors (*). Perfusion in the area around the untreated (A,B) and treated (D,E) cell line tumors before (d1) and after treatment (d5). Blue indicates low perfusion and red high perfusion. (C) LSCI-based perfusion measurements of all CAMs engrafted with SaOs-2 cell line tumors after applying a perfusion filter of 300–3000 PU. Relative changes in perfusion from day 1 (before treatment) to day 5 (directly before explantation). Data was normalized to the baseline angiogenesis, with 100% for the mean of the baseline group and 0 for −100% in all experiments. Accordingly, representative LSCI perfusion images and LSCI-based perfusion measurements for CAMs engrafted with MG-63 cell line tumors (*) (F) and CAMs engrafted with osteosarcoma tumors (*) from one representative patient (GK).
Organoids 03 00004 g003
Figure 4. Vessel length (AF) and branching point (GL) measurements of CAMs engrafted with SaOs-2 cell line tumors and osteosarcoma primary tissue, detected with the IKOSA CAM assay application. Measurements took place before the start of the treatment and 5 days afterwards, directly before explantation. Total vessel length of non-engrafted CAMs (A), CAMs engrafted with SaOs-2 cell line tumors (C), and patient tissue from one representative patient (E). Relative changes in vessel length from day 1 (before treatment) to day 5 (before explantation) for non-engrafted CAMs (B), CAMs engrafted with SaOs-2 cell line tumors (D), and tissue from one representative patient (F). Number of branching points per area, comparing day 5 to day 1, for non-engrafted CAMs (G), CAMs engrafted with SaOs-2 cell line tumors (I), and patient tissue from one representative patient (K). Relative changes in the number of branching points per area from day 1 to day 5 for non-engrafted CAMs (H). CAMs engrafted with SaOs-2 cell line tumors (J) and patient tissue from one representative patient (L). All datasets were analyzed using Welch’s t-test, with a significance level set at p < 0.05. The changes in vessel length of non-engrafted CAMs (B) were significant (*).
Organoids 03 00004 g004aOrganoids 03 00004 g004b
Figure 5. HE, Ki-67, and Caspase-3 staining of two representative CAMs engrafted with MG-63 cell line tumors from the control group (above) and the group treated with punicalagin (below). Fivefold (5), tenfold (10), and twentyfold (20) magnifications are shown, respectively.
Organoids 03 00004 g005
Figure 6. HE, Ki-67, and Caspase-3 staining of two representative CAMs engrafted with primary tissue from one representative patient with the control group (above) and the punicalagin-treated group (below). Fivefold (5), tenfold (10), and twentyfold (20) magnifications are shown, respectively.
Organoids 03 00004 g006
Disclaimer/Publisher’s Note: The statements, opinions and data contained in all publications are solely those of the individual author(s) and contributor(s) and not of MDPI and/or the editor(s). MDPI and/or the editor(s) disclaim responsibility for any injury to people or property resulting from any ideas, methods, instructions or products referred to in the content.

