Article

Contraindicated Drug Responses in Dravet Syndrome Brain Organoids Utilizing Micro Electrode Array Assessment Methods

Department of Electronics, Graduate School of Engineering, Tohoku Institute of Technology, 35-1 Yagiyama Kasumicho, Taihaku-ku, Sendai 982-8577, Japan
*
Author to whom correspondence should be addressed.
Organoids 2023, 2(4), 177-191; https://doi.org/10.3390/organoids2040014
Submission received: 6 September 2023 / Revised: 6 October 2023 / Accepted: 23 October 2023 / Published: 26 October 2023

Abstract

:
Ensuring drug safety for patients with specific neurological disorders is of paramount importance. For instance, certain antiepileptic drugs (AEDs) are contraindicated in Dravet Syndrome (DS), which is characterized by a deficiency in Na+ channel function. Constructing in vitro assessment methods capable of detecting contraindicated drug responses and medication effects on neurons derived from DS patients is highly anticipated for drug safety assessment and therapeutic innovation. This study used micro electrode array (MEA) measurements with low-frequency analysis on human iPSC-derived DS organoids to investigate AED responses. When exposed to the contraindicated drugs carbamazepine and phenytoin, the number of network oscillations increased in DS organoids while maintaining oscillation intensity. Furthermore, carbamazepine administration appeared to enhance activities beyond oscillations which is partially consistent with findings in the DS mouse model. Conversely, treatment with the therapeutic drug sodium valproate resulted in a similar decrease in activity both in healthy and DS organoids. The frequency characteristics of spontaneous firings and AEDs responsiveness in DS organoids demonstrated partial correlation with typical electroencephalography patterns observed in vivo. In conclusion, this study, employing MEA measurements with low-frequency analysis, revealed contraindicated drug responses and disease-specific functional characteristics in DS organoids, effective for DS patient safety assessment, precision medicine, and antiepileptic drug screening.

1. Introduction

In the field of drug discovery, it is imperative to evaluate the safety of candidate drugs for patients with specific neurological disorders. While these drugs may demonstrate no toxicity in healthy individuals, certain drugs have been identified as contraindicated for patients with corresponding disorders. For instance, in Dravet Syndrome, where Na+ channel deficiencies are known, the administration of drugs affecting Na+ channels is deemed contraindicated. In the sphere of safety pharmacology, there exists a demand for the development of assessment systems capable of detecting such disease-specific drug responses.
The advancement of human induced pluripotent stem cells (iPSCs) technology has facilitated the generation of iPSCs derived from individuals with various diseases [1]. In the neurological field, iPSCs derived from patients with intractable epilepsy such as Dravet Syndrome, Rett Syndrome, and Angelman Syndrome have been generated [2,3,4,5,6,7]. Leveraging these disease-specific iPSCs for the differentiation into neural cells holds immense potential for unraveling underlying disease mechanisms and crafting specific in vitro assessment platforms using human-derived models. Of these methods, the human iPSC-derived brain organoid technique offers the distinct ability to self-assemble into three-dimensional structures closely emulating disease-specific tissues, thus it has become a promising avenue for in vitro toxicity evaluations due to its heightened physiological relevance [8,9,10]. At present, brain organoid research encompasses an array of evaluations including scrutinizing morphological attributes and analyzing gene expression within the organoids themselves [11,12,13,14,15,16,17,18,19], in addition to performing assessments of electrical activities employing techniques like patch clamp [16,18,20,21,22,23,24], calcium imaging [24,25,26], and planar micro electrode arrays (MEA) [26,27,28,29,30,31,32,33,34,35,36,37,38,39]. Our prior work has been dedicated to the establishment of the MEA measurement methodology for cerebral cortex organoids. The increased activity caused by the seizure-inducing compound pentylenetetrazole was confirmed. In addition to the spike component analysis traditionally analyzed with MEA measurements, we also revealed that the electrical activity characteristics of organoids appear in low frequency components below 500 Hz [40].
Dravet Syndrome (DS) is a developmental epileptic encephalopathy recognized by its intractable seizures and cognitive deficiencies. About 70% of DS patients showcase mutations in the SCN1A gene, which encodes the Nav1.1 sodium channel [41]. Nav1.1 is primarily present in inhibitory interneurons, where its malfunction leads to diminished inhibitory input and heightened susceptibility to seizures [42,43]. The involvement of Nav1.1 raises concerns regarding compounds like phenytoin, carbamazepine, and lamotrigine that obstruct sodium channels, as they might potentially exacerbate seizures and, hence, are contraindicated. Electroencephalography (EEG) analyses have unveiled variance in frequency attributes linked to the maturity of mouse models, along with the discernment of frequency characteristics during heat-triggered seizures. For instance, in DS mouse models, the spontaneous activity’s frequency traits during infancy, prior to seizure initiation, do not notably differ from those in healthy mouse. Throughout the phase of severe seizures, a reduction in power within the theta and alpha frequency bands has been documented [44]. Moreover, during seizures, EEG patterns in rat models reveal an elevation in delta and theta wave power [45], whereas, in mouse models, amplified power in the alpha and beta frequency bands is observed [46].
Recently, the generation of iPSCs from individuals with DS has become prevalent, enabling functional electrophysiological assessments of neurons derived from disease-specific iPSCs [2,3,47,48,49,50,51,52]. Utilizing patch clamp techniques, these assessments have unveiled diminished Na+ currents and spontaneous activity in inhibitory neurons within the forebrain, alongside escalated activation of Na+ channels and the ensuing activity in glutamatergic neurons [50]. Furthermore, investigations involving iPSCs derived from patients have divulged that the level of hyperexcitability in excitatory neurons is more pronounced in DS patients compared to those with mild febrile seizures, mirroring the clinical severity [3]. Moreover, dorsomedial forebrain organoids developed from the iPSCs of DS patients have exhibited alterations in gene expression profiles [53]. In contrast to organoids derived from healthy individuals, these organoids manifest heightened expression levels of GAD67 and ABAT, both linked to GABA function. This aberrant gene expression pattern has been noted to correlate with the severity of the patient’s condition.
If the response to contraindicated drugs can be detected using electrical activity as an indicator in DS brain organoids, it could lead to applications in safety testing of drug candidate compounds for DS patients and the selection of optimal compounds for precision medicine based on the disease and patient characteristics. Therefore, in this study, we generated cerebral cortex organoids from iPSCs derived from DS patients and investigated the response to contraindicated drugs and waveform frequency characteristics utilizing an MEA assessment method.

2. Materials and Methods

2.1. DS Patient-Derived and Healthy Control Brain Organoids

Healthy human iPSCs (201B7) obtained from the RIKEN Institute and DS patient-derived human iPSCs (HPS2834) were cultured in 6-well dishes using StemFit (AK02N, Ajinomoto, Tokyo, Japan) medium. Once the cells reached confluence, they were collected using Gentle Cell Dissociation Reagent (ST-07174, STEMCELL Technologies, Vancouver, BC, Canada). The collected cells were centrifuged at 800 rpm for 5 min at room temperature. After removing the supernatant, 1 mL of EB seeding medium (EB formation medium with an added 10 µM Y-27632) was added, and the cell pellet was resuspended. iPSCs were seeded at a density of 9.0 × 10³ cells/well using the EB seeding medium. On the 2nd and 4th days of culture, 100 µL of EB formation medium [STEMdiff Cerebral Organoid Basal Medium 1 (08572) with the added STEMdiff Cerebral Organoid Supplement A (08574)] was added to each well. On the 5th day, organoids were observed, and spherical samples were selected. The selected samples were transferred from the EB formation medium to induction medium [STEMdiff Cerebral Organoid Basal Medium 1 with the added STEMdiff Cerebral Organoid Supplement B (08575)] and incubated for 2 days. On the 7th day of culture, the organoids were embedded in Matrigel (354277, Corning, Corning, NY, USA) and incubated for 3 days in expansion medium [STEMdiff Cerebral Organoid Basal Medium 2 (08573) with the added STEMdiff Cerebral Organoid Supplement C (08576) and STEMdiff Cerebral Organoid Supplement D (08577)]. Subsequently, the expansion medium was replaced with maturation medium [STEMdiff Cerebral Organoid Basal Medium 2 with the added TEMdiff Cerebral Organoid Supplement E (08578)], and the organoids were cultured on an orbital shaker (COSH6, AS ONE Corporation, Osaka, Japan). The organoids were cultured in maturation medium for 3 months, with medium exchanges every 3 to 4 days. In addition, BrainPhys (05790, STEMCELL Technologies, Vancouver, BC, Canada) medium containing SM 1 neural supplement (05711, STEMCELL Technologies, Vancouver, BC, Canada) was used after month 3 and thereafter. The formation of organoids utilized the STEMdiff Cerebral Organoid Kit (ST-08570, STEMCELL Technologies, Vancouver, BC, Canada) medium.

2.2. Immunostaining

Cerebral organoids were fixed with 4% paraformaldehyde in PBS. The samples were embedded in an Optimal Cutting Temperature Compound (45833, Sakura Finetek Japan, Tokyo, Japan) and sectioned at a thickness of 10 μm using Leica CM 1950 Cryostat. Organoid sections were permeabilized and blocked with blocking solution (0.05% Triton X-100 and 5% goat serum in PBS). Primary antibodies in the blocking solution were then added and incubated at 4 °C overnight, followed by washing and incubation with secondary antibodies. The following antibodies were used: primary antibodies: mouse anti-β-tubulin III antibody (60052, STEMCELL Technologies, Vancouver, BC, Canada) and rat anti-ctip2 antibody (ab18465, Abcam, Cambridge, UK); and secondary antibodies: donkey anti-rat (ab150155, Abcam, Cambridge, UK) and donkey anti-mouse (A10036, Invitrogen, Waltham, MA USA).

2.3. MEA Measurements

Cerebral cortex organoids cultured for 5–6 months were mounted on a 24-well planner MEA chip. After allowing the organoids to settle on the MEA for 10 min, spontaneous activity was measured. The measurements were performed using a Presto 24-well MEA system (Alpha Med Scientific Inc., Osaka, Japan) at 37 °C and 5% CO2, with a sampling rate of 20 kHz/channel.

2.4. Pharmacological Testing

To investigate the response of brain organoids derived from patients with DS to contraindicated drugs, namely carbamazepine (CBZ; 034-23701, Wako, Osaka, Japan) and phenytoin (PHT; PHR-1139-1G, Sigma-Aldrich, Burlington, MA, USA), as well as the therapeutic sodium valproate (VPA; 197-09722, Wako, Osaka, Japan), these compounds were administered to brain organoids that had been cultured for 5–6 months. Spontaneous activity was measured for 30 min for each dosage of the respective compounds. Each experiment was conducted as follows: CBZ; Control: n = 4, DS: n = 6, PHT; Control: n = 4, DS: n = 5, VPA; Control: n = 5, DS: n = 6.

2.5. Measurement of DS Brain Organoid Using CMOS-MEA

We introduced the Field Potential Imaging (FPI) method utilizing a CMOS-MEA featuring electrode with dimensions of 11.22 μm × 11.22 μm (126 μm2), encompassing 236,880 electrodes, and covering a measurable area of 32.8 mm2 [54]. DS brain organoids, cultivated for 7 months, were affixed onto the CMOS-MEA system (Sony Semiconductor Solutions, Kanagawa, Japan). Under controlled conditions of 5% CO2 and 37 °C, we conducted CBZ administration tests (n = 1). Electrical activity was recorded for 3 min at each dosage. The electrical signals were captured at a sampling rate of 5 kHz and subsequently offset corrected by employing the least squares method every 500 samples. Voltage waveforms were employed to generate potential maps, and oscillation periods were visually identified. Electrodes exhibiting amplitudes of 100 μV or higher during oscillations were designated as active electrodes. The average waveform of active electrodes during oscillation was employed as the representative oscillation waveform, and electrodes displaying a cosine similarity exceeding 0.25 with individual electrode waveforms were classified as oscillation electrodes. The cosine similarity was calculated using the subsequent formula.
cosine   sinilarity = i = 1 N ( A i × B i ) i = 1 N A i 2 × i = 1 N B i 2
In this context, A denotes the average waveform of active electrodes, B stands for the waveform of an individual electrode, and N signifies the count of samples in the extracted oscillation waveform.

2.6. Detection of Oscillations

Moving-average waveforms were derived from the unprocessed voltage waveforms acquired from the brain organoids. Using a threshold established upon the moving average waveform, intervals surpassing this threshold were identified as oscillation. Furthermore, the highest value within these oscillation intervals was identified as the maximum voltage (Max. voltage).

2.7. Waveform Potential Analysis

Using the 30 min electrical activity waveforms collected, oscillations were identified at 5 min intervals. The identified oscillation waveforms underwent zero-phase filtering through an FIR band-pass filter and were subsequently segmented into distinct frequency bands. Potentials were computed for each frequency band based on the segmented waveforms. The analyzed frequency bands encompass delta (0.5–3 Hz), theta (4–7 Hz), alpha (8–11 Hz), beta (12–29 Hz), gamma (30–100 Hz), and high-gamma (100–150 Hz).

2.8. Statistical Analysis

All statistical analyses were carried out employing the one-way ANOVA method, followed by the Holm–Bonferroni correction. Regarding the pharmacological testing data, multiple comparisons were executed between the vehicle group and various dosage groups within both the control and DS groups. In the case of the spontaneous activity data, comparisons were conducted between the control group and the DS group for each individual frequency band.

3. Results

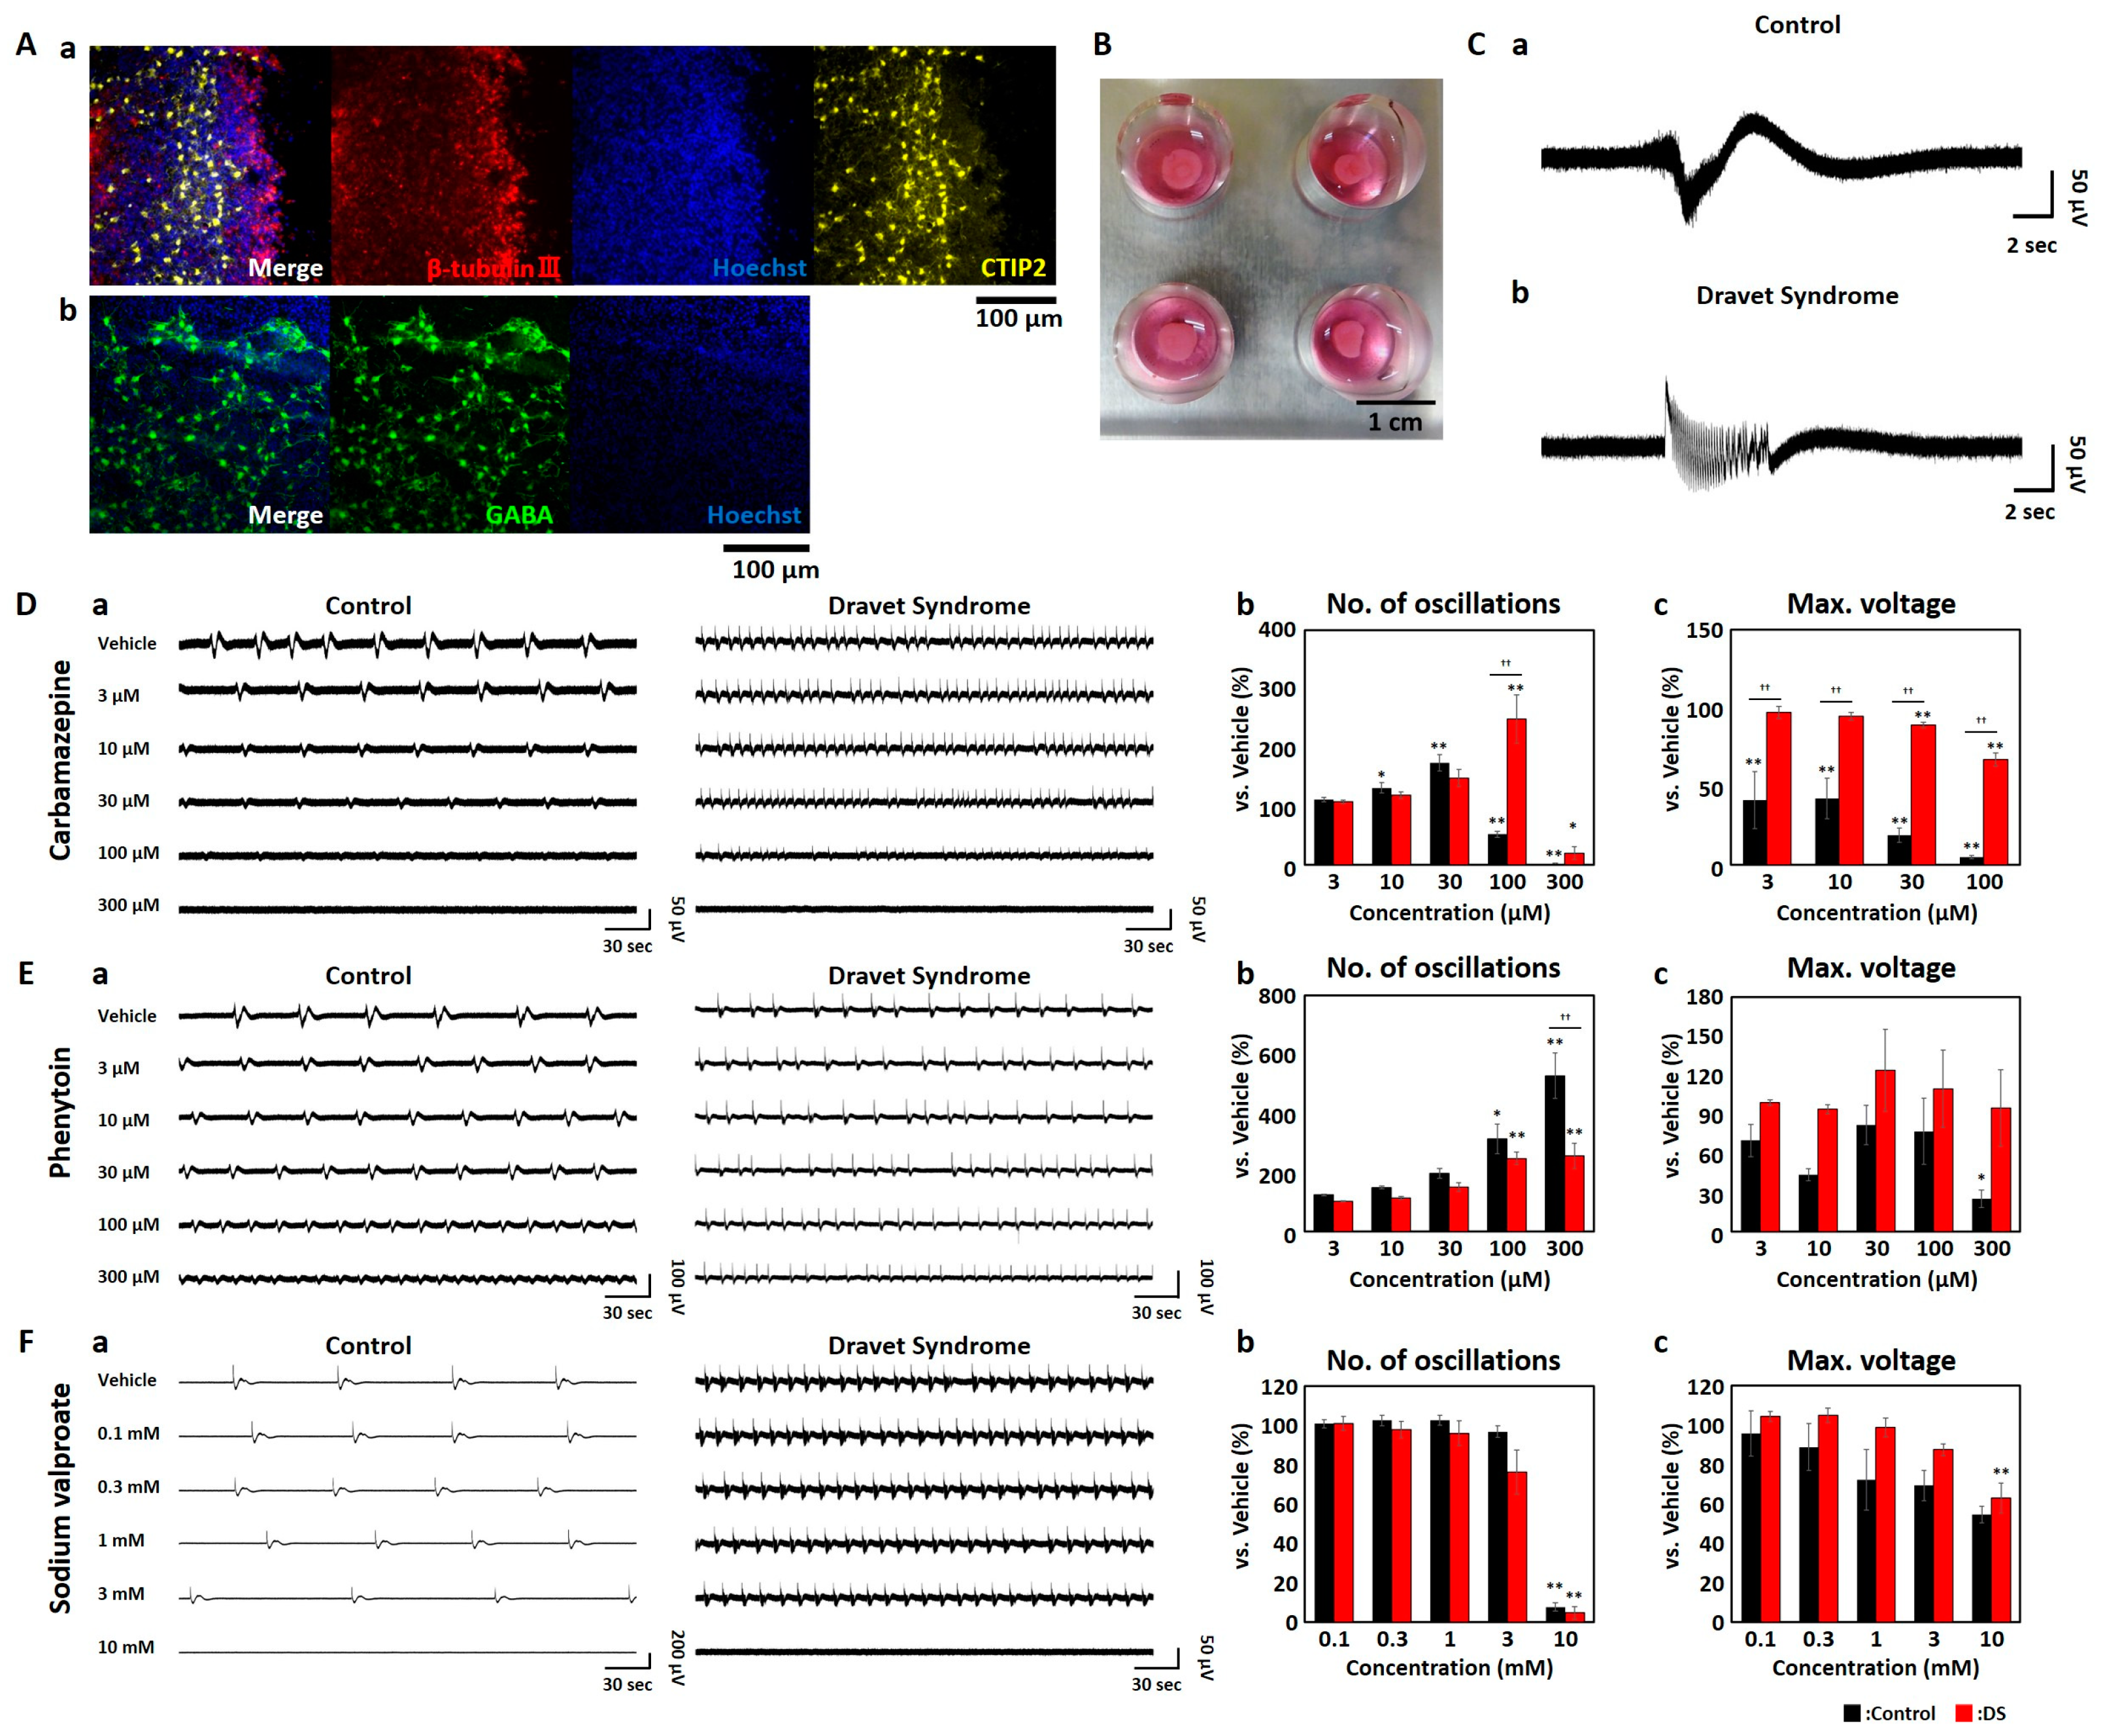
3.1. MEA Measurments of Cerebral Brain Organoids Derived from iPSCs of DS Patients

We produced cerebral organoids derived from human iPSCs and investigated neuronal differentiation characteristics using immunocytochemistry [Figure 1(Aa)]. Sliced samples were dyed using Hoechst 33258 as a cell nuclear marker, β-tubulin III as a neuronal marker, and CTIP2 as a cortical marker. Immunocytochemistry showed that β-tubulin III and CTIP2 were expressed in organoids. These results suggested that the produced organoids contain the basic components in a developing human cerebral cortex in vitro model. Furthermore, to investigate the presence of DS-specific neurons, sliced samples were dyed using GABA as a GABAergic neuron marker [Figure 1(Ab)]. Expression of GABA was confirmed through immunocytochemistry, thereby suggested the contain the GABAergic neurons in the produced DS organoids.
At 5–6 months, the cerebral organoids were mounted on a 24-well planner MEA chip without placing weights and measured for electrical activity (Figure 1B). Figure 1C shows typical oscillation waveforms for the control and DS organoids. We performed the analysis by selecting the electrode with the highest amplitude for each well from the waveform of spontaneous activity acquired with 16 electrodes/well.

3.2. Contraindicated Drug Responses in DS Brain Organoids

To assess the response of DS brain organoids to contraindicated drugs, specifically CBZ and PHT, as well as the therapeutic VPA, we conducted dosing experiments. The analysis involved assessing the number of oscillations and the maximum voltage (Max. voltage) during oscillatory periods for each compound (Figure 1D–F). Since the electrical signals recorded through MEA reflect the combined activities of multiple neurons, the Max. voltage acts as an indicator of the intensity of the oscillatory activity.
In the context of CBZ, a dose-dependent increase in the number of oscillations was observed in both the control and DS groups up to 30 μM. However, at 100 μM, a substantial reduction in frequency was evident in the control, reaching 51.2% ± 5.31% (p < 0.01, determined using the one-way ANOVA and Holm–Bonferroni methods). Conversely, in the DS samples, a significant elevation to 248 ± 41.2% (p < 0.01) was noted, highlighting a pronounced divergence in response between the control and DS groups [Figure 1(Db)]. The Max. voltage demonstrated a notable decrease in the control samples, ranging from 3 μM to 41.1 ± 18.2% (p < 0.01). However, within the DS samples, the reduction was moderate, only reaching 67.1 ± 4.27% even at 100 μM [Figure 1(Dc)]. Notably, a significant discrepancy in Max. voltage between the control and DS groups was observed, starting at 3 μM (p < 0.01). In the context of DS, while the frequency increased, the oscillation amplitude was maintained.
Upon PHT administration, both the control and DS groups exhibited a dose-dependent escalation in the number of oscillations. Nonetheless, a notable discrepancy in response between the control and DS groups emerged at 300 μM [p < 0.01, Figure 1(Eb)]. Notably, a significant reduction in Max. voltage was exclusively observed in the control samples at 300 μM [p < 0.05, Figure 1(Ec)]. Analogous to CBZ administration, DS retained oscillation intensity, while frequency exhibited an increase.
For the therapeutic VPA, the number of oscillations significantly decreased at 10 mM in control samples to 7.64 ± 2.12% (p < 0.01) and in DS samples to 4.69 ± 3.31% (p < 0.01) [Figure 1(Fb)]. Max. voltage decreased in a dose-dependent manner in both the control and DS samples [Figure 1(Fc)]. During VPA administration, there was no significant difference in response between the control and DS groups. However, DS brain organoids administered with the contraindicated drugs CBZ and PHT exhibited a response similar to other contraindicated drugs, with an increase in oscillation frequency while maintaining oscillation intensity.

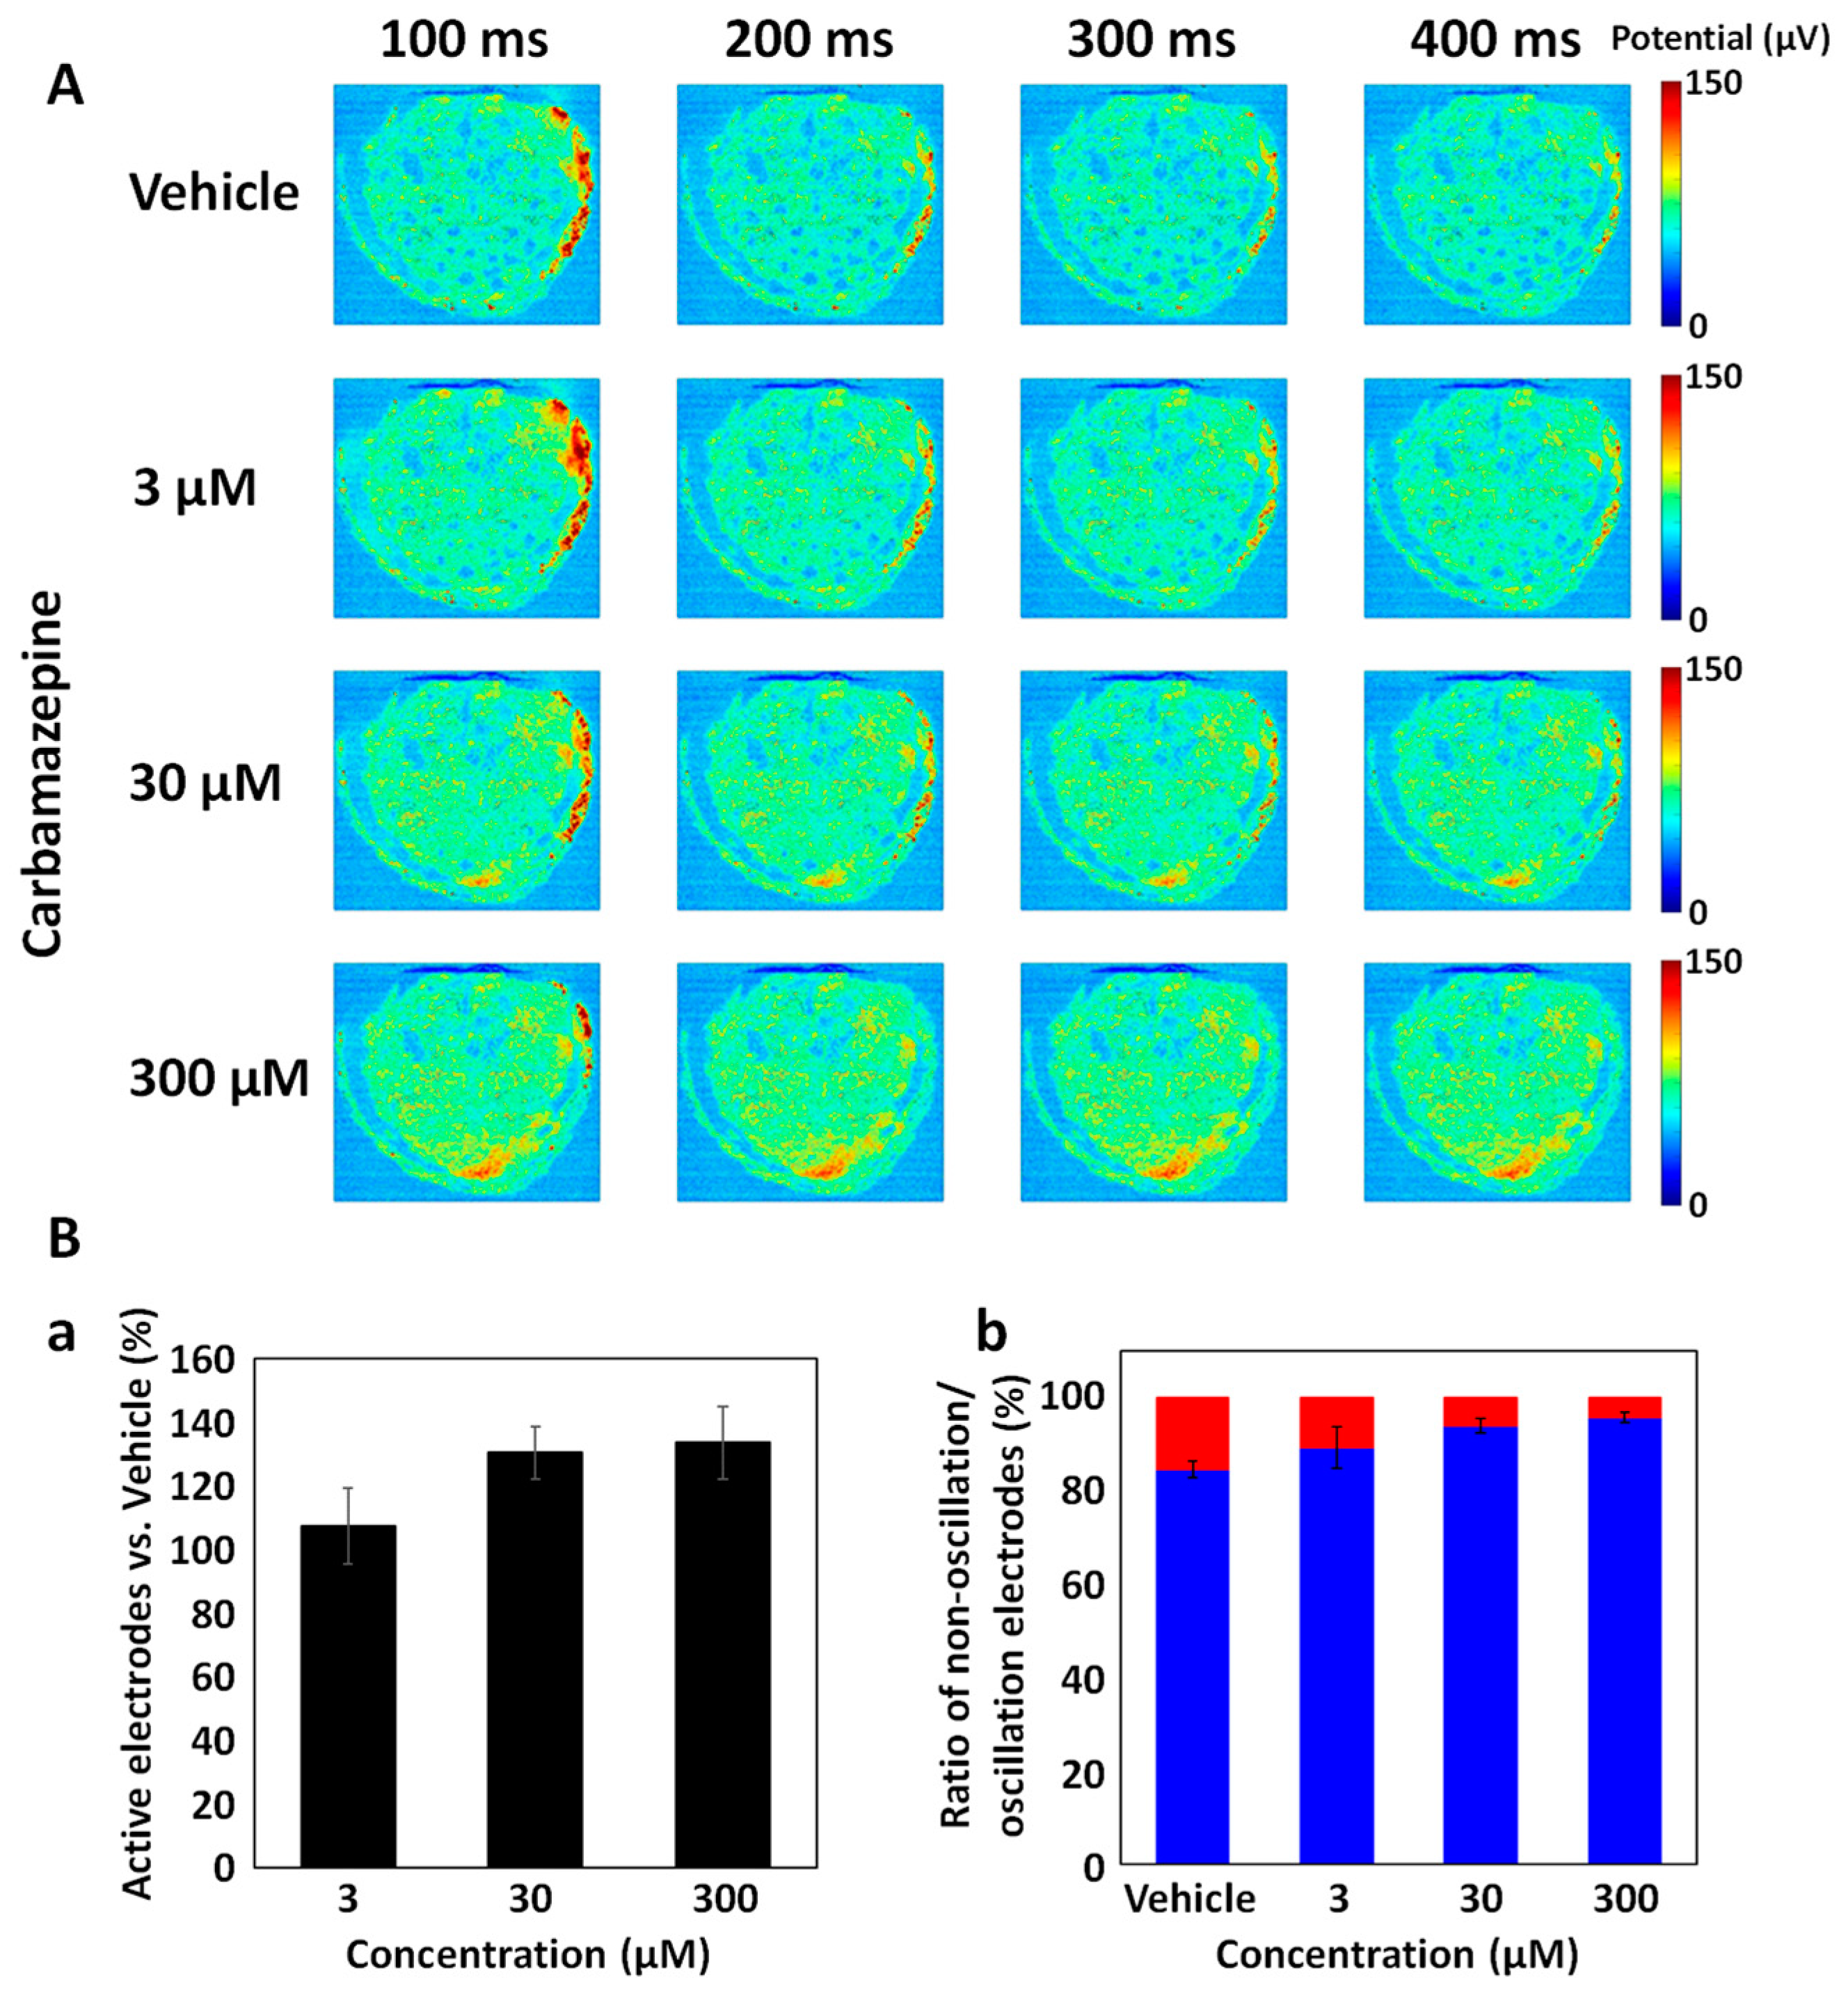
3.3. Carbamazepine Responses in DS Brain Organoids Using CMOS-MEA

The high-density CMOS-MEA provides high spatial resolution and a generous measurement area, enabling intricate monitoring of brain organoid activity interfacing with the MEA substrate [54,55,56]. We introduced the Field Potential Imaging (FPI) method utilizing a CMOS-MEA with electrode dimensions measuring 11.22 μm × 11.22 μm (127 μm2) and comprising 236,880 electrodes [54]. DS brain organoids, mounted onto the CMOS MEA, underwent cumulative dosing experiments involving CBZ. Supplementary S1 showcases a representative video capturing the oscillatory activity of the DS brain organoids. Around 79,729 electrodes adhered to the organoid, measuring activity within an approximately 11.0 mm2 area. Notably, oscillation was prominently observed in the right part of the organoid, with Figure 2A presenting a heatmap of the maximum voltage values during the 400 ms following oscillation. Beyond 30 μM CBZ, the oscillation activity area diminished, along with a decrease in duration at 300 μM. Nonetheless, CBZ administration led to persistently active regions (Figure 2A lower section). Active electrodes were identified as those exhibiting amplitudes surpassing 100 μV during oscillation. The number of active electrodes increased in a dose-dependent manner due to CBZ administration, although no significant difference was observed [Figure 2(Ba)]. This result suggests that CBZ amplified the organoid activity area. Active electrodes during oscillation were designated through a cosine similarity exceeding 0.25 between the average waveform of active electrodes during oscillation and individual electrode waveforms. Electrodes not meeting this criterion were classified as non-oscillating electrodes. The ratio of oscillating electrodes to non-oscillating electrodes among active electrodes is presented in Figure 2(Bb). The ratio of non-oscillating electrodes increased in a dose-dependent manner, rising from 74.5 ± 3.59% during vehicle administration to 95.8 ± 1.21% during 300 μM administration [Figure 2(Bb)]. This indicates that the augmentation in organoid activity can be attributed to the enhancement of non-oscillatory activity areas. Utilizing CMOS-MEA revealed that CBZ within DS brain organoids augments activity areas beyond oscillatory activity.

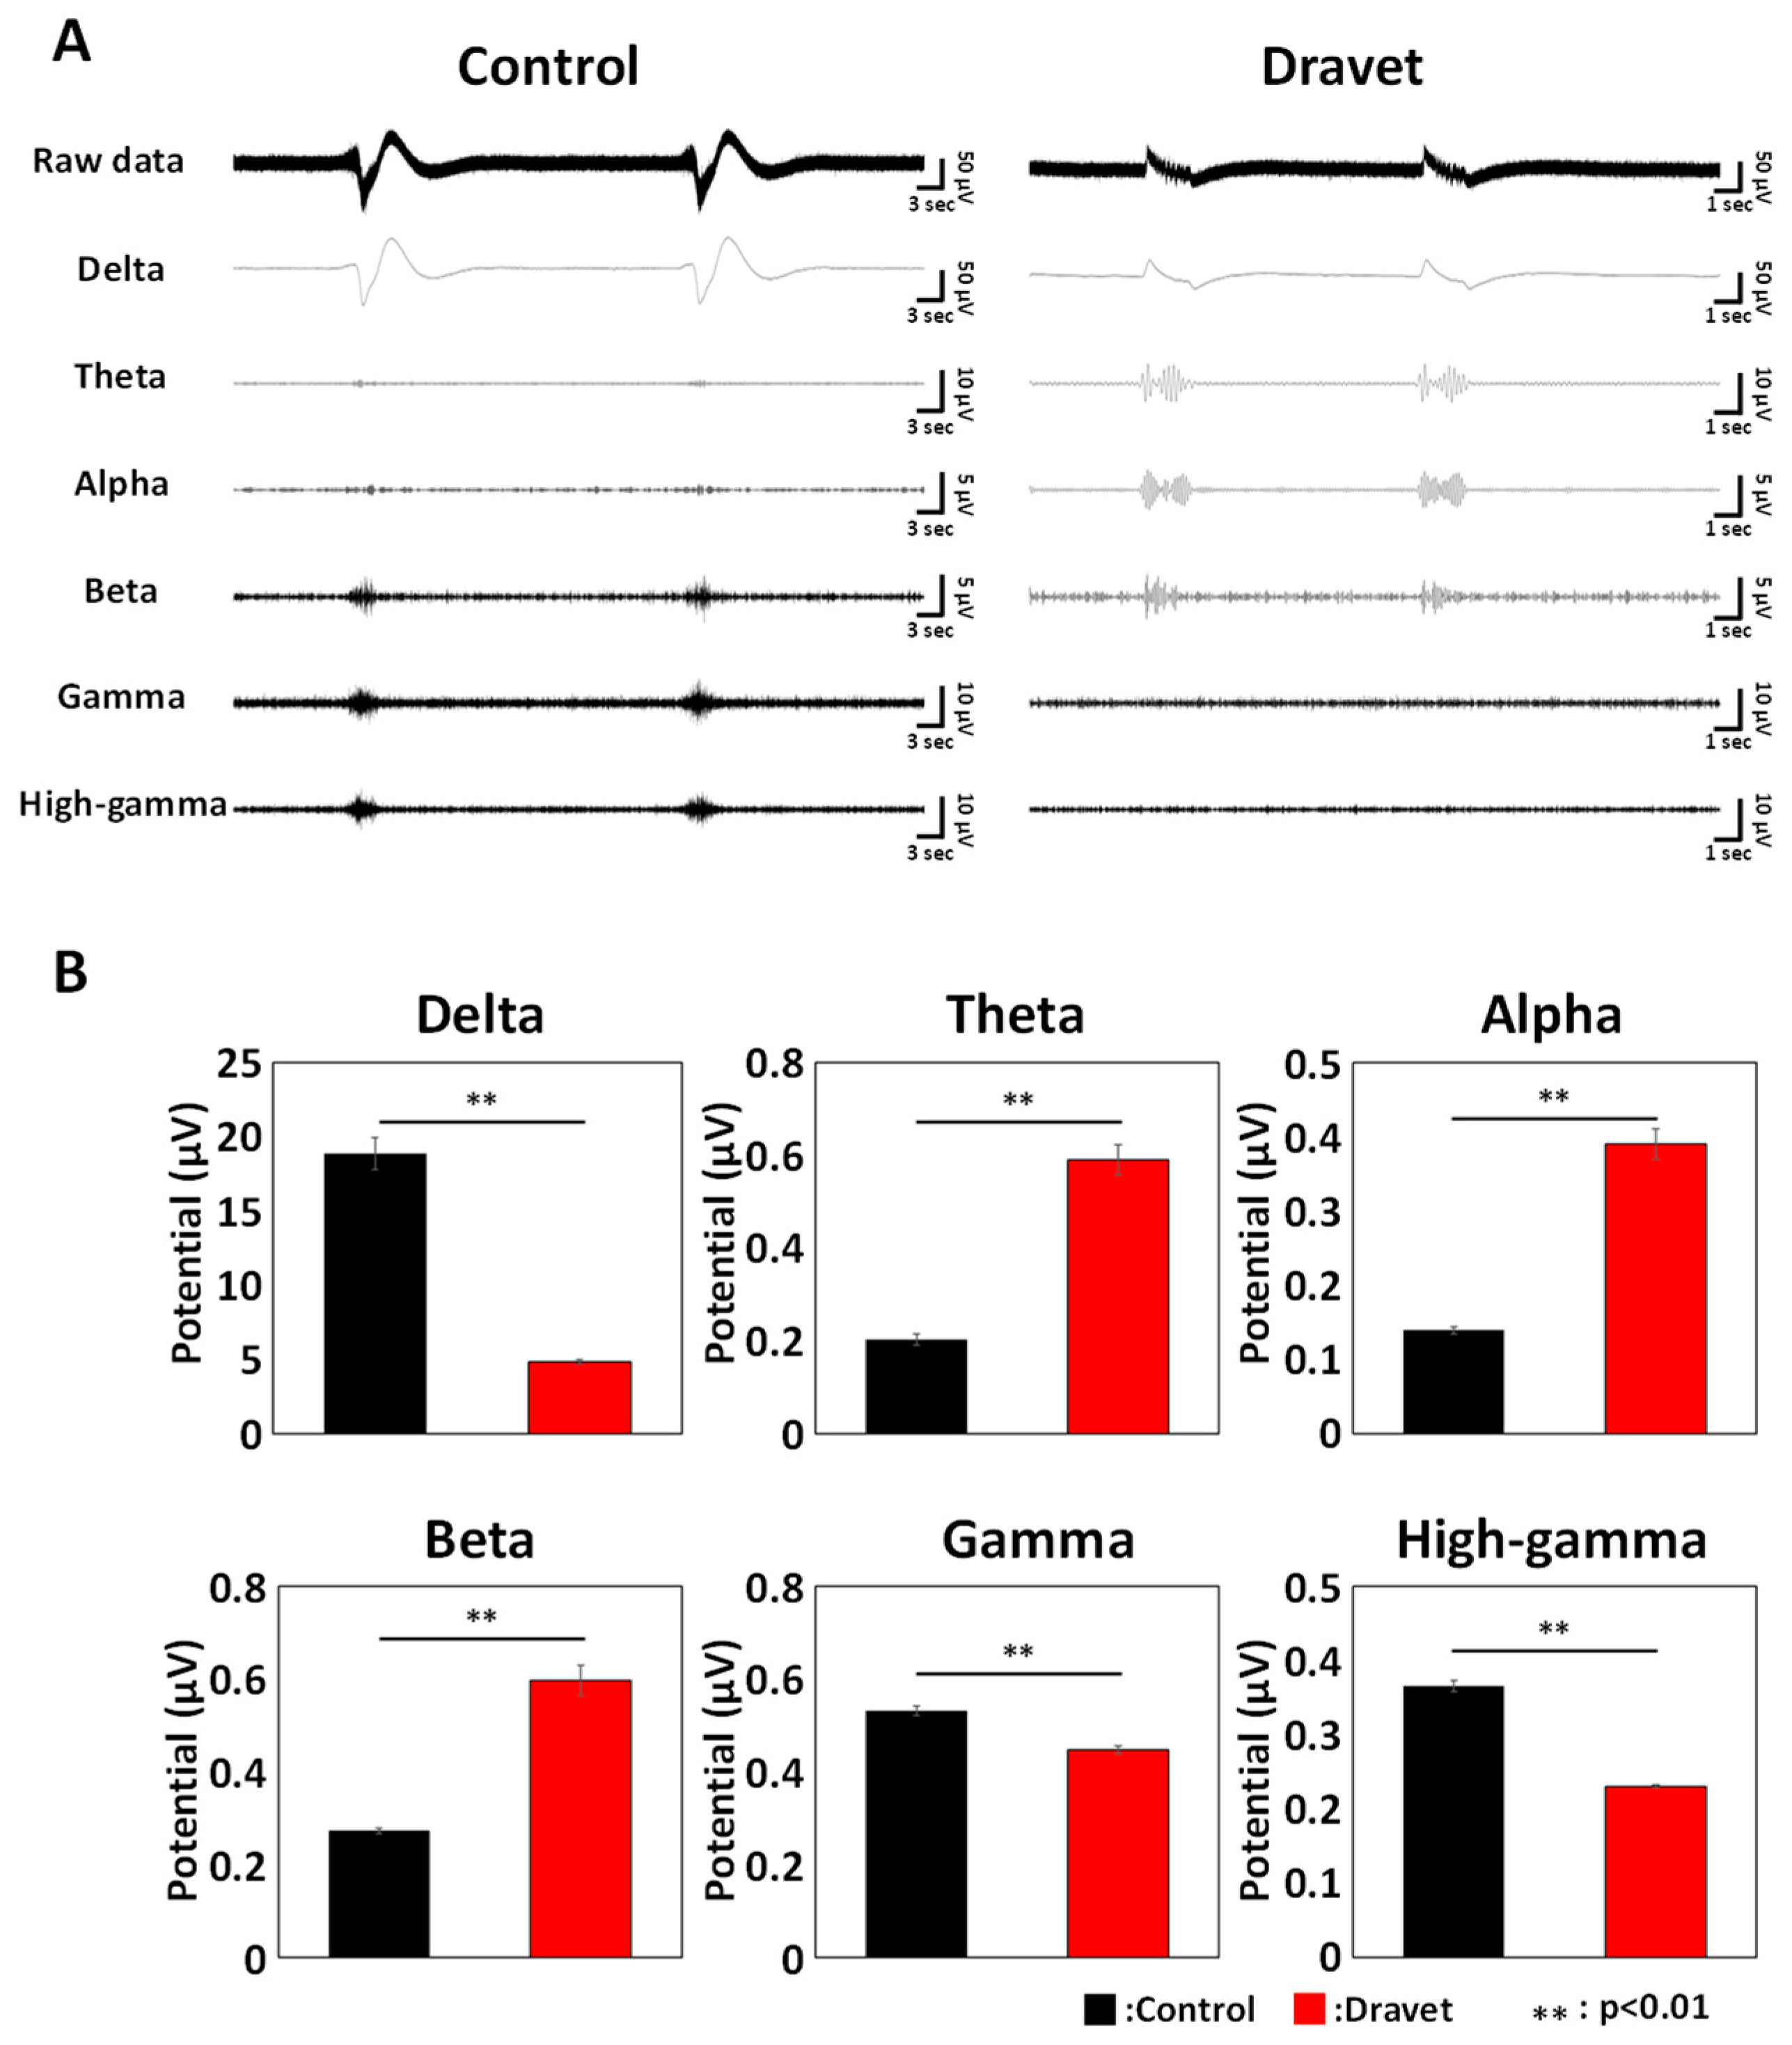
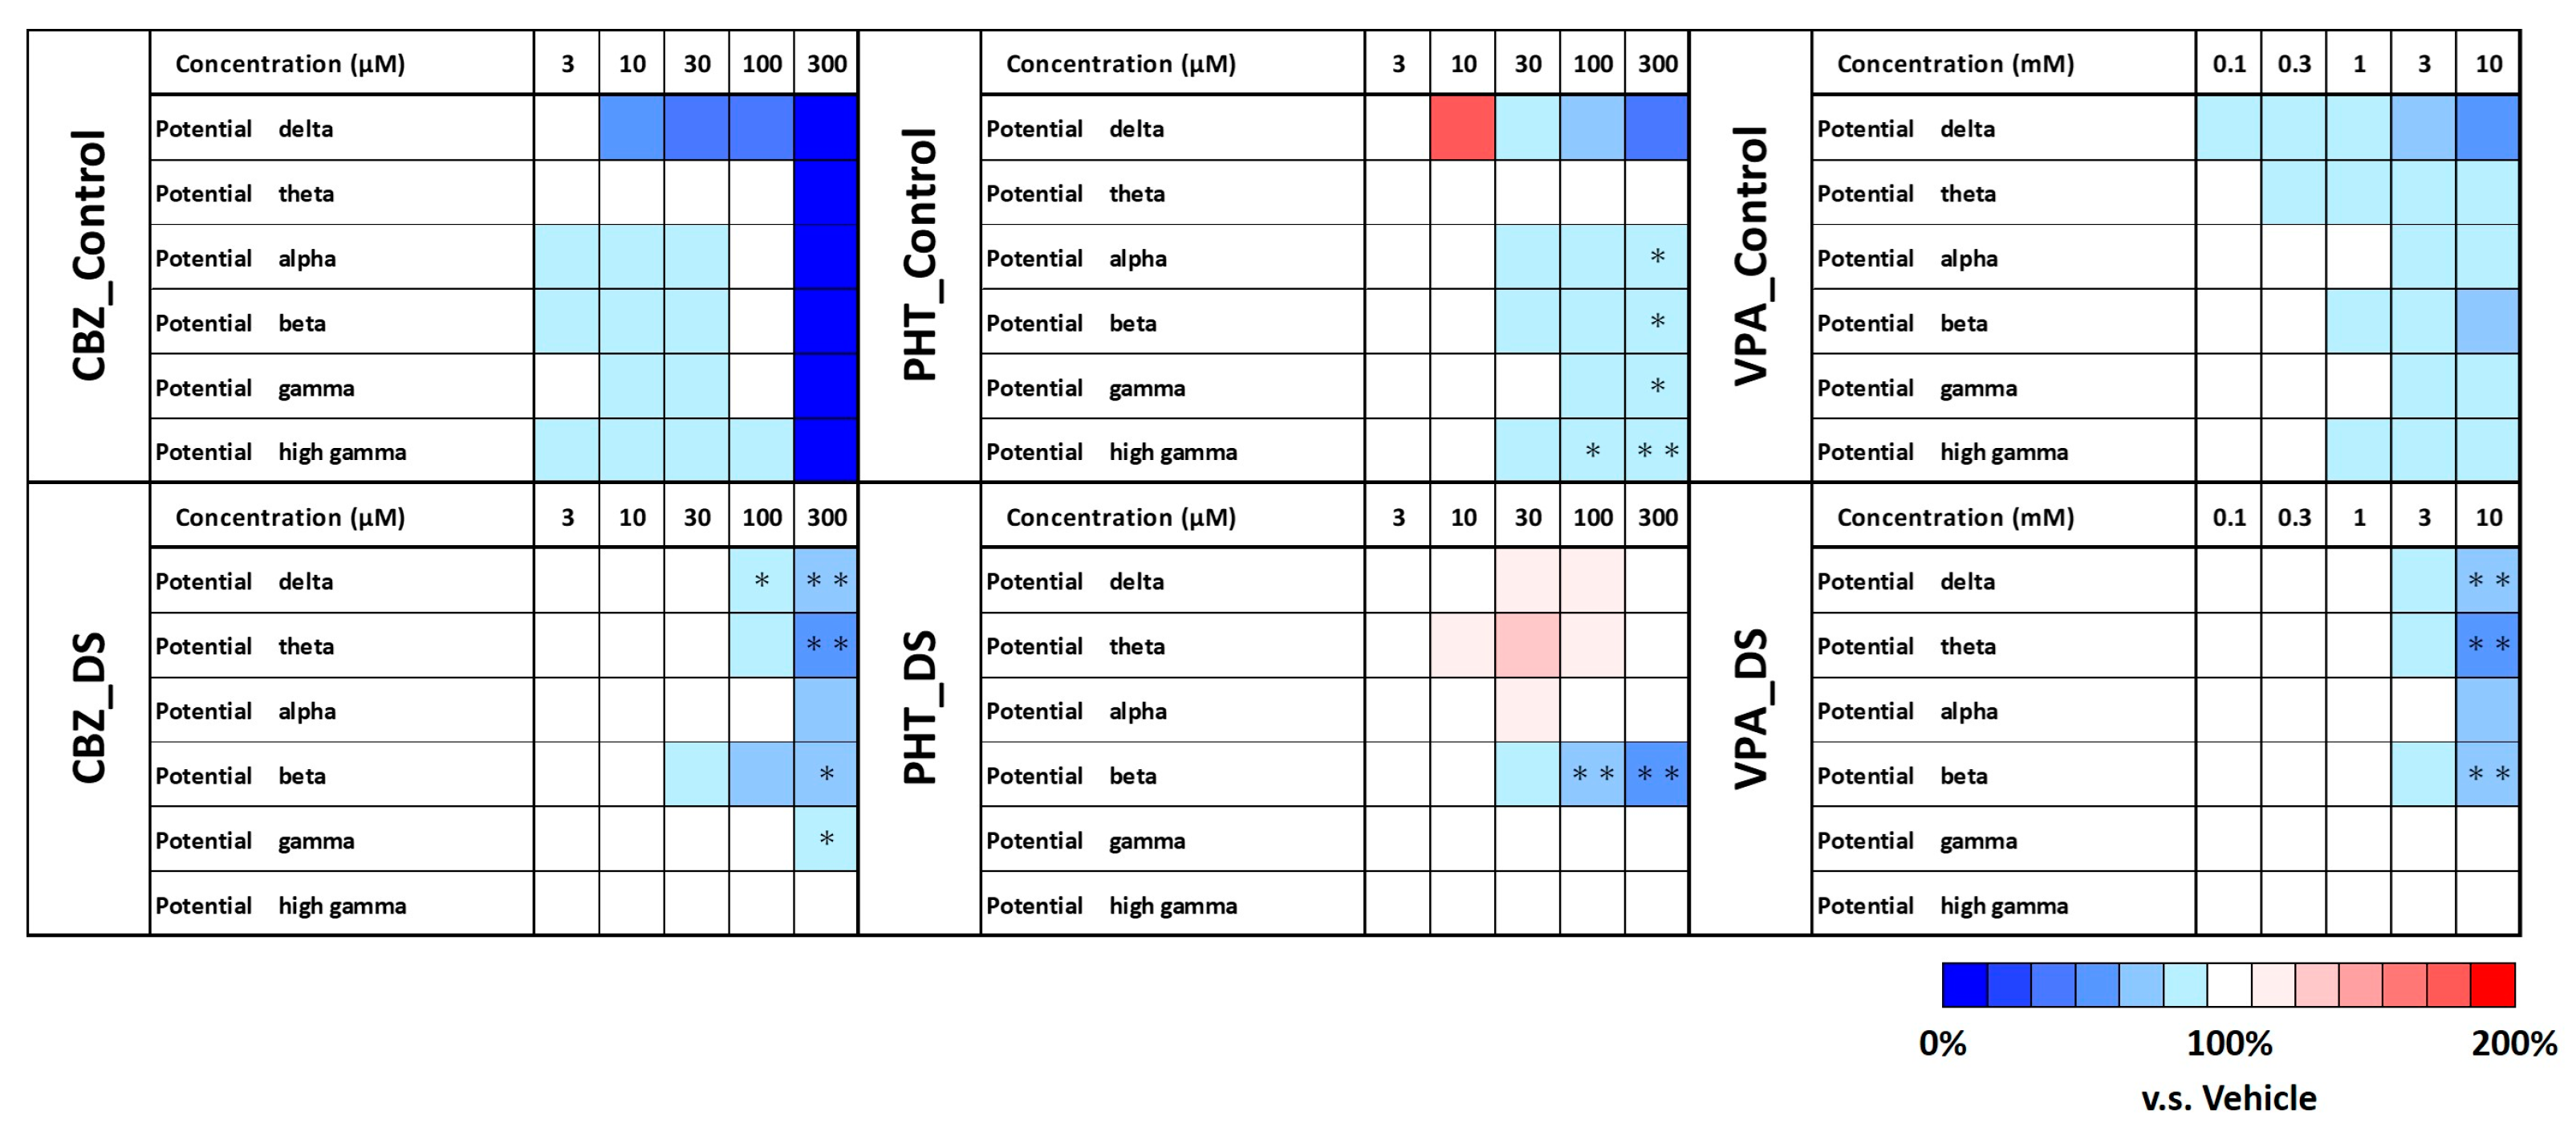
3.4. Frequency Characteristics of DS Brain Organoids

We calculated the potentials across distinct frequency bands, excluding spike components: delta (0.5–3 Hz), theta (4–7 Hz), alpha (8–11 Hz), beta (12–29 Hz), gamma (30–100 Hz), and high-gamma (100–150 Hz). Representative oscillatory waveforms for each frequency are depicted in Figure 3A. Within DS brain organoids, oscillation power exhibited greater strength in the theta, alpha, and beta frequency bands compared to the control organoids [theta wave: 0.590 ± 0.0319 μV (DS) > 0.203 ± 0.0123 μV (control), alpha wave: 0.391 ± 0.0205 μV (DS) > 0.140 ± 0.00463 μV (control), beta wave: 0.598 ± 0.0325 μV (DS) > 0.274 ± 0.00593 μV (control), p < 0.01, one-way ANOVA and Holm–Bonferroni methods, Figure 3A,B]. Conversely, the delta, gamma, and high-gamma frequency bands demonstrated diminished power in DS organoids in comparison to their control counterparts [delta wave: 4.87 ± 0.156 μV (DS) < 18.9 ± 1.10 μV (control), gamma wave: 0.448 ± 0.00836 μV (DS) < 0.532 ± 0.0109 μV (control), high-gamma wave: 0.231 ± 0.00198 μV (DS) < 0.366 ± 0.00752 μV (control), one-way ANOVA and Holm–Bonferroni methods, Figure 3A,B]. Japan Agency for Medical Research and Development.
Subsequently, we investigated alterations in frequency characteristics in response to antiepileptic drugs (Figure 4). In the case of DS, the variations in delta to high-gamma components in response to CBZ doses of 3, 10, and 30 μM were less pronounced compared to healthy controls. For the control organoids, where oscillations ceased at 300 μM CBZ, decreases in power were evident across all frequency bands (one-way ANOVA and Holm–Bonferroni methods, Figure 4, left). Following PHT administration, potential decreased across all frequency bands except theta in controls, while DS organoids showed no decreases in potential except in the beta band (Figure 4, middle). In the case of VPA administration, frequency intensity decreased from 0.1 mM in control organoids. In DS organoids, changes were observed from 3 mM, and significant decreases in delta, theta, and beta potentials were noted at 10 mM administration (one-way ANOVA and Holm–Bonferroni methods, Figure 4, right). To summarize, DS brain organoids exhibited a tendency towards weaker changes in frequency components, especially at low doses of antiepileptic drugs, in comparison to control organoids. Notably, significant potential reductions across multiple frequency bands were observed in response to the therapeutic use of VPA, particularly at higher doses.

4. Discussion

In this study, we generated cerebral cortex organoids derived from patients with Dravet Syndrome (DS) and investigated the responses and frequency characteristics of contraindicated drugs and therapeutic agents using MEA measurements.
In the prepared DS brain organoids, expression of β-tubulin III, a marker for immature neurons, and CTIP2, a marker for early cortical cells, was confirmed [Figure 1(Aa)]. In addition, expression of GABA, a marker for GABAergic neurons, was confirmed [Figure 1(Ab)]. In DS, a reduction in Nav1.1 expression in GABAergic neurons is one of the contributing factors to the disease. Therefore, the DS organoids prepared in this study may contain DS-specific neurons. In order to evaluate the prepared organoids more comprehensively, it is necessary to identify more detailed neural cellular phenotypes. In particular, it is necessary to identify the GABAergic interneurons that are defective in DS, assess the reduced expression of Nav1.1, and investigate the ratio of excitatory to inhibitory neurons.
During the acute administration of the contraindicated drugs CBZ and PHT, which are not recommended for DS, an increase in oscillation frequency was observed in both the control and DS conditions. However, in the case of DS, the response differed from that of controls, showing an elevation in oscillation frequency while maintaining peak voltage levels (Figure 1D–E). Notably, even at 300 μM, where oscillation activity ceased in controls with CBZ administration, it still persisted in DS cases. This outcome underscores a marked response to contraindicated drugs in DS organoids. Conversely, the therapeutic VPA exhibited consistent responses across DS and controls, with a reduction in oscillation frequency and Max. voltage observed upon administration at 10 mM (Figure 1F). Based on these observations, it can be concluded that the MEA measurements conducted using DS organoids effectively captured the response to contraindicated drugs. Moreover, the antiepileptic impact of brain organoids is thought to manifest in the attenuation of oscillation intensity. In clinical contexts, CBZ administration to epilepsy patients has been noted to decrease both seizure frequency in response to photic stimulation and the amplitude of brainwave patterns [57].
In the CMOS-MEA measurements conducted after CBZ administration, the outcomes revealed an augmentation in activities beyond oscillatory behaviors [Figure 2(Bb)]. Notably, in the ECoG of the DS mouse model, an escalation in spike activities outside of seizure events following CBZ administration has been documented [58]. The response witnessed in our study may potentially mirror the response observed in mouse models, implying a degree of coherence between the findings in our study and the responses seen in the mouse model.
In DS brain organoids, oscillations in spontaneous activity exhibited heightened strengths in the theta, alpha, and beta frequency bands, while displaying diminished strengths in the delta, gamma, and high-gamma bands when compared to control organoids (Figure 3B). Notably, EEG measurements conducted on DS patients aged six and above have reported amplified theta wave components and reduced alpha wave components during interictal periods in comparison to healthy individuals [59]. The robust presence of the theta wave component observed in our study partly aligns with these reported findings. Additionally, reports have indicated that Dravet syndrome patients experiencing seizures induced by polka-dot-pattern stimuli exhibit mixed waves of theta and beta frequencies [60]. The strong theta and beta wave components observed in this study might also be related to seizures. Furthermore, in comparison to controls, DS patients have exhibited attenuated gamma wave activity in response to auditory stimuli [61]. Although no external stimuli were utilized in this study, the attenuated gamma wave component implies the potential reflection of the diminished gamma wave generation capacity in DS patients. In the cortex, the activity of delta waves is believed to be associated with parvalbumin interneurons [62,63]. Furthermore, GABAergic neurons are known to play a role in the generation and regulation of activity beyond gamma waves [64,65,66]. Given the compromised functionality of GABAergic neurons in DS, it is plausible that the observed reduction in power within the delta, gamma, and high-gamma frequency bands is associated with this deficiency. In summary, the frequency characteristics of spontaneous activity observed in DS brain organoids seem to partially mirror the traits of characteristic brainwave activity in DS. This notion is supported by the correlations drawn between these findings and the established characteristics of the disorder.
When examining changes in the frequency characteristics in response to antiepileptic drugs, it was determined that DS brain organoids exhibit a diminished responsiveness to these drugs (Figure 4). CBZ administration has been reported to elicit augmented delta and theta wave activities, coupled with reduced alpha wave activity, both in healthy individuals and epilepsy patients [67,68,69,70,71,72,73]. While the organoids employed in this study did not demonstrate an augmentation in delta and theta waves, a reduction in alpha wave activity was evident. Furthermore, a higher dosage was required to induce an attenuation in alpha wave activity within DS. In healthy individuals, EEG responses to PHT administration are primarily documented to encompass alterations in delta, theta, and alpha wave activities, yielding divergent outcomes in distinct reports [74,75,76]. In epilepsy patients administered with PHT, an augmentation in delta and theta wave activities has been reported [77]. While no statistically significant disparities were observable in DS brain organoids, escalations in delta waves at 30 and 100 μM, alongside increments in theta waves at 10–100 μM, were detectable. This intensified activity may intimate a response exclusive to epilepsy patients. In the context of VPA, control individuals exhibited a decrease across all frequency bands, while DS organoids manifested a reduction spanning from delta to beta frequency bands. VPA’s principal mechanism of exerting antiepileptic effects lies in the potentiation of GABAergic neuron functionality. The accentuation of inputs from GABAergic neurons is hypothesized to underlie the observed reductions across multiple frequency bands in DS. Additionally, VPA administration in epilepsy patients is predominantly associated with reductions in the delta to gamma frequency bands [78,79,80]. Although a decrease in gamma frequency bands was not conspicuous in DS brain organoids, attenuations in low-frequency activity, commonly observed clinically, were discernible. Derived from these findings, it is posited that the responsiveness of brain organoids to antiepileptic drugs partially mirrors the reactions witnessed in the in vivo brain.
Brain organoids generated from iPSCs obtained from patients with the same disease can exhibit varying characteristics even within the confines of the same disease subtype. Notably, brain organoids originating from the iPSCs of multiple patients diagnosed with DS have demonstrated dissimilarities in gene expression, particularly in genes related to GABA, contingent upon the severity of the patient’s condition. In the subsequent phases, it becomes imperative to validate the potential correlation between the architecture, gene expression profiles of the fabricated brain organoids, and their electrophysiological behavior. Moreover, the evaluation of antiepileptic drug efficacy for DS, employing a solitary iPSC line specific to the disease, could encounter challenges given the potential divergence in clinical responses to antiepileptic drugs across patients. This implies that the outcomes of frequency component analysis after antiepileptic drug administration, as conducted in this study, could manifest variances on a patient-by-patient basis. Hence, the scrutiny of antiepileptic drug data derived from brain organoids sourced from a spectrum of DS patients through frequency analysis might potentially establish the frequency component indicators utilized in this study as viable parameters for the selection of optimal antiepileptic drugs.

5. Conclusions

In this study, we utilized MEA measurements of DS brain organoids to reveal responses to contraindicated drugs. Moreover, by conducting frequency analysis, we unveiled the partial resemblance of frequency attributes in living brainwave patterns to those in the organoids. The MEA measurement approach employed for DS brain organoids, coupled with frequency analysis, is deemed efficacious for assessing the safety of pharmaceutical interventions for individuals with DS. It holds the potential to enable precision medicine by assisting in the optimal selection of antiepileptic drugs, and also serves as a valuable screening method for assessing the effectiveness of antiepileptic medications.

Supplementary Materials

The following supporting information can be downloaded at: https://www.mdpi.com/article/10.3390/organoids2040014/s1, Video S1: Spontaneous Activity Oscillations in Dravet Syndrome Brain Organoids Measured by CMOS-MEA.

Author Contributions

Conceptualization, R.Y. and I.S.; writing—original draft preparation, R.Y. and I.S.; writing—review and editing R.Y., I.S., N.N., Y.I. and N.M.; Formal analysis, R.Y., Y.I. and N.M.; cell line culture, R.Y. and N.N.; immunostaining, N.N.; funding acquisition, R.Y. and I.S. All authors have read and agreed to the published version of the manuscript.

Funding

This study was supported by JSPS KAKENHI Grant Numbers 20H04507, 20J23851 and the science research promotion fund.

Institutional Review Board Statement

Not applicable.

Informed Consent Statement

Not applicable.

Data Availability Statement

The data and scripts that support the findings of this study are available from the corresponding author upon reasonable request.

Conflicts of Interest

The authors declare no conflict of interest.

References

  1. Takahashi, K.; Tanabe, K.; Ohnuki, M.; Narita, M.; Ichisaka, T.; Tomoda, K.; Yamanaka, S. Induction of pluripotent stem cells from adult human fibroblasts by defined factors. Cell 2007, 131, 861–872. [Google Scholar] [CrossRef]
  2. Liu, Y.; Lopez-Santiago, L.F.; Yuan, Y.; Jones, J.M.; Zhang, H.; O’Malley, H.A.; Patino, G.A.; O’Brien, J.E.; Rusconi, R.; Gupta, A.; et al. Dravet syndrome patient-derived neurons suggest a novel epilepsy mechanism. Ann. Neurol. 2013, 74, 128–139. [Google Scholar] [CrossRef]
  3. Jiao, J.; Yang, Y.; Shi, Y.; Chen, J.; Gao, R.; Fan, Y.; Yao, H.; Liao, W.; Sun, X.F.; Gao, S. Modeling Dravet syndrome using induced pluripotent stem cells (iPSCs) and directly converted neurons. Hum. Mol. Genet. 2013, 22, 4241–4252. [Google Scholar] [CrossRef] [PubMed]
  4. Marchetto, M.C.; Carromeu, C.; Acab, A.; Yu, D.; Yeo, G.W.; Mu, Y.; Chen, G.; Gage, F.H.; Muotri, A.R. A model for neural development and treatment of Rett syndrome using human induced pluripotent stem cells. Cell 2010, 143, 527–539. [Google Scholar] [CrossRef]
  5. Hotta, A.; Cheung, A.Y.; Farra, N.; Vijayaragavan, K.; Séguin, C.A.; Draper, J.S.; Pasceri, P.; Maksakova, I.A.; Mager, D.L.; Rossant, J.; et al. Isolation of human iPS cells using EOS lentiviral vectors to select for pluripotency. Nat. Methods 2009, 6, 370–376. [Google Scholar] [CrossRef]
  6. Chamberlain, S.J.; Chen, P.F.; Ng, K.Y.; Bourgois-Rocha, F.; Lemtiri-Chlieh, F.; Levine, E.S.; Lalande, M. Induced pluripotent stem cell models of the genomic imprinting disorders Angelman and Prader-Willi syndromes. Proc. Natl. Acad. Sci. USA 2010, 107, 17668–17673. [Google Scholar] [CrossRef]
  7. Stanurova, J.; Neureiter, A.; Hiber, M.; de Oliveira Kessler, H.; Stolp, K.; Goetzke, R.; Klein, D.; Bankfalvi, A.; Klump, H.; Steenpass, L. Angelman syndrome-derived neurons display late onset of paternal UBE3A silencing. Sci. Rep. 2016, 6, 30792. [Google Scholar] [CrossRef]
  8. Lancaster, M.A.; Renner, M.; Martin, C.A.; Wenzel, D.; Bicknell, L.S.; Hurles, M.E.; Homfray, T.; Penninger, J.M.; Jackson, A.P.; Knoblich, J.A. Cerebral organoids model human brain development and microcephaly. Nature 2013, 501, 373–379. [Google Scholar] [CrossRef] [PubMed]
  9. Lancaster, M.A.; Knoblich, J.A. Generation of cerebral organoids from human pluripotent stem cells. Nat. Protoc. 2014, 9, 2329–2340. [Google Scholar] [CrossRef]
  10. Giandomenico, S.L.; Sutcliffe, M.; Lancaster, M.A. Generation and long-term culture of advanced cerebral organoids for studying later stages of neural development. Nat. Protoc. 2021, 16, 579–602. [Google Scholar] [CrossRef] [PubMed]
  11. Kanton, S.; Boyle, M.J.; He, Z.; Santel, M.; Weigert, A.; Sanchís-Calleja, F.; Guijarro, P.; Sidow, L.; Fleck, J.S.; Han, D.; et al. Organoid single-cell genomic atlas uncovers human-specific features of brain development. Nature 2019, 574, 418–422. [Google Scholar] [CrossRef]
  12. Velasco, S.; Kedaigle, A.J.; Simmons, S.K.; Nash, A.; Rocha, M.; Quadrato, G.; Paulsen, B.; Nguyen, L.; Adiconis, X.; Regev, A.; et al. Individual brain organoids reproducibly form cell diversity of the human cerebral cortex. Nature 2019, 570, 523–527. [Google Scholar] [CrossRef] [PubMed]
  13. Cho, A.N.; Bright, F.; Morey, N.; Au, C.; Ittner, L.M.; Ke, Y.D. Efficient Gene Expression in Human Stem Cell Derived-Cortical Organoids Using Adeno Associated Virus. Cells 2022, 11, 3194. [Google Scholar] [CrossRef] [PubMed]
  14. Camp, J.G.; Badsha, F.; Florio, M.; Kanton, S.; Gerber, T.; Wilsch-Bräuninger, M.; Lewitus, E.; Sykes, A.; Hevers, W.; Lancaster, M.; et al. Human cerebral organoids recapitulate gene expression programs of fetal neocortex development. Proc. Natl. Acad. Sci. USA 2015, 112, 15672–15677. [Google Scholar] [CrossRef]
  15. Luo, C.; Lancaster, M.A.; Castanon, R.; Nery, J.R.; Knoblich, J.A.; Ecker, J.R. Cerebral Organoids Recapitulate Epigenomic Signatures of the Human Fetal Brain. Cell Rep. 2016, 17, 3369–3384. [Google Scholar] [CrossRef]
  16. Gordon, A.; Yoon, S.J.; Tran, S.S.; Makinson, C.D.; Park, J.Y.; Andersen, J.; Valencia, A.M.; Horvath, S.; Xiao, X.; Huguenard, J.R.; et al. Long-term maturation of human cortical organoids matches key early postnatal transitions. Nat. Neurosci. 2021, 24, 331–342. [Google Scholar] [CrossRef] [PubMed]
  17. Wang, P.; Mokhtari, R.; Pedrosa, E.; Kirschenbaum, M.; Bayrak, C.; Zheng, D.; Lachman, H.M. CRISPR/Cas9-mediated heterozygous knockout of the autism gene CHD8 and characterization of its transcriptional networks in cerebral organoids derived from iPS cells. Mol. Autism 2017, 8, 11. [Google Scholar] [CrossRef] [PubMed]
  18. Mariani, J.; Coppola, G.; Zhang, P.; Abyzov, A.; Provini, L.; Tomasini, L.; Amenduni, M.; Szekely, A.; Palejev, D.; Wilson, M.; et al. FOXG1-Dependent Dysregulation of GABA/Glutamate Neuron Differentiation in Autism Spectrum Disorders. Cell 2015, 162, 375–390. [Google Scholar] [CrossRef] [PubMed]
  19. Yildirim, M.; Delepine, C.; Feldman, D.; Pham, V.A.; Chou, S.; Ip, J.; Nott, A.; Tsai, L.H.; Ming, G.L.; So, P.T.C.; et al. Label-free three-photon imaging of intact human cerebral organoids for tracking early events in brain development and deficits in Rett syndrome. eLife 2022, 11, e78079. [Google Scholar] [CrossRef]
  20. Sabate-Soler, S.; Nickels, S.L.; Saraiva, C.; Berger, E.; Dubonyte, U.; Barmpa, K.; Lan, Y.J.; Kouno, T.; Jarazo, J.; Robertson, G.; et al. Microglia integration into human midbrain organoids leads to increased neuronal maturation and functionality. Glia 2022, 70, 1267–1288. [Google Scholar] [CrossRef]
  21. Saleem, A.; Santos, A.C.; Aquilino, M.S.; Sivitilli, A.A.; Attisano, L.; Carlen, P.L. Modelling hyperexcitability in human cerebral cortical organoids: Oxygen/glucose deprivation most effective stimulant. Heliyon 2023, 9, e14999. [Google Scholar] [CrossRef]
  22. Wu, W.; Yao, H.; Negraes, P.D.; Wang, J.; Trujillo, C.A.; de Souza, J.S.; Muotri, A.R.; Haddad, G.G. Neuronal hyperexcitability and ion channel dysfunction in CDKL5-deficiency patient iPSC-derived cortical organoids. Neurobiol. Dis. 2022, 174, 105882. [Google Scholar] [CrossRef] [PubMed]
  23. Yao, H.; Wu, W.; Cerf, I.; Zhao, H.W.; Wang, J.; Negraes, P.D.; Muotri, A.R.; Haddad, G.G. Methadone interrupts neural growth and function in human cortical organoids. Stem Cell Res. 2020, 49, 102065. [Google Scholar] [CrossRef] [PubMed]
  24. Gomes, A.R.; Fernandes, T.G.; Vaz, S.H.; Silva, T.P.; Bekman, E.P.; Xapelli, S.; Duarte, S.; Ghazvini, M.; Gribnau, J.; Muotri, A.R.; et al. Modeling Rett Syndrome with Human Patient-Specific Forebrain Organoids. Front. Cell Dev. Biol. 2020, 8, 610427. [Google Scholar] [CrossRef] [PubMed]
  25. Sun, G.; Chiuppesi, F.; Chen, X.; Wang, C.; Tian, E.; Nguyen, J.; Kha, M.; Trinh, D.; Zhang, H.; Marchetto, M.C.; et al. Modeling Human Cytomegalovirus-Induced Microcephaly in Human iPSC-Derived Brain Organoids. Cell Rep. Med. 2020, 1, 100002. [Google Scholar] [CrossRef]
  26. Chen, X.; Sun, G.; Tian, E.; Zhang, M.; Davtyan, H.; Beach, T.G.; Reiman, E.M.; Blurton-Jones, M.; Holtzman, D.M.; Shi, Y. Modeling Sporadic Alzheimer’s Disease in Human Brain Organoids under Serum Exposure. Adv. Sci. 2021, 8, e2101462. [Google Scholar] [CrossRef]
  27. Kathuria, A.; Lopez-Lengowski, K.; Vater, M.; McPhie, D.; Cohen, B.M.; Karmacharya, R. Transcriptome analysis and functional characterization of cerebral organoids in bipolar disorder. Genome Med. 2020, 12, 34. [Google Scholar] [CrossRef]
  28. Trujillo, C.A.; Rice, E.S.; Schaefer, N.K.; Chaim, I.A.; Wheeler, E.C.; Madrigal, A.A.; Buchanan, J.; Preissl, S.; Wang, A.; Negraes, P.D.; et al. Reintroduction of the archaic variant of NOVA1 in cortical organoids alters neurodevelopment. Science 2021, 371, eaax2537. [Google Scholar] [CrossRef]
  29. Meng, Q.; Zhang, W.; Wang, X.; Jiao, C.; Xu, S.; Liu, C.; Tang, B.; Chen, C. Human forebrain organoids reveal connections between valproic acid exposure and autism risk. Transl. Psychiatry 2022, 12, 130. [Google Scholar] [CrossRef]
  30. Phouphetlinthong, O.; Partiot, E.; Bernou, C.; Sebban, A.; Gaudin, R.; Charlot, B. Protruding cantilever microelectrode array to monitor the inner electrical activity of cerebral organoids. Lab Chip 2023, 23, 3603–3614. [Google Scholar] [CrossRef]
  31. Fagerlund, I.; Dougalis, A.; Shakirzyanova, A.; Gómez-Budia, M.; Pelkonen, A.; Konttinen, H.; Ohtonen, S.; Fazaludeen, M.F.; Koskuvi, M.; Kuusisto, J.; et al. Microglia-like Cells Promote Neuronal Functions in Cerebral Organoids. Cells 2021, 11, 124. [Google Scholar] [CrossRef]
  32. Adams, J.W.; Negraes, P.D.; Truong, J.; Tran, T.; Szeto, R.A.; Guerra, B.S.; Herai, R.H.; Teodorof-Diedrich, C.; Spector, S.A.; Del Campo, M.; et al. Impact of alcohol exposure on neural development and network formation in human cortical organoids. Mol. Psychiatry 2023, 28, 1571–1584. [Google Scholar] [CrossRef] [PubMed]
  33. Silvosa, M.J.; Mercado, N.R.; Merlock, N.; Vidhate, S.; Mejia-Alvarez, R.; Yuan, T.T.; Willis, A.M.; Lybrand, Z.R. Understanding Primary Blast Injury: High Frequency Pressure Acutely Disrupts Neuronal Network Dynamics in Cerebral Organoids. J. Neurotrauma 2022, 39, 1575–1590. [Google Scholar] [CrossRef] [PubMed]
  34. Trujillo, C.A.; Gao, R.; Negraes, P.D.; Gu, J.; Buchanan, J.; Preissl, S.; Wang, A.; Wu, W.; Haddad, G.G.; Chaim, I.A.; et al. Complex Oscillatory Waves Emerging from Cortical Organoids Model Early Human Brain Network Development. Cell Stem Cell 2019, 25, 558–569.e557. [Google Scholar] [CrossRef] [PubMed]
  35. Morelli, K.H.; Jin, W.; Shathe, S.; Madrigal, A.A.; Jones, K.L.; Schwartz, J.L.; Bridges, T.; Mueller, J.R.; Shankar, A.; Chaim, I.A.; et al. MECP2-related pathways are dysregulated in a cortical organoid model of myotonic dystrophy. Sci. Transl. Med. 2022, 14, eabn2375. [Google Scholar] [CrossRef] [PubMed]
  36. Foliaki, S.T.; Schwarz, B.; Groveman, B.R.; Walters, R.O.; Ferreira, N.C.; Orrù, C.D.; Smith, A.; Wood, A.; Schmit, O.M.; Freitag, P.; et al. Neuronal excitatory-to-inhibitory balance is altered in cerebral organoid models of genetic neurological diseases. Mol. Brain 2021, 14, 156. [Google Scholar] [CrossRef]
  37. Ghatak, S.; Dolatabadi, N.; Trudler, D.; Zhang, X.; Wu, Y.; Mohata, M.; Ambasudhan, R.; Talantova, M.; Lipton, S.A. Mechanisms of hyperexcitability in Alzheimer’s disease hiPSC-derived neurons and cerebral organoids vs. isogenic controls. eLife 2019, 8, e50333. [Google Scholar] [CrossRef]
  38. Kathuria, A.; Lopez-Lengowski, K.; Jagtap, S.S.; McPhie, D.; Perlis, R.H.; Cohen, B.M.; Karmacharya, R. Transcriptomic Landscape and Functional Characterization of Induced Pluripotent Stem Cell-Derived Cerebral Organoids in Schizophrenia. JAMA Psychiatry 2020, 77, 745–754. [Google Scholar] [CrossRef]
  39. Trujillo, C.A.; Adams, J.W.; Negraes, P.D.; Carromeu, C.; Tejwani, L.; Acab, A.; Tsuda, B.; Thomas, C.A.; Sodhi, N.; Fichter, K.M.; et al. Pharmacological reversal of synaptic and network pathology in human MECP2-KO neurons and cortical organoids. EMBO Mol. Med. 2021, 13, e12523. [Google Scholar] [CrossRef]
  40. Yokoi, R.; Shibata, M.; Odawara, A.; Ishibashi, Y.; Nagafuku, N.; Matsuda, N.; Suzuki, I. Analysis of signal components < 500 Hz in brain organoids coupled to microelectrode arrays: A reliable test-bed for preclinical seizure liability assessment of drugs and screening of antiepileptic drugs. Biochem. Biophys. Rep. 2021, 28, 101148. [Google Scholar] [CrossRef]
  41. Dravet, C. Dravet syndrome history. Dev. Med. Child Neurol. 2011, 53 (Suppl. S2), 1–6. [Google Scholar] [CrossRef] [PubMed]
  42. Ogiwara, I.; Miyamoto, H.; Morita, N.; Atapour, N.; Mazaki, E.; Inoue, I.; Takeuchi, T.; Itohara, S.; Yanagawa, Y.; Obata, K.; et al. Nav1.1 localizes to axons of parvalbumin-positive inhibitory interneurons: A circuit basis for epileptic seizures in mice carrying an Scn1a gene mutation. J. Neurosci. Off. J. Soc. Neurosci. 2007, 27, 5903–5914. [Google Scholar] [CrossRef] [PubMed]
  43. Dutton, S.B.; Makinson, C.D.; Papale, L.A.; Shankar, A.; Balakrishnan, B.; Nakazawa, K.; Escayg, A. Preferential inactivation of Scn1a in parvalbumin interneurons increases seizure susceptibility. Neurobiol. Dis. 2013, 49, 211–220. [Google Scholar] [CrossRef] [PubMed]
  44. Fadila, S.; Quinn, S.; Turchetti Maia, A.; Yakubovich, D.; Ovadia, M.; Anderson, K.L.; Giladi, M.; Rubinstein, M. Convulsive seizures and some behavioral comorbidities are uncoupled in the Scn1a(A1783V) Dravet syndrome mouse model. Epilepsia 2020, 61, 2289–2300. [Google Scholar] [CrossRef] [PubMed]
  45. Li, M.; Yang, L.; Qian, W.; Ray, S.; Lu, Z.; Liu, T.; Zou, Y.Y.; Naumann, R.K.; Wang, H. A novel rat model of Dravet syndrome recapitulates clinical hallmarks. Neurobiol. Dis. 2023, 184, 106193. [Google Scholar] [CrossRef] [PubMed]
  46. Kuo, F.S.; Cleary, C.M.; LoTurco, J.J.; Chen, X.; Mulkey, D.K. Disordered breathing in a mouse model of Dravet syndrome. eLife 2019, 8, e43387. [Google Scholar] [CrossRef] [PubMed]
  47. Tanaka, Y.; Sone, T.; Higurashi, N.; Sakuma, T.; Suzuki, S.; Ishikawa, M.; Yamamoto, T.; Mitsui, J.; Tsuji, H.; Okano, H.; et al. Generation of D1-1 TALEN isogenic control cell line from Dravet syndrome patient iPSCs using TALEN-mediated editing of the SCN1A gene. Stem Cell Res. 2018, 28, 100–104. [Google Scholar] [CrossRef]
  48. Kim, H.W.; Quan, Z.; Kim, Y.B.; Cheong, E.; Kim, H.D.; Cho, M.; Jang, J.; Yoo, Y.R.; Lee, J.S.; Kim, J.H.; et al. Differential effects on sodium current impairments by distinct SCN1A mutations in GABAergic neurons derived from Dravet syndrome patients. Brain Dev. 2018, 40, 287–298. [Google Scholar] [CrossRef]
  49. Schuster, J.; Fatima, A.; Sobol, M.; Norradin, F.H.; Laan, L.; Dahl, N. Generation of three human induced pluripotent stem cell (iPSC) lines from three patients with Dravet syndrome carrying distinct SCN1A gene mutations. Stem Cell Res. 2019, 39, 101523. [Google Scholar] [CrossRef]
  50. Sun, Y.; Paşca, S.P.; Portmann, T.; Goold, C.; Worringer, K.A.; Guan, W.; Chan, K.C.; Gai, H.; Vogt, D.; Chen, Y.J.; et al. A deleterious Nav1.1 mutation selectively impairs telencephalic inhibitory neurons derived from Dravet Syndrome patients. eLife 2016, 5, e13073. [Google Scholar] [CrossRef]
  51. Sun, Y.; Dolmetsch, R.E. Investigating the Therapeutic Mechanism of Cannabidiol in a Human Induced Pluripotent Stem Cell (iPSC)-Based Model of Dravet Syndrome. Cold Spring Harb. Symp. Quant. Biol. 2018, 83, 185–191. [Google Scholar] [CrossRef] [PubMed]
  52. Kimura, Y.; Tanaka, Y.; Shirasu, N.; Yasunaga, S.; Higurashi, N.; Hirose, S. Establishment of human induced pluripotent stem cells derived from skin cells of a patient with Dravet syndrome. Stem Cell Res. 2020, 47, 101857. [Google Scholar] [CrossRef] [PubMed]
  53. Zayat, V.; Kuczynska, Z.; Liput, M.; Metin, E.; Rzonca-Niewczas, S.; Smyk, M.; Mazurczak, T.; Goszczanska-Ciuchta, A.; Leszczynski, P.; Hoffman-Zacharska, D.; et al. The Generation of Human iPSC Lines from Three Individuals with Dravet Syndrome and Characterization of Neural Differentiation Markers in iPSC-Derived Ventral Forebrain Organoid Model. Cells 2023, 12, 339. [Google Scholar] [CrossRef] [PubMed]
  54. Suzuki, I.; Matsuda, N.; Han, X.; Noji, S.; Shibata, M.; Nagafuku, N.; Ishibashi, Y. Large-Area Field Potential Imaging Having Single Neuron Resolution Using 236 880 Electrodes CMOS-MEA Technology. Adv. Sci. 2023, 10, e2207732. [Google Scholar] [CrossRef] [PubMed]
  55. Sharf, T.; van der Molen, T.; Glasauer, S.M.K.; Guzman, E.; Buccino, A.P.; Luna, G.; Cheng, Z.; Audouard, M.; Ranasinghe, K.G.; Kudo, K.; et al. Functional neuronal circuitry and oscillatory dynamics in human brain organoids. Nat. Commun. 2022, 13, 4403. [Google Scholar] [CrossRef]
  56. Schröter, M.; Wang, C.; Terrigno, M.; Hornauer, P.; Huang, Z.; Jagasia, R.; Hierlemann, A. Functional imaging of brain organoids using high-density microelectrode arrays. MRS Bull. 2022, 47, 530–544. [Google Scholar] [CrossRef]
  57. Okon, E.A.; Oshie, N.C.; Ubong, I.A.; Kelechi, O.S. The Effect of Carbamazepine on EEG Tracings of People with Seizure Disorders in Calabar, Nigeria. Saudi J. Med. Pharm. Sci. 2017, 3, 73–84. [Google Scholar]
  58. Quinn, S.; Brusel, M.; Ovadia, M.; Rubinstein, M. Acute effect of antiseizure drugs on background oscillations in Scn1a (A1783V) Dravet syndrome mouse model. Front. Pharmacol. 2023, 14, 1118216. [Google Scholar] [CrossRef]
  59. Holmes, G.L.; Bender, A.C.; Wu, E.X.; Scott, R.C.; Lenck-Santini, P.P.; Morse, R.P. Maturation of EEG oscillations in children with sodium channel mutations. Brain Dev. 2012, 34, 469–477. [Google Scholar] [CrossRef]
  60. Akiyama, M.; Kobayashi, K.; Yoshinaga, H.; Ohtsuka, Y. A long-term follow-up study of Dravet syndrome up to adulthood. Epilepsia 2010, 51, 1043–1052. [Google Scholar] [CrossRef]
  61. Sanchez-Carpintero, R.; Urrestarazu, E.; Cieza, S.; Alegre, M.; Artieda, J.; Crespo-Eguilaz, N.; Valencia, M. Abnormal brain gamma oscillations in response to auditory stimulation in Dravet syndrome. Eur. J. Paediatr. Neurol. Off. J. Eur. Paediatr. Neurol. Soc. 2020, 24, 134–141. [Google Scholar] [CrossRef] [PubMed]
  62. Kuki, T.; Fujihara, K.; Miwa, H.; Tamamaki, N.; Yanagawa, Y.; Mushiake, H. Contribution of parvalbumin and somatostatin-expressing GABAergic neurons to slow oscillations and the balance in beta-gamma oscillations across cortical layers. Front. Neural Circuits 2015, 9, 6. [Google Scholar] [CrossRef] [PubMed]
  63. Kalume, F.; Oakley, J.C.; Westenbroek, R.E.; Gile, J.; de la Iglesia, H.O.; Scheuer, T.; Catterall, W.A. Sleep impairment and reduced interneuron excitability in a mouse model of Dravet Syndrome. Neurobiol. Dis. 2015, 77, 141–154. [Google Scholar] [CrossRef]
  64. Cardin, J.A. Inhibitory Interneurons Regulate Temporal Precision and Correlations in Cortical Circuits. Trends Neurosci. 2018, 41, 689–700. [Google Scholar] [CrossRef] [PubMed]
  65. Cardin, J.A. Snapshots of the Brain in Action: Local Circuit Operations through the Lens of γ Oscillations. J. Neurosci. Off. J. Soc. Neurosci. 2016, 36, 10496–10504. [Google Scholar] [CrossRef] [PubMed]
  66. Buzsáki, G.; Wang, X.J. Mechanisms of gamma oscillations. Annu. Rev. Neurosci. 2012, 35, 203–225. [Google Scholar] [CrossRef]
  67. Besser, R.; Hornung, K.; Theisohn, M.; Rothacher, G.; Krämer, G. EEG changes in patients during the introduction of carbamazepine. Electroencephalogr. Clin. Neurophysiol. 1992, 83, 19–23. [Google Scholar] [CrossRef]
  68. Salinsky, M.C.; Oken, B.S.; Morehead, L. Intraindividual analysis of antiepileptic drug effects on EEG background rhythms. Electroencephalogr. Clin. Neurophysiol. 1994, 90, 186–193. [Google Scholar] [CrossRef]
  69. Wu, X.; Xiao, C.H. Quantitative pharmaco-EEG of carbamazepine in volunteers and epileptics. Clin. Electroencephalogr. 1996, 27, 40–45. [Google Scholar] [CrossRef]
  70. Salinsky, M.C.; Binder, L.M.; Oken, B.S.; Storzbach, D.; Aron, C.R.; Dodrill, C.B. Effects of gabapentin and carbamazepine on the EEG and cognition in healthy volunteers. Epilepsia 2002, 43, 482–490. [Google Scholar] [CrossRef]
  71. Clemens, B.; Ménes, A.; Nagy, Z. Objective assessment of neurotoxicity while shifting from carbamazepine to oxcarbazepine. Acta Neurol. Scand. 2004, 109, 324–329. [Google Scholar] [CrossRef]
  72. Clemens, B.; Ménes, A.; Piros, P.; Bessenyei, M.; Altmann, A.; Jerney, J.; Kollár, K.; Rosdy, B.; Rózsavölgyi, M.; Steinecker, K.; et al. Quantitative EEG effects of carbamazepine, oxcarbazepine, valproate, lamotrigine, and possible clinical relevance of the findings. Epilepsy Res. 2006, 70, 190–199. [Google Scholar] [CrossRef] [PubMed]
  73. Meador, K.J.; Loring, D.W.; Boyd, A.; Echauz, J.; LaRoche, S.; Velez-Ruiz, N.; Korb, P.; Byrnes, W.; Dilley, D.; Borghs, S.; et al. Randomized double-blind comparison of cognitive and EEG effects of lacosamide and carbamazepine. Epilepsy Behav. 2016, 62, 267–275. [Google Scholar] [CrossRef]
  74. Fink, M.; Irwin, P.; Sannita, W.; Papakostas, Y.; Green, M.A. Phenytoin: EEG effects and plasma levels in volunteers. Ther. Drug Monit. 1979, 1, 93–103. [Google Scholar] [CrossRef] [PubMed]
  75. Chung, S.S.; McEvoy, L.K.; Smith, M.E.; Gevins, A.; Meador, K.; Laxer, K.D. Task-related EEG and ERP changes without performance impairment following a single dose of phenytoin. Clin. Neurophysiol. Off. J. Int. Fed. Clin. Neurophysiol. 2002, 113, 806–814. [Google Scholar] [CrossRef] [PubMed]
  76. Salinsky, M.C.; Spencer, D.C.; Oken, B.S.; Storzbach, D. Effects of oxcarbazepine and phenytoin on the EEG and cognition in healthy volunteers. Epilepsy Behav. 2004, 5, 894–902. [Google Scholar] [CrossRef] [PubMed]
  77. Herkes, G.K.; Lagerlund, T.D.; Sharbrough, F.W.; Eadie, M.J. Effects of antiepileptic drug treatment on the background frequency of EEGs in epileptic patients. J. Clin. Neurophysiol. Off. Publ. Am. Electroencephalogr. Soc. 1993, 10, 210–216. [Google Scholar] [CrossRef]
  78. Arzy, S.; Allali, G.; Brunet, D.; Michel, C.M.; Kaplan, P.W.; Seeck, M. Antiepileptic drugs modify power of high EEG frequencies and their neural generators. Eur. J. Neurol. 2010, 17, 1308–1312. [Google Scholar] [CrossRef]
  79. Clemens, B. Valproate decreases EEG synchronization in a use-dependent manner in idiopathic generalized epilepsy. Seizure 2008, 17, 224–233. [Google Scholar] [CrossRef]
  80. Béla, C.; Mónika, B.; Márton, T.; István, K. Valproate selectively reduces EEG activity in anterior parts of the cortex in patients with idiopathic generalized epilepsy. A low resolution electromagnetic tomography (LORETA) study. Epilepsy Res. 2007, 75, 186–191. [Google Scholar] [CrossRef]
Figure 1. Response of Dravet Syndrome and control brain organoids to antiepileptic drugs. (A) Image of immunofluorescence staining depicting an 8-month-old brain organoid. (a) β-tubulin III (red), CTIP2 (yellow), hoechst 33258 (blue). (b) GABA (green), hoechst 33258 (blue). (B) Dravet Syndrome (DS) brain organoid positioned on MEA. (C) Representative raw waveforms of an oscillation in control (a) and DS brain organoids (b). (DF) Alterations in (a) raw waveforms of spontaneous activities, (b) number of oscillations, and (c) maximum voltage (Max. voltage) in antiepileptic drug (AED) administration. Oscillation was identified in activity 30 min after AED administration, and changes in no. of oscillations and Max. voltage were assessed. Each analysis parameter was calculated and normalized with the vehicle data of each well as 100%. Each analytical parameter was evaluated using one-way ANOVA followed by the Holm–Bonferroni method (* p < 0.05, ** p < 0.01 vs. Vehicle, †† p < 0.01). Control (black). DS (red). (D) Carbamazepine. (E) Phenytoin. (F) Sodium valproate.
Organoids 02 00014 g001
Figure 2. Response of Dravet Syndrome brain organoids to CBZ using CMOS MEA. (A) Spontaneous activity voltage waveforms during oscillation. (B) CBZ administration response. (a) Number of active electrodes. Electrodes exhibiting maximum voltage above 100 μV during oscillation were categorized as active electrodes. Percentages were normalized to 100% for the vehicle condition. Statistical analysis employed one-way ANOVA and the Holm–Bonferroni method. (b) Ratio of oscillating electrodes to non-oscillating electrodes among active electrodes. The average waveform of all active electrodes during oscillation was designated as the oscillation waveform. Electrodes displaying a cosine similarity of 0.25 or higher to the oscillation waveform were classified as oscillating electrodes, while others were considered non-oscillating electrodes. Oscillation electrodes (red), non-oscillating electrodes (blue).
Organoids 02 00014 g002
Figure 3. Response of Dravet Syndrome and control brain organoids to antiepileptic drugs. (A) Spontaneous activity waveforms for each frequency band. From top: raw waveform, delta, theta, alpha, beta, gamma, high-gamma waveforms. Controls (left), DS (right). (B) Potentials for each frequency band. Oscillation was detected from spontaneous activity recordings (n = 17) of controls and DS organoids cultured for 5–6 months, and potentials were calculated for each frequency band. Statistical analysis was performed using one-way ANOVA and the Holm–Bonferroni method for each frequency band’s potential in controls and DS organoids (** p < 0.01). Controls (black), DS (red).
Organoids 02 00014 g003
Figure 4. Changes in frequency-dependent potentials in response to antiepileptic drugs. Controls (top row). DS (bottom row). Heatmaps illustrate the alterations in potential for each frequency band (CBZ: Controls n = 4, DS n = 6; PHT: Controls n = 4, DS n = 5; VPA: Controls n = 5, DS n = 6). Red indicates an increase, while blue indicates a decrease in comparison to the vehicle. Statistical analysis was conducted using one-way ANOVA and the Holm–Bonferroni method (* p < 0.05, ** p < 0.01 vs. Vehicle). In the control group, there was no oscillation when CBZ was administered at 300 μM.
Organoids 02 00014 g004
Disclaimer/Publisher’s Note: The statements, opinions and data contained in all publications are solely those of the individual author(s) and contributor(s) and not of MDPI and/or the editor(s). MDPI and/or the editor(s) disclaim responsibility for any injury to people or property resulting from any ideas, methods, instructions or products referred to in the content.

