Article

Beam Transmission (BTR) Software for Efficient Neutral Beam Injector Design and Tokamak Operation

by
Eugenia Dlougach
1,* and
Margarita Kichik
1,2
1
NRC Kurchatov Institute, Moscow 123182, Russia
2
Phystech School of Applied Mathematics and Computer Science, MIPT University, Dolgoprudny 141700, Russia
*
Author to whom correspondence should be addressed.
Software 2023, 2(4), 476-503; https://doi.org/10.3390/software2040022
Submission received: 25 August 2023 / Revised: 12 October 2023 / Accepted: 18 October 2023 / Published: 24 October 2023
(This article belongs to the Special Issue Software Analysis, Evolution, Maintenance and Visualization)

Abstract

:
BTR code (originally—“Beam Transmission and Re-ionization”, 1995) is used for Neutral Beam Injection (NBI) design; it is also applied to the injector system of ITER. In 2008, the BTR model was extended to include the beam interaction with plasmas and direct beam losses in tokamak. For many years, BTR has been widely used for various NBI designs for efficient heating and current drive in nuclear fusion devices for plasma scenario control and diagnostics. BTR analysis is especially important for ‘beam-driven’ fusion devices, such as fusion neutron source (FNS) tokamaks, since their operation depends on a high NBI input in non-inductive current drive and fusion yield. BTR calculates detailed power deposition maps and particle losses with an account of ionized beam fractions and background electromagnetic fields; these results are used for the overall NBI performance analysis. BTR code is open for public usage; it is fully interactive and supplied with an intuitive graphical user interface (GUI). The input configuration is flexibly adapted to any specific NBI geometry. High running speed and full control over the running options allow the user to perform multiple parametric runs on the fly. The paper describes the detailed physics of BTR, numerical methods, graphical user interface, and examples of BTR application. The code is still in evolution; basic support is available to all BTR users.

1. Introduction

NBI purposes and structure are discussed in detail in Section 2. Typical R&D studies of a neutral beamline, especially when addressing long pulse high-power operation, include a detailed evaluation of beam transmission and power deposition at the beam-facing surfaces [1,2]. The data sets are further used for thermal and structural analysis and finally define the engineering solutions to be adopted for the heat load removal and the entire injector design. However, during the final stage of NBI design with the geometry fixed, and also during NBI commissioning and operation in the experiment, power removal issues still persist, so the beam losses and deposition should be reviewed every time small elements need to be installed, or their position or inclination is changed, or physical conditions varied due the main device operation mode (e.g., tokamak magnetic field is different through scenarios). Further, the machine inaccuracies in different beamline units can lead to unacceptable beam losses and overheating as well as material sputtering, which deteriorates the overall NBI efficiency and plasma parameters in the machine.
The accelerated beam power for NBI can be very high: the peak power density across the beam cross-section can reach up to ~100 MW/m2, and hence, the source beam and beamline elements need to be adjusted with extremely high precision so that the intercepted power is minimized, and no surface is damaged due to insufficient cooling. Further, due to the tight space constraints of the main device (e.g., tokamak) configuration, a beamline design is made as compact as possible. The available space considerations result in a very long multi-parametrical optimization procedure, while NB design specifications with an account of cooling requirements tend to be increasingly complex. To minimize the efforts for NBI optimization and to reduce the beam losses and heat loads along the beamline, dedicated numerical tools are required. At present, the BTR code [3,4,5] is one of the most popular tools for NBI design and analysis [6,7,8,9,10,11,12,13,14,15,16].
The work on BTR software started during the conceptual and engineering design phases of the ITER project [17], so the results of BTR calculations can be found in the ITER Design and Description Document [18] issued in 2001. The 1st version of BTR-1, open for public usage, was released in 2005 when the source code moved to MS Visual C++; the earlier code versions were written in Borland Turbo Pascal 7 [19]. The successive BTR versions, including BTR-5, were developed under the aegis and with the active support of the ITER Organization. The primary code verification was organized by the ITER heating and current drive department (H&CD); however, the paper on BTR verification was not published at the appropriate time (2008), so BTR users outside of the ITER simply were unaware of the V&V document existence—and they could not refer to it when applying BTR.
BTR was intended to be maximum ‘user-friendly’; perhaps the feature that made the code especially popular (and this was especially rare among coding physicists some twenty years ago) was the interactive user interface—Windows ‘standard’ GUI—with built-in direct input control panel (so-called ‘Green Panel’), and rather primitive visualization which yet offers full control over the data input and the calculation process. Due to this equipment, BTR is often used for training in the field, like a primitive NBI flight simulator. BTR supports parallel multi-thread execution; the average running time is several minutes (for single-run mode), and the best performance is naturally observed on multi-core Windows machines. The data input is flexible and highly intuitive; the entire beam and investigated injector geometry can be easily tuned for any specific beamline design. The information on the code major upgrades (2005–2020) can be found online [3].
This paper introduces the basic principles of neutral beam injection and guides us through the BTR code’s main capabilities and limitations, which are applicable to any NBI design and implementation process. The final NBI system efficiency depends heavily on the simulation accuracy, as well as the simulation model’s consistency with a real physical environment. The paper is structured as follows:
  • NBI purposes, general structure, and efficiency concerns are brought up in Section 2.
  • BTR code basic features and GUI capabilities are represented in Section 3.
  • BTR scope and methods are discussed in Section 4.
  • Verification and validation (V&V) issues are considered in Section 5.
  • The software applications in various NBI designs are illustrated in Section 6.
  • The main conclusions and plans are manifested in the final Section 7.

2. NBI Purpose, Scheme and Structure

2.1. Neutral Injection Purpose

Neutral beam injection is essential for plasma heating, current drive, rotation, plasma operation control, and plasma diagnostics in devices with magnetically confined plasma like tokamaks and stellarators. High-energy neutral beams provide a great opportunity to enhance the operation space of each machine and handle the injected power and fast ion distributions in plasma volume. NBI is expected to be the main external source of high-energy particles and torque to maintain steady-state ‘beam-driven’ scenarios in fusion neutron sources (FNS) and hybrid reactors, which are based on a fully non-inductive current drive from NB (dominant fraction) and bootstrap current [20,21,22,23]. The FNS concept offers an attractive possibility to cope with many specific problems of fission nuclear power engineering as well as fusion power plants. While NBI purposes can be essentially different across multiple designs and applications, the main engineering issues and scope of tasks to be performed during any NBI development and implementation are similar via the beamlines.
NBI’s high efficiency of the current drive has been proved in experiments at many tokamaks, including JET, KSTAR, DIII-D, JT-60U, Globus-M, etc. [24,25]. The experiments have confirmed the feasibility of NBI usage as one of the basic additional heating techniques in the international ITER project. However, each NBI cell takes roughly the same space as the fusion device, and the complex design makes the entire NBI cost comparable with the cost of the fusion device. To keep the overall machine viability on an acceptable level, NBI systems should maximize the NBI beamline performance and ensure the component’s ability to withstand high heat loads during a long-pulsed (or steady-state) operation.
Over the past decades, the development of the NBI system for ITER has made it possible to develop and justify the techniques for beam formation, acceleration, and transport, providing an injection duration of up to 3600 s [1]. For the almost steady-state operation mode of the injector, many key issues of both the beam generation and the heat removal from all the loaded injector elements have been worked out in detail. It has been proved that the overall NBI system efficiency is mainly defined and limited by the neutralization output, i.e., the percentage of accelerated ions that can be transformed into atoms.

2.2. Neutral Injection Principles and Scheme

NBI’s main idea can be summarized as follows: Positively or negatively charged ions are extracted from a beam source (BS) and accelerated to a required voltage in a multi-grid multi-aperture electrostatic accelerator, so-called ion-optical system (IOS), where the last grid (electrode) is kept at ground potential and called grounded grid (GG). The source beam optimal energy (equal to the IOS accelerating voltage) is chosen to ensure the final neutral beam capacity to penetrate deeply to the plasma target; for reactor scale devices requiring NB energies of MeV level, only negative-ion-based neutral beams can be efficient. In fact, the optimal beam energy is also limited by the shine-through issue, as higher energy beams penetrate deeper, so they can damage the beam-facing surfaces of the tokamak camera if plasma is not dense enough. The accelerated ion beam from the BS is onward neutralized by charge exchange (positive ions) or electron stripping (negative ions) processes in a neutralization cell. The source ions neutralization is achieved via the beam passage through hydrogen gas or plasma, although other techniques can become available in the future, e.g., photon neutralization of the beam. A neutralizer with a gas target typically has a multi-channel design to minimize the gas flow required. Positive ions’ neutralization efficiency on gas drops with ion energy and becomes unacceptably low at higher beam energies [26,27], while the negative beam’s neutralization efficiency on gas is almost stable at ~60%. For smaller devices with a lower energy range, the usage of a positive ion scheme is more beneficial [28,29]. Downstream neutralization, the beam still contains unwanted residual charged beam fractions; the latter should be removed from the beam. For this purpose, a residual ion dump (RID) device is used, which can employ electrostatic or magnetic deflection of the ions.
The beamline basic components used throughout all NBI designs are very similar, with differences associated with the NB production scheme (positive or negative). An example of a neutral beamline design without transmission ducts is shown in Figure 1. ‘Conventional’ NBI beamline comprises the following ‘standard’ components [1,2]: an ion beam source (BS), a neutralizer, a residual ion dump (RID), a neutral beam dump, or calorimeter, and beam transmission ducts. The source beam passes through a neutralizer and RID and then proceeds through an exit scraper located at the exit of the beamline vessel. The RID structure is typically chosen consistent with that of the neutralizer and formed using the same number of channels for beam passage. The channel structure of NBI components (neutralizer and RID) is optimal for gas supply and pumping.
The injector is connected to the tokamak vacuum chamber via a dedicated pipeline for beam passage. Downstream the NBI vessel, the neutral beam propagates to plasma through the beam transmission ducts, which are supplied with additional cooled boxes (liners) inside. In fact, there can be many elements located between the vessel and the transmission ducts (see Figure 1), like a fast shutter, absolute valve, connection modules, bellow joints, and other systems, as they accept the direct neutral beam power they are often addressed as front-end components (FEC). The transmission pipeline can be complex enough (see Figure 2) and includes several duct modules. The outer duct pipeline (beyond the tokamak vacuum chamber) is formed using a sequence of channels (duct modules), which can be equipped by the water-cooled liners. The inner part (within the tokamak chamber) is formed by the tokamak blanket elements.
The extremely tight arrangement of the tokamak systems, which include the magnetic field coils, shield, and support structures, lead to a relatively small aperture size available for beam input to plasma; the latter issue, together with a long transmission line distance, dictate severe limits overall NBI design requirements. These requirements implicate high precision for beam steering and focusing, as well as all the beamline channels manufacturing and alignment (fine tuning), which would ensure minimum power losses and maximum NBI efficiency for long-term operation.

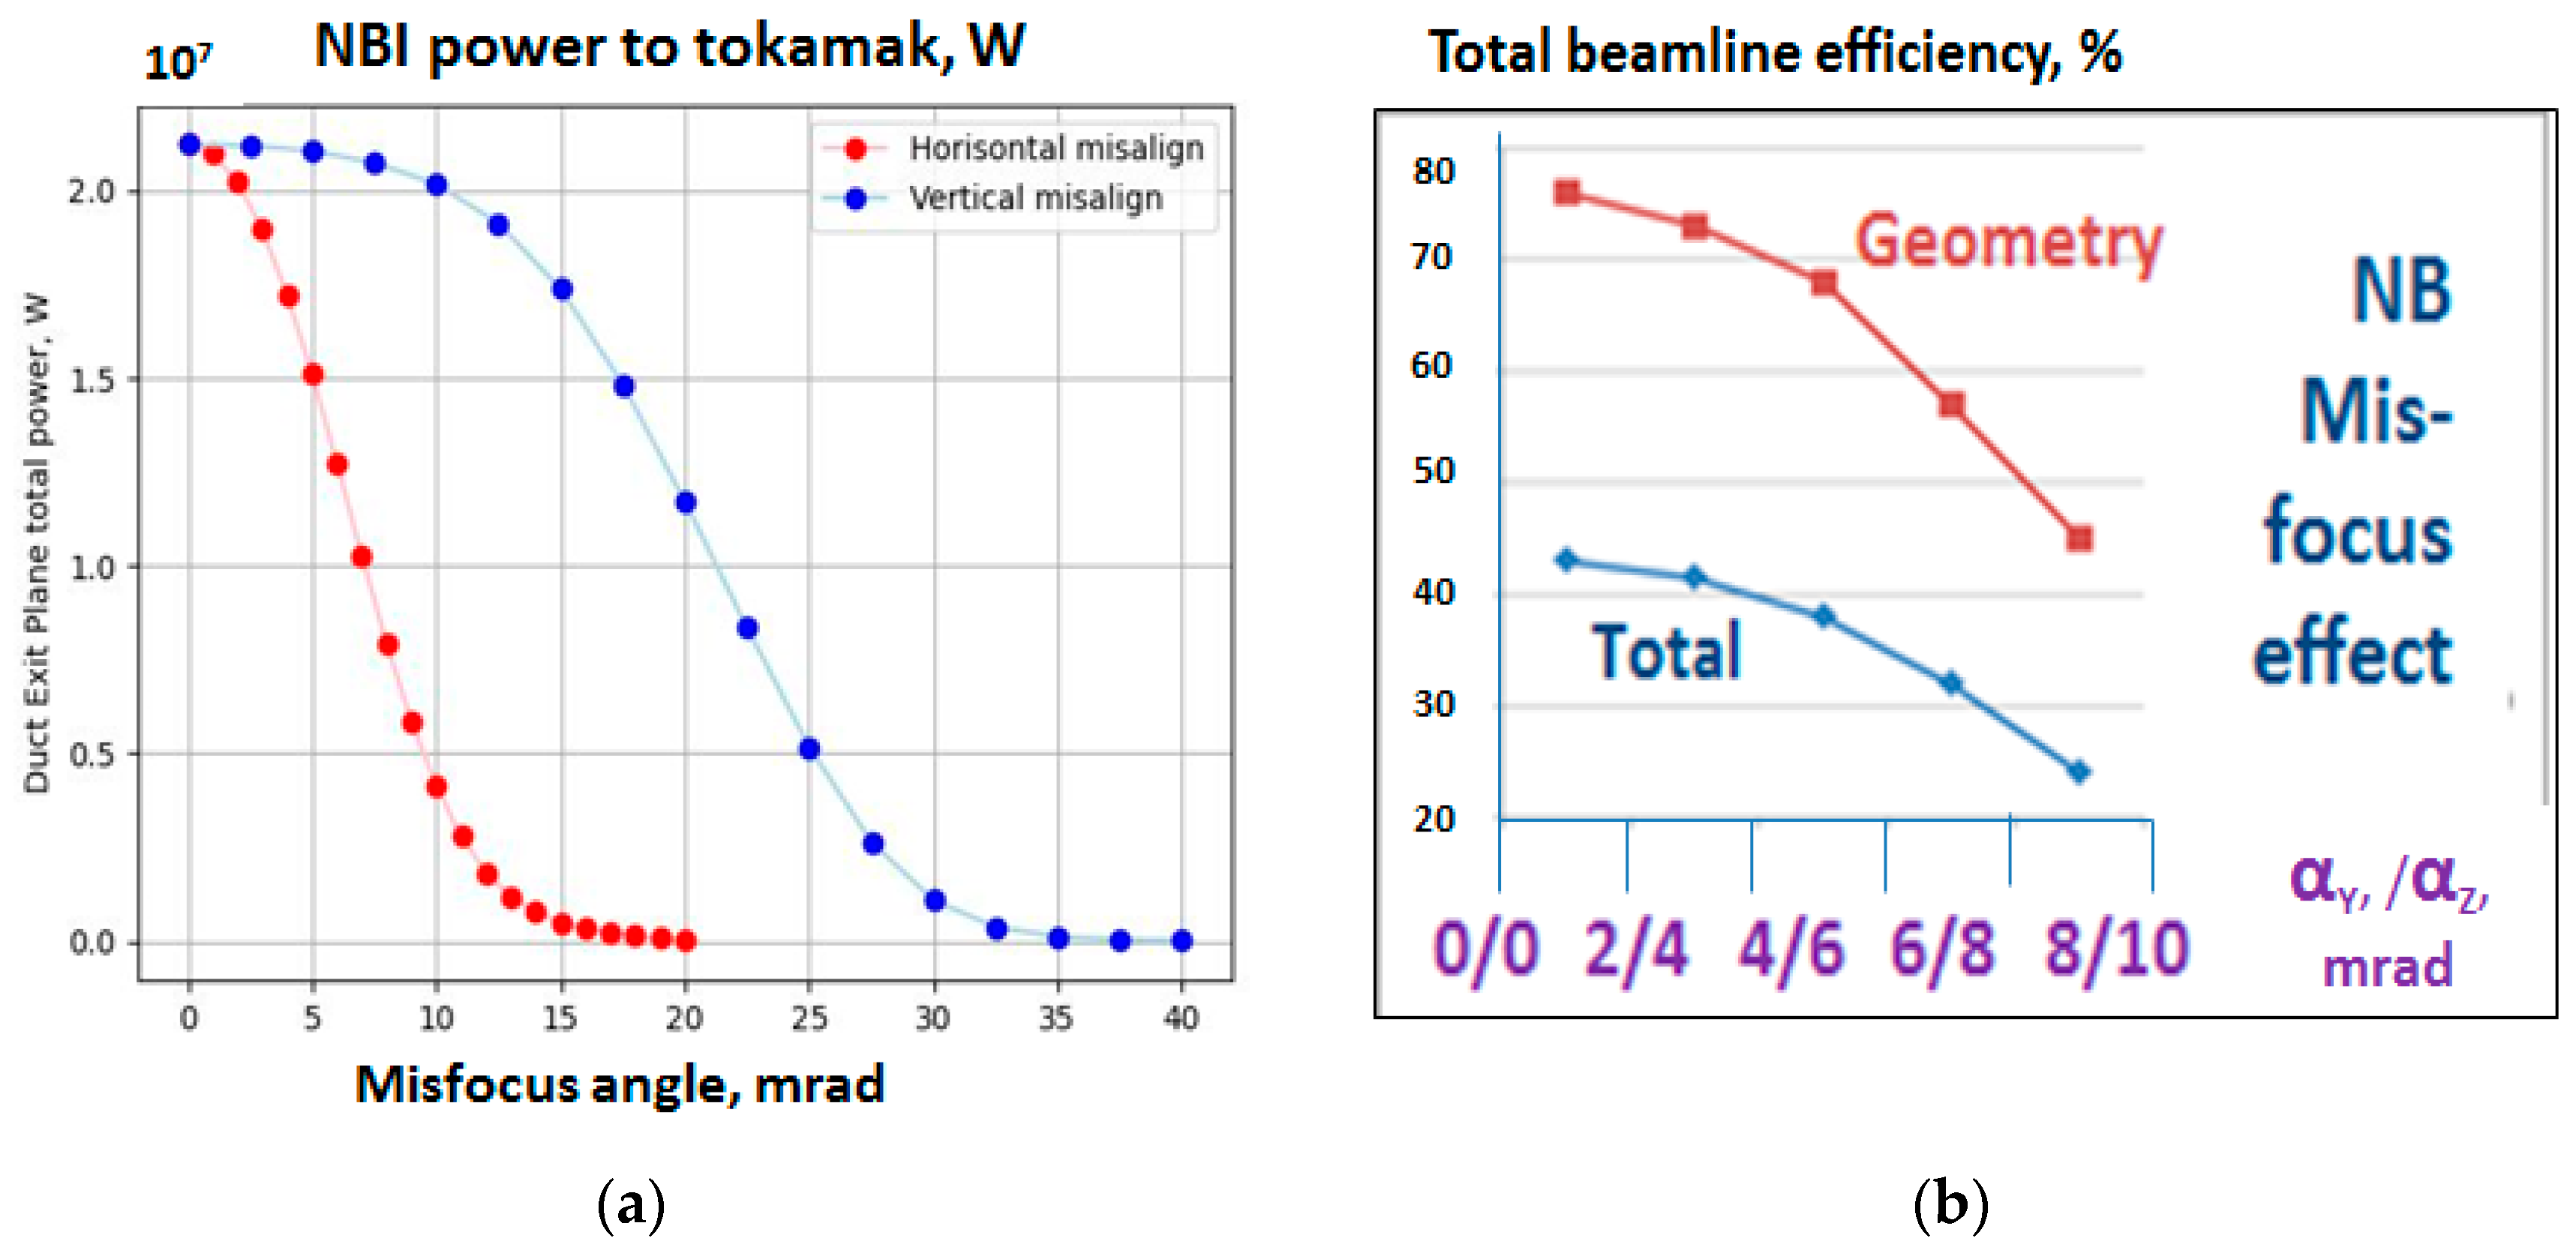
2.3. Neutral Beamline Losses and Efficiency

While NBI targets and schemes can vary using different fusion designs, the engineering issues and, therefore, the routines to be performed during beamline development, commissioning, and operation is similar. These routines, especially for the design addressing a long pulse high-power operation, typically include accurate simulations of beam generation and propagation in a ‘realistic’ (reconstructed) environment, with beam power losses and thermal load deposition along the injector components; these are performed for the entire range of possible working scenarios. The beam power interception by beamline components’ surfaces can lead to unaffordable (over-critical) high power fluxes, and this justifies the need for high-fidelity beam simulations, which can be further used as a base for thermo-mechanical study—for the design of cooling systems and for power facing components, even for small elements like bolt joints. Thermal power distributions obtained using NBI simulation are next applied to thermo-mechanical and structural study, which finally defines the entire NBI design meeting the heat-removal requirements. Additionally, with any minor change in the beamline design or operation conditions (like gas flow or magnetic field) or in case the experimental data disagrees with initial assumptions, the power load calculations and major thermal analysis review can be essential [30,31]. Since the injector geometry is usually restricted by the tokamak systems and the injection port dimensions (see Section 2.2), the beamline design optimization and numerical testing routines are often complex and time-consuming.
While the overall NBI system efficiency is mainly defined and limited by the neutralization output (see Section 2.1), the beam angular properties (divergence and focusing) together with beamline geometrical transmission play a major role in the neutral beam losses and neutral power reduction before the beam reaches the tokamak plasma.
The beam angular divergence depends on the beam source plasma discharge operation [1,32]—with the optimal operating point (minimal divergence) corresponding to the maximum value of ion beam perveance. Operating away from this point generally leads to the beam’s angular widening. The beam angular width is also sensitive to the shape of the apertures and their arrangement on electrodes: the circular apertures produce elementary beams (so-called ‘beamlets’) with axially symmetrical angular divergence, while for the slit-type IOS electrodes, the beam width across the slits can be 2–3 times higher than along the slits. The beam divergence optimization and monitoring can be performed by a V-shape calorimeter during NBI commissioning. Beamlet group arrangement at GG and beamlet axes’ initial focusing should also be tied with the expected value of the beam divergence and beamline channels structure; this typically leads to a combined focusing: GG sections are inclined as a whole to hit the target opening in tokamak chamber, while the beamlets within each channel are focused at a shorter distance, which depends on the expected beamlet divergence; this approach leads to maximum beam transmission via the limited beamline channels cross-section. Figure 3 shows the beamlets focusing on the FNS-ST neutral beamline compact design (which has one vertical channel).
The effect of the source particle distribution in space and angle, which is associated with beamlet structure, internal divergence, and axis inclinations, is clearly observed in Figure 4a,b.
The stray electromagnetic field from tokamak, if not reduced to acceptable values, deflects the source ions from their nominal straightforward direction. The IOS high precision focusing can be violated due to many reasons. These factors cause the neutral beam to have higher interception and additional scattering in velocity space. Finally, when the neutral beam propagates along the long transmission line and ducts, secondary ions are born due to the neutral particle ionization on the background (residual) gas; this process leads to additional beam losses and charged power fluxes onto the beamline surfaces.
High-fidelity power flux simulation with an account of background fields is essential not only for the NBI design optimization but it is also critical for the injected beam power deposition in plasma. The injected beam particle capture, and behavior highly depend on the injected beam angular distribution, while the beam-plasma effects and overall NB performance in tokamak should be governed by the initial fast particle (NBI-driven) source distribution in phase space. However, the latter issue is often underestimated, despite the well-known pitch-angle effect, which is the fast ions angular distribution versus the magnetic field, on the entire beam performance in plasma [33]. Using variation of the fast ion source distribution in space and velocity, plasma current, pressure, and toroidal rotation in tokamak can be efficiently controlled by several neutral beam injectors.
As the source beam has a finite angular width (can be ≤15 mrad, depending on the BS scheme), the simplest way to improve the transmission is to make the beam path as short as possible. However, the duct length is defined using the tokamak systems configuration and takes roughly half of the entire beamline length. For example, the internal duct length in ITER HNB is ~13 m, while the entire beamline (from GG) is ~26 m.
The next possible solution is to reduce the neutralization length, RID, and beam dump length. However, the neutralizer length, its channel width, and the gaps between the components are coupled with the gas flow rates and pumping capacity to ensure the optimum neutralization target. In a gas neutralizer, the gas flow is defined using the target thickness needed. For reduced neutralizer length and fixed channel width, the gas throughput within the neutralization region grows, which leads to higher gas fluxes to BS and RID and additional beam losses (due to beam collisions with gas). To reduce the gas flow from the neutralizer, it can be divided into even more sub-channels, but this will enhance the source beam direct interception and increase the structural complexity of the injector’s already complicated design. The dimensions of other NBI components (RID and beam dump) are limited mainly using the high-power load and local power density from the intercepted beam fractions and by the cooling capacity, too. This example is only a small illustration of the idea behind beamline optimization: the optimum beamline design should be consistent with efficient beam production, ensure the lowest possible beam losses, and cope with the heat load accepted during the long or steady-state operation.
We assume the total beamline efficiency (i.e., the ratio of injected neutral power to the source beam power) is mainly defined by the beam neutralization efficiency and the beam geometrical transmission. The actual beam divergence, in many cases, is unknown. For example, the ITER design document [18] adopts three nominal values of negative ion beam (D) core divergence: 3 mrad, 5 mrad, and 7 mrad; further, according to experiments, the beam core (85% of extracted current) is accompanied by a higher divergent (~30 mrad) current fraction— ‘halo’, which carry ~15% of current. The beamline geometrical transmission for 3–7 mrad beams can vary from 70% to 90%, leading to the total beamline efficiency of 35–50%.
With the best affordable source beam neutralization efficiency (on gas or plasma target) and with optimized beamline geometrical transmission, the injected power to plasma can hardly exceed ~40–45% of the power in accelerated source ions. The final efficiency of the beamline scheme will highly depend on the actual values of source beam divergence, which are to be defined experimentally, and on the deflections of the source ions caused by external electromagnetic fields.

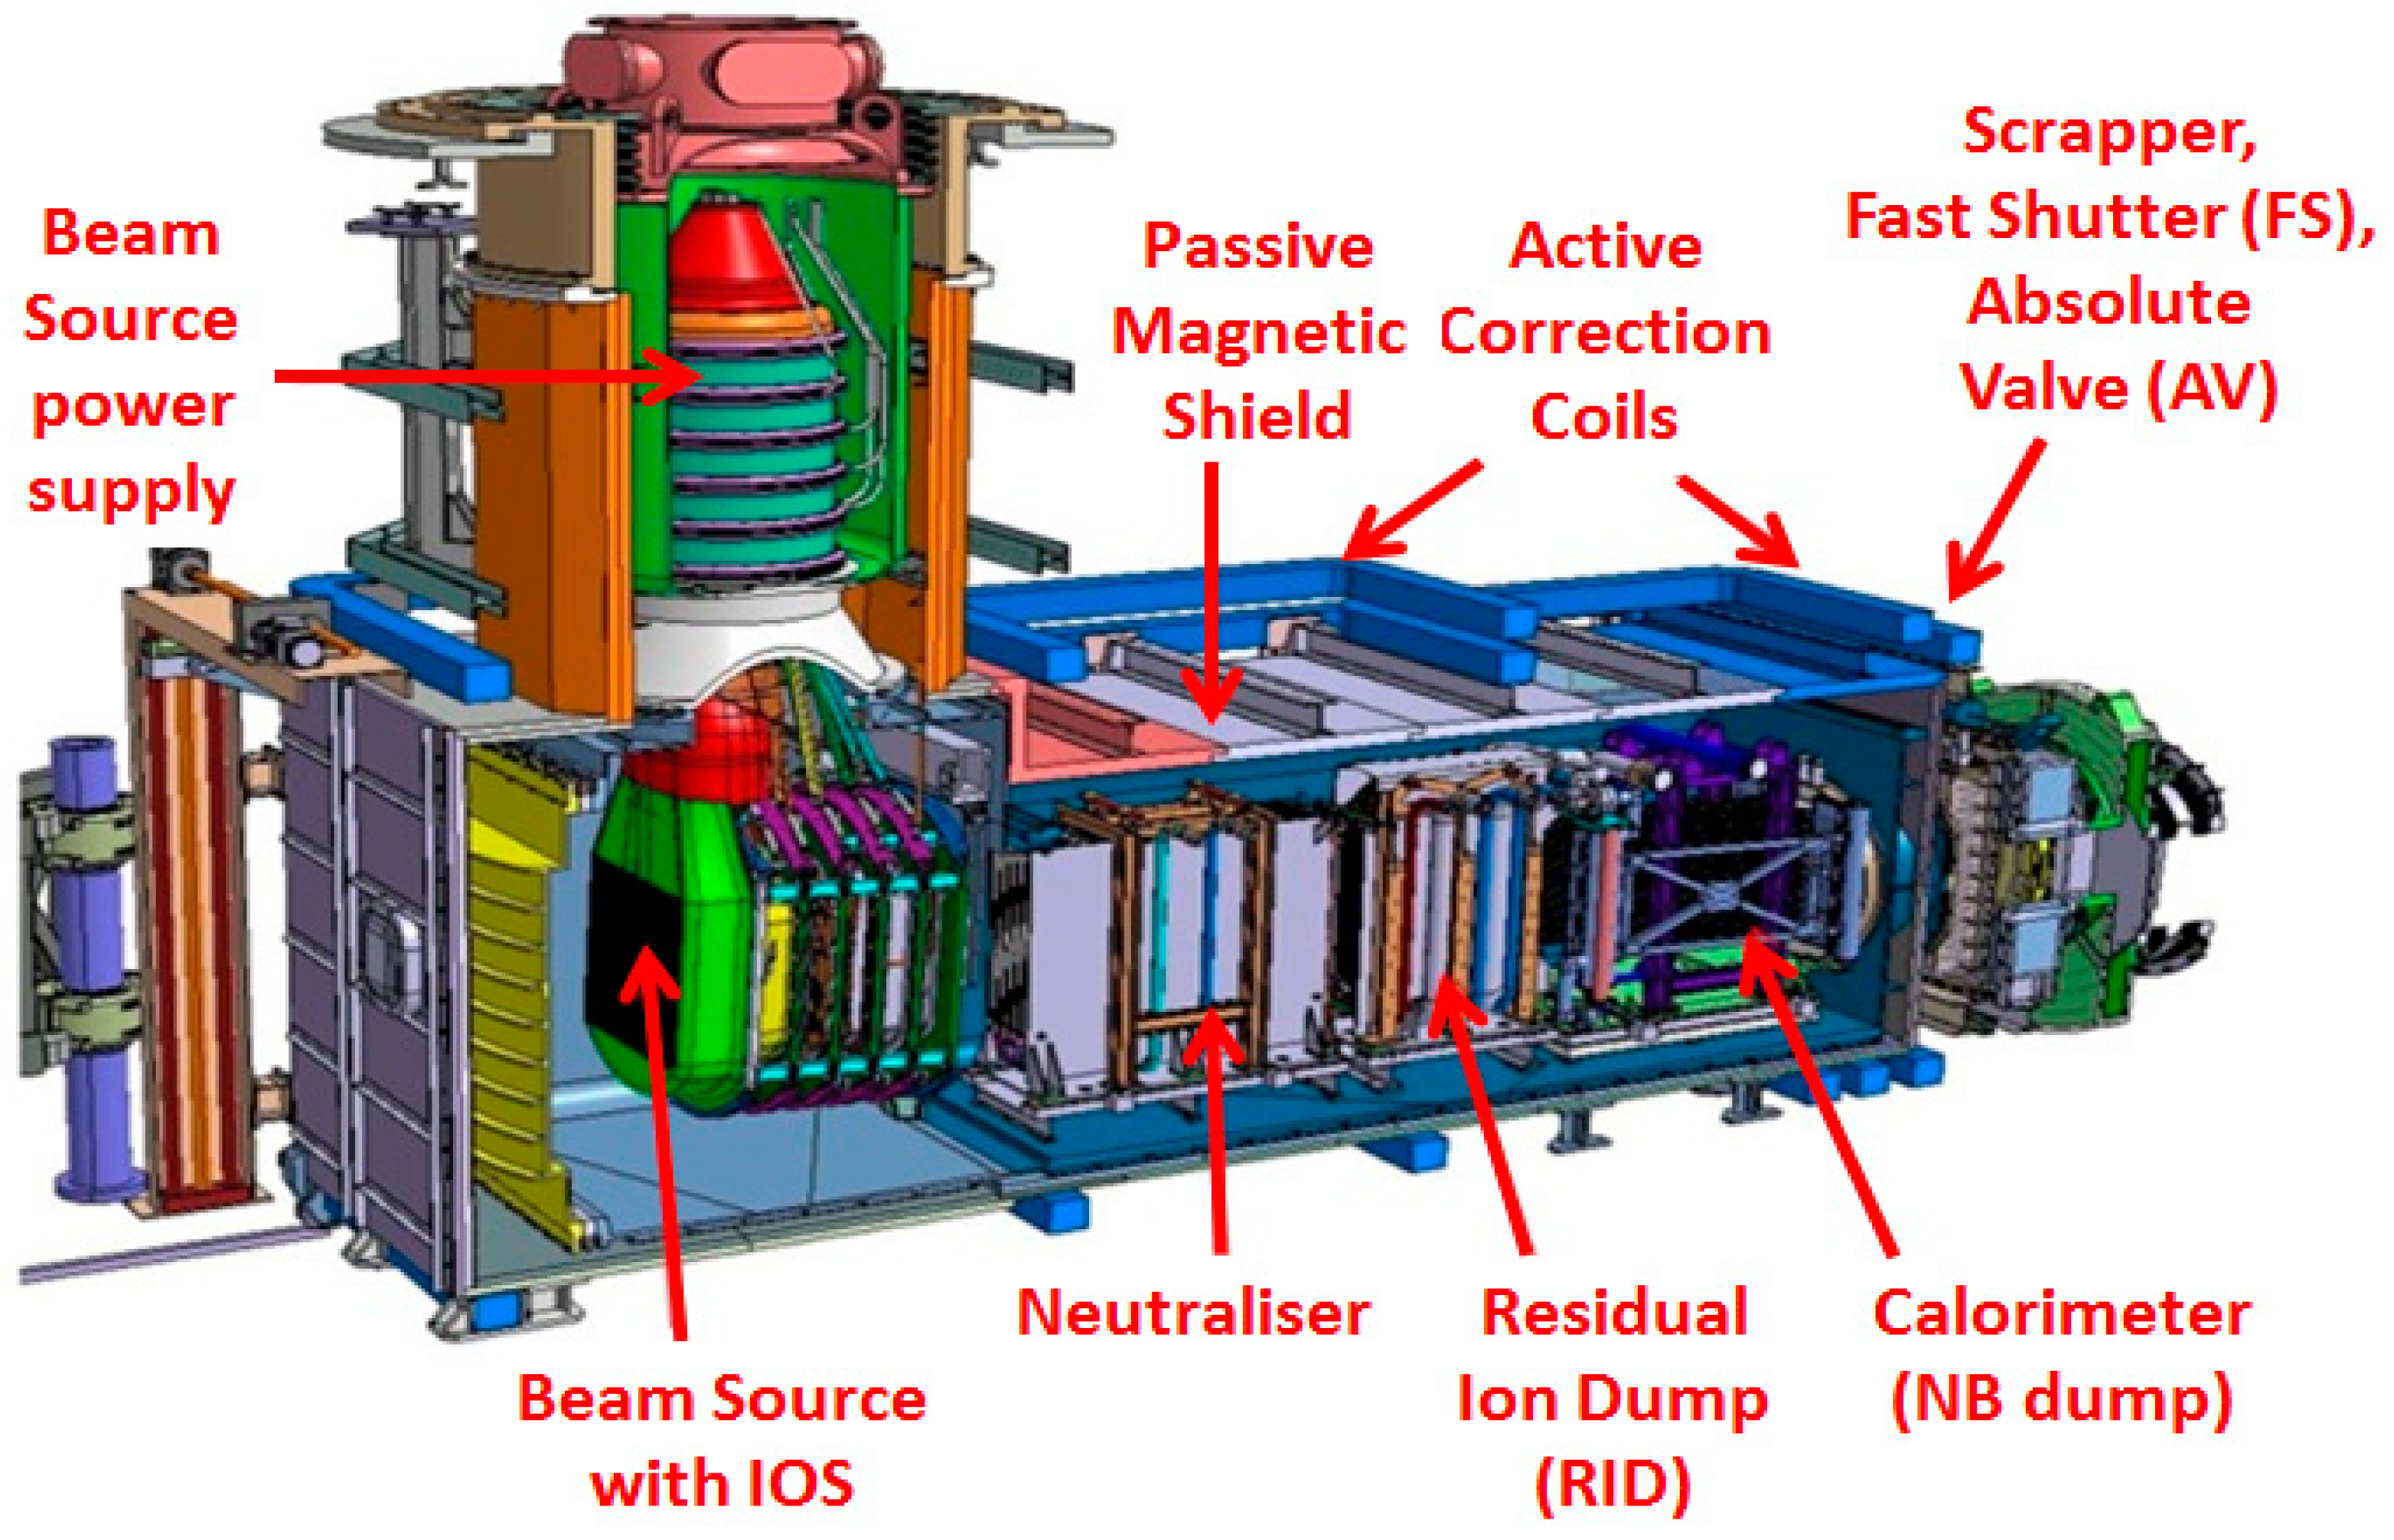
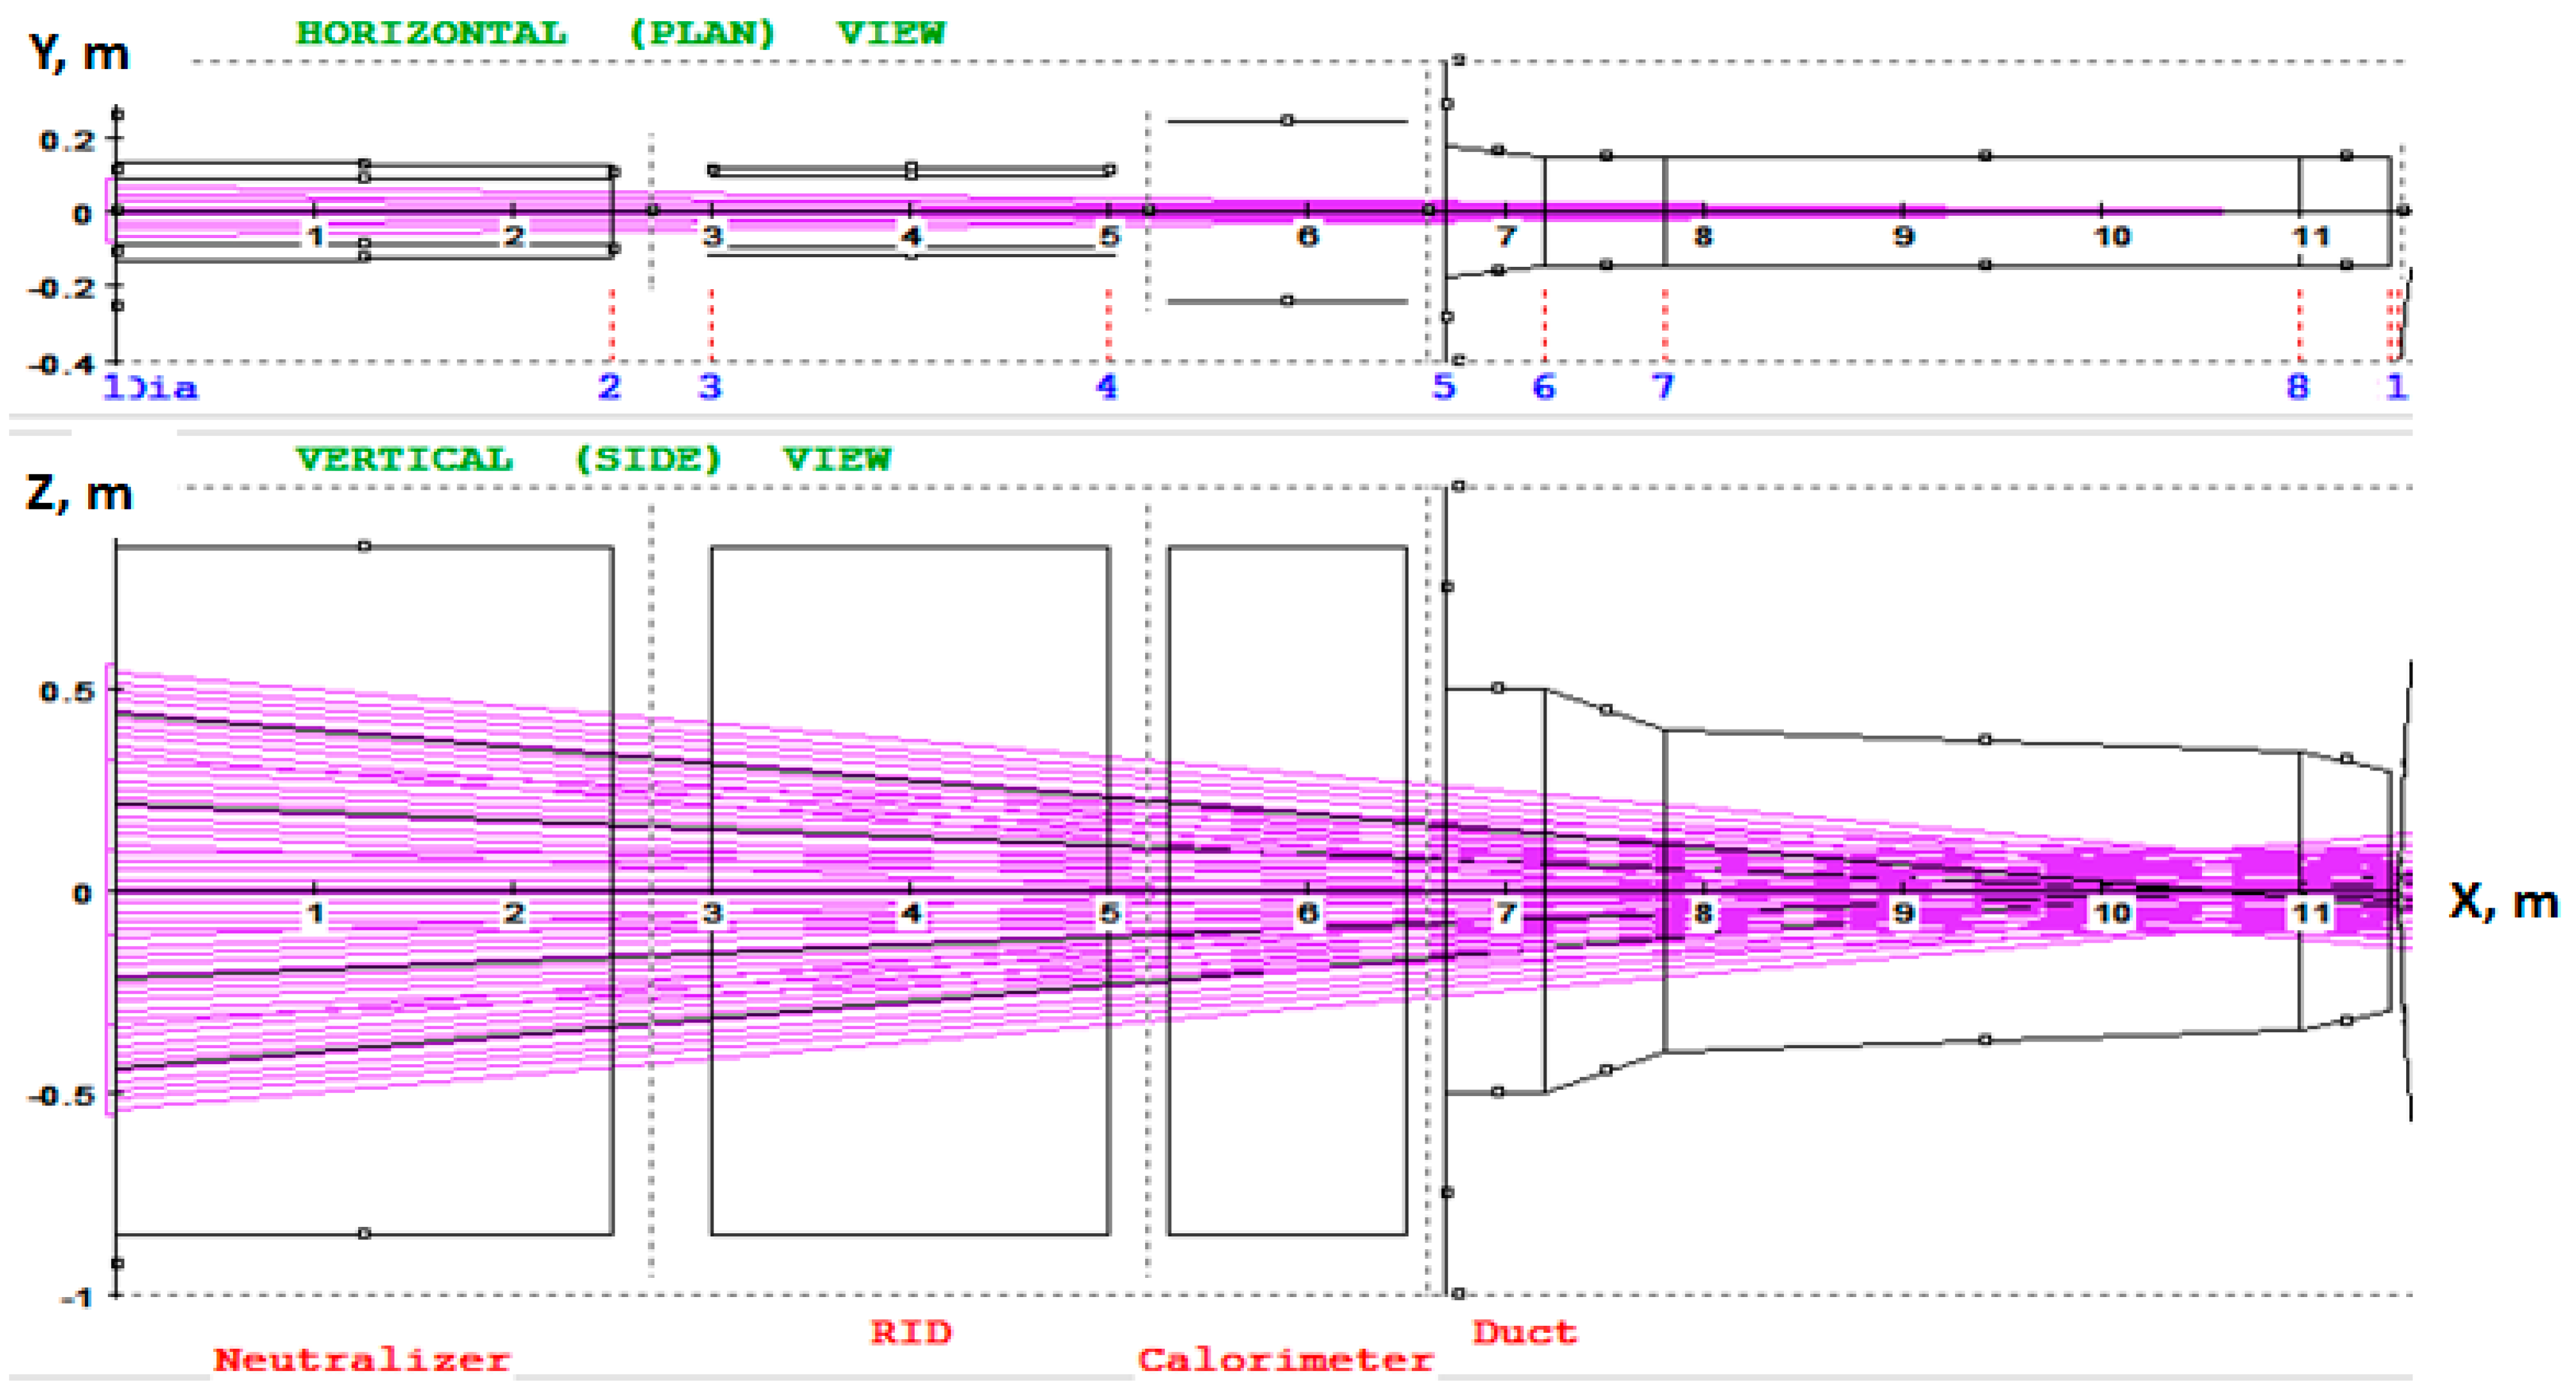
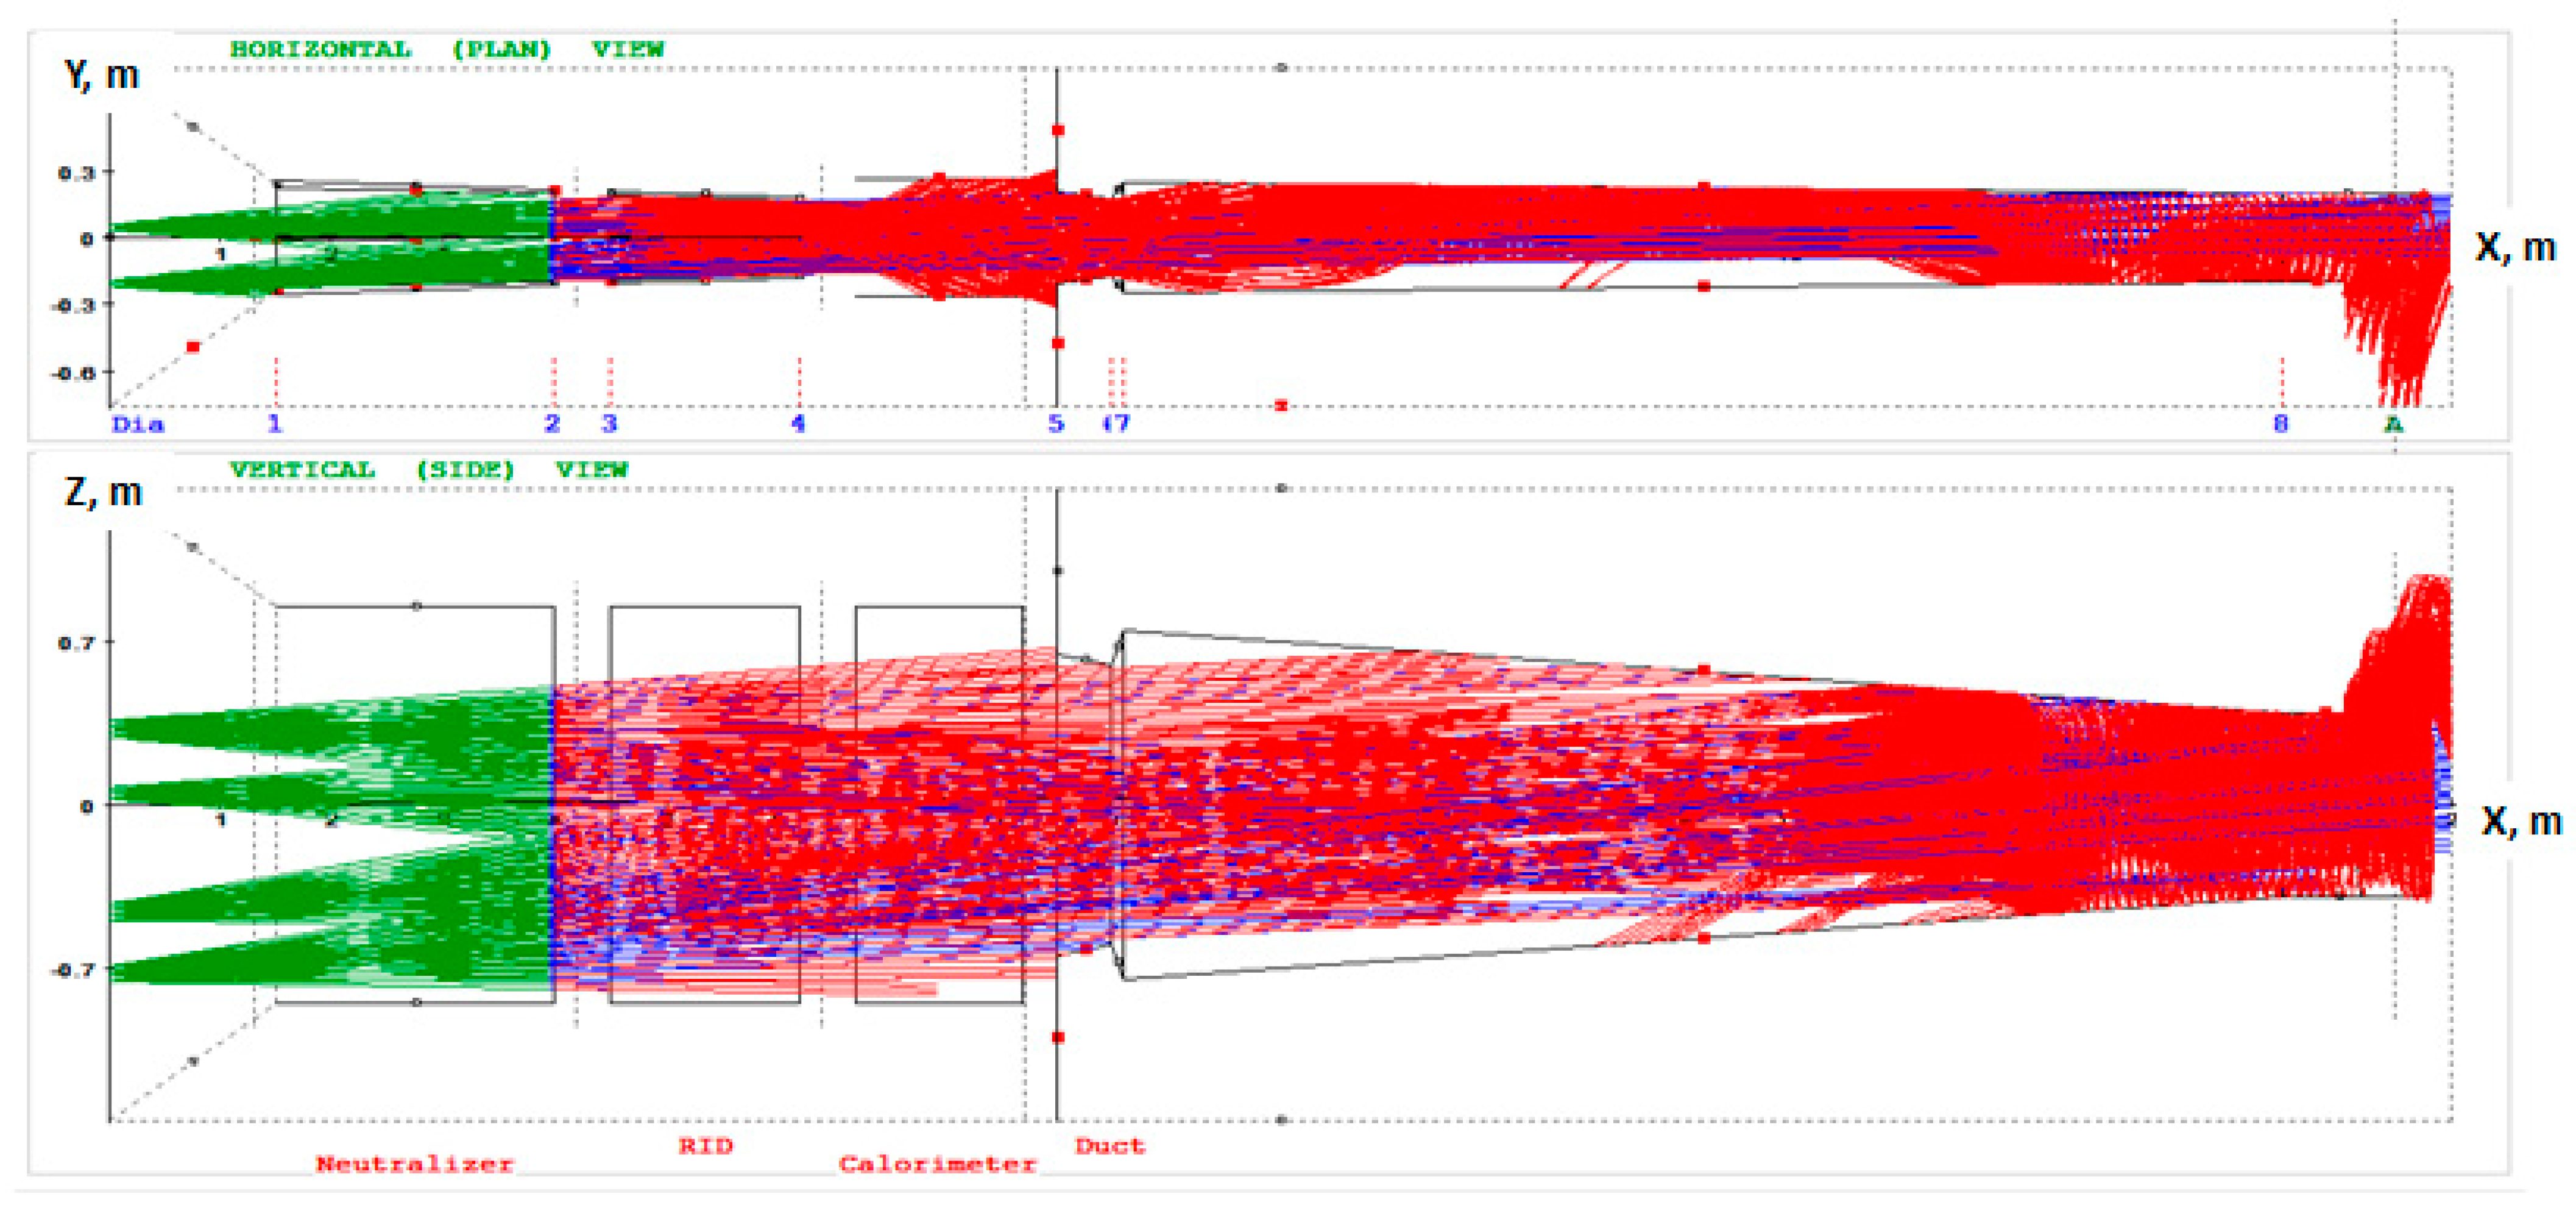
2.4. Neutral Beamline Geometry in BTR

Examples of complex NBI layouts are not provided in this paper, but they can be easily found in [1,2] for ITER neutral beam injectors and in [16,28,29] for other tokamak designs. Based on this typical layout, the default beamline input, or BTR ‘standard’ geometry, consists of the following major components, see Figure 1 and Figure 2:
-
the beam source grounded grid (GG),
-
multi-channel (can be single channel) neutralizer,
-
residual ion dump, RID (multi- or single channel),
-
neutral beam dump, or calorimeter,
-
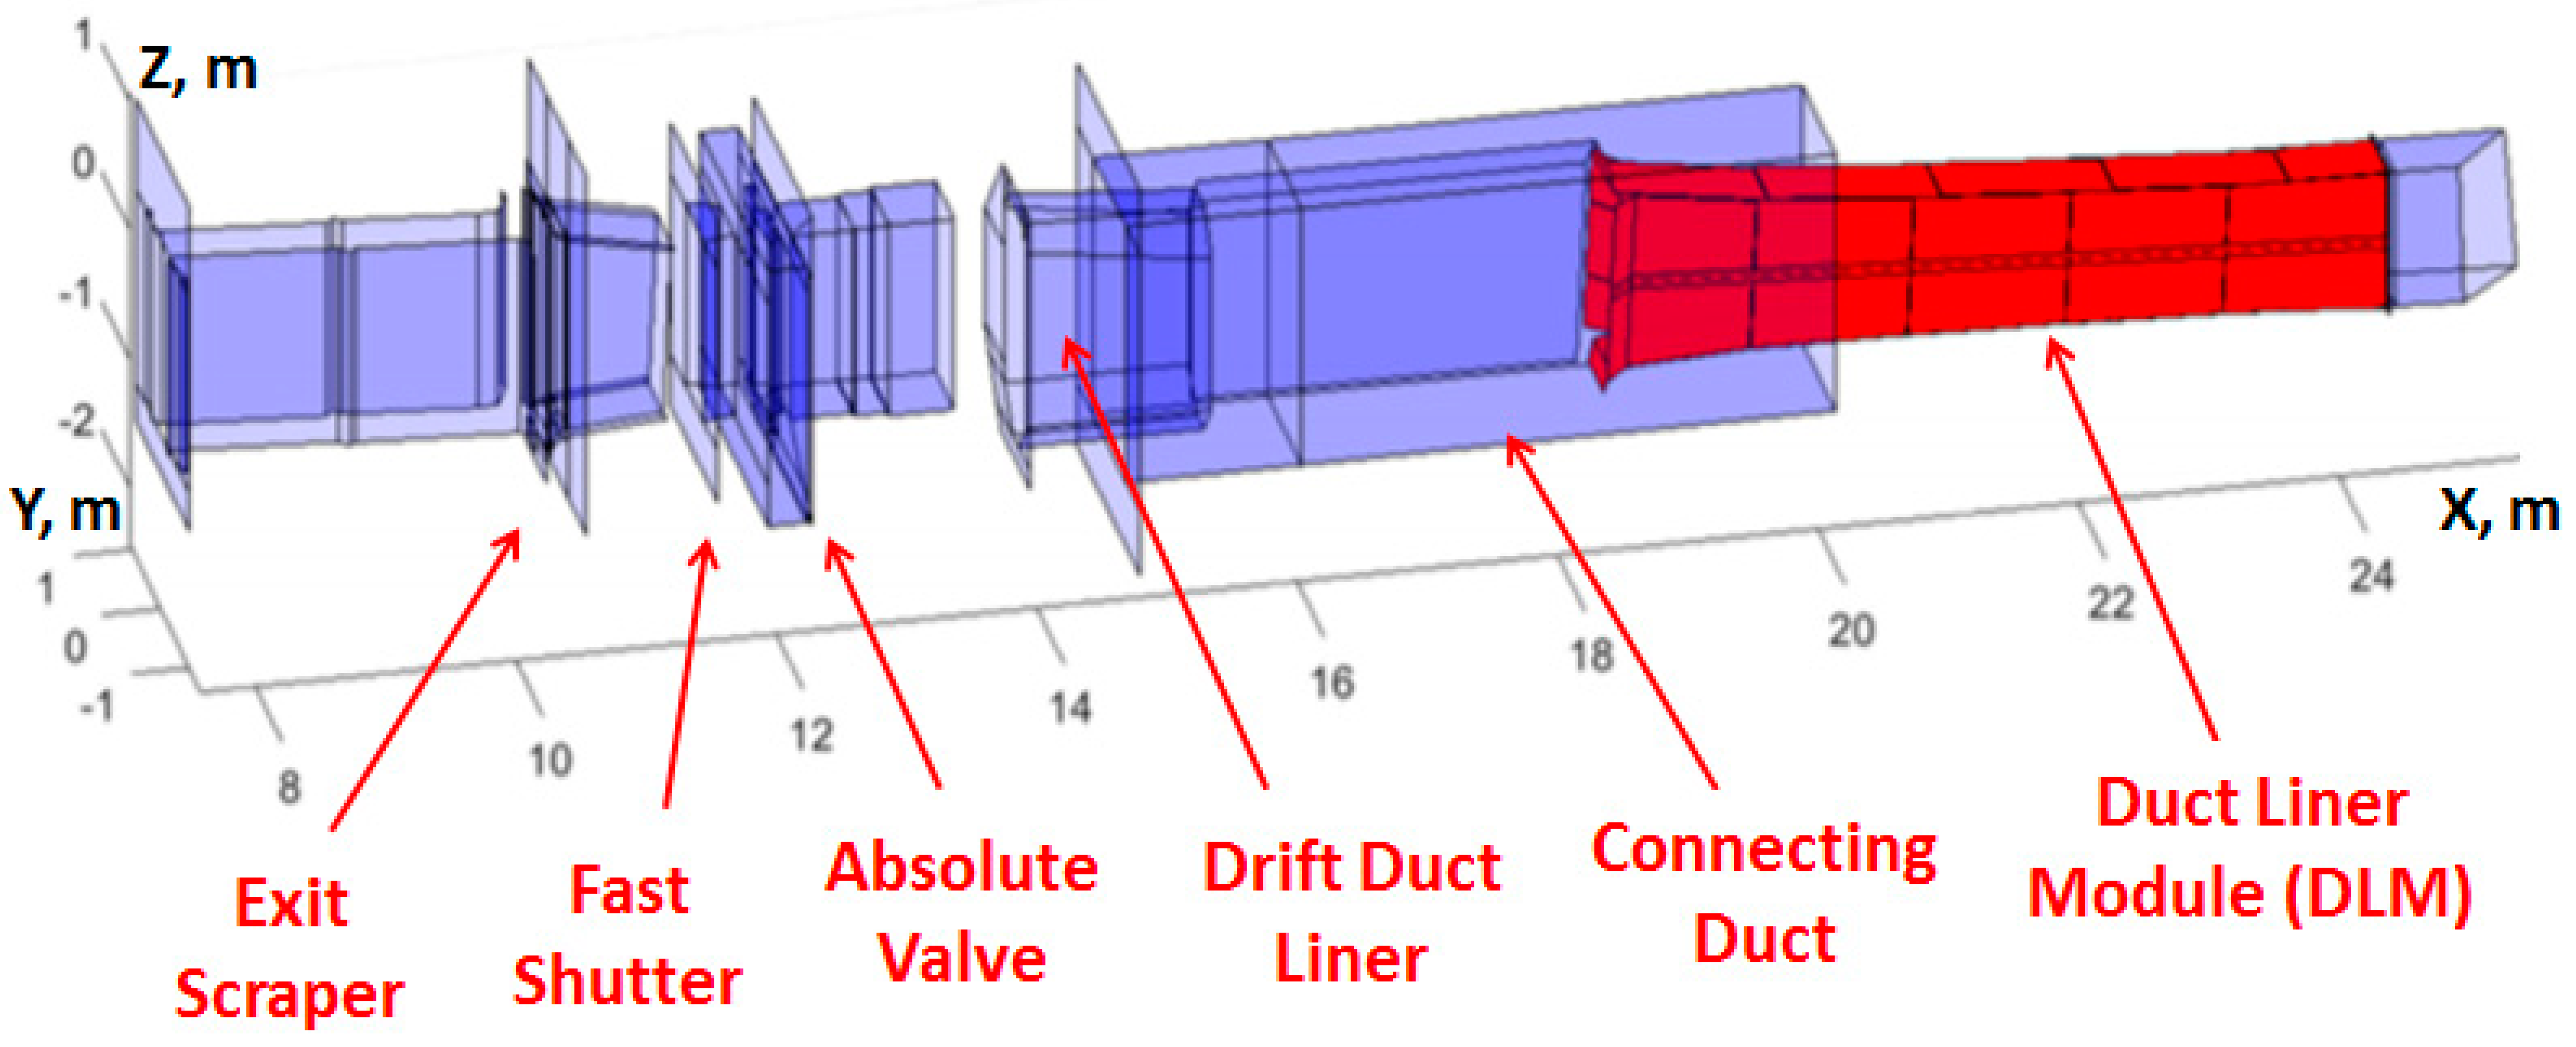
beam transmission line, or duct, which consists of multiple modules (scrapers, FEC, liners, blanket sections, etc.).
In addition to the ‘standard’ input option, BTR allows the user to specify the list of ‘free surfaces’, which can better reproduce in more detail the beamline geometry. Free surfaces can be created either directly by the interactive input tools (GUI dialogs) or imported as text files, created manually or with dedicated software (CAD).
The beam geometry is defined as a regular array of ‘beamlets’ (elementary pencil beams), which are emitted at the BS GG plane; to be more exact, they are extracted and accelerated before GG, but BTR considers the beamlet to start at the GG plane. A beamlet is a current cone emitted from a single aperture (GG slots can be modeled as a row of close apertures) and characterized by normal angular dispersion (divergence, or half-width of 1/e decay of amplitude) around the beamlet axis. If the NBI scheme is based on a positive ion source (PIS), the source beam has different angular widths in horizontal and vertical planes due to the horizontally elongated multi-slot structure of acceleration grids. Typical horizontal and vertical widths for PIS are 7–10 and 15–20 mrad, respectively. The beamlet angular structure is more complicated and less defined [1] for the injectors based on negative ion sources (NIS). Experiments show the beamlets extracted from the ion source consist of 2 fractions: core part (85%) and ‘halo’ (with ≈15% of current) with a divergence much higher (~30 mrad) than the beamlet core part. The characteristics of the beam from the negative ion source are still to be confirmed; therefore, for design purposes, the assumptions are made based on existing experimental data. For example, for ITER beamlines design for beam duration 1 h, three values of beamlet divergence are investigated, i.e., 3, 5, or 7 mrad with 15% of the power in each beamlet carried by a halo fraction with a divergence of 30 mrad.
The beamlets’ start positions are arranged in clusters (or BS segments or groups) according to the GG structure shown in Figure 3 (FNS-ST NBI), while the source particles distribution in space and angle are illustrated in Figure 4a (FNS-ST NBI). Standard beamlet optics is a combination of beam source groups’ steering at the injected window (NB port) center and individual beamlet axes focusing within each group in a horizontal plane—for optimal beam propagation through vertically elongated NBI channels. Finally, the entire beam envelope is inclined or tilted (as in ITER HNB, [1])—to hit the specific tangential point in plasma and to switch between on-axis and off-axis injection with relation to the main plasma axis. For NBI design purposes, it is assumed that due to the beam focusing errors, the beamlets can deviate from their optimum axes in horizontal and vertical planes or ‘misaligned’; e.g., ITER design assumes the misfocusing tolerances ±2 mrad in horizontal and ±4 mrad in vertical plane, respectively.
The example of NBI geometry and the source beam, as they appear on the BTR screen, is shown in Figure 5.

3. BTR Basic Features and GUI

3.1. BTR General Info

BTR code name is about ‘Beam Transmission (or sometimes ‘Beam Transport’) with Re-ionization’. To be short, BTR calculates the beam evolution and losses along beamlines, with an account of the electromagnetic field environment and the beam interactions with gas or plasma background. The beamline 3D geometry, the beam structure and focus, and the environment form BTR input. The main BTR output consists of the 2D arrays of power density accepted by the beamline solid components and/or passed through ‘virtual’ planes (also called power load footprints). The footprints can be shown and saved as color images or in text data.
BTR simulations cover practically all known NBI designs, either simple or complicated source beam geometry. A “beamlet-based” beam structure is a large set of elementary cone-shaped beams. Channel-based beamline geometry is formed by a large set of rectangular surfaces, which can be user-defined from the direct input tool—or imported all together or partially from CAD software (as text format). At the end of each BTR single-run (from a few seconds to a few hours, depending on the user’s claims), the heat load images and the beam power footprints for any requested surface (solid or virtual) are available, and the beam losses from various loss-channels are reported.
The Multi-Run version (BTR-5, 2020) allows automatic scenario-based restart of calculations and provides an additional Summary Report after the whole session; this feature considerably reduces user efforts and time spent on matching the beamline optimization and fine-tuning all the components. The later versions of the code are also used for the optimization of beam capture in plasma. All numerical methods used by BTR are the most simple and straightforward; they are easily verified analytically; we call them briefly ‘lite neutral beam’, LNB. The important implication of LNB and BTR code availability is that verification of more sophisticated NBI models can be made by means of BTR, e.g., BTR was used for cross-checking with the SAMANTHA code [13], which applies the Monte Carlo beam model.

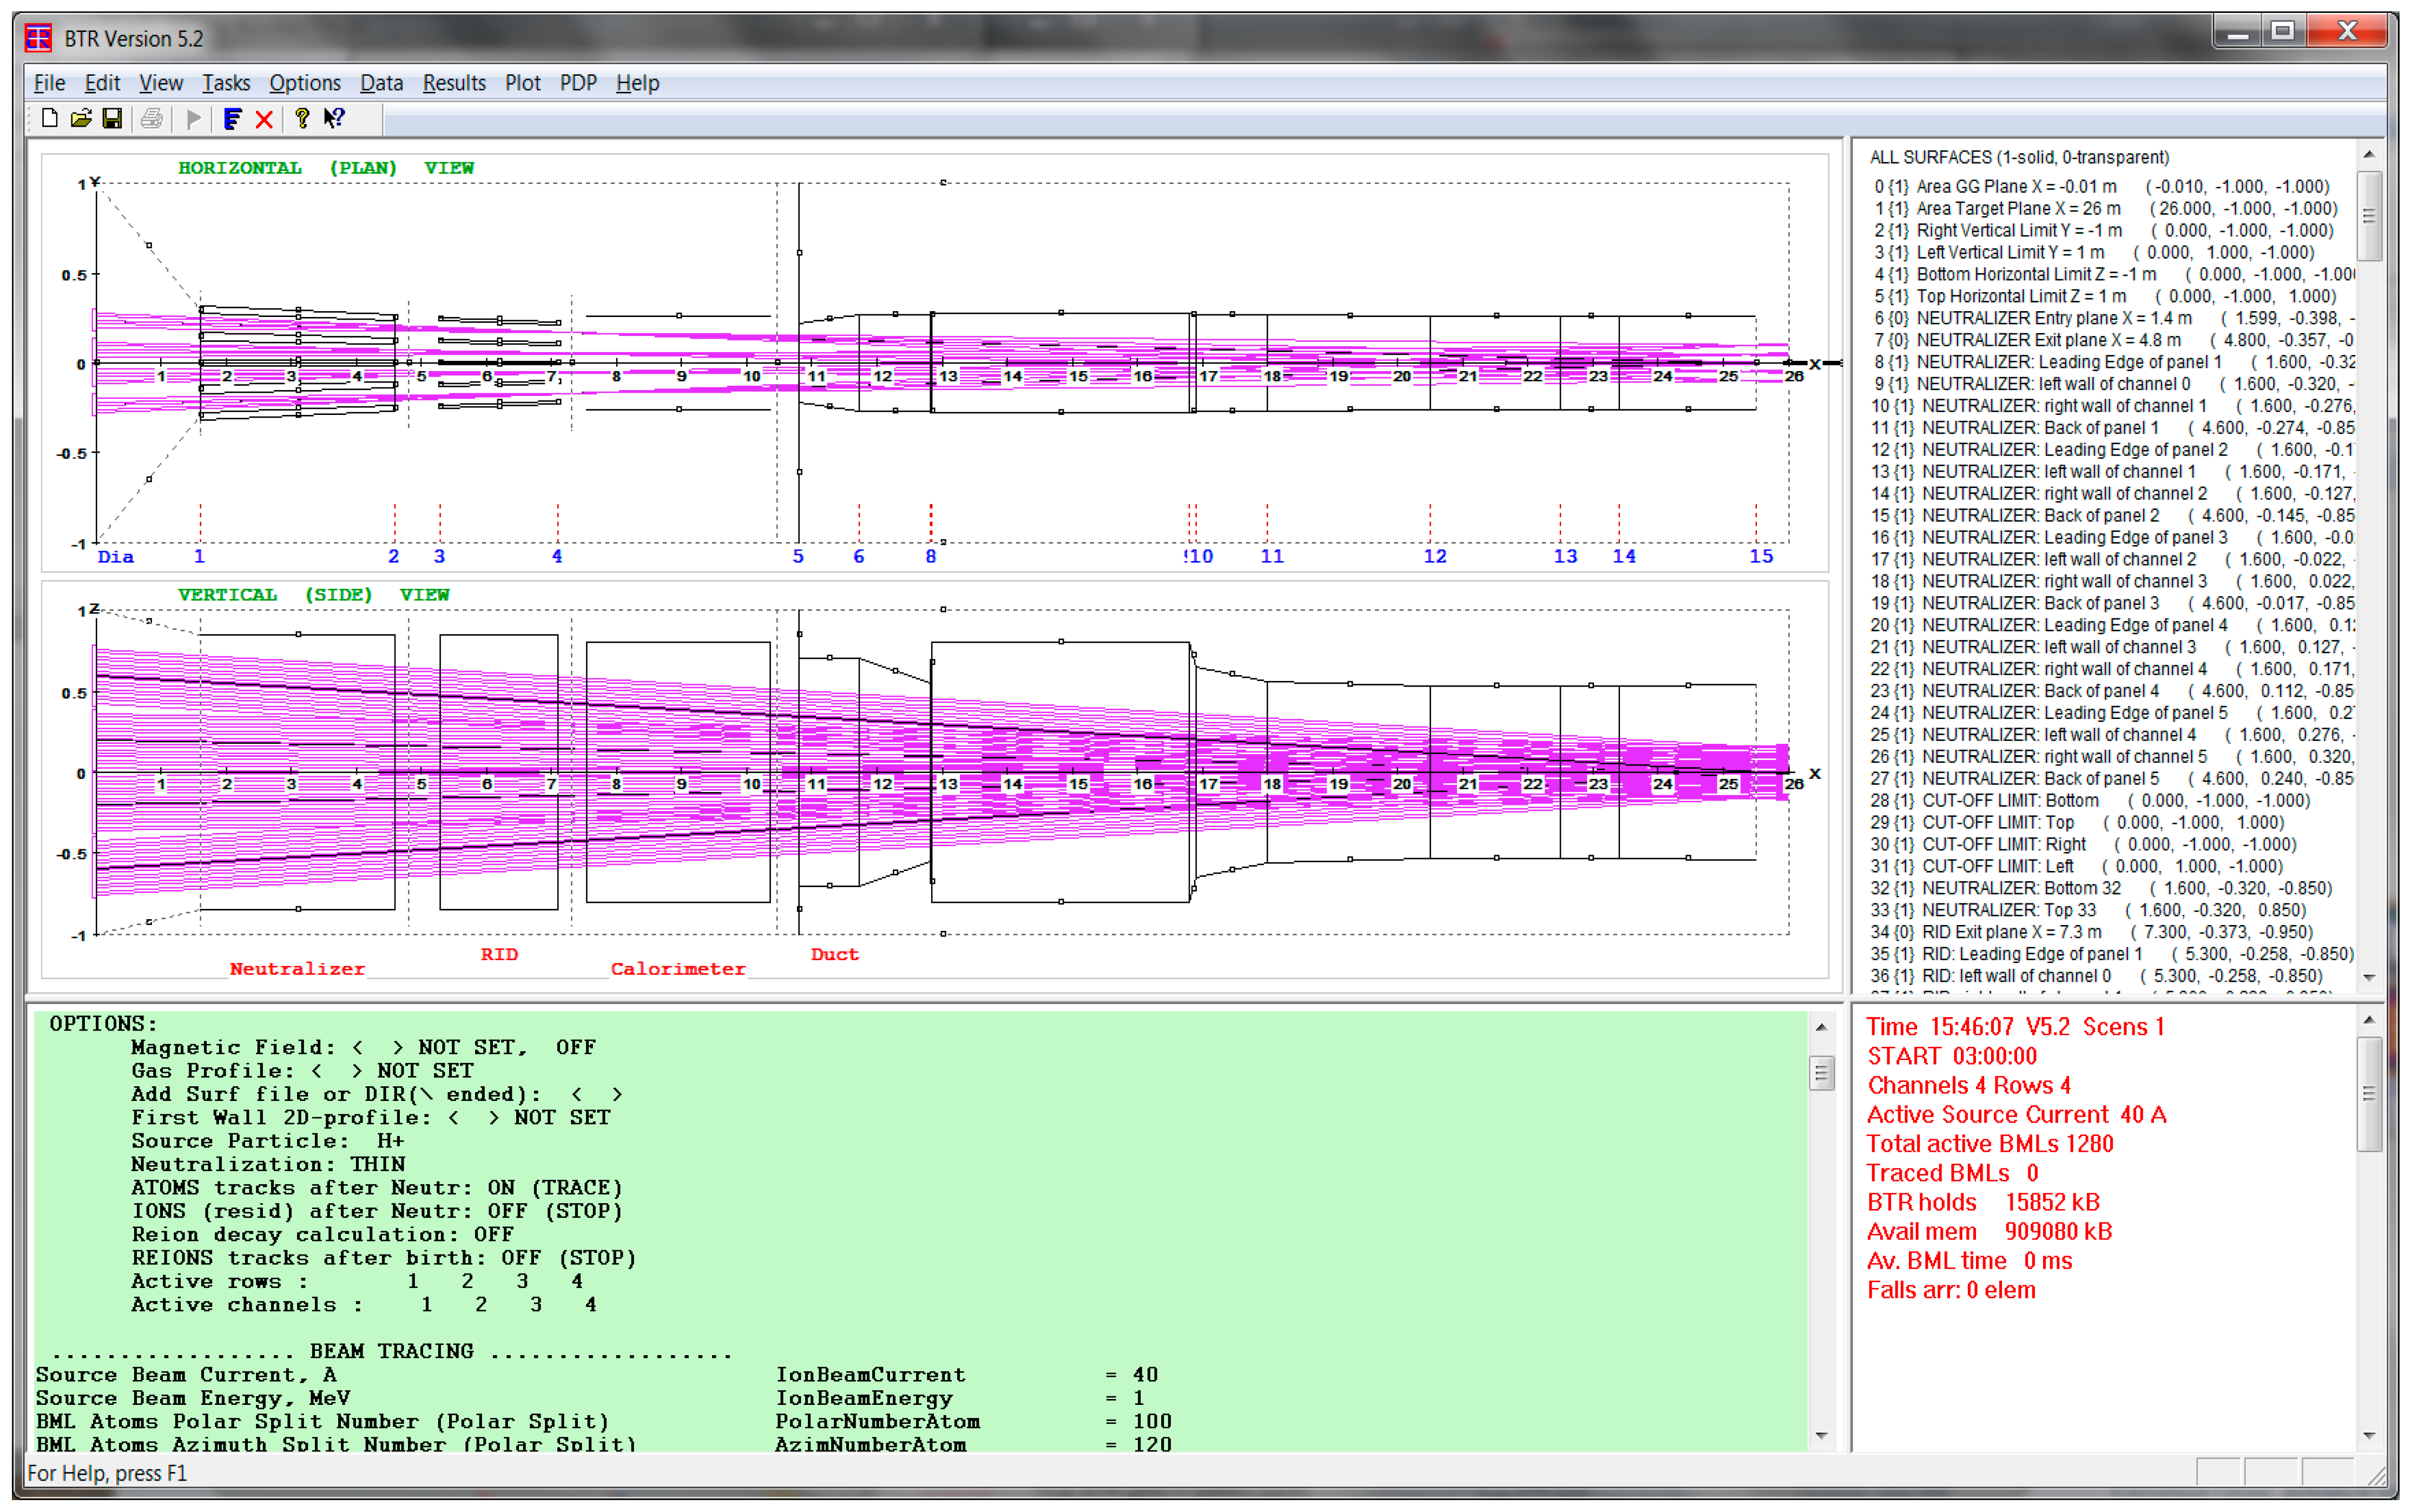
3.2. BTR User Interface

The BTR screen, which appears before the user upon running BTR.exe, is shown in Figure 5. The screen is divided into four major windows (by view splitting control):
  • “Config plot”, main view with NBI geometry and beam layout.
  • “Green panel” tool—BTR interactive input data processor.
  • “Loads Summary”/“Map” view switch.
  • “Running Status”/“Profiles” view switch.
The “Green panel” is the main interface tool of BTR GUI used for interactive control of input data and its diagnostics. The user directly modifies data fields in the green panel so that the input parameters container (configuration list or “Config”) is updated along with all the graphical representation images. The Config dataset is stored and can be next reloaded as input either for review or BTR simulations.
BTR screen is supplied with the interface tool “Main menu” on the top. The main menu commands serve the following capabilities for input/output (IO):
-
Update/Save/Import data.
-
Call dialogs for input by categories (i.e., alternative direct input way).
-
Define specific ‘Tasks’ and output options.
-
Add/Edit gas or field input profiles.
-
Select/manage visualization categories and many others.
Apart from the main menu, there is a pop-up menu interface tool invoked by a right mouse click (not shown). It collects all the handiest and most frequently used commands, including selection, zooming, switching between views, and many others.
Specific input dialogs that provide more ‘intuitive’ data input are shown in Figure 6. Rather than reviewing all the parameters in the long green panel list (~200 lines), the user can perform the same using the dialogs, where the data fields are represented by category. The dialogs are a more convenient tool to set the parameters and options for calculations, including the source particle species, beamlet splitting and tracking steps, particle species following choices, etc. In fact, almost all BTR I/O commands are replicated so that it is not essential for the user to keep in mind the “best” way to make anything happen: the major controls are found elsewhere despite the user’s style and behavior.
The resultant power footprints (2D color maps) and 1D profiles are represented by image plots; the examples of power maps are shown in Figure 7 (and through the next sections). They become available on the beam stop or pause when the user clicks on the surface of interest, which can be solid or virtual (transparent). The images are interactive, too: the mouse drags over the map showing the local value, and the mouse clicks labelling the clicked point.

4. BTR Models and Tasks

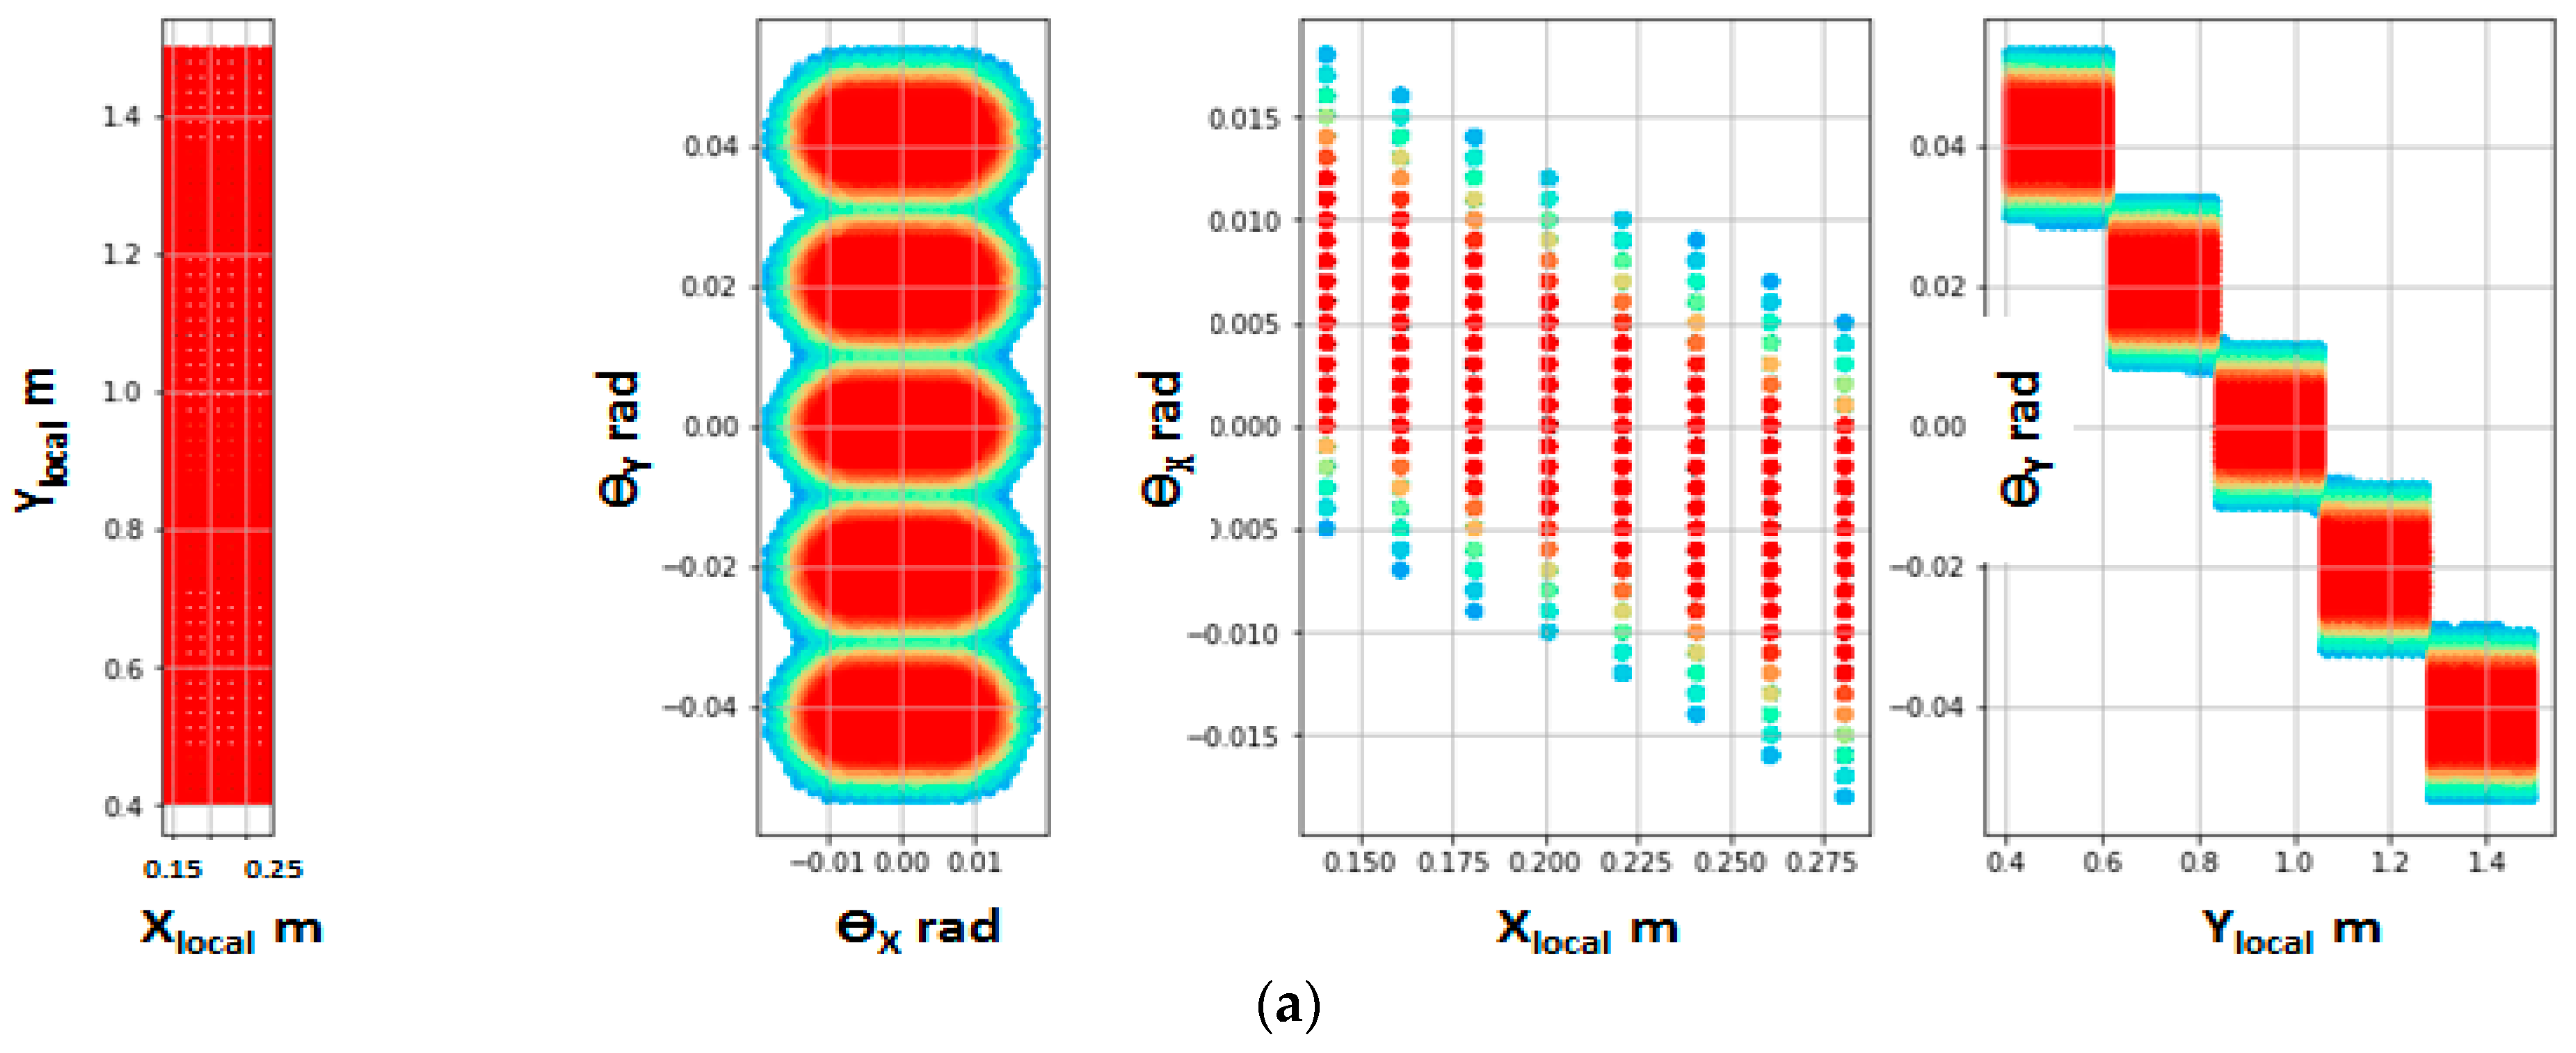
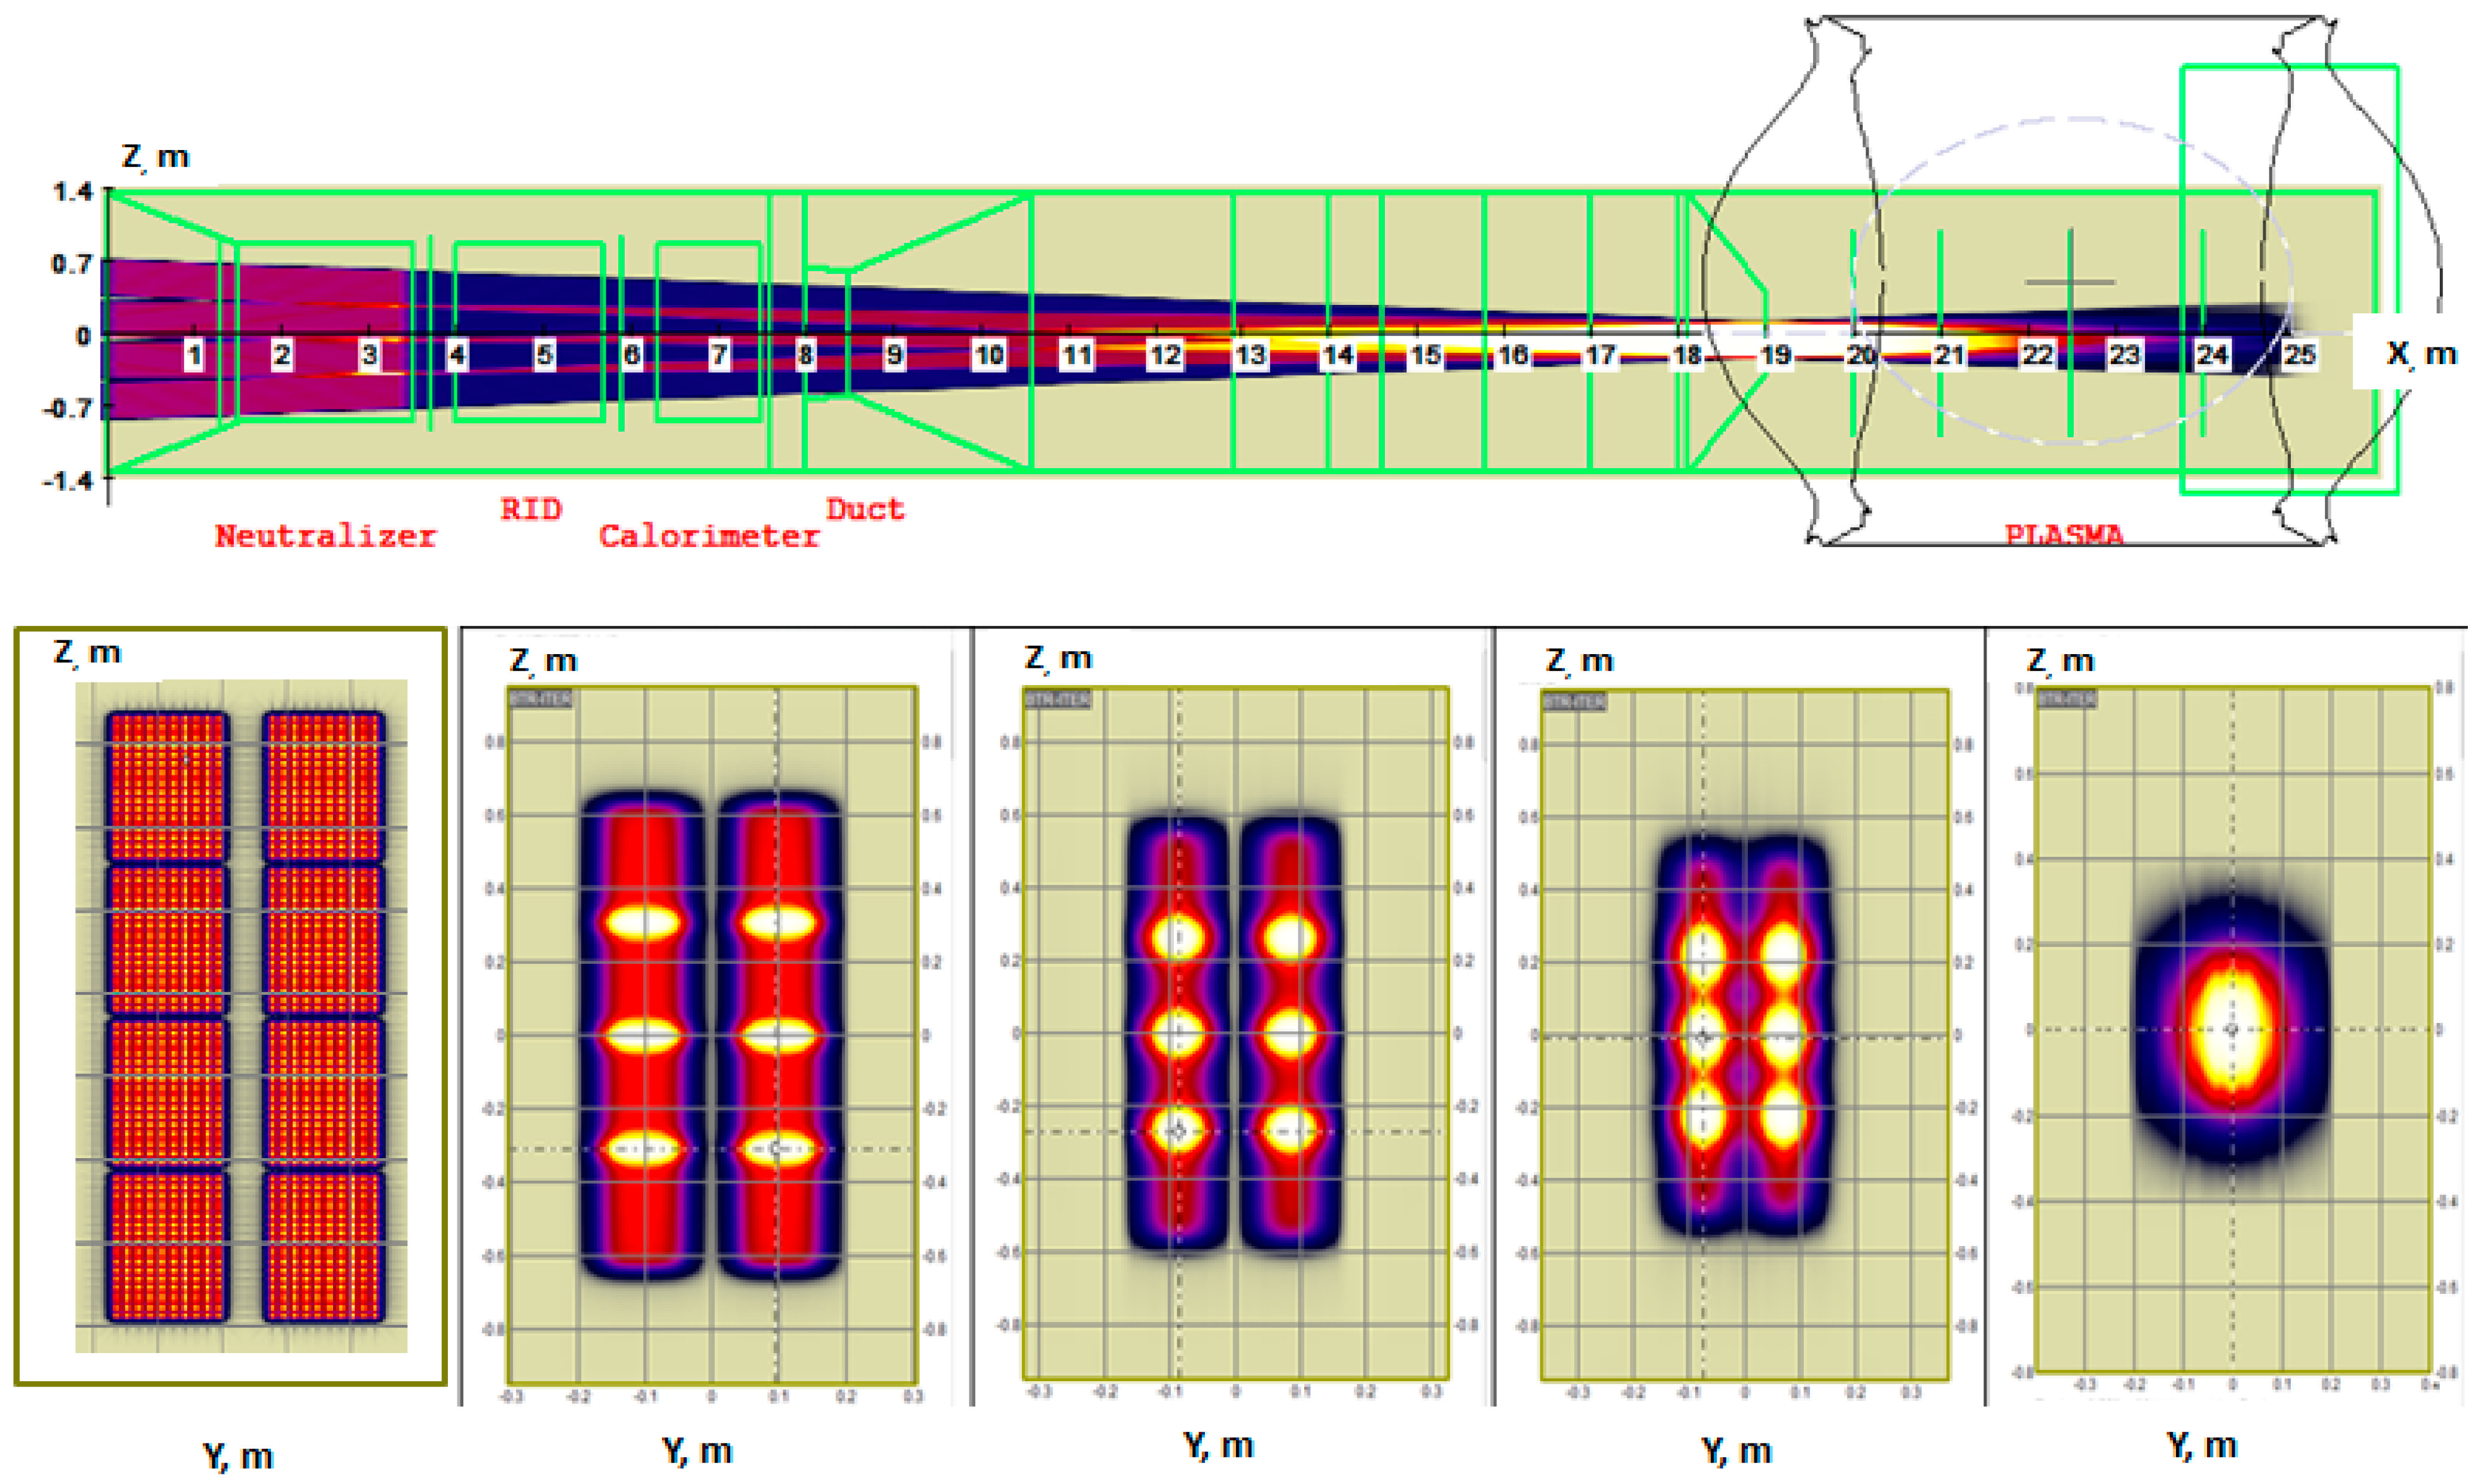
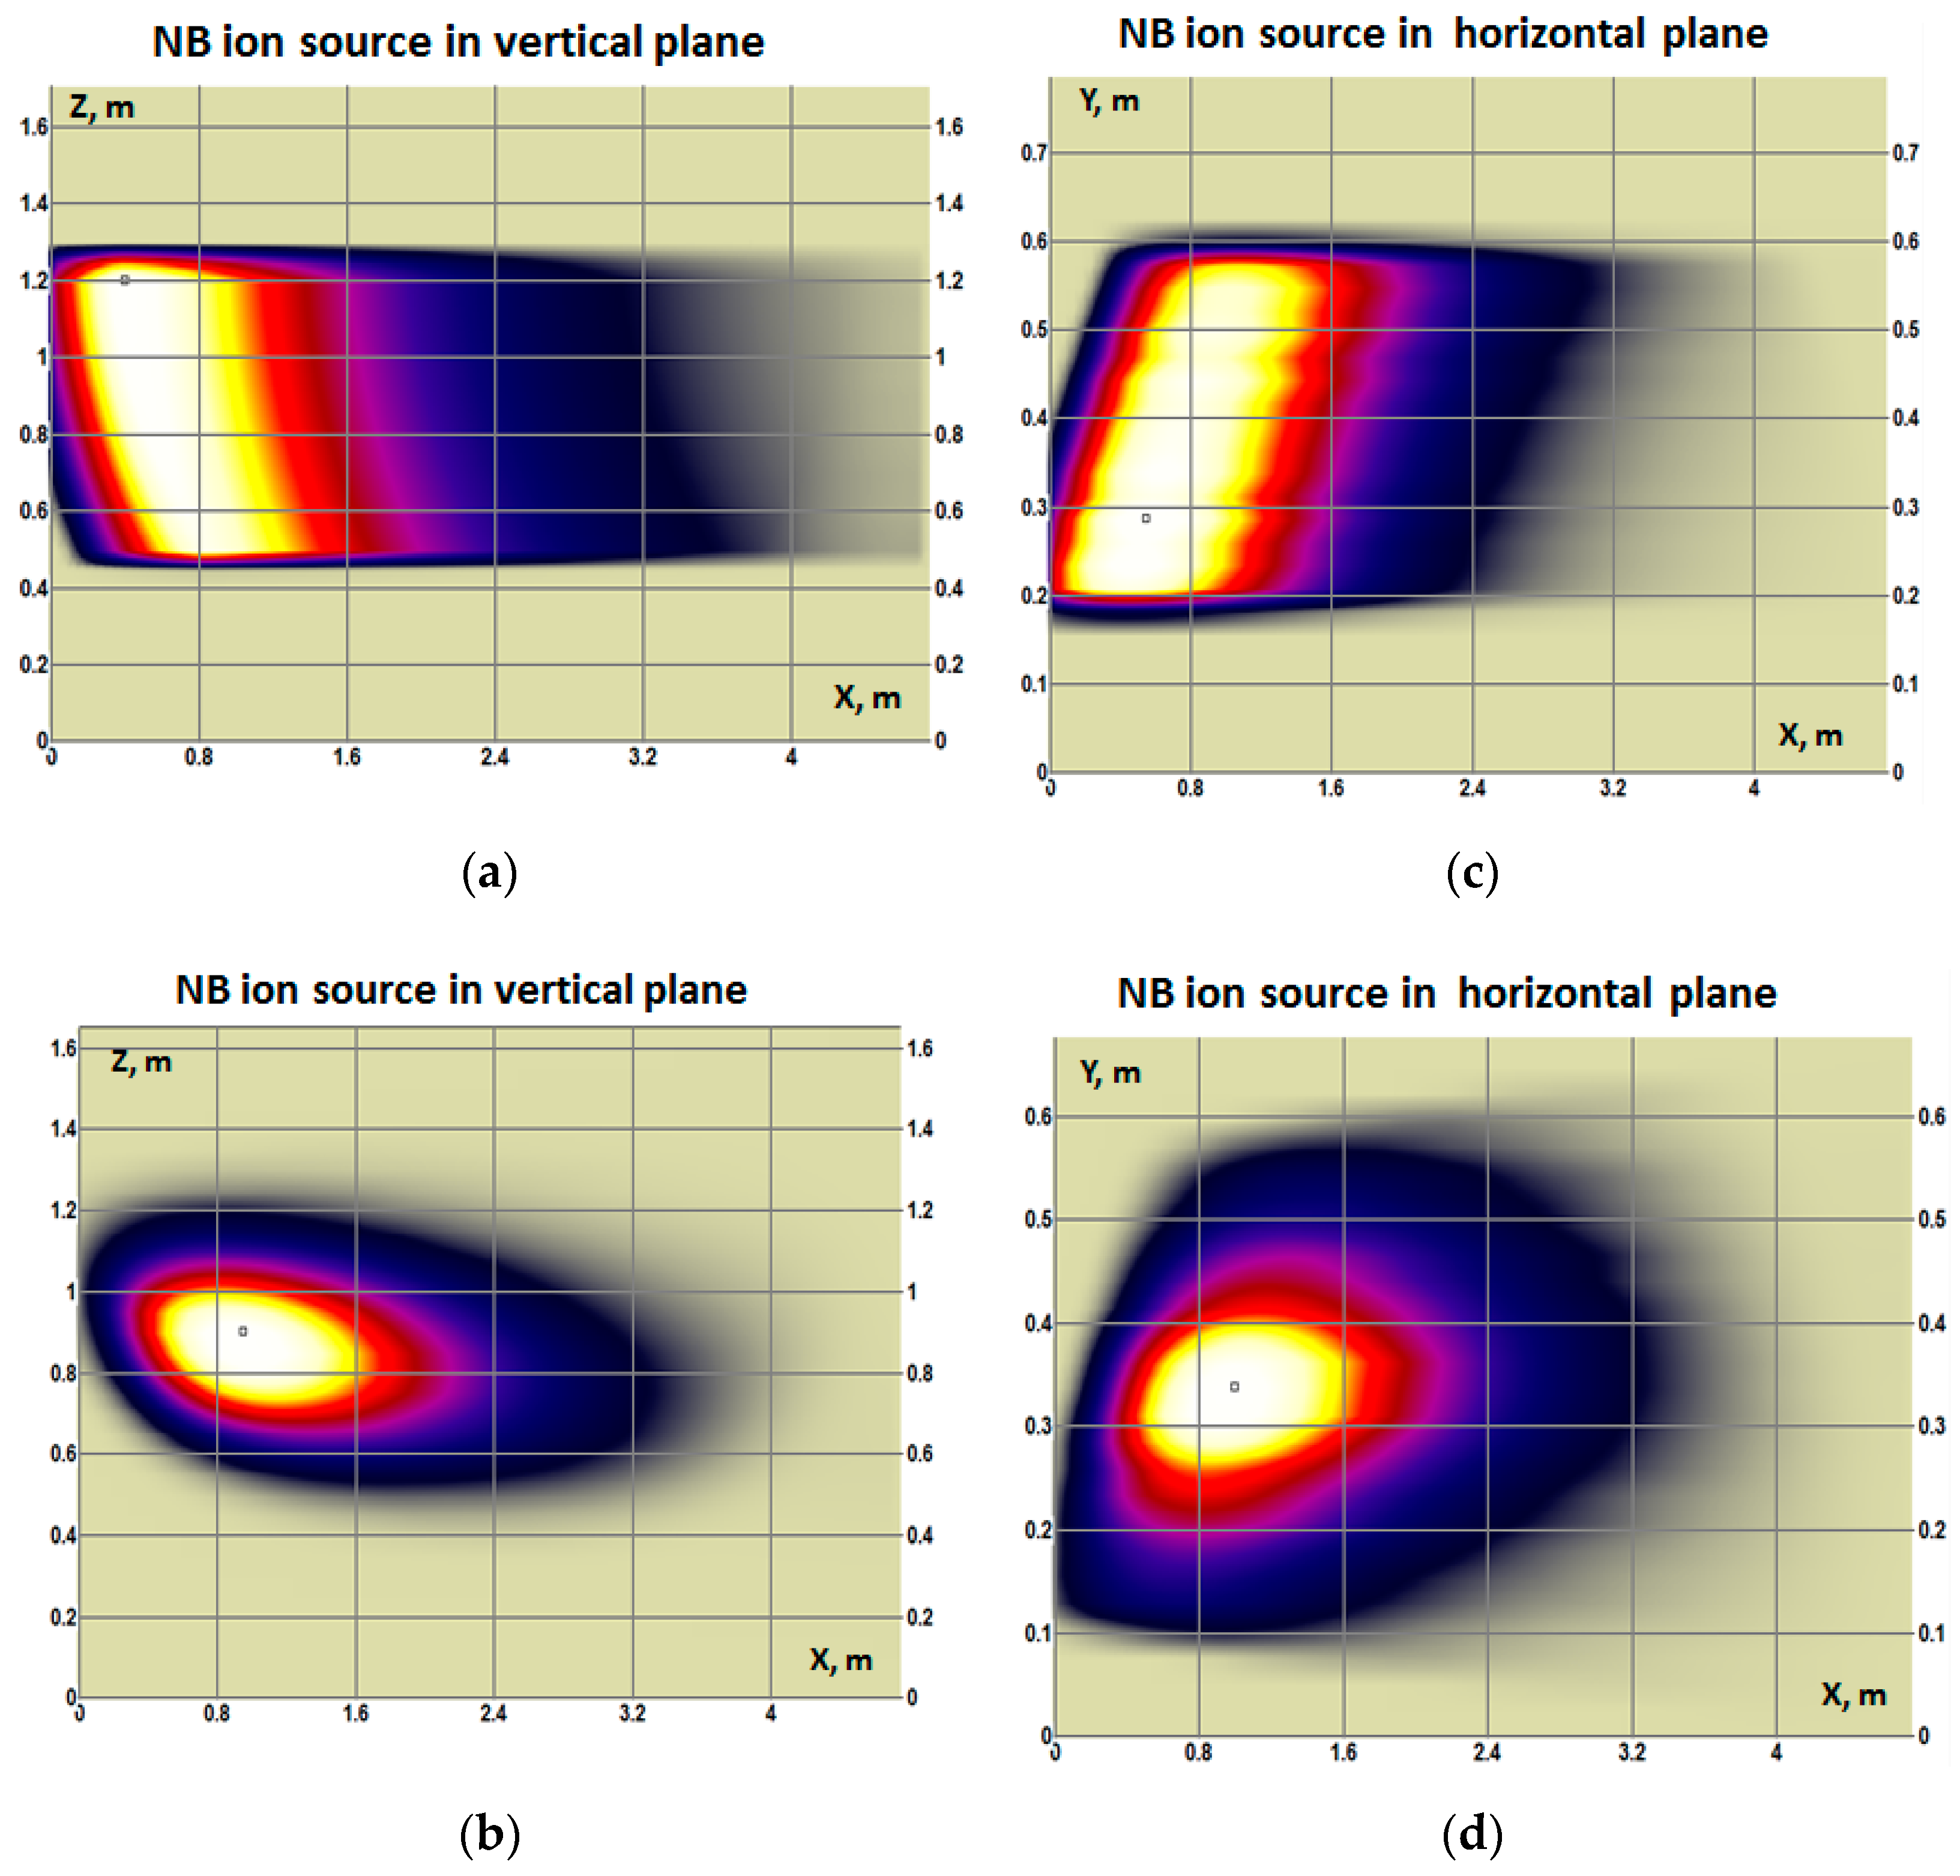
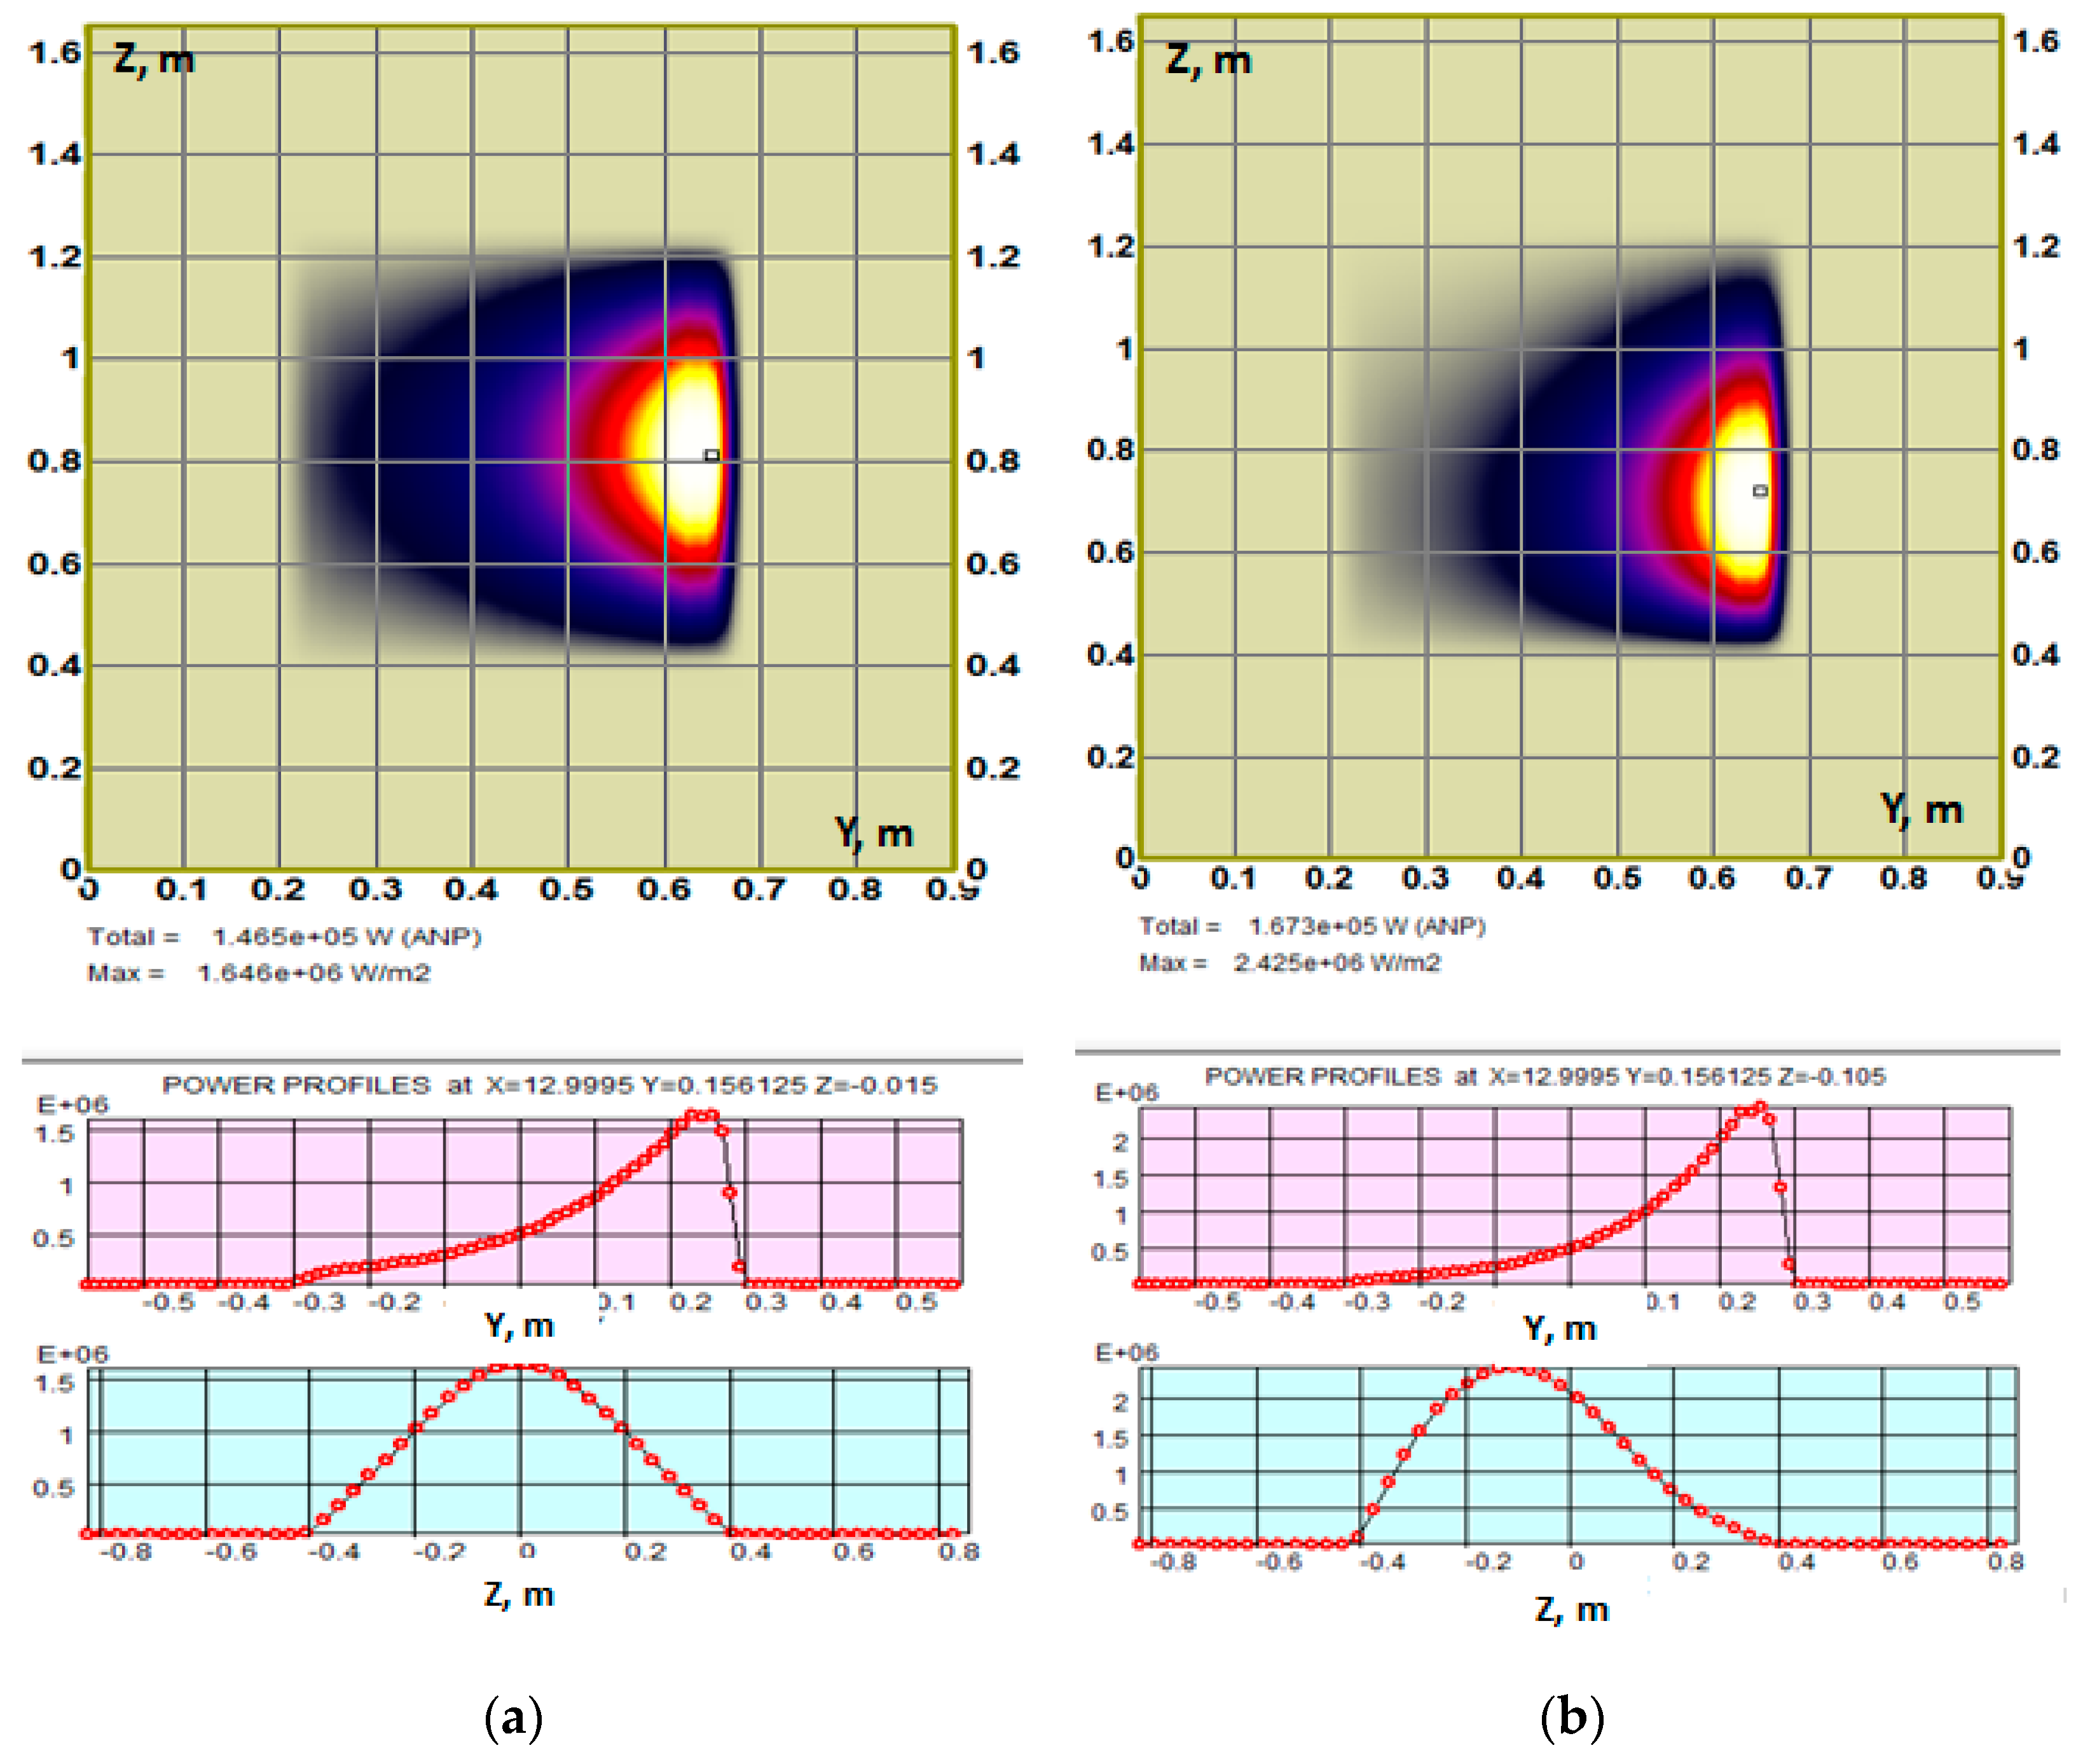
4.1. Beam Shape and the Injected Power

The shape of the beam and its internal structure are determined by the beamlet focusing provided by the ion-optical system (IOS) and by the beamlet’s internal angular dispersion. The ion beam, initially formed by a plasma emitter and accelerated in a multi-grid multi-aperture IOS, consists of many beamlets (up to several hundred) in accordance with the aperture’s setup across the extraction and acceleration electrodes. For example, in the beamline design for FNS-ST, which implements a positive ions neutralization approach, the beam source is organized as a vertical column of five rectangular aperture clusters, with 80 beamlets per group. To ensure the efficient beam propagation to tokamak without overheating the beamline elements, the beamlets focusing is complex enough: the beamlets within the column are aimed horizontally at NBI port center-point, while in a vertical plane, the beamlets axes within each cluster are parallel to the main cluster axis with the main axes focus at NBI port plane in tokamak—this method works for the entire beam optimum transmission. The beamlet focusing scheme for the FNS injector is shown in Figure 3.
The ion current within each beamlet, as experiments show, is well described to have a normal (Gaussian) distribution along the polar angle, and the sum of Gaussian fractions fits the beam angular shape in all NBI schemes. For example, the positive ion beam in the FNS-ST injector is well matched by a 2-dimensional Gaussian profile (with different standard deviations along horizontal and vertical axes), while a negative ion beam, combined by two major angular fractions—‘core’ and ‘halo’ parts—can be reproduced by a sum of 1-dimensional profiles versus polar angle from the beamlet axis:
j ( θ ) = 1 H π Δ c 2 e θ 2 Δ c 2 + H π Δ h 2 e θ 2 Δ h 2 ,
where θ —is a polar angle from the beamlet axis, H—is the so-called halo fraction, Δc and Δh—the angular width of core и halo. Note: The Gaussian width in BTR notation is not the same as standard deviation σ for normal distribution.
The positive ion beams (like in FNS-ST NBI) are typically supposed to carry a single core fraction without halo (H = 0) with the core angular width of ~15 mrad, which results in the effective beamlet footprint width at the NBI port plane about ~30 cm. The power delivered by the neutral beam to tokamak plasma roughly depends on the initial beam divergence and the beamline geometry transmission, but the latter property (transmission factor) is sensitive not only to the shape of the channels for beam passage but also to the beam alignment accuracy and the risks of its deviation from nominal value (misalignment, focusing errors). The misfocusing tolerances are generally a few mrad (2–6 mrad), depending on the beam divergence and NBI port dimensions. For NBI in FNS-ST, with the beamlet’s perfect alignment towards the center-point of the 30 × 60 cm2 NBI window, the calculated beam transmission efficiency is ~76%, with the injected power of 3.5 MW. If the beam focusing has small errors (misaligned) of about ±4 mrad in the horizontal and ±6 mrad in a vertical plane, the injected power to plasma reduces to 3.3 MW (with the beam transmission ~71%), and the effect is illustrated in Figure 8a,b.
Since a reduced size of the injection port is highly preferred, the possibility of reducing it is one of the high-priority issues of NBI geometry optimization. For this study, the NBI port size is reduced to the acceptable level of the beam power, so the nominal size for FNS-ST compact tokamak (with R/a = 0.5/0.3 m) with an account of the chosen scheme and the beam source is 30 × 60 cm2, which is comparable with the tokamak camera size. If the NB port is reduced to 20 × 40 cm2, the injected power drops from 3.5 MW to ~2.3 MW, or by ~30% from nominal NB power. The beam misalignment additionally reduces the NB power (down to ~2 MW). If we consider the neutralization efficiency (~50% for the beam energy adopted), the overall NBI performance would be about 25%, so the NBI total performance is quite low. Further, for the reduced port size design, the beam power intercepted by the beamline components becomes too high, and the entire NBI design revision is needed to address the overheating issue.
One more conventional task for BTR is the investigation of the injector performance response to operation conditions change, including the impact of the beam misfocusing and the presence of residual magnetic field within the neutralization region on the beamline geometrical transmission. The results of this sensitivity study form a base for the operation requirements for the beamline design; for ITER heating and diagnostic neutral beams, the required magnetic field limits and the beam misfocusing range evaluated by BTR can be found in [18].
The beam particle distributions (phase diagrams) in a 4-dimensional space across the beam axis (X, Y, ϴx, and ϴy) are shown in Figure 4a,b—for the IOS exit plane and for the NBI port plane (window size 30 × 60 cm2). The main feature that distinguishes the BTR approach from the existing NBI models is that BTR calculates the injected beam statistics not only with a detailed account of the source beamlet structure but also including the effects of background conditions (fields and gas); as a result, BTR generally provides a complete and more ‘realistic’ beam losses and transmission through the injector as compared to the NBI models which typically ignore all these minor effects. However, the combination of these effects tends to be far from negligible, so during the experiments, the need for a more realistic simulation becomes more evident [30,31].
The beam statistics at the tokamak NB port plane (Figure 4b) can be naturally applied to trace the fast ions ensemble in the plasma until their thermalization, i.e., slow-down to thermal velocities; the numerical procedure is described in [34]. However, the beam thermalization task is beyond BTR scope today, although it can be implemented in future BTR versions. Fast and simple BTR methods can be applied to efficient simulation of the beam-driven effects in plasma target, among which is the beam current drive, the beam-plasma fusion rates, plasma heating, and rotation in tokamak.

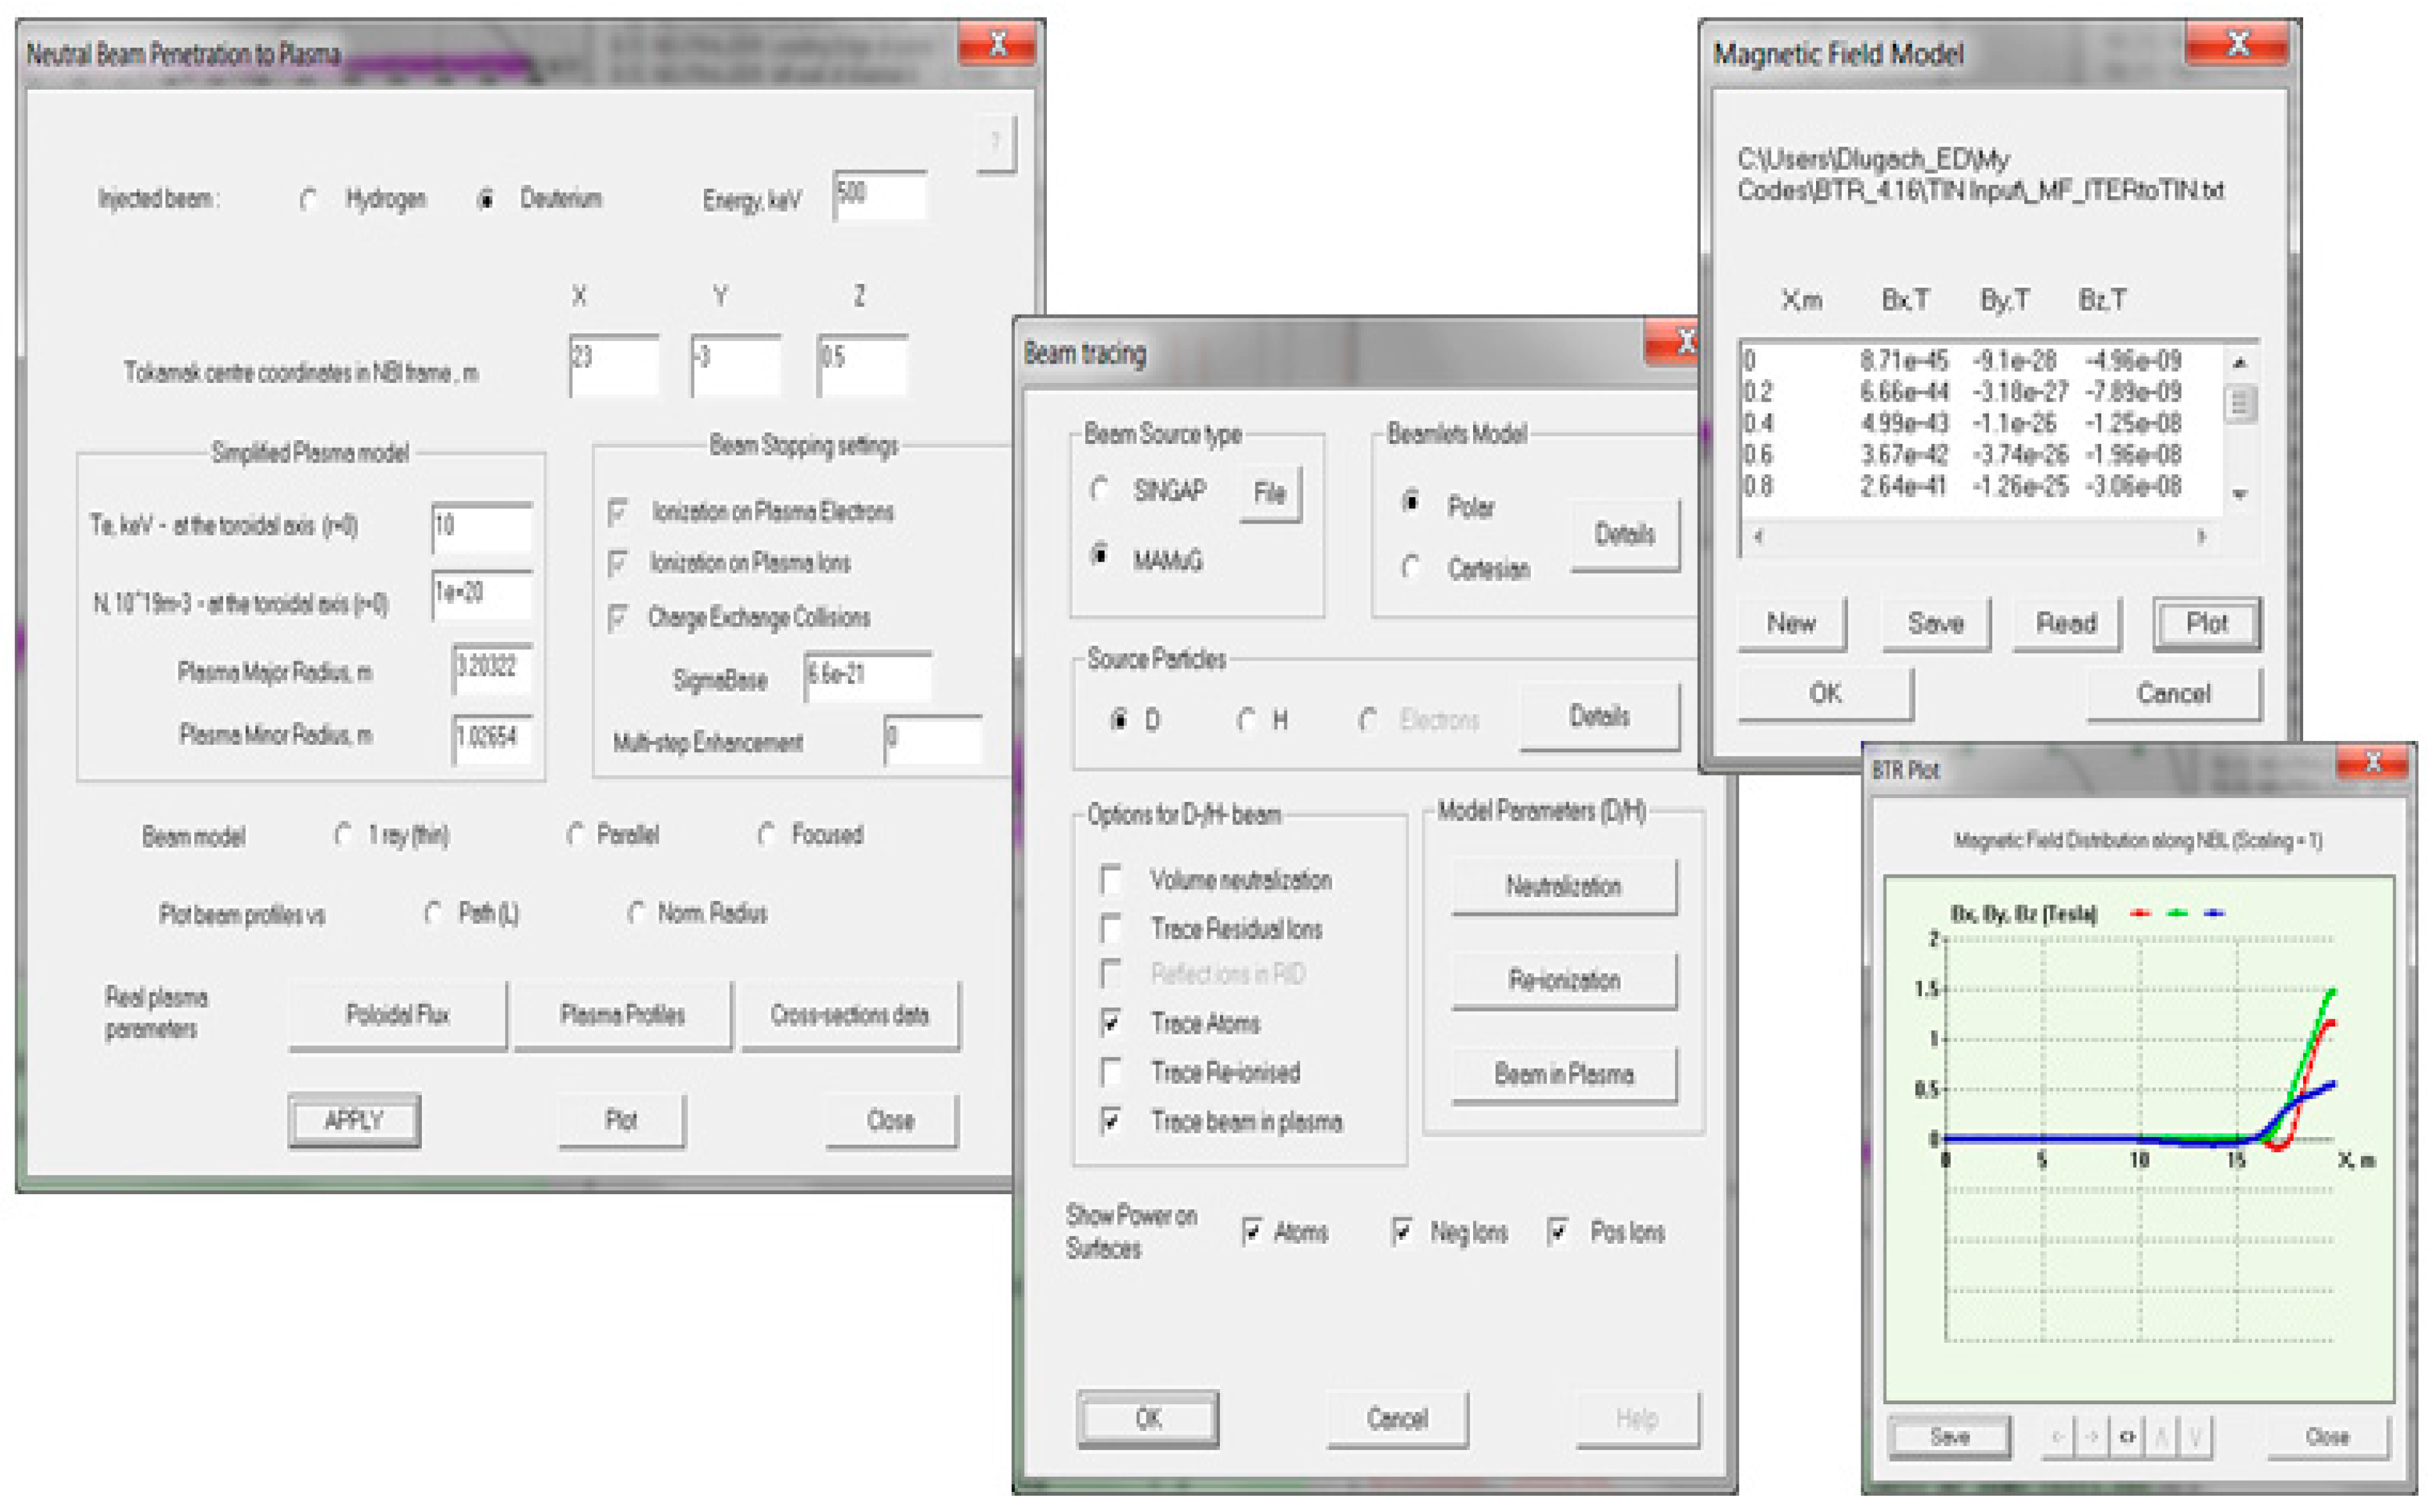
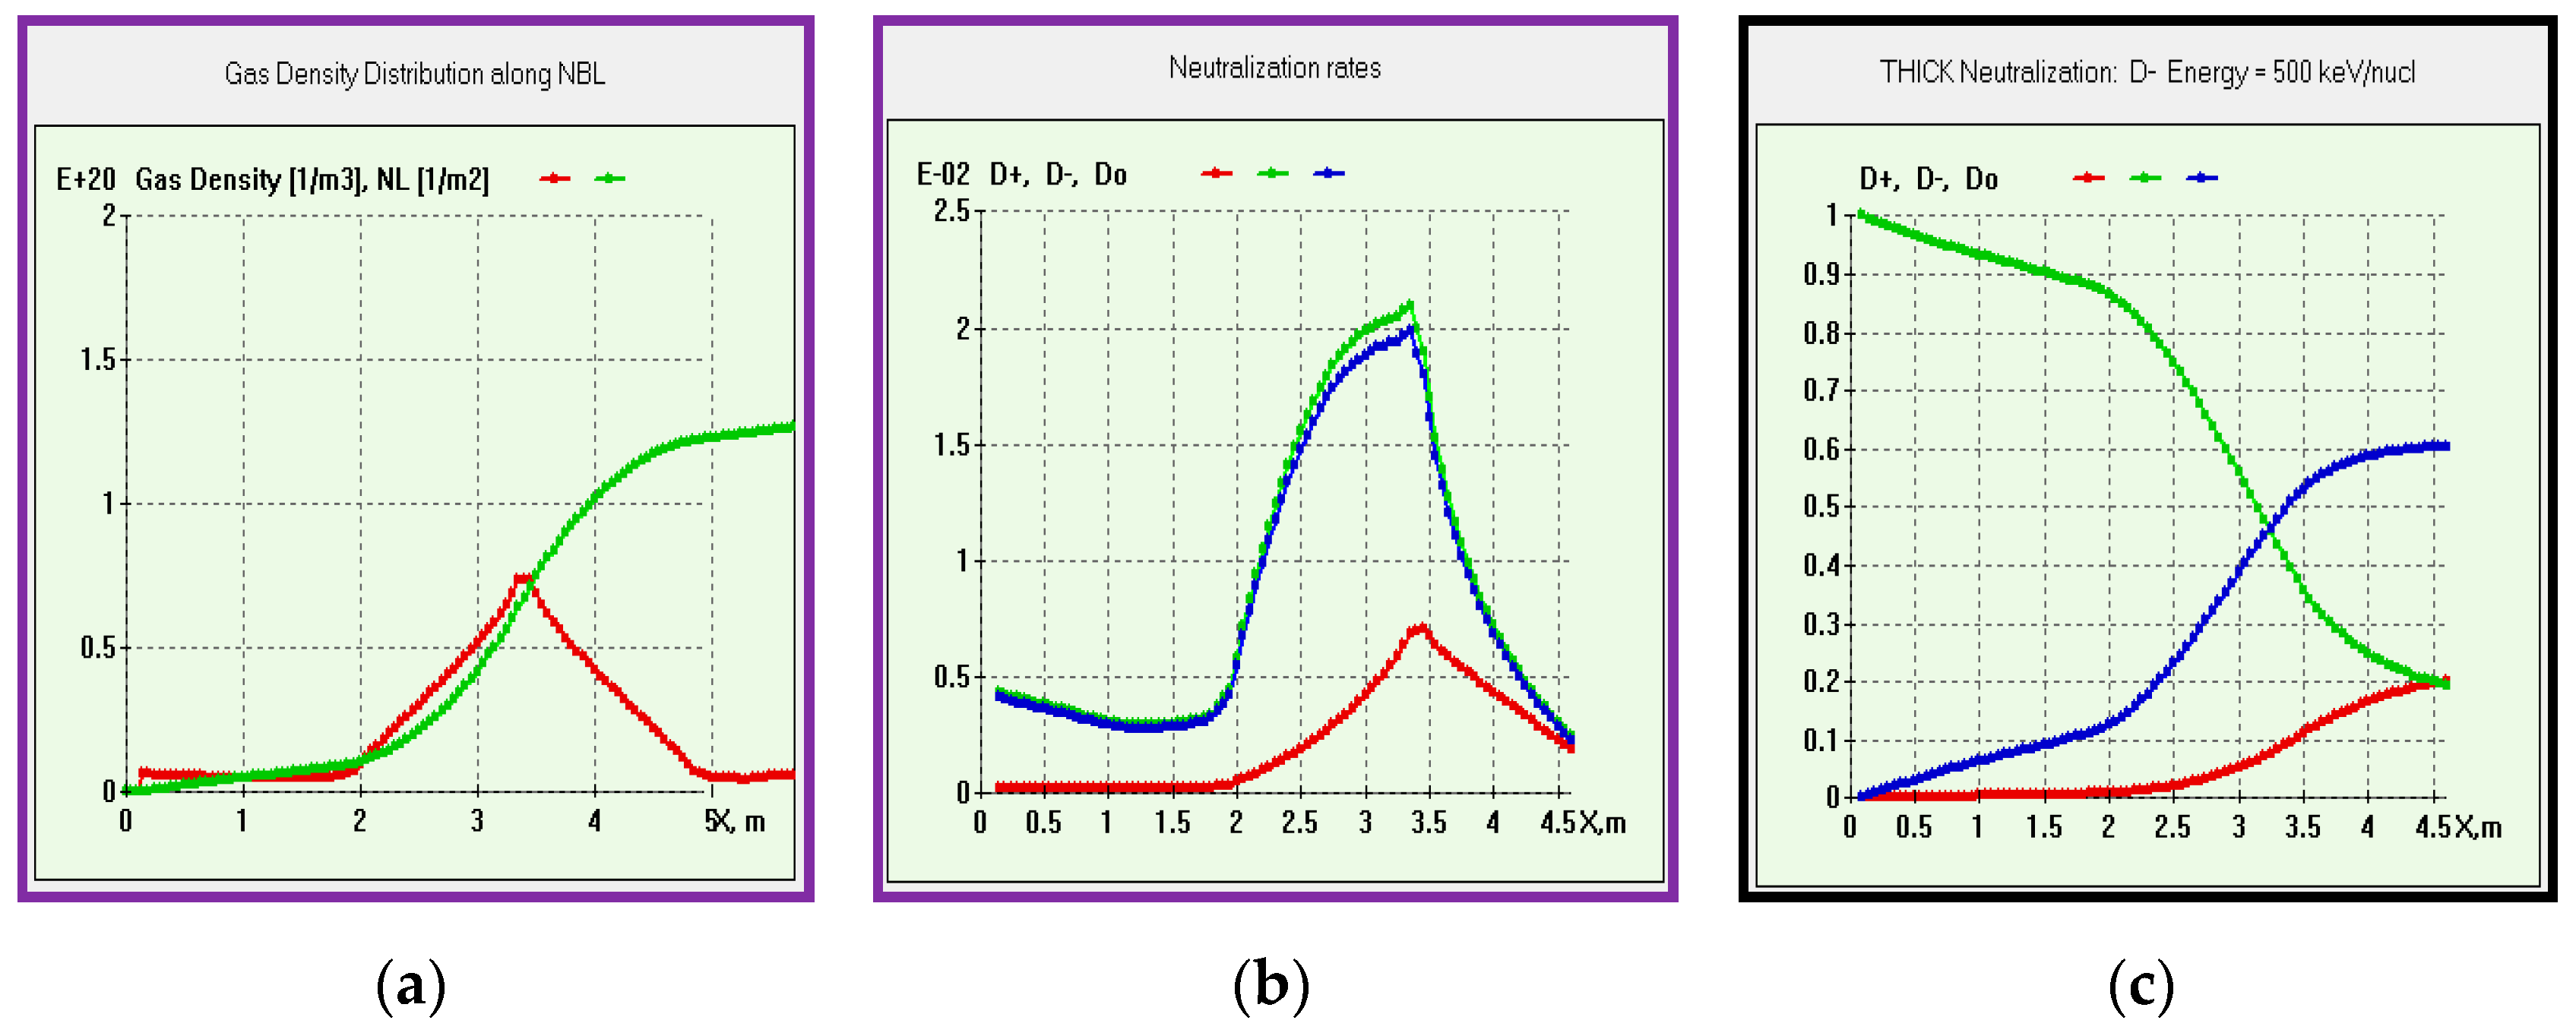
4.2. Beam Neutralization

The source ions, which are either negative or positive, are converted to atoms via collisions with D2-gas in the neutralizer with relevant atomic cross-sections. Four sigmas are involved for negative ions: σ−10 (electron stripping), σ−11 (double electron stripping), σ10 (positive ion neutralization), and σ01 (atom ionization). A positive ion neutralization process is defined by the ratio σ1001. There are two options (models) available in BTR for beam neutralization—‘thick’ and ‘thin’. The thin model is less accurate: the total gas volume is “pushed” to a thin layer at the neutralizer exit, causing an overestimated beam deflection at the device output. However, it is by many orders of magnitude faster and finds much wider use than a thick model, which takes the real gas target distribution and produces a reduced beam deflection and, in fact, a wider test-particle divergence. The thick model (Figure 9a–c) solves balance equations for beam species:
d Г d x = Г ( σ 10 + σ 11 ) n ;
d Г 0 d x = Г σ 10 n + Г + σ 10 n Г 0 σ 01 n ;
d Г + d x = Г σ 11 n + Г 0 σ 01 n Г + σ 10 n .
Here, Гk is the k-th species flux, n is background gas density.

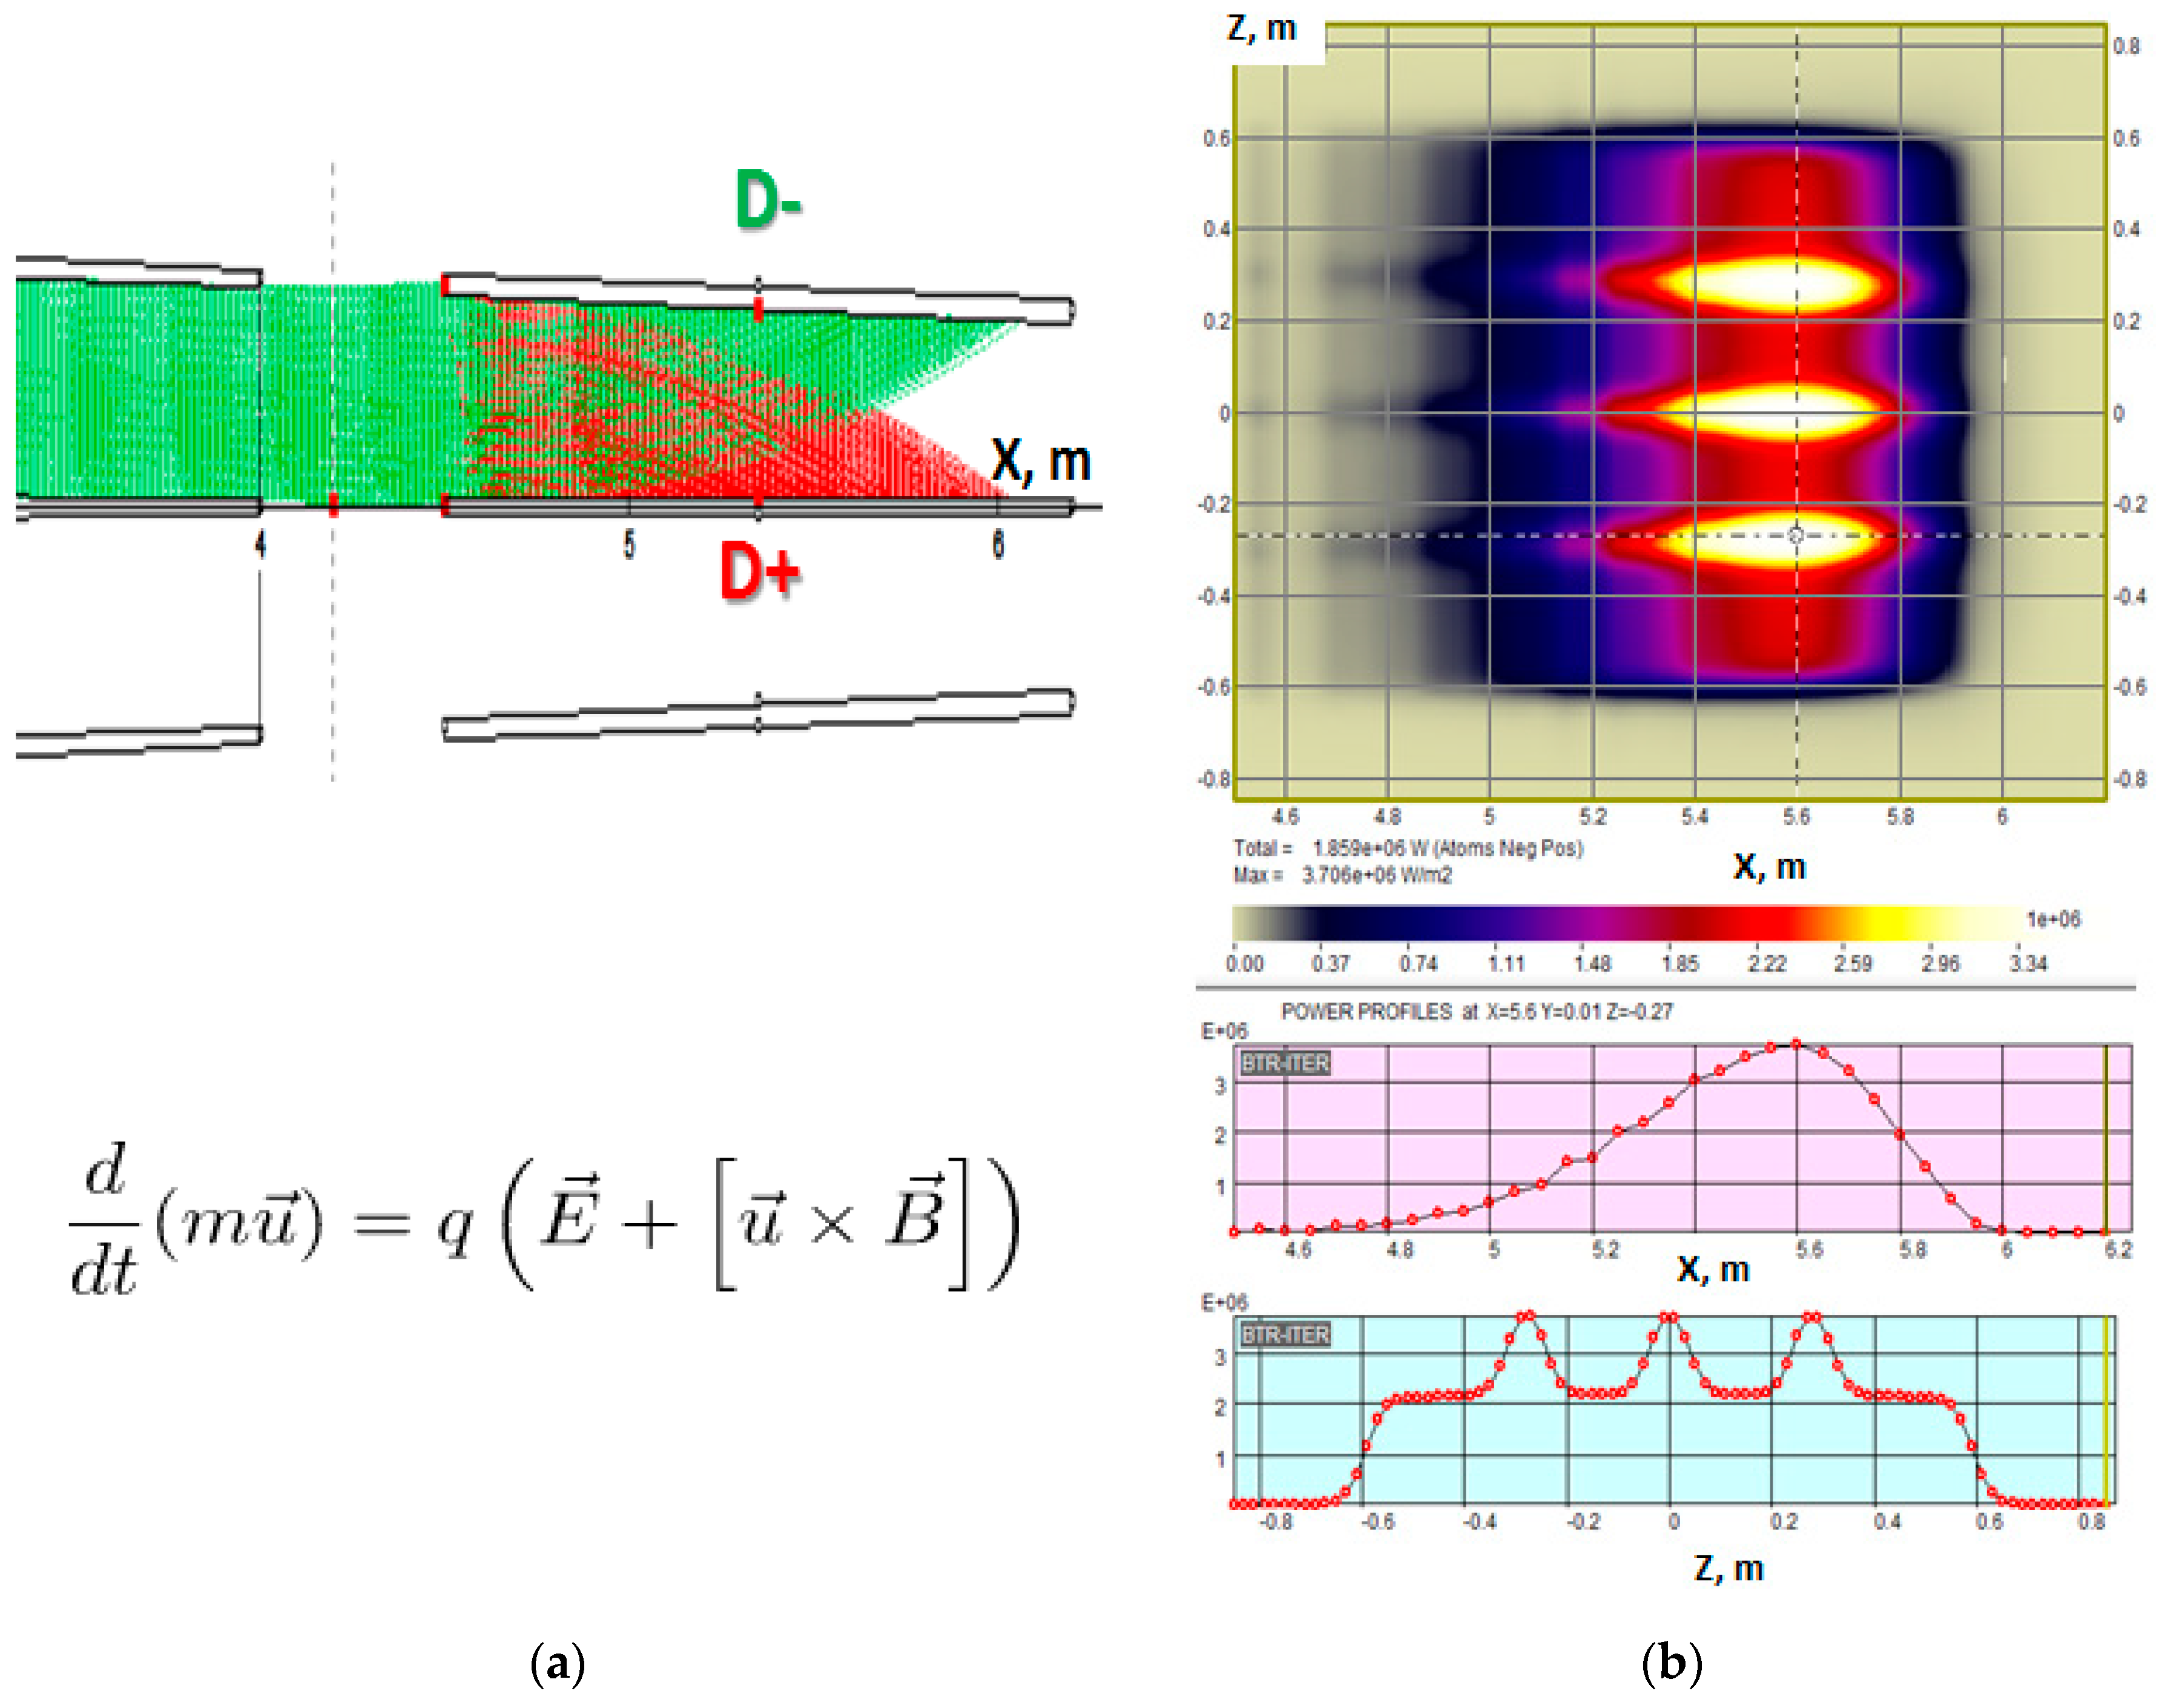
4.3. Residuals Deflection and Dumping

The residual ions fraction, which is formed by the unwanted charged part of the beam after neutralization, should be removed from the neutral beam path and accepted by a special appropriately cooled collecting device, the so-called residual ion dump (RID). The ions are deflected either magnetically (MRID) or electrostatically (ERID). One of BTR’s major tasks is to ensure the electromagnetic field in RID deflects all the charged fractions of the beam, and these are next fully intercepted by the dumping surfaces. This task requires an accurate beam statistical representation (~103–104 ions per single BS beamlet, or 106–107 total particles) and each ion track calculation guided by the Lorenz force until the ions stop or escape from the calculation area. BTR helps to choose the optimum configuration and magnitude of the field by scanning several NBI parameters across the nominal operation range; typically, the following values are to be scanned: neutralization output, beam tilting and focusing, beam initial divergence, and magnetic field profile in the neutralization region. When the optimal deflecting field is found, the expected power density maps are calculated for RID thermal cooling circuit design.
Figure 10 shows the example of the ion trajectories and power density map at one side of the ERID panel for the DEMO-FNS injector. The final PD footprint is formed by four vertical beam clusters (BS rectangular groups of beamlets); the clusters are focused vertically at the NBI port center so that three PD peaks can be observed on the vertical profile shown under the map plot.

4.4. Re-Ionization on Gas

The model of the neutral beam re-ionization along duct regions works quite similarly to the thick neutralization model: it uses the gas density distribution downstream of the neutralizer and the relevant ionization cross-section σ01 (atom ionization) and σ10 (ion neutralization), both depending on the atom specific energy. In BTR, each test neutral particle (‘super-atom) produces as many secondary ions as needed to be given by the step of re-ionization, and the secondary positive ions are next traced until their interception by a solid surface or escape from the area (Figure 11); this is like residual ions tracking in RID area. The governing system for the process is.
d Г 0 dx = Г 0 σ 01 n d Г + dx = Г 0 σ 01 n
The secondary ions are deflected by stray electromagnetic fields. The neutral beam re-ionization creates an additional NB loss channel not associated with the beam or beamline geometry; it is a result of the beam interactions with residual gas in the beamline ducts and channels. The gas is always present (not fully pumped) after the neutralization region: it flows from the neutralizer and from the plasma device itself (in our case, from tokamak), while the gas pumping is difficult, especially along the region of the duct. The main specifics of the duct region are the stray magnetic field is not shielded, and its magnitude is many orders higher than in the RID shielded area; the gas flow from tokamak cannot be efficiently pumped; therefore, the ionization rates can grow high and can produce high fluxes (hot points) of ion power if focused on the field. Thus, the essential task for the beamline duct design is to define the expected peak PD at the duct elements and to set the heat removal requirements, given the reduced space available for cooling.

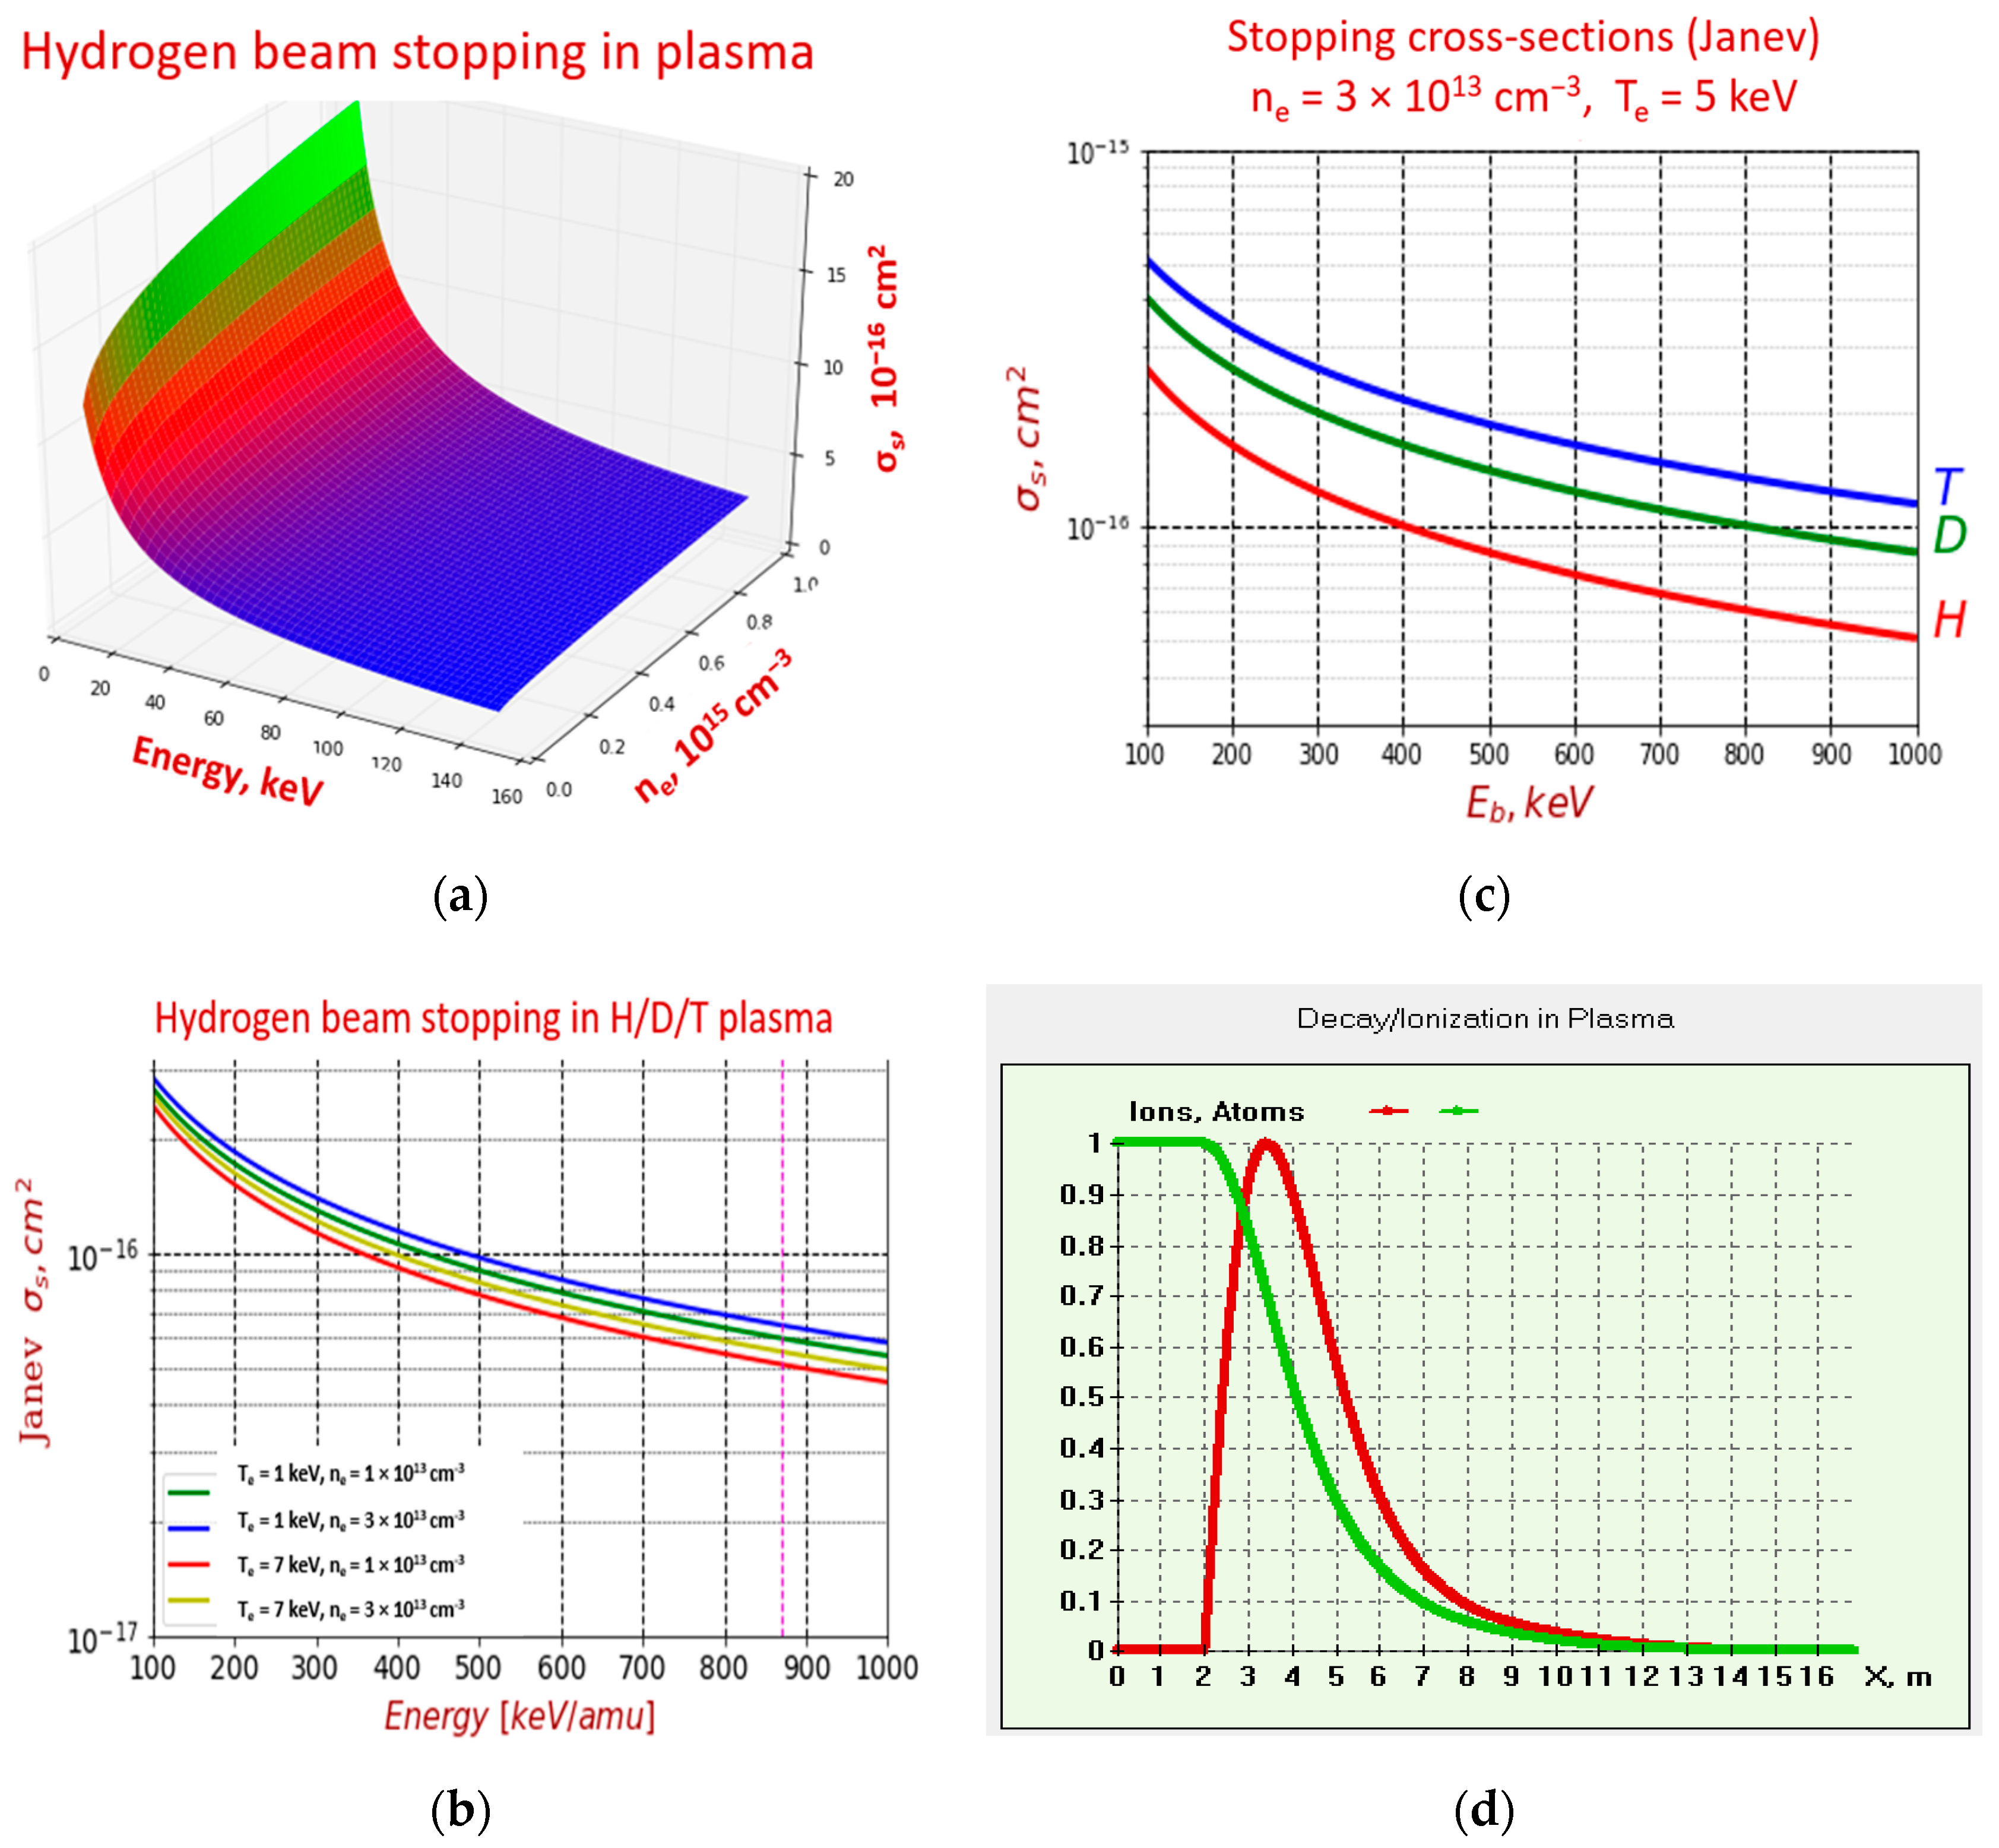
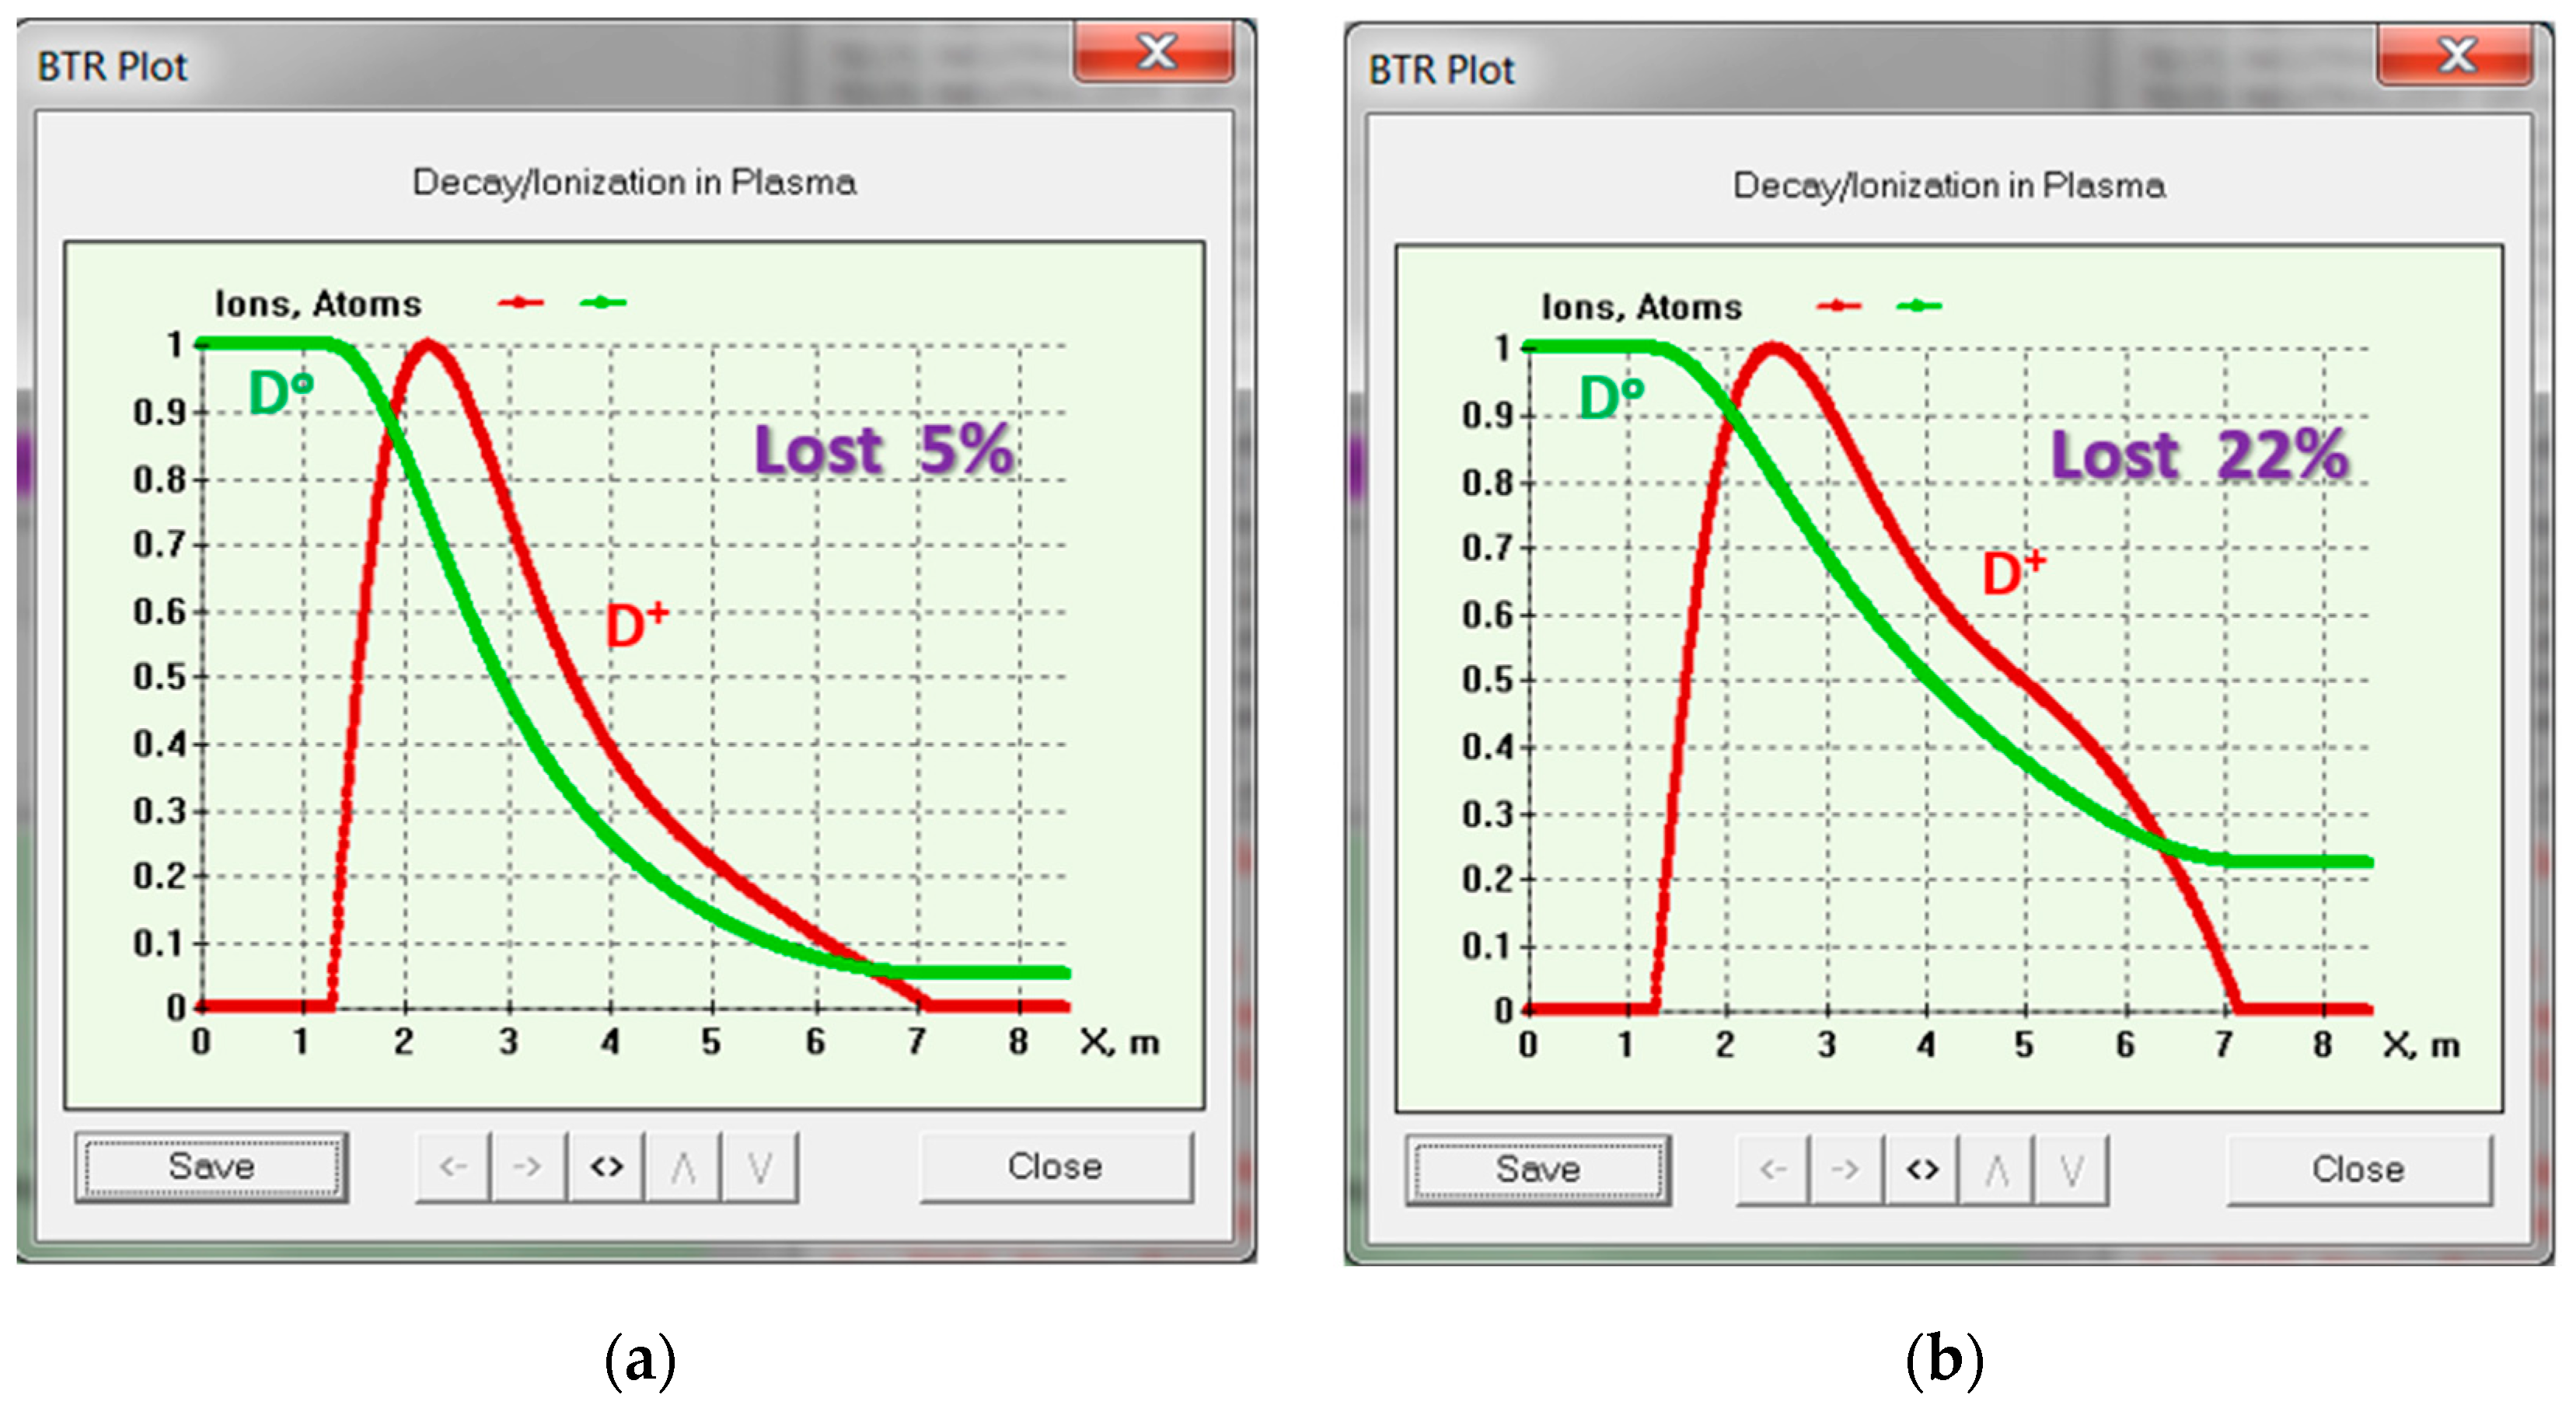
4.5. Penetration to Tokamak Plasma

BTR has proved to be highly effective not only for NBI beamline design and performance study but also for beam effects investigation in plasma and tokamak operation control. BTR’s most detailed beam model allows much more flexibility in reproducing the experimental data on the beam shapes and with running speed by orders higher than other known NBI models, especially those employing Monte Carlo methods [35]. BTR models were naturally extended to the beam particle tracing in plasma volume, where the beam is ionized, and the resultant fast ions are captured by the magnetic field, which confines the target plasma.
The neutral beam ionization and charge exchange with thermal ions in plasma is traditionally called ‘beam stopping’ (because the neutral beam intensity gradually goes down or decays), while the following fast ions circulation and thermalization in plasma is referred to as fast ion ‘slow-down’.
The atom ionization in plasma and fast ion source are obtained under the Janev multi-step ionization model [36], which uses an effective stopping cross-section σs for fast atom ionization in plasma. The effective cross-section comprises all the main channels of beam ionization on plasma species, including the cascade (multi-step) processes of atom ionization. Thus, the neutral beam intensity (I) decay along the trajectory is written as:
d I d x = n e σ s I ,
where ne—the plasma target density; σs—the effective beam stopping cross-section due to ionization represented as:
σ s = < σ i e | v V b | > / V b + n p n e ( σ i p +   σ cx ) + n z n e σ z   < σ i e v > / V b +   σ i p +   σ cx + n z n e σ i z .
Here, σie, σip, σiz—are ionization cross sections of atoms in collisions with electrons, protons, and impurities of charge Z, respectively; σcx is the charge exchange cross section on hydrogen ions, brackets mean averaging over the Maxwell distribution of electron velocities. The plots showing the σs dependence on the atom energy and plasma density are shown in Figure 12a–c. When the neutral beam energy is less than Eb ~140 keV, the NB is produced more efficiently with positive ion beam sources, so after the source ion neutralization and dissociation, the beam consists of three energy fractions. From Figure 12b, for the lowest energy fraction (Е1/3), the stopping cross-section is up to 3 times higher than σs value for the full (maximum) energy fraction Еfull; in fact, this results in more intense ionization of low-energy beam fractions (Е1/2 and Е1/3) at plasma periphery reducing the total NBI efficiency output in the plasma. Important note: Janev model is valid for beam energy above 60 keV/amu.
The detailed beam statistics (up to 1012 test particles) from BTR calculation produce the most accurate fast ion source distribution in space and angle, which makes essential data for fast ion numerical studies and experimental plasma scenario control. Examples of beam ionization distributions in DEMO-FNS plasma are shown in Figure 13. The fast ion source imprints are shown in two orthogonal planes—vertical and horizontal—along the neutral beam axis direction and obtained with the beam particle statistics ~106 test-atoms, which is much smaller than BTR regular capacity. The decay of each test atom and the produced fast ion density are calculated with (6).
The comparative analysis of the beam imprints for various beam shapes has proved the beam geometry (‘shaping effect’) is an essential factor for the beam deposition in plasma and for the resulting beam-driven effects. The effect is illustrated in Figure 13, where two beam geometries produce different imprints in DEMO-FNS tokamak plasma: rectangular box-shaped beam (a bunch of parallel rays) and Gaussian bell-shaped beam of 1280 beamlets with focusing and internal beamlet divergence.

4.6. Shine-Through Power at Tokamak Chamber Wall

Shine-through beam power losses and the associated thermal flux onto the opposite plasma chamber wall, which faces the direct power load (so-called first wall), can potentially damage the chamber and hence justify a hard limit for the choice of injected beam energy. At the same time, the beam-driven current drive efficiency and nuclear fusion enhancement grow fast with the NBI energy, since the fast ions release and their deposition within plasma depend on the neutral beam penetration. The NB penetration to the hot inner core, which is most favorable for current drive and fusion, can be achieved when the average free path of fast atom before the ionization is comparable with the half-way flight distance in plasma—for toroidal tokamak geometry the flight distance is roughly the chord length along the beam axis. On the other hand, that deep beam penetration to plasma implies a higher possibility for neutral particles to ‘shine through’ the plasma with no ionization and thus burn the chamber’s first wall.
For FNS-ST compact size tokamak (R = 0.5 m), the beam energy range 100–150 keV is not optimum from the point of current drive and neutron generation, but this energy level means safer tokamak operation if compared to more efficient NB energy above 200 keV. Maximum NB efficiency in a tokamak is achieved normally when the energy meets the following condition: Eb/Ec = 2 − 5 [5]. For example, NB optimum energy for plasma temperature about Te = 5 keV corresponds to the values of 200–500 keV, but the latter would be unacceptable from the point of the direct shine-through power faced by the FNS-ST device first wall.
The beam ionization footprints in FNS-ST plasma, which are like the plots in Figure 13 (for DEMO-FNS), prove the NB capture to be strongly non-uniform over the beam normal cross-section. This results in a high degree of shine-through power asymmetry on the tokamak first wall; the effect is especially pronounced for small aspect ratio devices and when the beam width is comparable with plasma minor radius (this is the case in FNS-ST). The resulting shine-through power density profiles on the FNS-ST first wall are shown in Figure 14 for two operation cases: (a) for nominal beam alignment (ideal focus) and (b) for beam misalignment (technological error focusing) 4/−6 mrad. From Figure 14b, one can expect very small alignment errors can lead to higher direct power losses and heating within the injector beamline and, further, produce potentially more danger for the first wall due to a higher peak in shine-through power density (~1.5 times).
The beam energy and plasma target density range are restricted not only by the risk of the chamber’s first wall damage but also by the physical parameters of equilibrium and stability. Within the frame of BTR simulations, the beam-driven effects are considered under steady-state plasma operation, as the beam impact on the target plasma stability is beyond the basic scope of BTR applications.

5. BTR Verification

Computational model verification is typically used to determine whether the verified model accurately represents the math behind the physical model. Verification can include nonexperimental testing routines such as comparison with analytic solutions and, quite often, the comparisons between codes (which is called code ‘benchmarking’). The difference between model verification and validation can be expressed briefly as follows: verification solutions are already known, so they can provide a high precision standard for the solution obtained with the model, and validation is a comparison of the model with the reality object studied, this can be performed using experimentation.
Software verification must ensure that changes to the software do not invalidate a previous verification and validation (V&V) procedure; it is needed when configuration changes occur. The solution verification should ensure that the user has appropriately used the software; the solution to each problem must be verified prior to analysis. These two aspects of verification are essential parts of the entire V&V process: a solution cannot be considered true (valid) unless both the software and simulation have been confirmed.
Code verification checks the underlying code functions correctly, and as intended, it generally includes the numerical verification of the solver and software quality assurance (SQA). The BTR numerical verification procedure is intended to show that the underlying mathematical models are implemented appropriately. This is achieved through designing the tasks test cases for which BTR models’ behavior and end solution are explicitly known and can be compared directly to the obtained results. The second part of BTR verification (‘input verification’) provides information on the model sensitivity to the input parameters and the major restrictions, if any so that the users can choose the model inputs appropriately and expect the output to converge sufficiently to the desired (‘true’) solution. The input verification can be accomplished through a formal check-and-review routine.
BTR verification is performed for each individual analysis problem. The basic numerical tests include 13 ‘physical’ test cases, which allow one to compare the results with known solutions by checking the particle dynamics, the beam shape in phase space, beam species transformations, and power/particles conservation and balance, as follows:
  • Neutral particle tracks
  • Charged particle motion in a magnetic field.
  • Charged particle motion in an electric field.
  • Charged particle motion in a combined field.
  • Beamlet current simplified profile (2D Gaussian distribution)
  • Beamlet current complex profile (core and halo fractions)
  • Positive beam source ion neutralization (H+/D+)
  • Negative beam source ion neutralization (H/D)
  • Neutral particle ionization on gas target (beam ducts volume)
  • Neutral particle ionization in plasma (tokamak volume)
  • Neutral beam power/particle balance after the neutralizer
  • Accelerated source beam power/particle balance without re-ionization losses
  • Accelerated source beam power/particle full balance (all processes included)
BTR input verification procedures include five sensitivity studies, which evaluate the solution response to the following input parameters:
  • Cut-off current input parameter effect
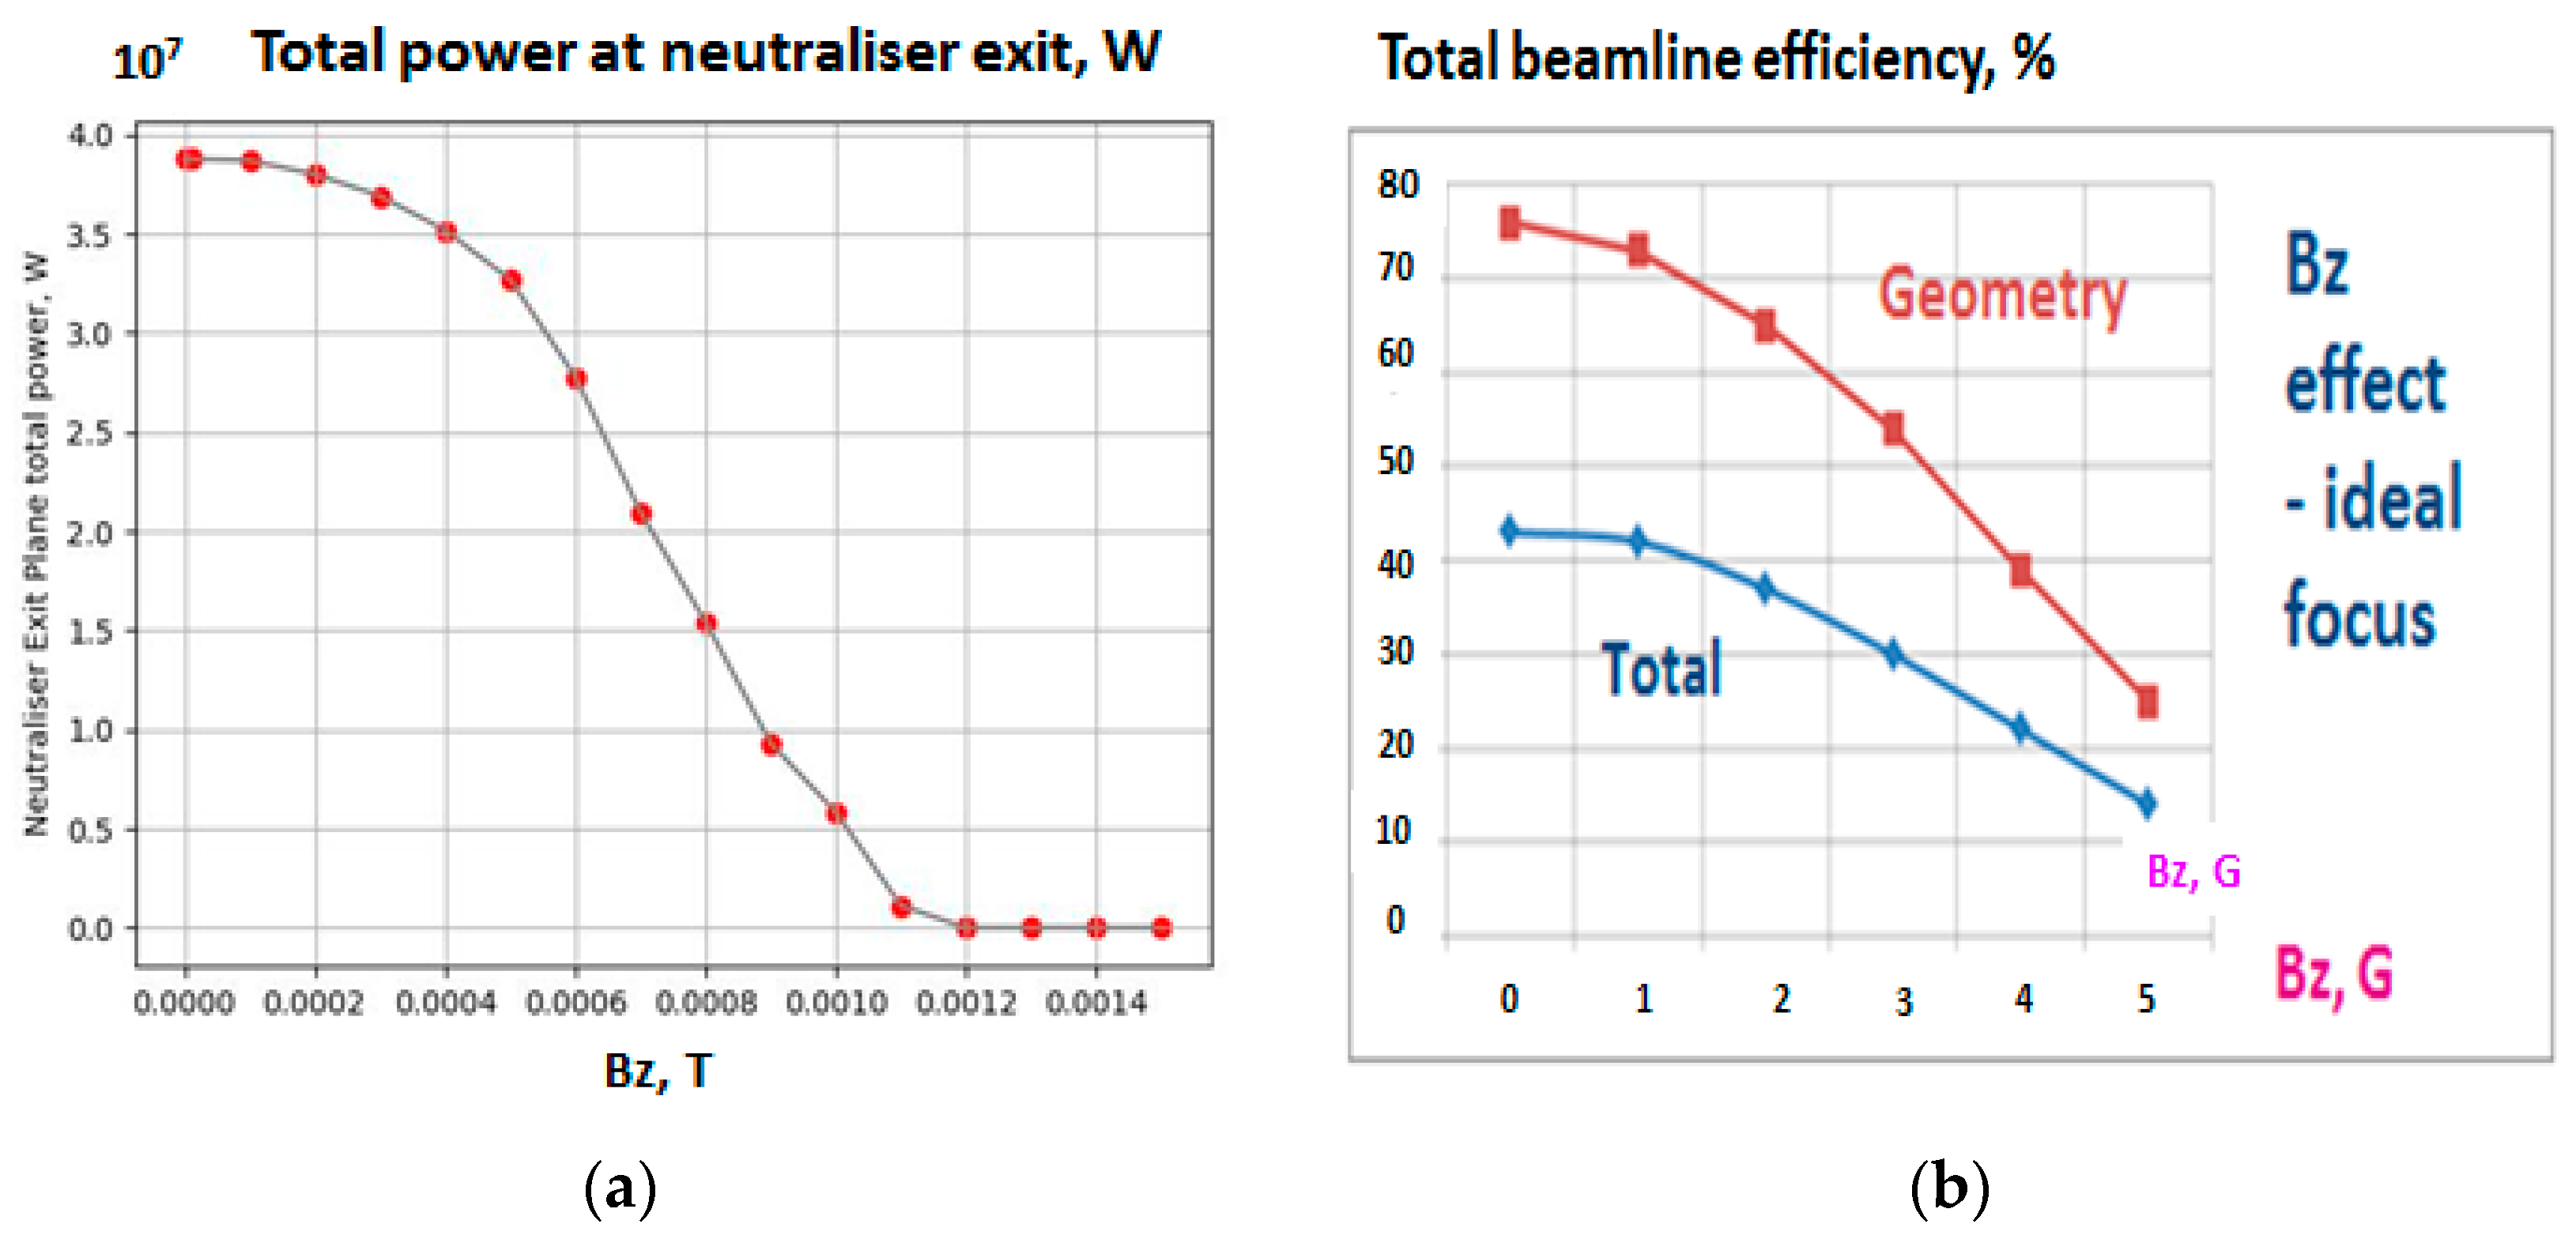
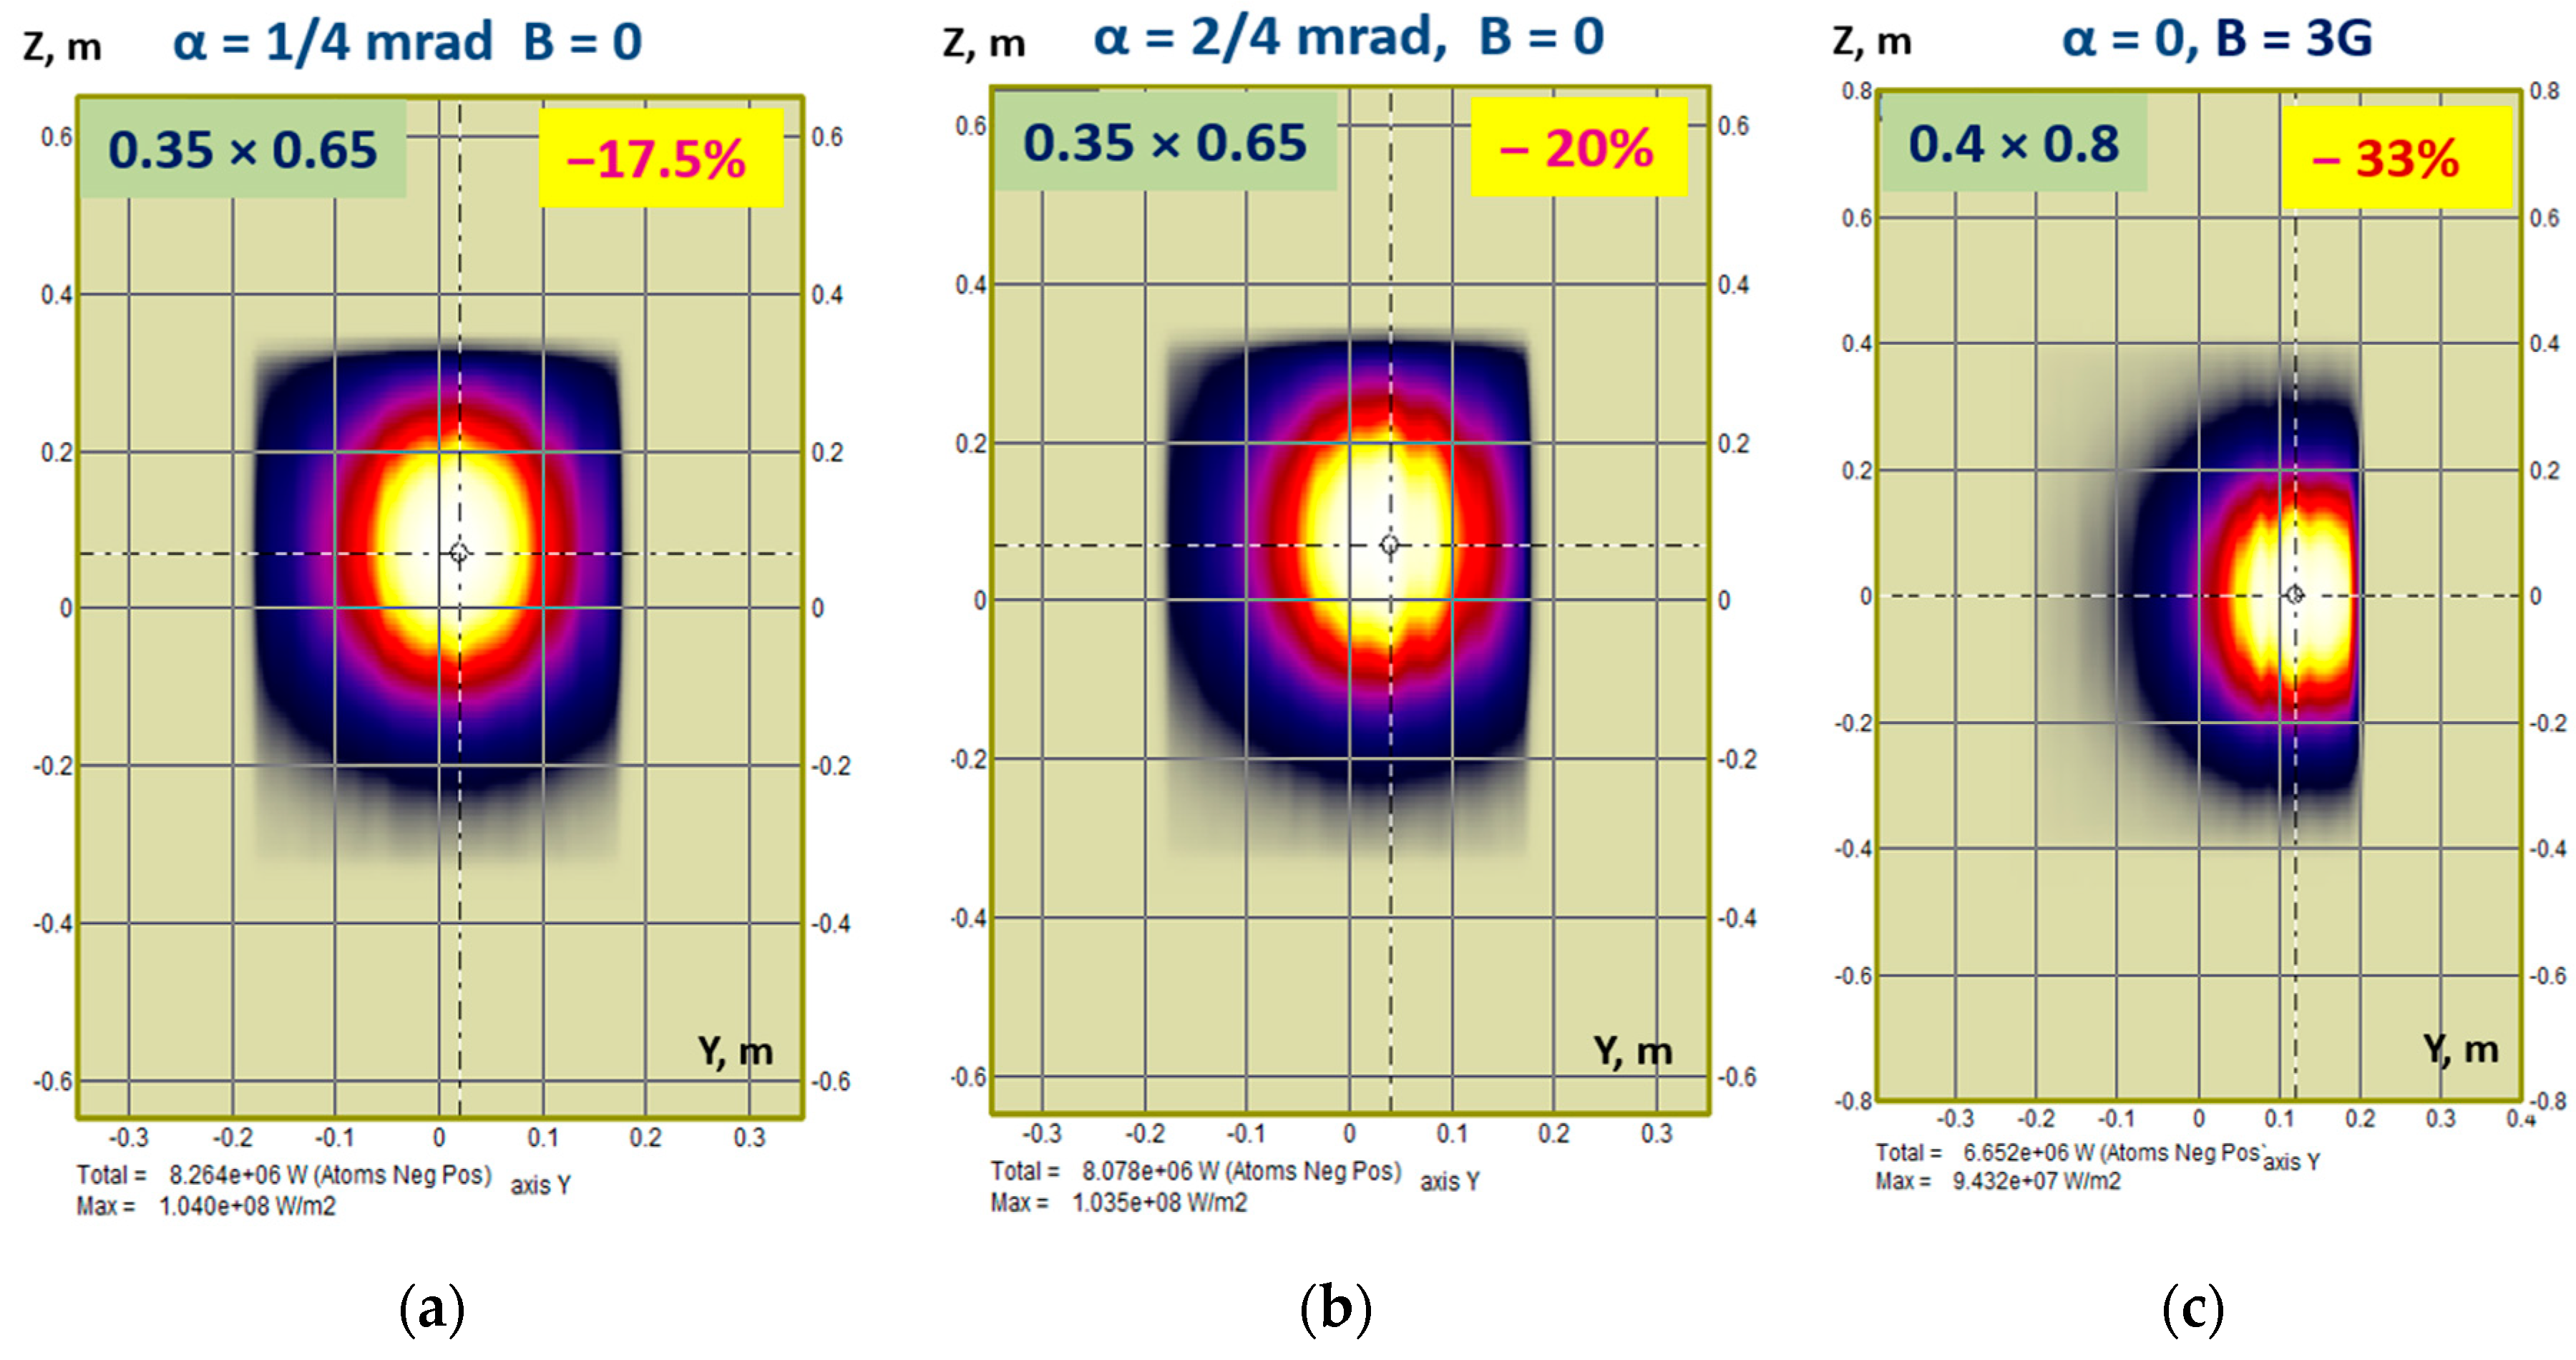
  • Magnetic field magnitude effect
  • Angular misfocusing effects
  • Atomic cross-sections and target density effects
  • The effects of the geometry representation accuracy, meshing and time steps, etc.
Even though code models are never 100% validated, they may be valid for application problems. While the 1st group of BTR verification testing depends on the code developer, the 2nd group of tests is important for BTR valid usage, as the final application validity always depends on the user. Hence, the BTR user must make a conclusion on whether the code is valid for a given application and how to tune the input parameters to obtain the desired accuracy. In theory, the BTR code could be fully validated for every beam tracing application, but it still relies on the user to provide the appropriate inputs, mesh, and steps for the problem. If this is not done, even a valid code may produce inaccurate results. The solution must be verified for any application. BTR V&V Manual, which will be included in the ‘BTR pack’ in October 2023, simply demonstrates the ability of the code to solve BTR application problems with acceptable accuracy.

6. BTR Applications

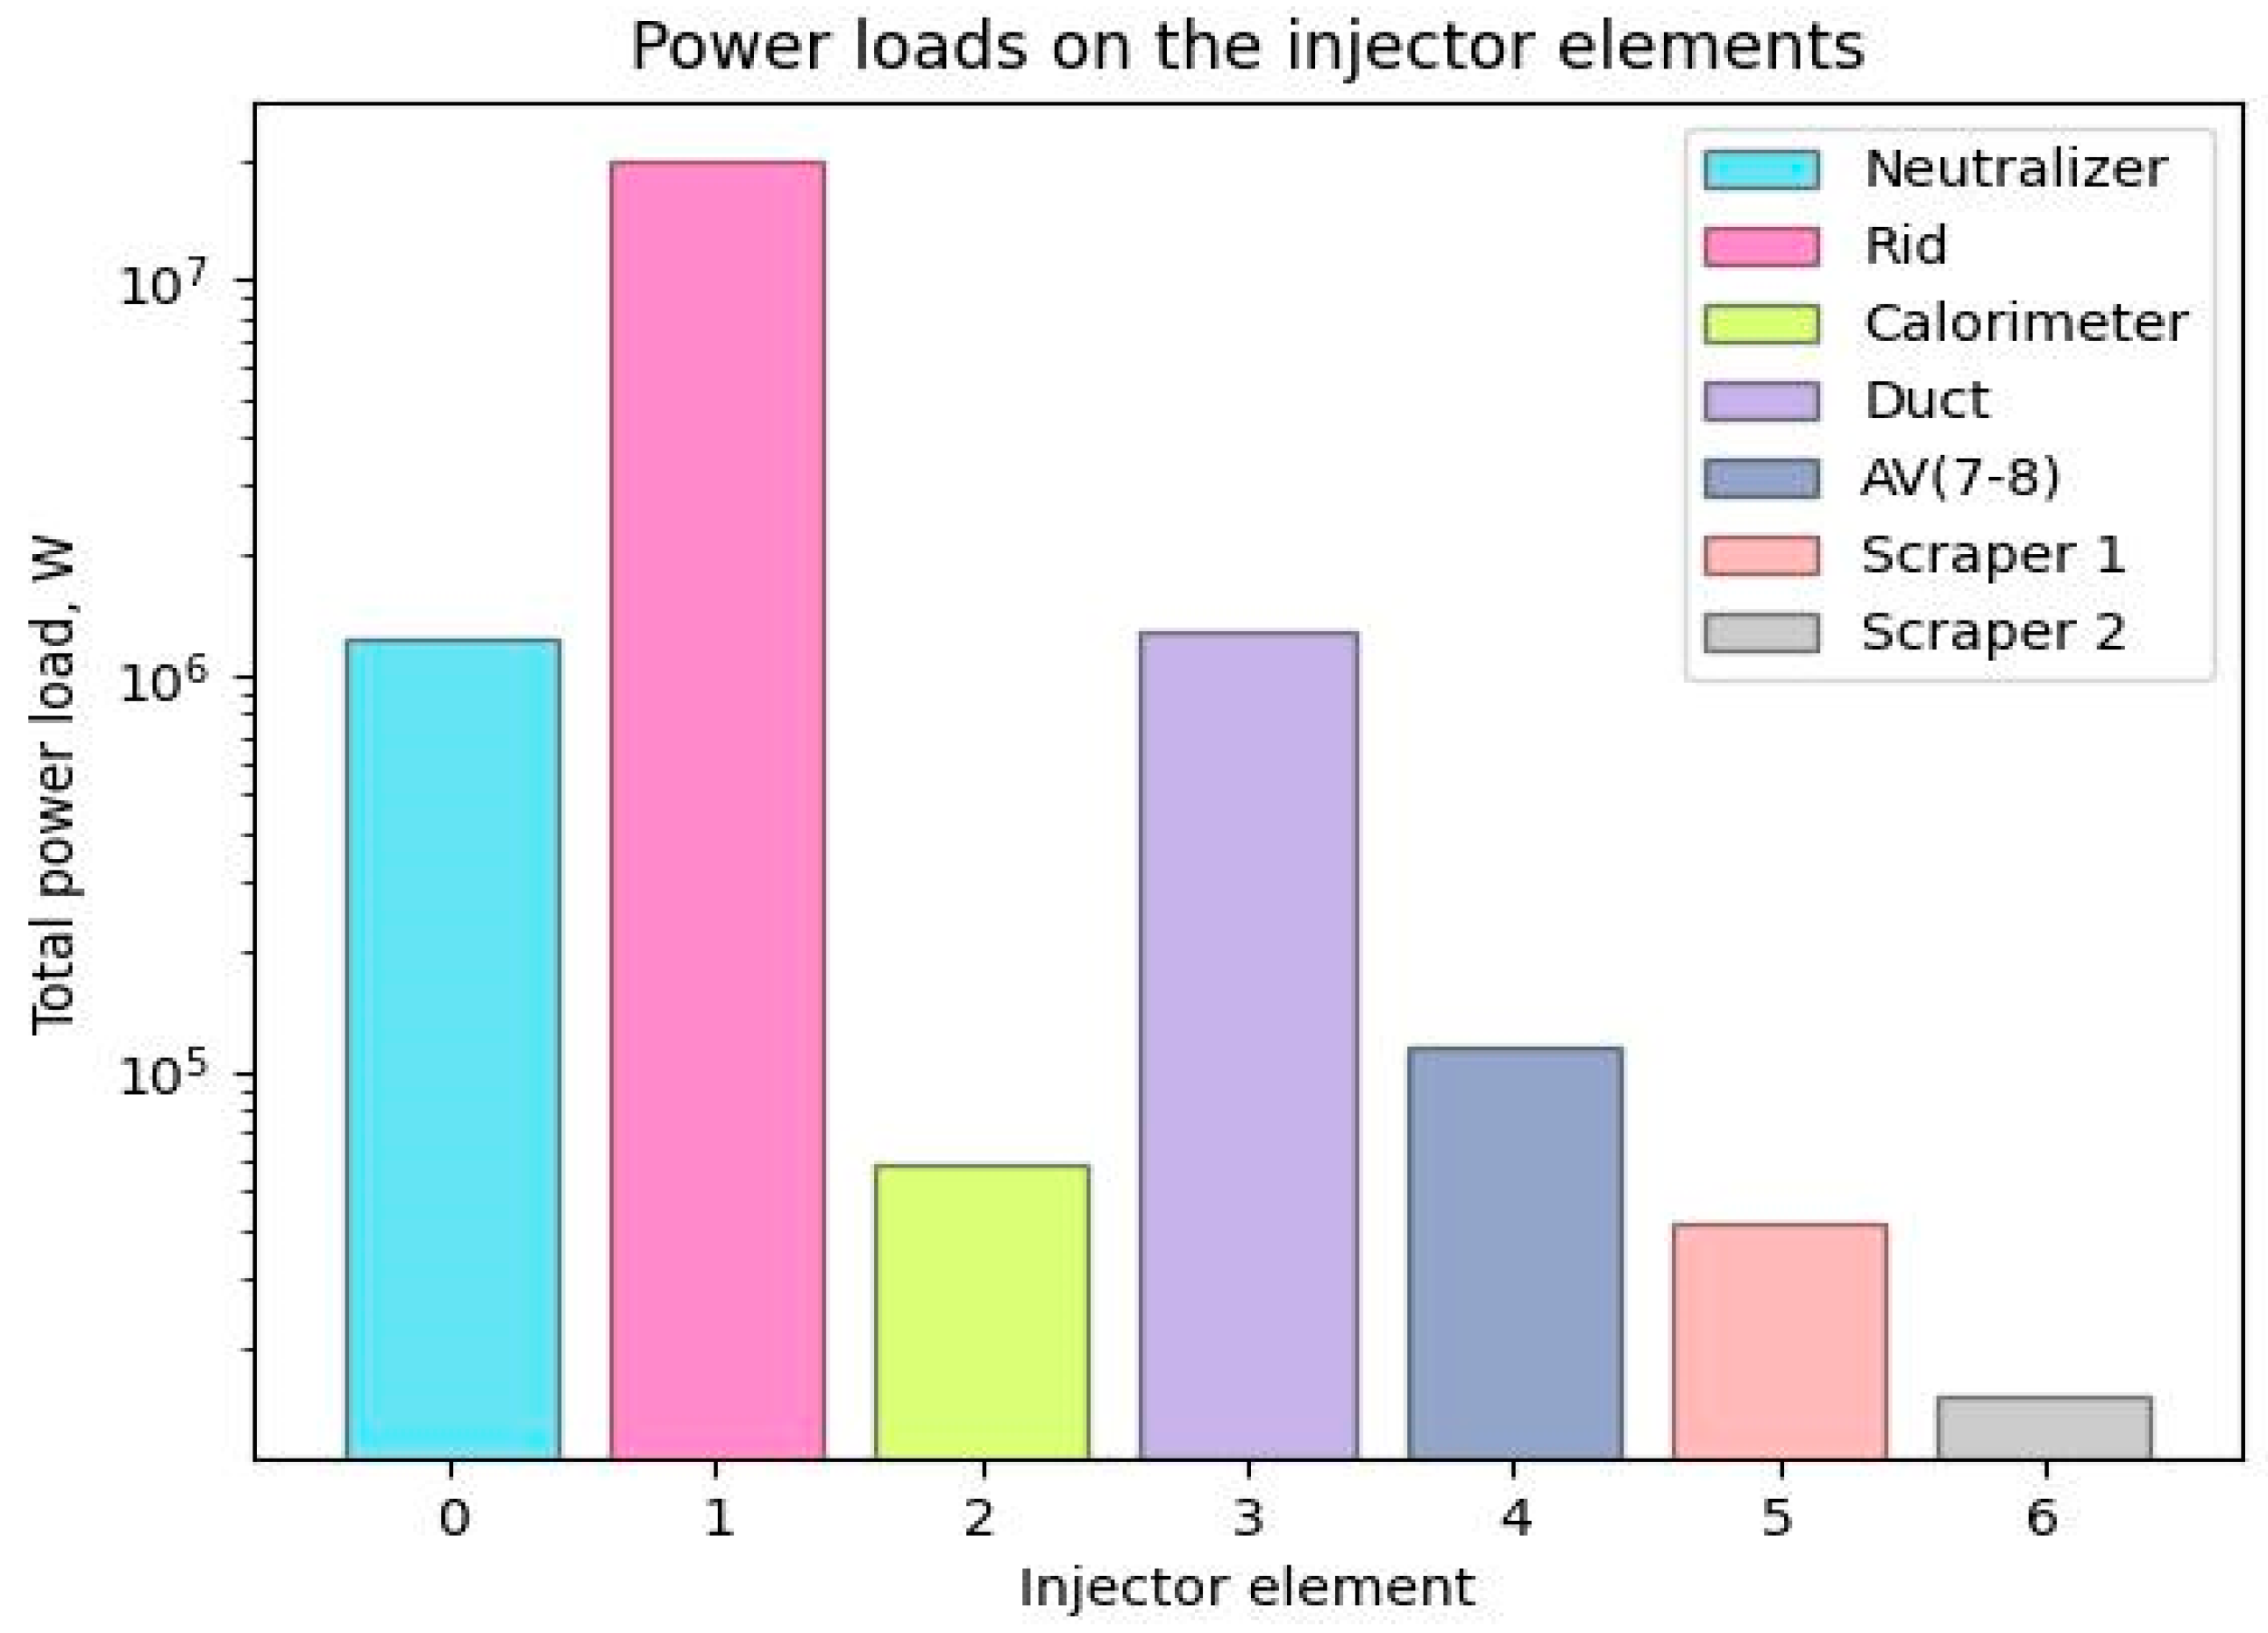
6.1. Beamline Transmission and Power Losses

BTR has been actively used for NBI design and engineering studies for ITER injectors [17]. The results of BTR analysis on beam losses and transmission performed for the heating neutral beam injector (HNB) and for the Diagnostic one (DNB) can be found in the ITER Design Description Document [18] issued in 2001.
The results of transmission loss analysis performed for similar NBI design (for DEMO-FNS) are illustrated in Figure 15, Figure 16 and Figure 17.
A highly detailed analysis of the power loads on the Front-End Components (FEC) and duct modules in ITER HNB and DNB injectors performed with BTR can be found in [2]. The analysis was carried out for various operation scenarios of the ITER machine and by scanning the injector parameters, which include NB energy, current, and hydrogen isotope. The gas profile and the magnetic field distribution varied through the scenarios; the distributions are generally obtained from other calculations and used as input for BTR. The worst-case power loads and power densities for each surface were used to study their thermomechanical behavior and manufacturing feasibility.
The importance of the obtained results and BTR value as a tool is summarized in [2] conclusion. BTR was successfully used to optimize the design of the front-end components, the duct liner, and the blanket modules for the HNB and the DNB beam lines in ITER during different phases of ITER operation (HH, HHe, DD, and DT). Various scenarios of beamlet divergences, horizontal and vertical misalignments as per ITER definitions, and the magnetic field variations due to changing tokamak operation scenarios have been considered in detail in these calculations. The maximum estimated total re-ionization losses are ~8% for the HNB beam line and ~20% for the DNB beam line. All the cases studied above have been summarized to obtain the maximum power loading and power density on each surface of the various components evaluated in these calculations and have formed the basis of the final design of these components. The process has been iteratively repeated till a design compatible with manufacturing feasibilities and safety requirements has been reached. Thermo-mechanical assessments are now completed, and the components are in their final design stage.

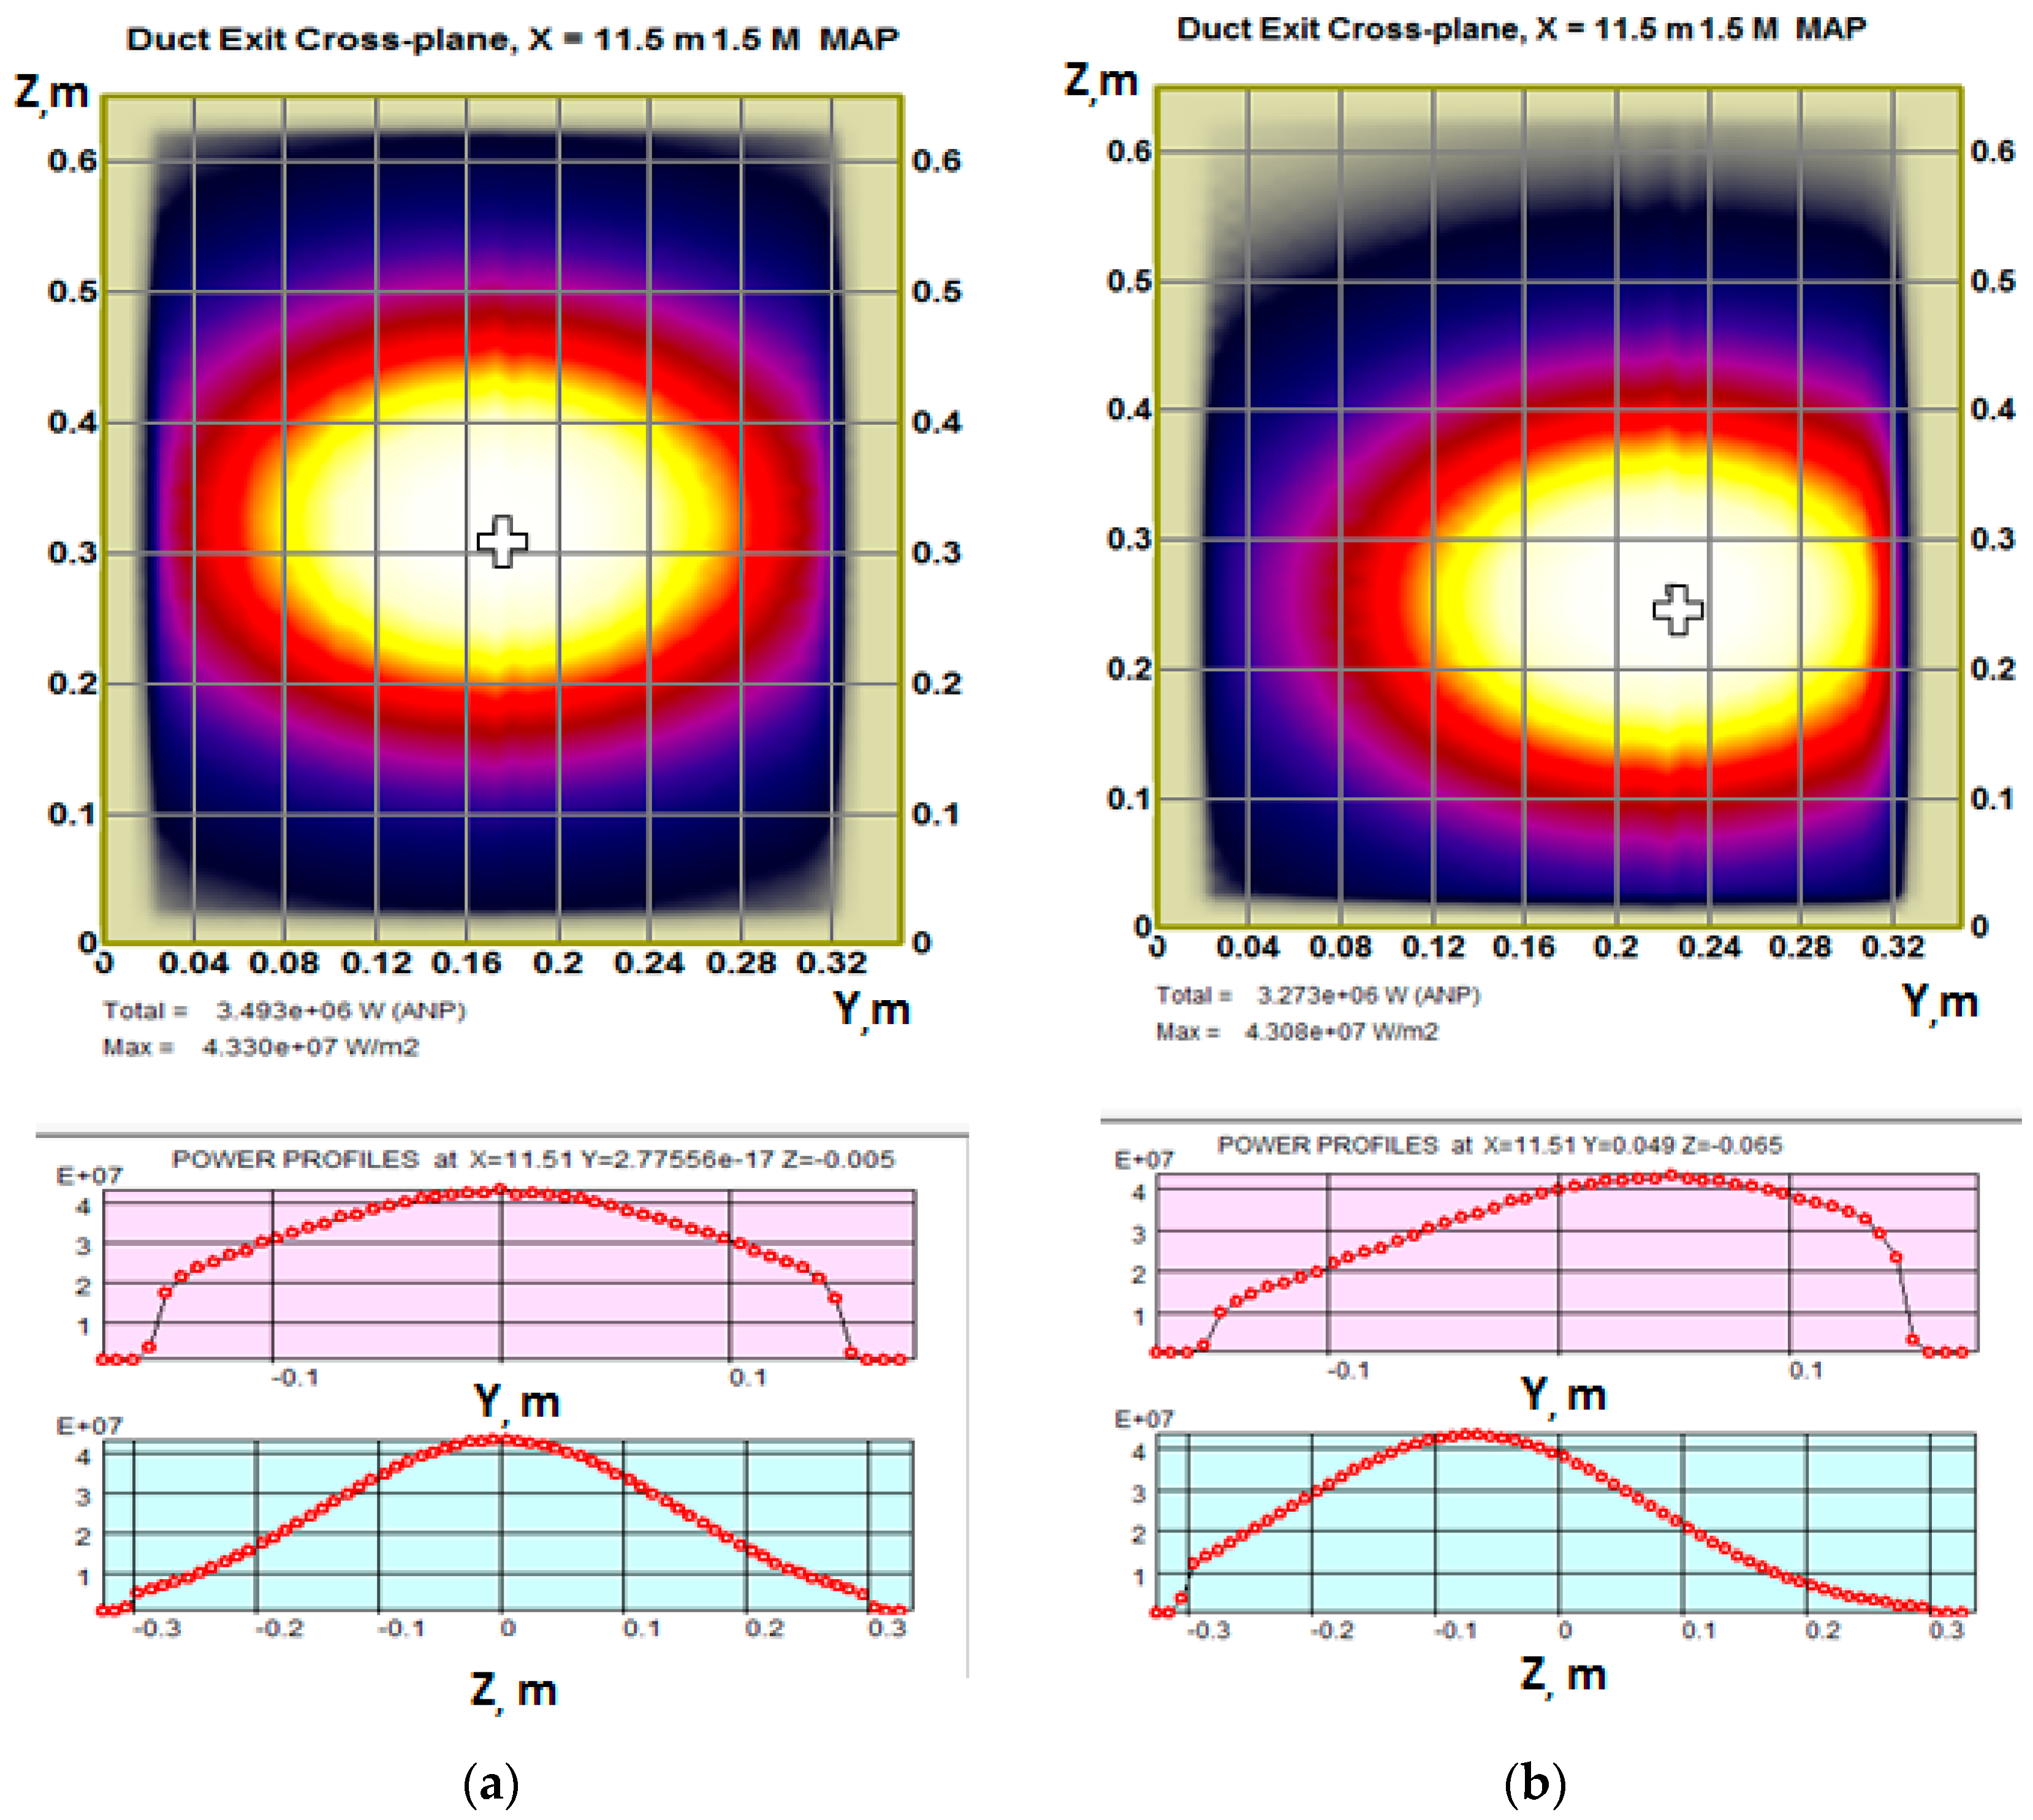
6.2. Neutral Injection Port Optimization

The injection port size issue is to be addressed in almost any NBI design. Typically, a tokamak has a reduced space available for tangential injection, so the injected beam envelope needs to be minimized at the camera entrance. The source beam internal divergence and the beamline transmission reduce the bounds on the port minimum size, and small deviations from nominal beam operation reduce the actual beamline transmission. BTR is used for the injected power sensitivity analysis while the NB port size is iterated. Figure 18 illustrates the examples for DEMO-FNS tokamak. The effects of beam misfocusing and magnetic field, even within the nominal tolerance, can reduce the injected power (Pinj) by 20–30%. When the NB window width is reduced by 5 cm only, the power losses along the beam transmission become unacceptable.

6.3. Neutral Beam Shine-Through

In addition to NBI study and optimization, BTR can be used for the injected beam efficiency optimization in plasma as well as for the evaluation of fast ions phenomena in tokamak (or any plasma confinement device). The scenarios with NBI usually feature a high contribution of fast ion population to the entire current drive, plasma rotation, nuclear fusion rates, etc. The detailed beam statistics in the NBI port plane (which takes a few seconds of BTR run) can be efficiently applied to further analysis of the fast ion behavior and the entire plasma operation.
For example, when BTR is applied to simulate beam stopping and ionization in tokamak plasma volume, the user gets the 3D beam ionized power deposition footprint, as shown in Figure 13—for DEMO-FNS. The beam deposition in plasma depends on the plasma density 3D distribution and the beam ionization cross-section (as shown in Section 4.5). The plasma density is normally defined along a minor radius (or along the poloidal magnetic flux coordinate), so the mapping procedure for toroidal coordinates onto the beam track is used for each beam ray.
The detailed beam statistics (up to 1012 test particles) are more than sufficient for the most accurate fast ion distributions both in space and angle, which is essential for beam-driven plasma scenario studies. The beam imprints shown in Figure 13 are calculated in the vertical and horizontal planes along the beam axis direction, with the beam statistics reduced to ~106 test atoms. The decay of each test atom is calculated with expression (6). The comparative analysis of the beam imprints has proved the shape effect to be essential for the beam deposition and resulting beam-driven quantities. The effect is clearly observed in Figure 12, where two characteristic beam geometries are compared: a rectangular beam shape (a bunch of parallel rays) and a Gaussian beam shape of 1280 beamlets with realistic focusing and 7 mrad divergence, with 15% halo (30 mrad).
Finally, BTR is used to calculate the beam shine-through losses and to obtain the detailed power images at the first wall, see Figure 19 and Figure 20. These results are important for the primary optimization of the injected beam parameters and targeting geometry, as well as for the plasma density range required for effective beam capture and tokamak-safe operation.

6.4. Benchmark of Different Numerical Tools for NBI Simulation

BTR code can be naturally used for cross-verification of results derived by different beam tracking software tools. One of the best examples here can be found in [13]. SAMANTHA software was recently developed for NBI design, and it mainly addresses the additional phenomena in NB lines relevant to secondary particles. While the numerical methods differ between the two codes, some results can be compared effectively. The comparison of power profiles was made for RID power density profiles, as in BTR, these profiles are obtained in a few seconds. Good agreement between the two codes’ results has shown that the SAMANTHA code is a reliable tool for NBI modeling, especially for secondary particle studies that are beyond the conventional BTR scope.
Apart from the described BTR applications, examples of BTR code usage can be found in [6,7,8,9,10,11,12,13,14,15,16]. Of course, the list of BTR references is fractional, far from being complete, as most of the papers, especially those published before 2019, cite the BTR webpage [3] as the only reference to the code or even the older page, which is not active anymore [37].

7. Conclusions and Outlook

BTR has a long story of development. It was conceived in 1995 and implemented in Turbo Pascal as ‘Beam Transmission and Re-ionization’. BTR code was ‘Born-To-Run’—i.e., issued for open access—in 2005 when it was rewritten in MS Visual C++. It has five versions up to date, with the last BTR-5 released in 2020. BTR is an efficient numerical tool for NBI engineers and physicists, which was developed by an NBI physicist. BTR allows the user to simulate the entire NBI beamline with the help of a single software tool (not a suit of codes) rather than using different packages or building software workflows. A good example of this modeling approach can be found in [38].
BTR is created to be user-friendly and fully interactive, so its popularity despite lots of other codes developed for similar purposes can be explained mainly by the opportunity for the user to quickly start and then learn by touching everything—via pushing all the buttons on the screen. BTR is supplied with a variety of numerical and graphical tools for NBI accurate studies and geometry optimization. BTR is parallel, and if compared to other beam tracing models, it runs faster by several orders. The code goes with a Windows-like GUI; the latter allows BTR to be applied for user training purposes like the NBI flight simulator.
BTR can trace up to 1010 beam test particles in a few hours maximum on humble old Windows systems, although its power is more evident in multi-thread execution on at least 4–8 cores. BTR numerical models are light and flexible, the calculation results are consistent and stable, and the methods can be verified analytically. BTR is still evolving; basic support is available to all BTR users. The information on BTR upgrades and code manuals can be found online [3]. Starting in 2024, the BTR Verification Manual will also become available online.
BTR numerical procedures can be integrated into sophisticated software packages, physical workflows, and virtual platforms [38,39,40,41,42,43]. In the future, BTR can be transferred to Linux as well. This would only require some more effort (and man- or womanpower). Still, we believe BTR value does not come from advanced numerical techniques, which are simple and straightforward, but rather from code simplicity, interactivity, and flexible input: BTR usage feels like a computer game.

Author Contributions

Conceptualization, E.D.; methodology, E.D.; software, E.D.; validation, M.K.; formal analysis, E.D.; investigation, E.D. and M.K.; data curation, M.K.; writing—original draft preparation, E.D.; writing—review and editing, E.D.; visualization, E.D.; supervision, M.K.; project administration, E.D. All authors have read and agreed to the published version of the manuscript.

Funding

This research received no external funding.

Institutional Review Board Statement

Not applicable.

Informed Consent Statement

Not applicable.

Data Availability Statement

Not applicable.

Acknowledgments

BTR was developed by the author’s enthusiasm, occasionally supported by ITER, and eventually became useful due to BTR users’ enormous patience and a strong will to make it better. In fact, waiting for the new code versions to come, the updates, permanent testing, and debugging required lots of time and effort from them. Thus, all BTR users should be considered as true BTR co-authors.

Conflicts of Interest

The authors declare no conflict of interest.

References

  1. Hemsworth, R.S.; Boilson, D.; Blatchford, P.; Palma, M.D.; Chitarin, G.; de Esch, H.P.L.; Geli, F.; Dremel, M.; Graceffa, J.; Marcuzzi, D.; et al. Overview of the design of the ITER heating neutral beam injectors. New J. Phys. 2017, 19, 025005. [Google Scholar] [CrossRef]
  2. Singh, M.J.; Boilson, D.; Hemsworth, R.S.; Geli, F.; Graceffa, J.; Urbani, M.; Dlougach, E.; Krylov, A.; Schunke, B.; Chareyre, J. Power loads on the front end components and the duct of the heating and diagnostic neutral beam lines at ITER. AIP Conf. Proc. 2015, 1655, 050011. [Google Scholar]
  3. Dlougach, E.D. BTR Code for Neutral Beam Design. Available online: https://sites.google.com/view/btr-code/home (accessed on 8 August 2022).
  4. Dlougach, E.D. BTR code for NBI Design and Optimization. AIP Conf. Proc. 2021, 2373, 080004. [Google Scholar]
  5. Dlougach, E.D.; Veltri, P. BTR code recent modifications for multi-run operation. AIP Conf. Proc. 2021, 2373, 080010. [Google Scholar]
  6. Oh, B.H.; Dlougach, E.D. Beam transport code for the KSTAR NB heating system. In Proceedings of the 20th IEEE/NPSS Symposium on Fusion Engineering, SOFE-03, San Diego, CA, USA, 14–17 October 2003; pp. 474–477. [Google Scholar]
  7. Bandyopadhyay, M.; Singh, M.J.; Singh, M.J.; Rotti, C.; Chakraborty, A.; Hemsworth, R.S.; Schunke, B. Beamline optimization for 100-keV diagnostic neutral beam injector for ITER. IEEE Trans. Plasma Sci. 2010, 38, 242–247. [Google Scholar] [CrossRef]
  8. Surrey, E.; Holmes, A.; McAdams, R.; King, D. Operation of the ITER Electrostatic Residual Ion Dump with a Perturbed Field. J. Fusion Energy 2010, 29, 486–498. [Google Scholar] [CrossRef]
  9. Chang, D.H.; Jeong, S.H.; Kim, T.-S.; Lee, K.W.; In, S.R.; Bae, Y.-S.; Kim, J.-S.; Park, H.-T.; Kim, D.-H.; Yang, H.-L. Performance of 300 s-beam extraction in the KSTAR neutral beam injector. Curr. Appl. Phys. 2012, 12, 1217–1222. [Google Scholar] [CrossRef]
  10. Veltri, P.; Agostinetti, P.; Palma, M.D.; Sartori, E.; Serianni, G. Evaluation of power loads on MITICA beamline components due to direct beam interception and electron backscattering. Fusion Eng. Des. 2013, 88, 1011–1014. [Google Scholar] [CrossRef]
  11. Sartori, E.; Veltri, P.; Dlougach, E.; Hemsworth, R.; Serianni, G.; Singh, M. Benchmark of numerical tools simulating beam propagation and secondary particles in ITER NBI. In NIBS-2014 AIP Conference Proceedings; AIP Publishing: College Park City, MA, USA, 2015; Volume 1655, p. 050006. [Google Scholar]
  12. McAdams, R. Beyond ITER: Neutral beams for a demonstration fusion reactor (DEMO). Rev. Sci. Instrum. 2014, 85, 02B319. [Google Scholar] [CrossRef]
  13. Sartori, E.; Veltri, P.; Serianni, G.; Palma, M.D.; Chitarin, G.; Sonato, P. Modeling of Beam Transport, Secondary Emission and Interactions with Beam-Line Components in the ITER Neutral Beam Injector. IEEE Trans. Plasma Sci. 2014, 42, 633–639. [Google Scholar] [CrossRef]
  14. McAdams, R.; Holmes, A.J.T.; King, D.B.; Surrey, E.; Turner, I.; Zacks, J. Negative ion research at the Culham Centre for Fusion Energy (CCFE) © EURATOM/CCFE. New J. Phys. 2016, 18, 125013. [Google Scholar] [CrossRef]
  15. Palma, M.D.; Pasqualotto, R.; Sartori, E.; Tinti, P.; Zaccaria, P.; Zaupa, M.; Krilov, A.; Panasenkov, A.; Blatchford, P.; Chuilon, B.; et al. The beamline for the ITER heating neutral beam injectors: A case study for development and procurement of high heat flux components. Fusion Eng. Des. 2021, 171, 112559. [Google Scholar] [CrossRef]
  16. Ananyev, S.S.; Dlougach, E.; Krylov, A.; Panasenkov, A.; Kuteev, B. Modeling and optimization of the neutral beam line for plasma heating and current drive for the DEMO-FNS fusion neutron source project. Fusion Eng. Des. 2020, 161, 112064. [Google Scholar] [CrossRef]
  17. Hemsworth, R.; Decamps, H.; Graceffa, J.; Schunke, B.; Tanaka, M.; Dremel, M.; Tanga, A.; De Esch, H.; Geli, F.; Milnes, J.; et al. Status of the ITER heating neutral beam system. Nucl. Fusion 2009, 49, 045006. [Google Scholar] [CrossRef]
  18. ITER Final Design Report; NB H&CD, DDD 5.3; IAEA: Vienna, Austria, 2001.
  19. Available online: https://winworldpc.com/product/turbo-pascal/7x (accessed on 25 August 2023).
  20. Kuteev, B.V.; Goncharov, P.R.; Sergeev, V.Y.; Khripunov, V.I. Intense fusion neutron sources. Plasma Phys. Rep. 2010, 36, 281–317. [Google Scholar] [CrossRef]
  21. Kuteev, B.V.; Goncharov, P.R. Fusion–Fission Hybrid Systems: Yesterday, Today, and Tomorrow. Fusion Sci. Technol. 2020, 76, 836–847. [Google Scholar] [CrossRef]
  22. Kuteev, B.V.; Shpanskiy, Y.; Team, D.-F. Status of DEMO-FNS development. Nucl. Fusion 2017, 57, 076039. [Google Scholar] [CrossRef]
  23. Kuteev, B.V.; Azizov, E.; Bykov, A.; Dnestrovsky, A.; Dokuka, V.; Gladush, G.; Golikov, A.; Goncharov, P.; Gryaznevich, M.; Gurevich, M.; et al. Steady state operation in compact tokamaks with copper coils. Nucl. Fusion 2011, 51, 073013. [Google Scholar] [CrossRef]
  24. Chernyshev, F.V.; Afanasyev, V.I.; Gusev, V.K.; Ivanov, A.E.; Kurskiev, G.S.; Melnik, A.D.; Minaev, V.B.; Mironov, M.I.; Nesenevich, V.G.; Patrov, M.I.; et al. Study of fast-ion losses in experiments on neutral beam injection on the Globus-M spherical tokamak. Plasma Phys. Rep. 2011, 37, 553–571. [Google Scholar] [CrossRef]
  25. Heidbrink, W.W.; Van Zeeland, M.; Grierson, B.; Muscatello, C.; Park, J.; Petty, C.; Prater, R.; Zhu, Y. Initial measurements of the DIII-D off-axis neutral beams. Nucl. Fusion 2012, 52, 094005. [Google Scholar] [CrossRef]
  26. Hemsworth, R.S. Long pulse neutral beam injection. Nucl. Fusion 2003, 43, 851–861. [Google Scholar] [CrossRef]
  27. Hopf, C.; Starnella, G.; Harder, N.D.; Fantz, U. Neutral beam injection for fusion reactors: Technological constraints versus functional requirements. Nucl. Fusion 2021, 61, 106032. [Google Scholar] [CrossRef]
  28. Khvostenko, P.P.; Anashkin, I.; Bondarchuk, E.; Injutin, N.; Khvostenko, A.; Kochin, V.; Kuzmin, E.; Levin, I.; Lutchenko, A.; Modyaev, A.; et al. Tokamak T-15MD—Two years before the physical start-up. Fusion Eng. Design. 2019, 146, 1108–1112. [Google Scholar] [CrossRef]
  29. Dlougach, E.D.; Panasenkov, A.; Kuteev, B.; Serikov, A. Neutral beam coupling with plasma in a compact fusion neutron source. Appl. Sci. 2022, 12, 8404. [Google Scholar] [CrossRef]
  30. Karpushov, A.N.; Bagnato, F.; Baquero-Ruiz, M.; Coda, S.; Colandrea, C.; Dolizy, F.; Dubray, J.; Duval, B.P.; Fasel, D.; Fasoli, A.; et al. Upgrade of the neutral beam heating system on the TCV tokamak—Second high energy neutral beam. Fusion Eng. Des. 2023, 187, 113384. [Google Scholar] [CrossRef]
  31. Jaulmes, F.; Zadvitskiy, G.; Bogar, K.; Mysiura, I.; Varju, J.; Jeřáb, M.; Komm, M.; Imrisek, M. Numerical modelling for beam duct heat loads calculations and application to the new 1 MW neutral beam injector in the COMPASS tokamak. Plasma Phys. Control. Fusion 2022, 64, 125001. [Google Scholar] [CrossRef]
  32. Ivanov, A.A.; Davydenko, V.I.; Belchenko, Y.I. Negative ion and neutral beams injectors at the Budker Institute of nuclear physics. AIP Conf. Proc. 2018, 2052, 030003. [Google Scholar]
  33. Oikawa, T.; Park, J.M.; Polevoi, A.R.; Schneider, M.; Giruzzi, G.; Murakami, M.; Tani, K.; Sips, A.C.C.; Kessel, C.; Houlberg, W.; et al. Benchmarking of neutral beam current drive codes as a basis for the integrated modeling for ITER. In Proceedings of the 22nd International Conference on Fusion Energy, (Vienna, IAEA, 2008), Geneva, Switzerland, 13–18 October 2008. [Google Scholar]
  34. Dlougach, E.D. BTR Application for Beam Slowing-down Analysis. AIP Conf. Proc. 2021, 2373, 080009. [Google Scholar]
  35. Pankin, A.; McCune, D.; Andre, R.; Bateman, G.; Kritz, A. The tokamak Monte Carlo fast ion module NUBEAM in the National Transport Code Collaboration library. Comput. Phys. Commun. 2004, 159, 157–184. [Google Scholar] [CrossRef]
  36. Janev, R.K.; Boley, C.; Post, D. Penetration of energetic neutral beams into fusion plasmas. Nucl. Fusion 1989, 29, 2125. [Google Scholar] [CrossRef]
  37. Available online: http://btr.org.ru (accessed on 28 October 2020).
  38. Harder, N.; Orozco, G.; Zammuto, I.; Hopf, C. Modeling neutral beam transport in fusion experiments: Studying the effects of reionisation and deflection. Fusion Eng. Des. 2019, 146, 518–521. [Google Scholar] [CrossRef]
  39. Imbeaux, F.; Pinches, S.; Lister, J.; Buravand, Y.; Casper, T.; Duval, B.; Guillerminet, B.; Hosokawa, M.; Houlberg, W.; Huynh, P.; et al. Design and first applications of the ITER integrated modelling & analysis suite. Nucl. Fusion 2015, 55, 123006. [Google Scholar]
  40. Romanelli, M.; Corrigan, G.; Parail, V.; Wiesen, S.; Ambrosino, R.; Belo, P.D.S.A.; Garzotti, L.; Harting, D.; Köchl, F.; Koskela, T.; et al. JINTRAC: A system of codes for integrated simulation of tokamak scenarios. Plasma Fusion Res. 2014, 9, 3403023. [Google Scholar] [CrossRef]
  41. Romanelli, M.; Coelho, R.; Coster, D.; Ferreira, J.; Fleury, L.; Henderson, S.; Hollocombe, J.; Imbeaux, F.; Jonsson, T.; Kogan, L.; et al. Code integration, data verification, and models validation using the ITER integrated modeling and analysis system (IMAS) in EUROfusion. Fusion Sci. Technol. 2020, 76, 894. [Google Scholar] [CrossRef]
  42. Lee, C.Y.; Seo, J.; Park, S.; Lee, J.; Kim, S.; Kim, B.; Byun, C.; Lee, Y.; Gwak, J.; Kang, J.; et al. Development of integrated suite of codes and its validation on KSTAR. Nucl. Fusion 2021, 61, 096020. [Google Scholar] [CrossRef]
  43. Kwon, J.M.; Choi, H.; Ki, J.; Park, S.H.; Kim, Y.J.; Cho, H.; Kim, S.; Chae, H.S.; Lee, K.-S.; Woo, M.; et al. Development of a Virtual Tokamak platform. Fusion Eng. Des. 2022, 184, 113281. [Google Scholar] [CrossRef]
Figure 1. Neutral beamline without transmission ducts.
Software 02 00022 g001
Figure 2. Outline of NBI transmission ducts (import from CAD).
Software 02 00022 g002
Figure 3. NBI beamlets axes focusing in FNS-ST compact NBI model.
Software 02 00022 g003
Figure 4. (a) The beam source particles statistical distribution before neutralization, left to right: (X, Y), (ϴx, ϴy), (X, ϴx), (Y, ϴy), where X, Y—horizontal and vertical position in the plane, ϴx, ϴy—horizontal and vertical angle from the beam main axis. The beam source spatial dimensions (shown in the left plot) correspond to the plasma emitter rectangle W × H = 18 × 115 cm2. (b) The neutral beam distribution in the NBI port plane: (X, Y), (ϴx, ϴy), (X, ϴx), (Y, ϴy), where X, Y—horizontal and vertical position in the plane, ϴx, ϴy—horizontal and vertical angle from the beam main axis.
Software 02 00022 g004aSoftware 02 00022 g004b
Figure 5. BTR screen with beamline standard ITER-like geometry and beamlets’ axes (X, Y, and Z units are [m]).
Software 02 00022 g005
Figure 6. BTR dialogs for parameter input by category and input preview.
Software 02 00022 g006
Figure 7. BTR plots with neutral beam power density at virtual planes: upper—along the beamline; lower—across the beamline (taken at different distances from BS GG).
Software 02 00022 g007
Figure 8. Power density (PD) maps of the injected NB footprint (maximum value is coded white, minimum—black, background area is shown olive), and correspondent power density profiles (FNS-ST, port with size 30 × 60 cm2). The beamlets’ focus is on a horizontal plane at 10.5 m: (a) ideal alignment, total power—3.49 MW, maximum PD—43.3 MW/m2; (b) beam misalignment 4/−6 mrad, total power—3.27 MW, maximum PD—43.1 MW/m2. The maps are shown in local coordinates.
Software 02 00022 g008
Figure 9. BTR subplots with gas target and beam fractions in the neutralizer (ITER NBI): (a) gas local density and thickness; (b) species source/loss rates; (c) species integral output.
Software 02 00022 g009
Figure 10. Residual ions deflection and dumping in ERID channel (DEMO-FNS): (a) positive/negative ions trajectories; (b) power density map and profiles at the dumping panel.
Software 02 00022 g010
Figure 11. BTR screen with re-ionized particles (red) downstream of the neutralizer (DEMO-FNS). Atoms are shown in blue, negative source ions—in green color.
Software 02 00022 g011
Figure 12. Neutral beam stopping calculation: (a) stopping cross-section ( σ S , 10−16 cm2) vs. beam energy and plasma density; (b) stopping cross-section ( σ S , 10−16 cm2) for varied temperature (Te) and plasma density (ne); (c) stopping cross-section ( σ S , 10−16 cm2) for H/D/T beams, Te = 5 keV, ne = 0.3 × 10²⁰ m−3; (d) neutral beam current attenuation (green) and ion birth rate (red) along NB passage through plasma.
Software 02 00022 g012
Figure 13. BTR subplots with neutral beam spatial deposition (ionization rate intensity) in DEMO-FNS plasma (BTR plots) along the injected neutral beam axis (NB enters from the left): (a,b) vertical cross-section plane, (c,d) horizontal cross-section plane; (a,c) correspond to rectangular beam shape; (b,d) refer to the realistic beam shape—with divergence and beamlet focusing.
Software 02 00022 g013
Figure 14. BTR plots with NB shine-through PD at FNS-ST first wall (NBI port size 0.3 × 0.6 m2) for two operation cases: (a) ideal beam focus, total power—0.147 MW, peak PD—1.65 MW/m2; (b) beam misalignment 4/−6 mrad in horizontal and vertical planes, total power—0.167 MW, peak PD—2.43 MW/m2.
Software 02 00022 g014
Figure 15. DEMO-FNS NBI efficiency as a function of vertical magnetic field (Bz): (a) total neutral power (PNeutr) at the Neutralizer exit; (b) beamline geometry transmission (Pinj/PNeutr) and total power efficiency (Pinj/P0) shown in %.
Software 02 00022 g015
Figure 16. DEMO-FNS NBI efficiency as a function of beam misalignment in horizontal and vertical planes: (a) total injected power (Pinj) at the duct exit; (b) beamline geometry transmission (Pinj/PNeutr) and total power efficiency (Pinj/P0).
Software 02 00022 g016
Figure 17. Total power deposition at DEMO-FNS NBI major components during the beam injection to tokamak (with calorimeter in open position).
Software 02 00022 g017
Figure 18. BTR subplots showing the injected beam footprints in NB port plane illustrating the effect of the beam misfocusing and/or magnetic field on injected beam power in DEMO-FNS tokamak: (a) source beam misalignment values in horizontal and vertical directions 1 mrad and 4 mrad (17.5% lost); (b) misalignment values 2 mrad and 4 mrad (20% lost); (c) ideal beam focusing with vertical magnetic field 3 G (33% lost).
Software 02 00022 g018
Figure 19. BTR plots with injected neutral beam stopping in DEMO-FNS tokamak for two values of plasma density: (a) ne = 1020 m−3; (b) ne = 0.5 × 10²⁰ m−3.
Software 02 00022 g019
Figure 20. BTR plots with the injected neutral beam shine-through power footprints at the first wall in DEMO-FNS tokamak: (a) rectangular beam shape; (b) gauss beam shape.
Software 02 00022 g020
Disclaimer/Publisher’s Note: The statements, opinions and data contained in all publications are solely those of the individual author(s) and contributor(s) and not of MDPI and/or the editor(s). MDPI and/or the editor(s) disclaim responsibility for any injury to people or property resulting from any ideas, methods, instructions or products referred to in the content.

