Article

The Energetics and Topology of Grain Boundaries in Magnesium: An Ab Initio Study

Future Industries Institute, University of South Australia, Mawson Lakes, SA 5095, Australia
*
Author to whom correspondence should be addressed.
Alloys 2022, 1(1), 15-30; https://doi.org/10.3390/alloys1010003
Submission received: 15 December 2021 / Revised: 3 February 2022 / Accepted: 9 February 2022 / Published: 16 February 2022

Abstract

:
First principles calculations were carried out on six different grain boundaries with complex, non-symmetrical, crystallography’s. Solute species (Gd and Zn) were placed in multiple locations to investigate their effect on the boundary energetics. The grain boundaries were found to have an intrinsic grain boundary energy, and this energy was not markedly affected by the solute concentration at the boundary. However, the work of separation (WSEP) was very sensitive to grain boundary chemistry. Boundaries of higher disorder were found to be more sensitive to boundary chemistry and showed higher values of WSEP and in the case of Gd, were more sensitive to solute concentration at the boundary. No correlation between the boundary behaviour and crystallography could be found, apart from the over-riding conclusion that all six boundaries showed markedly different behaviours, and the effect of solute on each were unique.

Graphical Abstract

1. Introduction

In polycrystalline materials grains form a network of grain boundaries [1], which determine the materials response to external fields [2,3]. Grain boundaries are characterized by five macroscopic degrees of freedom consisting of the rotation axis, the normal to the interface plane and the rotation angle [4]. The rotation axis and the boundary normal can be either perpendicular to, or parallel with each other. The former case is referred to as a tilt boundary and the latter, is called a twist grain boundary. In most cases, boundaries are neither perfectly twist or tilt in character, but are mixed. Although some boundaries show symmetry across the boundary interface, again this is not very common and asymmetrical grain boundaries [5] constitute a significant fraction of boundaries in real materials [6]. In addition to their crystallography, boundaries can also contain chemistries different to the bulk. In the case of magnesium, the segregation of elements with large atomic radii such as the rare earth (RE) elements have been shown to be quite strong. This topic is of particular interest because these elements are strong texture modifiers during recrystallisation, and this is attributed to their interaction with grain boundaries.
It has been found that the RE elements segregate to dislocations [7] and grain boundaries [8,9,10,11,12,13,14,15,16,17,18], and it has also been shown that elemental pair such as Gd and Zn are found to co-segregate [8]. It has been suggested on the literature that the presence of these solutes at the boundary are responsible for their ability to modify the texture [14], and this is the reason we are interested in studying the effects of RE elements on the grain boundary energetics. In many regards it is still an open question as to exactly how RE elements modify texture, and this paper is part of a larger computational project that aims to unravel some of these mysteries. Recently, we applied quantum mechanical calculations to try and understand the electronic origins of the rare earth effect in magnesium [19]. Specifically, we wanted to know why the RE elements displayed this behaviour, while other elements from different groups in the periodic table do not. Our calculations showed that the inclusion of rare earth elements at grain boundaries resulted in bonding states that stabilized the solid solution and increased the bonding strength between segregants and the matrix. In terms of the electronic structure of these elements, the partially occupied outer d band of RE segregants paves the way for a strong bonding between these elements and the magnesium matrix. [19]. Moreover, the local atomic packing at the boundary was observed to have impacted the electronic structure in markedly different ways. These observations shed light on why rare earth elements are potent texture modifiers during recrystallisation. However, the effect of solute concentration at the boundary has not yet been interrogated. Therefore, in the present work, we adopt a consistent computational approach to interrogate in more detail the effect of solutes and solute concentration on the grain boundary energetics. We also include in this study an additional three boundaries, and examine the differences in boundary energetics that occur when solutes adopt different locations along the grain boundary.
It is pertinent to note that much experimental, and computational effort has been devoted to characterizing microstructures arising from grains and their boundaries [20,21], the description of which includes amongst other things, their energetic [22], geometric, and topological features [21]. Nevertheless, computational studies are typically dedicated to symmetrical boundaries and this shortcoming is particularly eminent in ab initio simulations where most studies (for example [23]) restrict themselves to crystallographically simple tilt boundaries to minimise the size of the simulation to around 100 atoms. Nonetheless, the boundaries that we see experimentally are rarely simple or symmetrical. Therefore, to obtain boundaries with features that we would see experimentally, the size of the simulation cells in the present work is pushed to the largest computationally possible size in order to examine non-symmetrical grain boundaries. We examine six general boundaries consisting of tilt, twist, and irrational boundary crystallography. Two solutes are examined, Gd and Zn. Of particular interest is the grain boundary concentration. This is difficult to quantify experimentally, and therefore rarely appears in the literature. Lacking solid experimental evidence for the boundary concentrations that we might expect, we utilized atom probe tomography to examine the grain boundary concentration in a ternary Mg-Gd-Zn alloy, Figure 1. It can be seen that the boundary concentration of both Gd and Zn were found to be ~3 at% at the boundary, 6 at% total solute concentration. Therefore, in the present case our simulations were based on a notional boundary concentration of 5 at%.

2. Materials and Methods

2.1. Grain Boundary Crystallography

First principles calculations were carried out on six general boundaries in hexagonal close packed (HCP) magnesium. The crystallography of the grain boundaries was chosen to represent the major texture components observed experimentally in recrystallized magnesium alloys and are detailed in Table 1 and Figure 2. Figure 2 shows that the orientations chosen to represent the different boundaries that we observed experimentally during recrystallisation of rolled magnesium. Although density functional theory (DFT) studies generally use symmetric boundaries due to the much-reduced simulation cell size required, in this work we pushed the technique to the upper limit of the cell sizes possible in order to recreate those boundaries that we know exist in real materials.

2.2. Simulation Cell Construction

The simulation cell comprises two grains and a large enough vacuum layer on top to prevent interference from the out-of-plane images due to periodic boundary conditions [24]. In order to meet the required periodic boundary condition in the grain boundary plane, without rendering the ab initio simulation unfeasible due to an overly large number of atoms in the cell, the top grain was strained in the boundary plane if required. Strains were always less than 5%. Table 2 lists the size of each simulation cell. Additionally listed in Table 2 is the solute concentration at the boundary, measured assuming a boundary width of ± 0.16 nm from the boundary. In some cases, additional simulations were made in order to obtain a data set with a constant grain boundary concentration of solute.

2.3. Calculation Details

The Vienna ab initio software package (sold commercially under the name VASP, version 6.3.0, VASP Software GmbH, Vienna, Austria) was used [25] implementing the projector augmented wave method to represent the combined potential of core electrons and nuclei [26]. The Perdew–Burke–Ernzerhof gradient approximation was implemented to represent the exchange-correlation functional [27]. A cut-off energy of 400 eV was chosen for the plane wave basis and the self-consistent electronic optimization was converged to 10−6 eV [28]. The mesh of Γ -centered k-points to sample the Brillouin zone were chosen such that their density per reciprocal space is at least 50,000 Å−3. The atomic configuration is optimized using conjugate gradient method until mean atomic forces are less than 0.02 eV/Å−1.
While the atomic representation of twin boundaries comprises a supercell containing two misoriented grains with a large enough vacuum layer on top [23,29], the general grain boundary can be considered as a general interface between two grains (G1 and G2) represented by two slabs. As a consequence, the simulation cell total energy is the contribution of the bulk energy of grains ( E Bulk ,   G 1 and E Bulk , G 2 ), two surface energies ( σ G 1 + σ G 2 ) and the grain boundary energy ( γ GB ) itself. Thus, the latter can be expressed as γ GB =   E GB / S ( σ G 1 + σ G 2 ) ( E Bulk ,   G 1 + E Bulk ,   G 2 ) / S and rearranging the right hand side of this equation will give [30]:
W sep = ( E FS G 1 + E FS G 2 E GB ) / S
γ GB = σ G 1 + σ G 2 W sep
where WSEP and S are the work of separation defined as the reversible work needed to separate the grain boundary into two free surfaces [31] and boundary area, respectively.
When solute is added to the grain boundary, the segregated grain boundary energy can be expressed as γ GB S = γ GB + E seg S Γ where E seg S and Γ are the change in segregation energy of the grain boundary and the conversion factor of segregation energy into energy per area, respectively [23].

2.4. Addition of Solutes

Two solute species were examined in this work, Zn and Gd. These elements were chosen because of the large volume of experimental data on this ternary system, for example, Figure 1 and Figure 2, and references [32,33]. Three different scenarios for solutes were considered (see Table 2 for further details):
(1)
One solute atom at five different locations along the boundary
(2)
Five solute atoms all located at the boundary
(3)
Grain boundary behaviour at a concentration of 5% (+/0.3%)
Two scenarios were considered for mixed Gd and Zn at the same boundary
(1)
1 Zn and 1 Gd atom at the boundary
(2)
2 Zn and 2 Gd atoms located at the boundary
Where five different positions at the boundary are considered, and these positions include the smallest and largest Voronoi volume cells, along with three randomly selected locations. The five locations used for the Zn and Gd simulations were the same in both cases.

3. Results

3.1. Pur Magnesium

The general grain boundaries studied herein are shown in Figure 3. They can be seen to be complex non-symmetric interfaces. We begin by examining the atomic scale differences between the boundaries, in particular how they accommodate the complex irrational interface that must form to remain contiguous. We have studied this in a previous paper using automated topology software, however it has been found that looking into the distribution of atomic size occupancy (analogous to the local lattice strain) at the interface is a more revealing methodology. Using the Voronoi analysis [23,34,35], the volume occupancy of each atom was determined. Rather than plotting the raw data, atomic volumes were converted into an equivalent spherical radius. The local lattice strain surrounding the atom was estimated by comparing the equivalent spherical radius of the atom with the radius before relaxation. The same distance either side of the boundary (less than 1.7 Angstroms) was used for all six boundaries, ensuring that the surface in contact with the vacuum in the simulation cell was not included in the analysis. The results are presented in Figure 4. Most grains showed a preference for tensile strains, indicating that in the grain boundary regions each atom had more volume to occupy compared to the bulk. Grain boundary C was the outlier, it showed a large spread in strain and the strain was more compressive than tensile.
The grain boundary energetics for pure magnesium are shown in Table 3. Grain boundary energies range between 0.205 and 0.584 J/m2, which is much larger than the energy of the commonly observed twin boundary { 10 1 ¯ 2 } which is reported to be 0.125 J/m2 [28]. The work of separation (WSEP) for the general boundaries of pure magnesium ranges from 0.904 to 1.208 J/m2, which is smaller than that of the { 10 1 ¯ 2 } twin boundary and several other special boundaries studied in Ref [28].

3.2. Effect of Solutes

We now examine the effect of solutes on the energetics of general grain boundaries. The effect of solute location was examined using 5 different locations within the boundary region. The energy of segregation, Eseg, is a parameter which indicates the preference of a solute to be at a boundary compared to the bulk and is shown in Figure 5. The Eseg had a spread of values depending on the individual location of the solute, and the simulations with multiple solutes tended to fall somewhere in the middle of this spread.
In 64% of cases, the driving force for Gd to segregate to the boundary is larger than that of Zn. In particular, when all five locations are occupied by one type of species, E seg Gd is larger than E seg Zn in all boundaries except F. In addition, when a combination of Gd and Zn is considered (i.e., one Zn and one Gd or two Zn and two Gd), the segregation energy is always negative (i.e., solutes prefer grain boundaries over bulk) and is independent of the number of solutes. Comparing the mean value of the driving force for segregation, indicates that it is the largest for the combination of two Gd and two Zn, followed by Gd, the combination of one Gd and one Zn and finally Zn (i.e., −0.789 < −0.601 < −0.417 < −0.229, respectively).
The grain boundary energy is shown in Figure 6. When compared to the pure magnesium boundaries, the data in Figure 6 indicates that the solute location, solute concentration and solute species all have a negligible effect on the grain boundary energy. A general conclusion from looking at the grain boundary data presented here is that the boundary has an intrinsic energy, and the addition of solutes does little to disrupt this value.
One parameter which did highlight the differences that solutes imposed on the boundaries was the Work of Separation, WSEP. This parameter has traditionally been used [29,36] to examine the cohesion of a boundary, as it indicates the work required to separate two neighbouring grains. However, in the present case we use WSEP as a tool to identify the changes that occur when solute is located at the boundary. If we begin by comparing the WSEP to the grain boundary energy, we can see that there is some correlation between these two parameters, and that small decreases in the grain boundary energy led to large increases in the WSEP and vice versa, Figure 7.
The WSEP is shown in Figure 8. There is some variation in the WSEP for the single solute simulations, the addition of a single Zn solute could either increase or decrease WSEP depending on its location, while the addition of a single Gd increased the WSEP compared to pure Mg, but the magnitude varied markedly. The addition of 5 Zn solutes or 5 Gd solutes increase the WSEP, and Gd has a larger effect than Zn. The effect of co-segregated Gd and Zn had a variable effect on WSEP.
Due to the different size of each simulated cell, the boundary solute concentrations in each simulation are also different. Figure 8 therefore does not provide a perfect comparison between solutes and boundaries. The data is replotted in Figure 9 for five of the boundaries, all of which have ~5% solute concentration at the boundaries. Note that boundary A is not included because one solute atom provides this boundary with a concentration of 12.5%. It can be seen in Figure 9 that the different boundaries behave differently. The addition of 5%Zn has no change in WSEP for boundaries B, D and E, while it increases WSEP for boundaries C and F. For the case of Gd, the WSEP is always increased by the addition of Gd solutes, but the magnitude changes markedly between boundaries. Clearly, the structure of the boundary creates a significant change in the effect of solute on WSEP.

4. Discussion

4.1. Effct of Topology

The distribution of atoms at the boundary can best be quantified by using a pair distribution function (PDF) which was calculated at a distance of up to 0.7 of the Mg lattice parameter on either side of the grain boundary, see Figure 10. The PDF clearly indicates markedly different atomic packings and characteristics for each of the six boundaries. The most important output from this analysis is the coordination number (CN) representing the number of closest neighbours around a central atom at the boundary, Table 3. The coordination number has been used here to correlate the boundary topology with the calculated energetics of the boundary (Figure 11). It can be seen that there is a slight increase in WSEP for lower values of coordination number, where lower CN values correlate with more disorder at the boundary.
It was seen in Figure 6 and Figure 8, respectively, that the effect of solute on GB energy was negligible but was significant for WSEP. We can see from Figure 11 that the addition of Zn to the boundary increased the WSEP value, but this did not correlate with CN. However, Gd shows a tendency to increase the value of WSEP more for the more disordered boundaries with lower coordination numbers. It must also be concluded from this data that the effect of solutes on the boundary is not easily defined and shows significant variability across many energetic parameters examined here, such as the ones shown in Figure 5, Figure 6 and Figure 8.
The topology of the boundary also had a significant effect on the electronic structure [37], which can clearly be seen in the pDOS of the profile of the d-orbital of Gd in bulk Mg, and in the boundaries A, B, and C (with CNs of 12, 8.4, 5.1, and 5.6, respectively) as depicted in Figure 12. Indeed, the least smooth profile corresponds to the boundary B with the lowest CN, and the most similar one to the solute in the bulk Mg corresponds to the boundary A with largest CN.

4.2. Effect of Solute on GB Energetics

Figure 13 shows the WSEP data from all simulations for all boundaries, plotted as a function of grain boundary concentration. Note that the concentration scale in Figure 13 (a) is much larger than the other boundaries due to the relatively smaller size of that simulation cell. It can be seen that there is a generalized trend towards increasing WSEP with increasing solute concentration. This can be understood by considering the solute bonding behaviours. Previous work quantified the strength of the bond between magnesium and the solutes Gd and Zn using the crystal orbital Hamiltonian population method [19] where it was demonstrated that Gd had a stronger bond to Mg than Zn did, but the bonding of both solutes with the Mg matrix was stronger than the bonds between Mg matrix. With increasing concentration at the boundary there will be more solutes, and these provide more bonds, leading to the general trend of increasing WSEP with increasing solute concentration. This also explains why Gd tends to have a larger WSEP than Zn, Gd has been found to bond more strongly to the grain boundary than zinc. In addition, worth mentioning is the rate of increase in WSEP with concentration. Boundaries A and D show a much lower increase in WSEP per atomic percent increase in solute concentration. These boundaries also show high values of CN and show narrow lattice strain distributions (Figure 4), and it may be the case that the WSEP is more sensitive to solute in disordered boundaries, resulting in showing a steeper increase in WSEP with increasing solute concentration. This is consistent with the data shown in Figure 10.

5. Conclusions

Density functional theory was used to examine the energetics, topology, electronic structure and the bonding behaviour of Gd and Zn solutes in magnesium at six different general grain boundaries. The premise of the work was that the presence of these solutes at the boundary are responsible for texture development [14]. The boundary crystallography was chosen from experimental data, and comprised two twist, two tilt, and two irrational boundaries. In order to simulate these general grain boundaries, as opposed to idealized symmetrical tilt boundaries, very large simulation cell sizes were required. The resulting grain boundaries were interrogated, and the solute species (Gd and Zn) were placed in multiple locations to investigate their effect on the boundary. The following conclusions have been made:
  • The grain boundaries were found to have an intrinsic grain boundary energy, and this energy was not markedly affected by the solute concentration or chemistry at the boundary.
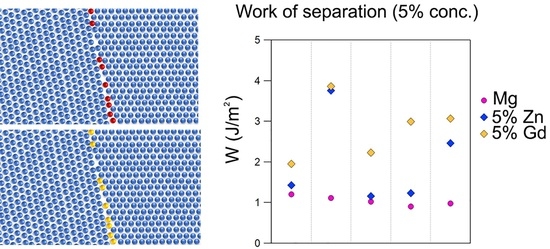
  • In contrast with grain boundary energy, the work of separation (WSEP) was very sensitive to grain boundary chemistry. This parameter was therefore used to interrogate the effect of solute on grain boundary behaviour. It was found that for a boundary solute concentration of 5 at%, the effect of Zn and Gd on the WSEP was markedly different for the different boundaries. This is indicative that the two solutes will have a different effect on different boundary types.
  • The topology of the grain boundary was correlated with the boundary energetics using the coordination number. For pure magnesium, the work of separation was found to correlate with coordination number, with more disordered boundaries of low CN showing higher values of WSEP. The effect of solute was not directly correlated with the CN, but there was a general trend for Gd to increase the WSEP more in those boundaries of low CN (high disorder).
  • The WSEP was found to increase with increasing boundary solute concentration, with the rate of change being markedly different between the different boundaries. The increase in WSEP with solute concentration was typically higher for Gd compared to Zn.
  • No correlation between the boundary behaviour and crystallography could be found, apart from the over-riding conclusion that all six boundaries showed different behaviours, and the effect of solute on their WSEP were unique.

Author Contributions

Conceptualization, N.S.; methodology, R.M.; formal analysis, N.S. and R.M.; resources, N.S. and R.M.; data curation, R.M.; writing—original draft preparation, R.M.; writing—review and editing, N.S.; visualization, N.S.; funding acquisition, N.S. All authors have read and agreed to the published version of the manuscript.

Funding

This research was funded by the University of South Australia (Adelaide, Australia), with the assistance of resources and services from the National Computational Infrastructure (NCI), which is supported by the Australian Federal Government through the NCRIS funding scheme (National Computational Merit Allocation Scheme, Proposal number 12247, mk63).

Institutional Review Board Statement

Not applicable.

Informed Consent Statement

Not applicable.

Data Availability Statement

The simulation (raw) data presented in this study is available on request from author Reza Mahjoub, and collated data available from author Nikki Stanford. The data are not publicly available due to size and complexity of simulation data.

Acknowledgments

Nikki Stanford and Reza Mahjoub would like to thank Drew Evans, Bill Skinner, and Emily Hilder for their continued support. The assistance of Adam Taylor and Ross Marceau with the preparation of the atom probe data presented in the preamble is also gratefully acknowledged.

Conflicts of Interest

The funders had no role in the design of the study; in the collection, analyses, or interpretation of data; in the writing of the manuscript, or in the decision to publish the results. The corresponding author (NS) declares that she is the Editor-in-Chief of Alloys.

References

  1. MacPherson, R.D.; Srolovitz, D.J. The von Neumann relation generalized to coarsening of three-dimensional microstructures. Nature 2007, 446, 1053–1055. [Google Scholar] [CrossRef] [PubMed]
  2. Glicksman, M.E. Analysis of 3-D network structures. Philos. Mag. 2005, 85, 3–31. [Google Scholar] [CrossRef]
  3. Mahjoub, R.; Laws, K.J.; Stanford, N.; Ferry, M. General trends between solute segregation tendency and grain boundary character in aluminum—An ab inito study. Acta Mater. 2018, 158, 257–268. [Google Scholar] [CrossRef]
  4. Sutton, A.P.; Balluffi, R.W. Interfaces in Crystalline Materials; Oxford University Press: New York, NY, USA, 1996. [Google Scholar]
  5. Lejcek, P. Grain Boundary Segregaion in Metals; Springer: Berlin, Germany, 2010. [Google Scholar]
  6. Rohrer, G.S. Grain boundary energy anisotropy: A review. J. Mater. Sci. 2011, 46, 5881–5895. [Google Scholar] [CrossRef] [Green Version]
  7. Stanford, N.; Sabirov, I.; Sha, G.; la Fontaine, A.; Ringer, S.P.; Barnett, M.R. Effect of Al and Gd Solutes on the Strain Rate Sensitivity of Magnesium Alloys. Metall. Mater. Trans. A Phys. Metall. Mater. Sci. 2010, 41A, 734–743. [Google Scholar] [CrossRef]
  8. Nie, J.F.; Zhu, Y.M.; Liu, J.Z.; Fang, X.Y. Periodic Segregation of Solute Atoms in Fully Coherent Twin Boundaries. Science 2013, 340, 957–960. [Google Scholar] [CrossRef]
  9. Bugnet, M.; Kula, A.; Niewczas, M.; Botton, G.A. Segregation and clustering of solutes at grain boundaries in Mg-rare earth solid solutions. Acta Mater. 2014, 79, 66–73. [Google Scholar] [CrossRef]
  10. Hadorn, J.P.; Sasaki, T.T.; Nakata, T.; Ohkubo, T.; Kamado, S.; Hono, K. Solute clustering and grain boundary segregation in extruded dilute Mg-Gd alloys. Scr. Mater. 2014, 93, 28–31. [Google Scholar] [CrossRef] [Green Version]
  11. Robson, J.D.; Haigh, S.J.; Davis, B.; Griffiths, D. Grain Boundary Segregation of Rare-Earth Elements in Magnesium Alloys. Metall. Mater. Trans. A Phys. Metall. Mater. Sci. 2016, 47A, 522–530. [Google Scholar] [CrossRef] [Green Version]
  12. Basu, I.; Pradeep, K.G.; Miessen, C.; Barrales-Mora, L.A.; Al-Samman, T. The role of atomic scale segregation in designing highly ductile magnesium alloys. Acta Mater. 2016, 116, 77–94. [Google Scholar] [CrossRef]
  13. Stanford, N.; Sha, G.; Xia, J.H.; Ringer, S.P.; Barnett, M.R. Solute segregation and texture modification in an extruded magnesium alloy containing gadolinium. Scr. Mater. 2011, 65, 919–921. [Google Scholar] [CrossRef]
  14. Barrett, C.D.; Imandoust, A.; el Kadiri, H. The effect of rare earth element segregation on grain boundary energy and mobility in magnesium and ensuing texture weakening. Scr. Mater. 2018, 146, 46–50. [Google Scholar] [CrossRef]
  15. Rossouw, D.; Langelier, B.; Scullion, A.; Danaie, M.; Botton, G.A. Multivariate-aided mapping of rare-earth partitioning in a wrought magnesium alloy. Scr. Mater. 2016, 124, 174–178. [Google Scholar] [CrossRef]
  16. Trang, T.T.T.; Zhang, J.H.; Kim, J.H.; Zargaran, A.; Hwang, J.H.; Suh, B.C.; Kim, N.J. Designing a magnesium alloy with high strength and high formability. Nat. Commun. 2018, 9, 2522. [Google Scholar] [CrossRef] [PubMed]
  17. Zhu, Y.M.; Bian, M.Z.; Nie, J.F. Tilt boundaries and associated solute segregation in a Mg-Gd alloy. Acta Mater. 2017, 127, 505–518. [Google Scholar] [CrossRef]
  18. Stanford, N.; Atwell, D.; Barnett, M.R. The effect of Gd on the recrystallisation, texture and deformation behaviour of magnesium-based alloys. Acta Mater. 2010, 58, 6773–6783. [Google Scholar] [CrossRef]
  19. Mahjoub, R.; Stanford, N. The electronic origins of the “rare earth” texture effect in magnesium alloys. Sci. Rep. 2021, 11, 14159. [Google Scholar] [CrossRef]
  20. Li, L.; Kamachali, R.D.; Li, Z.; Zhang, Z. Grain boundary energy effect on grain boundary segregation in an equiatomic high-entropy alloy. Phys. Rev. Mater. 2020, 4, 053603. [Google Scholar] [CrossRef]
  21. Lazar, E.A.; Mason, J.K.; MacPherson, R.D.; Srolovitz, D.J. Complete Topology of Cells, Grains, and Bubbles in Three-Dimensional Microstructures. Phys. Rev. Lett. 2012, 109, 095505. [Google Scholar] [CrossRef] [Green Version]
  22. Saylor, D.M.; Morawiec, A.; Rohrer, G.S. Distribution of grain boundaries in magnesia as a function of five macroscopic parameters. Acta Mater. 2003, 51, 3663–3674. [Google Scholar] [CrossRef]
  23. Tsuru, T.; Somekawa, H.; Chrzan, D.C. Interfacial segregation and fracture in Mg-based binary alloys: Experimental and first-principles perspective. Acta Mater. 2018, 151, 78–86. [Google Scholar] [CrossRef]
  24. Scheiber, D.; Pippan, R.; Puschnig, P.; Romaner, L. Ab initio calculations of grain boundaries in bcc metals. Model. Simul. Mater. Sci. Eng. 2016, 24, 035013. [Google Scholar] [CrossRef]
  25. Kresse, G.; Furthmuller, J. Efficient iterative schemes for ab initio total-energy calculations using a plane-wave basis set. Phys. Rev. B 1996, 54, 11169–11186. [Google Scholar] [CrossRef] [PubMed]
  26. Kresse, G.; Joubert, D. From ultrasoft pseudopotentials to the projector augmented-wave method. Phys. Rev. B 1999, 59, 1758–1775. [Google Scholar] [CrossRef]
  27. Perdew, J.P.; Burke, K.; Ernzerhof, M. Generalized gradient approximation made simple. Phys. Rev. Lett. 1996, 77, 3865–3868. [Google Scholar] [CrossRef] [Green Version]
  28. Mahjoub, R.; Ferry, M.; Stanford, N. Local topology and its effects on grain boundary and solute segregation in HCP magnesium. Materialia 2019, 6, 100258. [Google Scholar] [CrossRef]
  29. Hase, T.; Ohtagaki, T.; Yamaguchi, M.; Ikeo, N.; Mukai, T. Effect of aluminum or zinc solute addition on enhancing impact fracture toughness in Mg-Ca alloys. Acta Mater. 2016, 104, 283–294. [Google Scholar] [CrossRef]
  30. Lu, S.; Hu, Q.M.; Punkkinen, M.P.J.; Johansson, B.; Vitos, L. First-principles study of fcc-Ag/bcc-Fe interfaces. Phys. Rev. B 2013, 87, 224104. [Google Scholar] [CrossRef] [Green Version]
  31. Sinnott, S.B.; Dickey, E.C. Ceramic/metal interface structures and their relationship to atomic- and meso-scale properties. Mater. Sci. Eng. R Rep. 2003, 43, 1–59. [Google Scholar] [CrossRef]
  32. Yan, H.; Chen, R.; Zheng, N.; Luo, J.; Kamado, S.; Han, E. Effects of trace Gd concentration on texture and mechanical properties of hot-rolled Mg–2Zn–xGd sheets. J. Magnes. Alloy. 2013, 1, 23–30. [Google Scholar] [CrossRef] [Green Version]
  33. Al-Samman, T.; Li, X. Sheet texture modification in magnesium-based alloys by selective rare earth alloying. Mater. Sci. Eng. A Struct. Mater. Prop. Microstruct. Processing 2011, 528, 3809–3822. [Google Scholar] [CrossRef]
  34. Rycroft, C.H.; Grest, G.S.; Landry, J.W.; Bazant, M.Z. Analysis of granular flow in a pebble-bed nuclear reactor. Phys. Rev. E 2006, 74, 021306. [Google Scholar] [CrossRef] [PubMed] [Green Version]
  35. Lazar, E.A.; Han, J.; Srolovitz, D.J. Topological framework for local structure analysis in condensed matter. Proc. Natl. Acad. Sci. USA 2015, 112, E5769–E5776. [Google Scholar] [CrossRef] [PubMed] [Green Version]
  36. Mahjoub, R.; Xu, W.; Gun, B.; Laws, K.; Kong, L.; Li, J.; Ferry, M. Heterogeneous nucleation at inoculant particles in a glass forming alloy: An ab initio molecular dynamics investigation of interfacial properties and local chemical bonding. Comput. Mater. Sci. 2015, 108, 94–102. [Google Scholar] [CrossRef]
  37. Deringer, V.L.; Tchougreeff, A.L.; Dronskowski, R. Crystal Orbital Hamilton Population (COHP) Analysis As Projected from Plane-Wave Basis Sets. J. Phys. Chem. A 2011, 115, 5461–5466. [Google Scholar] [CrossRef]
Figure 1. Site specific atom probe tomography of fully recrystallized Mg-0.5 at%Gd-0.5 at%Zn after annealing for 1 h at 500 °C. (a,b) Mass spectra for the specimen volume shown in (c). (d) Iso-surfaces showing Gd segregation to the grain boundaries. (e) Concentration profile for the cylindrical region of interest shown in pink in (d).
Alloys 01 00003 g001
Figure 2. Pole figures of the eight orientations used to construct the 6 grain boundaries examined in this work.
Alloys 01 00003 g002
Figure 3. The simulation cells for the six grain boundaries examined here. The locations used for the solute are shown in purple. Note that all 5 locations cannot be seen due to the simulation cells being 3-dimensional. Labels (AF) correspond to the boundaries listed in Table 2.
Alloys 01 00003 g003
Figure 4. Lattice strain at the six different boundaries examined. Boundaries A to F are shown in histograms (af) respectively.
Alloys 01 00003 g004
Figure 5. A summary of the segregation energy for all simulations carried out in this study. Note that a negative value of Eseg indicates that the solute has a preference for the boundary, whilst positive values indicate a preference for being located in the bulk. More negative values of Eseg indicate a preference to segregate to the boundary.
Alloys 01 00003 g005
Figure 6. Grain boundary energy of the six grain boundaries, calculated for (a) pure magnesium, (b) a single Zn atom at five different locations, as well as five Zn in the one boundary, (c) a single Gd atom at five different locations, as well as five Gd in the one boundary, (d) simulations with one Zn and one Gd, as well as 2 Zn and 2 Gd.
Alloys 01 00003 g006
Figure 7. Relationship between the grain boundary energy and the work of separation, WSEP.
Alloys 01 00003 g007
Figure 8. The work of separation (WSEP) of the six grain boundaries, calculated for (a) a single Zn atom at five different locations, as well as five Zn in the one boundary, (b) a single Gd atom at five different locations, as well as five Gd in the one boundary, (c) five solutes at the boundary, (d) one Zn and one Gd, as well as 2 Zn and 2 Gd at the boundary.
Alloys 01 00003 g008
Figure 9. WSEP for the five boundaries in which a solute concentration of 5% (+/−0.3%) could be achieved.
Alloys 01 00003 g009
Figure 10. Local topology of the 6 boundaries quantified by pair distribution functions (PDF). The data corresponding to boundaries (AF) have been labelled individually in the figure.
Alloys 01 00003 g010
Figure 11. WSEP of the six boundaries in pure Mg as well as when segregated by five Zn or Gd.
Alloys 01 00003 g011
Figure 12. pDOS of the d-orbital of Gd as a solute in the bulk Mg and at grain boundaries A, B and C. Fermi level is adjusted to zero eV.
Alloys 01 00003 g012
Figure 13. Summary of the work of separation (WSEP) measurements made on the six different boundaries examined in this study. Data is plotted as a function of the boundary concentration in atomic percentage. Boundaries A to F are shown individually in (af) respectively. Note larger x-axis in (a,b).
Alloys 01 00003 g013
Table 1. The crystallography of the six grain boundaries chosen for study. These are shown stereographically in Figure 2.
Grain NumberBoundary Plane and Parallel DirectionsAxis and Angle of Rotation
(Three Digit Indices)
Equivalent Four Digit Rotation Axis If Rational
Boundary AGrain A1 ( 0001 ) 11 2 ¯ 0 58.31° 3 2 , 0.5 , 0 [ 10 1 ¯ 0 ] tilt
Grain A2 ( 11 2 ¯ 2 ) 11 ¯ 21
Boundary BGrain B1 ( 10 1 ¯ 0 ) 0001 43.37° 0.52 , 0.52 , 0.67 irrational
Grain B2 ( 11 2 ¯ 2 ) 11 ¯ 21
Boundary CGrain C1 ( 10 1 ¯ 0 ) 0001 61.59° 3 2 , 0.5 , 0 [ 10 1 ¯ 0 ] twist
Grain C2 ( 10 1 ¯ 0 ) 1 2 ¯ 11
Boundary DGrain D1 ( 01 1 ¯ 2 ) 0 1 ¯ 11 18.79° 1 , 0 , 0 [ 11 2 ¯ 0 ] tilt
Grain D2 ( 10 1 ¯ 1 ) 0 1 ¯ 12
Boundary EGrain E1 ( 0001 ) 11 2 ¯ 0 10.9° 0 , 0 , 1 [ 0001 ] twist
Grain E2 ( 0001 ) 3 21 ¯ 0
Boundary FGrain F1 ( 11 2 ¯ 2 ) 11 ¯ 21 74.8° < 1, −0.4, −0.25>irrational
Grain F2 ( 10 1 ¯ 5 ) 1 2 ¯ 10
Table 2. Details of the simulation cell size and boundary concentration levels studied.
BoundaryCell Dimension (Å)Number of Atoms in SimulationNumber of Atoms at GBSolute Conc. (1 Atom)Solute Conc. (5 Atom)Additional Simulation
Boundary A 5.56   × 6.42   × × 99.51128812.5%62.5%none
Boundary B 5.21   × 57.78   × 52.96536382.6%13.2%2 solute atoms = 5.3% conc.
Boundary C 46.90   × 25.68   × 32.109771400.7%3.6%7 solute atoms = 5.0% conc.
Boundary D 15.24   × 35.310   × 49.438901060.9%4.7%None
Boundary E 16.05   × 27.79   × 46.547421060.9%4.7%None
Boundary F 30.60 × 22.23   × 43.338461480.7%3.4%7 solute atoms = 5.0% conc.
Table 3. Summary of grain boundary energy (γGB), the work of separation (WSEP), coordination number (CN), and the width of lattice strain for the six different boundaries for simulations with only magnesium atoms included.
BoundaryϒGB (J/m2)WSEP (J/m2)CNStrain Width (%)
Boundary A0.5841.0498.43.0
Boundary B0.2051.2085.14.2
Boundary C0.4451.1175.67.9
Boundary D0.4651.0257.36.6
Boundary E0.3790.9048.12.7
Boundary F0.4270.9827.67.0
Publisher’s Note: MDPI stays neutral with regard to jurisdictional claims in published maps and institutional affiliations.

