Article

Dynamic Joint Stiffness of the Knee in Post-Menopausal Women with and without Rheumatoid Arthritis

1
Centro de Investigação em Desporto, Educação Física, Exercício e Saúde (CIDEFES), Lusófona University, 1749-024 Lisbon, Portugal
2
Sport and Health Department, School of Health and Human Development, University of Évora, 7000-671 Évora, Portugal
3
Comprehensive Health Research Center (CHRC), University of Évora, 7000-671 Évora, Portugal
4
Portuguese Institute of Rheumatology, 1050-034 Lisbon, Portugal
5
Centre for Research in Applied Communication, Culture, and New Technologies (CICANT), Lusófona University, 1749-024 Lisbon, Portugal
*
Author to whom correspondence should be addressed.
Rheumato 2023, 3(1), 63-73; https://doi.org/10.3390/rheumato3010005
Submission received: 15 November 2022 / Revised: 13 January 2023 / Accepted: 15 January 2023 / Published: 20 January 2023

Abstract

:
This study compared rheumatoid arthritis (RA) post-menopausal women with pathological involvement of the lower limb joints and age-matched post-menopausal women without RA regarding the dynamic joint stiffness (DJS) of knee during the stance phase of gait. Eighteen RA women and eighteen age-matched women were selected. Gait assessed through a three-dimensional motion analysis system synchronized with a force plate. Subjects walked barefoot at self-selected speed, and 14 valid trials were collected (comprising 7 left and 7 right foot-steps on force plate). The “moment of force—angle” plot of knee in sagittal plane was determined. The stance phase was split into three sub-phases: first knee flexion sub-phase (1st KFS); knee extension sub-phase (KES); second knee flexion sub-phase (2nd KFS). A linear model represented each sub-phase and DJS calculated by the slope. Model fitting was assessed through the coefficient of determination (R2). R2 values for both groups were higher than 0.8 during 1st KFS and KES but not during 2nd KFS. RA women yielded a higher DJS value during 2nd KFS (p < 0.01). Concerning the other sub-phases, no differences were observed between groups. The findings suggested the splitting methodology used could be modelled by a linear “moment of force—angle” relationship, namely, during 1st KFS and KES. During 2nd KFS, RA women yielded a stiffer behavior.

1. Introduction

Joint stability is the ability that tries to keep, in each instant, a suitable coaptation of joint surfaces and tries to resist the forces acting at the joint [1]. During the performance of any motor task, the subject controls joint stability in order to maintain proper angular positions throughout the entire displacement [2]. Complementarily, other studies consider that joint stability is the result of the control over muscular activity exerted by the sensorimotor system (i.e., active components) associated with the state and characteristics of the joints structures (i.e., passive components) [3,4,5]. In this process, joint stiffness plays an important role [2,3,4,6]; i.e., joint stiffness is adapted to ensure joint stability according to the movement’s objective [3]. Thus, joint stiffness, and consequently joint stability, may be impaired in subjects suffering from a pathology that affects joint structures and reduces neuromuscular capacity. According to literature [7], rheumatoid arthritis (RA) is an example of this type of pathology. Women, especially post-menopausal women, represent the larger number of RA patients [8]. Moreover, the menopausal status has been related to a more rapid progression of disability [9,10]. Therefore, a higher functional disability can lead to an increased occurrence of falls found in these patients [11], and it is known that an unstable gait is a recognizable risk factor related to falls [12]. As aforementioned, the lower limb joints can be affected by the RA pathogenic process [13], with possible impairment of the lower limb joints stiffness and functional capacity. During gait, the lower limbs have an important role and can be considered as a system demanding dynamic coordination among joints [14]. In this way, the assessment of stiffness of the lower limb joints in RA patients, and especially in RA post-menopausal women, can provide significant information.
Dynamic joint stiffness (DJS) is an important concept concerning the assessment of joint stiffness [15]. This concept was introduced by Davis and DeLuca (1995) [16] and was defined as the resistance developed, during movement, by muscles and other soft tissue structures that cross a joint, as a reaction to an applied moment of force [17]. Although other terminologies are used for this same concept (i.e., quasi-stiffness or net quasi-stiffness), a previous work justifies the “dynamic joint stiffness” terminology [15]. It is based on the mechanical Hooke’s law [18], which states that the size of deformation (displacement) is directly proportional to the deforming force; stiffness is a measure of the resistance offered by an elastic body to deformation; i.e., it can be determined by the slope of the deforming force plotted as a function of the displacement. Therefore, the rotational stiffness can be determined by the slope of the moment of force plotted as function of the angular displacement [17]. In this specific case, the least-square regression is an important tool to translate a linear model fitted to the human movement. Thus, the value of the DJS can be achieved through the following methodology: (1) The “moment of force—angle” plot is determined. (2) Depending on the joint angular displacement objective and aim of the study, this plot is split into different sub-phases. (3) Least-square regression(s) is considered to determine the value of the DJS for each sub-phase; in this way, least-square regression(s) was obtained between the relation of the moment of force (Mf), normalized to the body mass (Nm/kg), and the angle (φ) in degrees (°); the value of the slope represents the value of the DJS—this value is dimensionless because it is obtained by the value of the slope, “a” in the equation [Mf = a φ + b], which is assumed as a linear model [3,17]; therefore, the present study assumes that using a linear model based on least-square regression provides us with a tool for analysis and a background to compare results within the same performer or in a group of performers; graphically the model is represented by the equation of the straight line produced by the equation [Mf = a φ + b] mentioned above, where [a] is the value of stiffness. (4) The degree of adjustment is calculated by the coefficient of determination (R2); this value is the measure of the model adjustment, or the measure of reliability of the model in relation to the phenomenon studied; then, if R2 = 1, the phenomenon is completely translated by the linear model that results from the application of the linear regression. In the study of the joint stiffness, a R2 higher than 0.8 is considered to be very close to a linear behavior [18].
Some studies assessed the DJS of the lower limb joints during the stance phase of gait [15]. Nonetheless, to the best of our knowledge, only one research study [3] assessed the RA patients’ DJS, namely, the DJS of the ankle. In this study, RA post-menopausal women yielded a stiffer joint behavior in the early stance phase compared to age-matched healthy post-menopausal women. Furthermore, data from the same project [19] revealed that RA post-menopausal women fallers yielded a looser joint behavior in the middle stance phase compared to non-fallers. However, no research assessed the RA patients’ DJS of the knee.
Several studies [14,20,21,22,23,24,25] investigated the DJS of the knee during the stance phase of gait, focusing on different populations. However, only one study [20] analyzed the entire stance period, splitting it into sub-phases. Data from this researched revealed that not all sub-phases were considered suitable for linearization. Recently, in order to determine the DJS of the knee, a different split of the stance phase was proposed [15]. This new way of splitting was based on what had already been conducted in some studies that analyzed the DJS of the ankle, i.e., according to the angular displacements of the segment that rotates around the axis of rotation [3,26,27]. Humans do not think in muscles or forces, they think in displacements [2]. In this way, it was suggested this methodology may be essential to achieve guidelines for clinical therapeutic prescriptions [15]. Thus, the new proposal suggests to split the stance phase according to the three angular displacements of the knee that occur during this phase—first knee flexion sub-phase (1st KFS), knee extension sub-phase (KES), and second knee flexion sub-phase (2nd KFS).
Based on the framework above, this research aimed to compare RA post-menopausal women with pathological involvement of the lower limb joints and age-matched post-menopausal women without RA regarding the DJS of the knee during the stance phase of gait.

2. Materials and Methods

The study was conducted according to the guidelines of the Declaration of Helsinki and was approved by the Ethical Committee for Health of the Portuguese Institute of Rheumatology.

2.1. Subjects

Eighteen RA post-menopausal women with pathological involvement of the lower limb joints were recruited from the Portuguese Institute of Rheumatology, Lisbon, Portugal. These women fulfilled the 2010 Rheumatoid Arthritis Classification Criteria [7], presented pathological involvement of the lower limb joints (when at least one of the lower limb joints was assessed as swollen or tender), and were taking stable doses of disease-modifying anti-rheumatic drugs for at least four weeks prior to assessment. In order to achieve an age-matched group, eighteen post-menopausal women without RA were selected from a group of volunteers from the local Lisbon community. Women of both groups were selected according to the following inclusion criteria: (1) diagnosis of post-menopausal status [28]; (2) absence of early menopause [29], (3) absence of unstable heart condition, chronic obstructive pulmonary disease, or cancer; (4) absence of prosthetics in lower limb joints; (5) non-participation in any type of exercise program during the three months prior research; (6) capacity to walk unassisted for at least seven meters (without current walking aids). Post-menopausal women without RA were excluded if they presented any rheumatic diseases or lower limb joint pathology. Informed consent was obtained from all subjects involved in the study.

2.2. Clinical Assessment

The same rheumatologist performed the clinical assessments of the women who came to be selected for the two groups, e.g., data concerning demographic characteristics and the reproductive and medical histories of each woman of both groups (age, body mass, height, duration of menopause, nature of menopause, disease duration, and pharmacological therapies). On the other hand, the Disease Activity Score-28 joints (DAS-28) was used to assess disease activity of RA post-menopausal women [30]. In order to achieve this score: the same rheumatologist evaluated the number of swollen and tender joints and applied the visual analogue scale on all women; erythrocyte sedimentation rate was also evaluated at the same laboratory for all subjects.

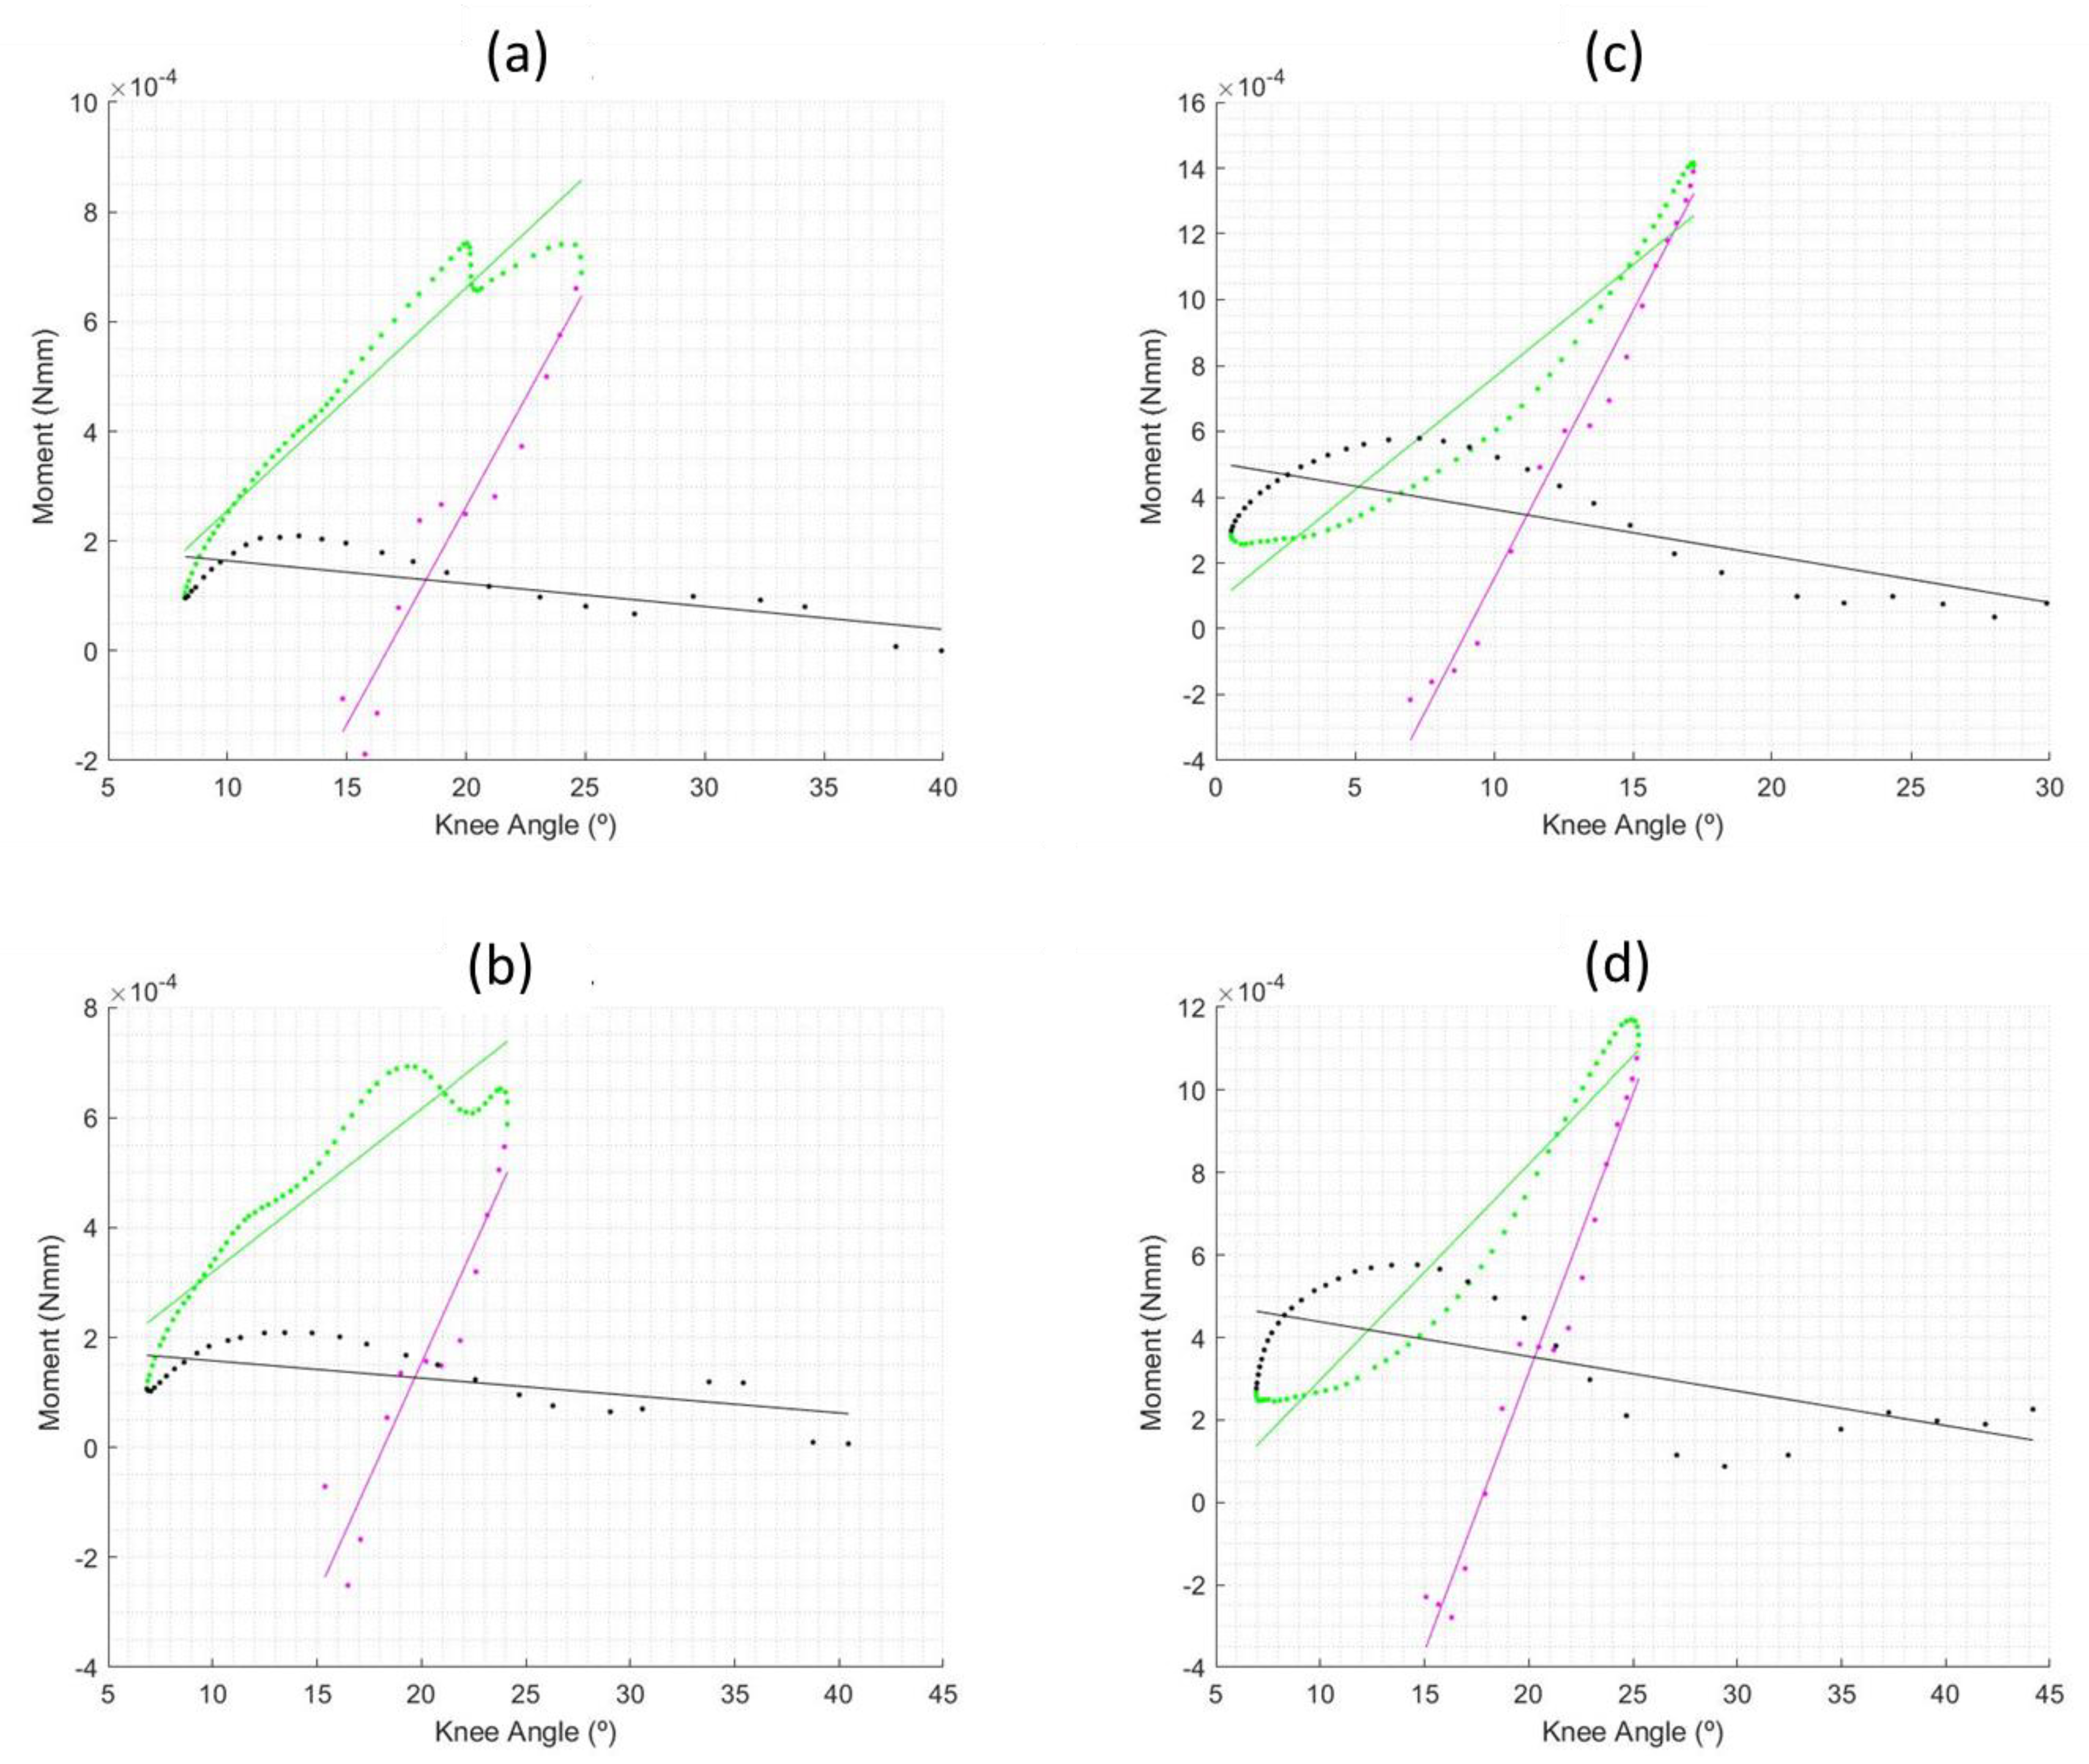
2.3. Gait Assessment and Data Processing

Three-dimensional gait analyses were developed in order to assess DJS of the knee during the stance phase. A Vicon® Motion Capture MX System (9 MX infrared cameras (7 × 1.3 MP and 2 × 2.0 MP) was synchronized with an AMTI BP400600-200 force plate. Kinematic and kinetic data were recorded at 200 Hz and 1000 Hz, respectively. This system tracked the motion of spherical reflective markers (9.5 mm) using the Vicon Nexus software (version 1.7.1).
The same researcher collected anthropometric data and placed the spherical reflective markers on each woman. The anthropometric data comprised: (1) height and body mass collected using a SECA 764 station (Hamburg Germany); (2) anthropometric diameters collected using Siber–Hegner instruments (Siber & Hegner, Zurich, Switzerland). The 39 spherical reflective markers were placed on the women’s anatomical landmarks, according to the FullBody PlugInGait model. The FullBody PlugInGait model was used to determine “segments” and “joints centers” according to the Vicon specifications (http://www.vicon.com/downloads, accessed on 14 January 2023).
Gait analyses were developed in accordance to the protocol described in a previous research, which analyzed and concluded about the ankle stiffness of the same sample [3]: (1) subjects walked barefoot through a walkway that was 7 m long and 2 m wide, with a mounted force plate; (2) at the end of the walkway, subjects turned around; (3) subjects were asked to walk at natural and self-selected speed; (4) seven valid trials were collected for the contact of each foot on the force plate; trials were considered valid only when one foot stepped in its entirety on the force plate; this information was not given to the subjects in order to avoid changes in individual gait patterns; (5) to avoid gait performance deterioration related to fatigue, subjects rested for 2 min by seating on a chair every 20 trials.
The Vicon Nexus software (version 1.7.1) was used to process data. A Woltring filtering routine was applied on all trials. To allow comparisons, a spline interpolation was applied to the original data points of the gait stance phase to obtain 201 samples per stance phase (0% to 100%, with increments of 0.05%), as suggested in a previous study [15]. Then, the “moment of force—angle” plot of the knee in sagittal plane was determined (moment of force normalized to body mass). After this, the plot was split into 3 different sub-phases, according to a previous study [15]: 1st KFS (begins at the heel strike and ends at the instant of occurrence of maximum knee flexion); KES (begins at the end of the 1st KFS and ends at the instant of occurrence of maximum knee extension); 2nd KFS (begins at the end of the KES and ends at toe-off). Then, the linear regression and the value of the slope are determined for each sub-phase using least-squares regression models. The value of the slope represents the value of the DJS for each sub-phase (Nm/kg/°). The R2 values were determined for each linear regression line (sub-phase).

2.4. Statistical Analyses

Data were entered into the Statistical Package for the Social Sciences for Windows software (version 27.0). Each knee dataset was considered as an independent dataset. For each knee, the intra-individual means and intra-individual coefficients of variation (CV) of the DJS of the knee and R2 were determined. CV allowed us to assess the intra-individual variability. Two-tailed related-samples t-tests were used to compare sub-phases and groups. Mann–Whitney test was used to perform comparisons between not-affected lower limbs and affected lower limbs (i.e., one or more lower limb joints assessed as swollen or tender) and between knee pathological involvement (i.e., assessed as swollen or tender) and without knee pathological involvement. Differences were considered statistically significant for p values < 0.05.

3. Results

Table 1 presents the demographic characteristics and the reproductive and medical histories of both groups. Three RA post-menopausal women and five post-menopausal women without RA presented an induced menopause (i.e., bi-lateral oophorectomy). Moreover, three RA women and one woman without RA were undergoing hormone therapy. On the other hand, no RA post-menopausal women had early RA (disease duration ≤ 2 years) and two presented a DAS-28 score under 2.6.
The average “moment of force—angle” plots of one woman with RA and one without RA are presented in Figure 1. Thus, for each woman the left and right “moment of force—angle” plots can be observed.
The individual values of the DJS of the knee and their R2 values, regarding the age-matched post-menopausal women, are presented in Table 2. Comparing sub-phases, age-matched post-menopausal women yielded a stiffer behavior (i.e., a higher DJS) during 1st KFS compared to the others two (p < 0.001); a stiffer behavior was also observed in KFS compared to 2nd KFS (p < 0.001). In 1st KFS and KES, R2 values of the age-matched post-menopausal women were considered to be very close to the linear model, i.e., R2 > 0.8; however, regarding the 1st KFS, five knees of the thirty-six did not yield a linear behavior of the “moment of force—angle” curve (i.e., R2 > 0.8); regarding the KES, all knees yielded a linear behavior of the “moment of force—angle” curve. R2 values of the 2nd KFS did not achieve 0.8 (only four knees yielded a linear behavior of the “moment of force—angle” curve).
Regarding the RA post-menopausal women, Table 3 shows the individual values of the DJS of the knee and its R2 value. Differences in DJS were found when the three sub-phases were compared: a stiffer behavior was observed in 1st KFS compared to the others two (p < 0.001); a stiffer behavior was also observed in KFS compared to 2nd KFS (p <0.001). R2 values in 1st KFS and KES were considered to be very close to the linear model; however, during KES, nine of the thirty-six knees did not yield a linear behavior of the “moment of force—angle” curve; important examples of this are the L11 and R11 knees (they belong to the same woman with high knee pathological involvement): they achieved the lowest R2 values registered during this sub-phase. During 1st KFS, only one knee did not yield a linear behavior of the “moment of force—angle” curve. R2 values of the 2nd KFS did not achieve 0.8 (although seventeen of the thirty-six knees yielded a linear behavior of the “moment of force—angle” curve, many other knees yielded very low R2 values).
The RA post-menopausal women yielded a stiffer behavior during the 2nd KFS compared to the age-matched post-menopausal women (p < 0.01). During the other sub-phases, no differences were found between groups. Differences between groups were also found regarding gait speed (p < 0.001): 0.95 ± 0.22 (RA post-menopausal women); 1.19 ± 0.15 (age-matched post-menopausal women).
Six of the thirty-six lower limbs presented one or more joints assessed as swollen or tender (Table 3). Moreover, twelve lower limbs presented knee pathological involvement. The comparisons between not-affected lower limbs and affected lower limbs and between knee pathological involvement and without knee pathological involvement did not show differences. Differences between affected and not-affected lower limbs were found regarding gait speed (p < 0.001): 0.91 ± 0.23 (affected lower limbs); 1.03 ± 0.18 (not-affected lower limbs).

4. Discussion

This research aimed to compare RA post-menopausal women with pathological involvement of the lower limb joints and age-matched post-menopausal women without RA regarding the DJS of the knee during the stance phase of gait. To the best of our knowledge, it was the first study that analyzed the DJS of the knee in RA patients. Our data point to a stiffer behavior during the 2nd KFS yielded by the RA post-menopausal women, suggesting that changes in knee joint stiffness occurred in these patients. Nonetheless, the R2 values of both groups during this sub-phase did not yield a linear behavior of the “moment of force—angle” curve. On the other hand, earlier studies [22,25] observed a stiffer behavior during the 1st KFS in subjects with knee impairment when compared with healthy controls. Our results did not corroborate these findings once RA post-menopausal women presented no changes in the DJS of the knee during the 1st KFS and KES. Moreover, our data also support no differences between the affected and not-affected lower limbs and between the knees with and without pathological involvement.
The “moment of force—angle” relationship of post-menopausal women with and without RA created counter-clockwise loops between the 1st KFS and KES. These shapes contrasts with the shapes obtained in previous studies [20,23] that evaluated unimpaired male and female adults, i.e., clockwise loops between the 1st KFS and KES, result of different angular displacements of the knee. These contradictory shapes suggest that effects from aging or RA could change the shape of the “moment of force—angle” curve and angular displacement of the knee. Thus, in order to clarify this issue, future studies should compare post-menopausal women with and without RA with unimpaired young adults.
Frigo et al. [20] was the only study that analyzed all the stance period regarding the DJS of the knee. They split this stance phase into sub-phases; however, not all were considered suitable for linearization. Thus, a slight different split of the stance phase was proposed, based on angular displacements of the segment that rotates around the axis of rotation (in this case the knee) [15]: 1st KFS and KES (similar to the first two sub-phases of the stance phase analyzed by Frigo et al. [20]), and 2nd KFS. Nevertheless, to the best of our knowledge, this methodology was not used before our study. Our data are promising for the first two phases, in which linear “moment of force—angle” relationships were achieved. These results corroborate those achieved in previous studies [20,23], which also yielded R2 mean values higher than 0.9 during the 1st KFS and KES. However, during the KES, a quarter of RA women’ knees yielded R2 values lower than 0.8, in contrast to none post-menopausal women’ knee with R2 values lower than 0.8. The two lowest R2 values yielded during this sub-phase belong to the same woman with high knee pathological involvement, suggesting the effects of the RA pathological process may have some influence. Nonetheless, the comparison between not-affected lower limbs versus affected lower limbs and between knee pathological involvement versus without knee pathological involvement did not present differences. Regarding the last sub-phase (2nd KFS), our data yielded R2 values lower than 0.8, not corresponding to a linear behavior of the “moment of force—angle” curve. Shamei et al. [23] did not present R2 values regarding this sub-phase, and Frigo et al. [20] also did not find a linear behavior of the “moment of force—angle” during the sub-phase that comprises the 2nd KFS and the swing-phase (till maximum flexion). Once again, in order to clarify the effects of age or RA pathological process, a comparison with healthy young adults should be considered in future research.
Earlier studies [20,25] proposed that DJS of the knee increased at higher gait speeds, namely, during 1st KFS and KES. In one of these studies [20], the authors assessed unimpaired young adults, and in the other [25], the study assessed subjects with knee osteoarthritis and healthy controls. In our study, RA post-menopausal women with pathological involvement of the lower limb joints presented a lower gait speed than age-matched post-menopausal women; however, no differences were observed between these groups regarding the DJS of the knee during 1st KFS and KES. Thus, we could speculate that the inability in our study to find differences regarding the DJS of the knee may be explained by the differences between groups concerning gait speed. In this way, this is an important issue that should be clarified in future studies.
Post-menopausal women with and without RA yielded a stiffer behavior during 1st KFS compared to the others two sub-phases and also a stiffer behavior during KFS compared to 2nd KFS. Similar results were also achieved by Frigo et al. [20] in unimpaired young adults. The highest DJS of the knee during the 1st KFS corresponds to the need for a greater joint stiffness to withstand the impact of the foot on the ground. During the second sub-phase, i.e., the KES, also needed is a higher DJS of the knee to ensure a proper joint stability. The achieved lower values of DJS of the knee during the 2nd KFS suggest a greater need for joint mobility instead a greater need for joint stability.
Joint stability and joint mobility are capacities dependent on the motor control exerted by the central nervous system [5,15]. Since RA post-menopausal women yielded a stiffer behavior during the 2nd KFS, we suggest that will be important to improve the knee’s range of motion. In this way, exercise programs with RA post-menopausal women should be focused on the promotion of proprioception and the ability to use the contractile components to produce mechanical energy during gait, increasing the control of the joint range of motion [3].

5. Conclusions

In post-menopausal women, the RA pathogenic process seem to influence the shape of the “moment of force—angle” knee relationship. The splitting methodology used could be modelled by a linear “moment of force—angle” relationship, namely, during the first two phases (i.e., 1st KFS and KES). During the 2nd KFS, RA post-menopausal women yielded a stiffer behavior than age-matched post-menopausal women; however, this sub-phase was not considered suitable for linearization.

Author Contributions

Conceptualization, P.A., J.V.P. and J.A.; methodology, P.A., J.V.P. and J.A; software, P.A., O.F. and J.A; formal analysis, P.A., O.F. and J.A; writing—original draft preparation, P.A.; writing—review and editing, J.V.P., O.F. and J.A. All authors have read and agreed to the published version of the manuscript.

Funding

This research received no external funding.

Institutional Review Board Statement

The study was conducted according to the guidelines of the Declaration of Helsinki, and approved by the Ethical Committee for Health of the Portuguese Institute of Rheumatology.

Informed Consent Statement

Informed consent was obtained from all subjects involved in the study.

Data Availability Statement

The data presented in this study are available on request from the corresponding author. The data are not publicly available due to privacy restrictions.

Conflicts of Interest

The authors declare no conflict of interest.

References

  1. Espanha, M.; Pascoal, A.; Correia, P.; Silva, P. Noções Fundamentais De Artrologia. In Anatomofisiologia. Tomo I. Sistema osteo-articular; Espanha, M., Ed.; Faculdade de Motricidade Humana—Serviço De Edições: Cruz Quebrada, Portugal, 1999. [Google Scholar]
  2. Abrantes, J. Rigidez dinâmica como indicador da estabilidade articular. In Proceedings of the XII Congresso Brasileiro de Biomecânica, São Paulo, Brazil, 30 May–2 June 2007. [Google Scholar]
  3. Aleixo, P.; Vaz Patto, J.; Moreira, H.; Abrantes, J. Dynamic joint stiffness of the ankle in healthy and rheumatoid arthritis post-menopausal women. Gait Posture 2018, 60, 225–234. [Google Scholar] [CrossRef] [PubMed]
  4. Faria, A.; Gabriel, R.; Abrantes, J.; Moreira, H.; Wood, P.; Camacho, T. The Relationship between Muscle-Tendon Unit Stiffness, Joint Stability and Posture: The Risk of Injury, Performance, Resonance and Energy Expenditure. In Posture: Types, Assessment and Control; Wright, A., Rothenberg, S., Eds.; Nova Science Publishers: New York, NY, USA, 2011; pp. 137–154. ISBN 6312317269. [Google Scholar]
  5. Riemann, B.; Lephart, S. The sensorimotor system, part I: The physiologic basis of functional joint stability. J. Athl. Train. 2002, 37, 71–79. [Google Scholar] [PubMed]
  6. Docherty, C.; Arnold, B.; Zinder, S.; Granata, K.; Gansneder, B. Relationship between two proprioceptive measures and stiffness at the ankle. J. Electromyogr. Kinesiol. 2004, 14, 317–324. [Google Scholar] [CrossRef] [PubMed]
  7. Aletaha, D.; Neogi, T.; Silman, A.; Funovits, J.; Felson, D.; Bingham, C.; Birnbaum, N.; Burmester, G.; Bykerk, V.; Cohen, M.; et al. 2010 Rheumatoid arthritis classification criteria: An American College of Rheumatology/European League Against Rheumatism collaborative initiative. Arthritis Rheum. 2010, 62, 2569–2581. [Google Scholar] [CrossRef]
  8. Myasoedova, E.; Davis, J.; Matteson, E.; Crowson, C. Is the epidemiology of rheumatoid arthritis changing? Results from a population-based incidence study, 1985–2014. Ann. Rheum. Dis. 2020, 79, 440–444. [Google Scholar] [CrossRef]
  9. Mollard, E.; Pedro, S.; Chakravarty, E.; Clowse, M.; Schumacher, R.; Michaud, K. The impact of menopause on functional status in women with rheumatoid arthritis. Rheumatology 2018, 57, 798–802. [Google Scholar] [CrossRef] [Green Version]
  10. Alpizar-Rodriguez, D.; Förger, F.; Courvoisier, D.; Gabay, C.; Finckh, A. Role of reproductive and menopausal factors in functional and structural progression of rheumatoid arthritis: Results from the SCQM cohort. Rheumatology 2019, 58, 432–440. [Google Scholar] [CrossRef]
  11. Stanmore, E.; Oldham, J.; Skelton, D.; O’Neill, T.; Pilling, M.; Campbell, J.; Todd, C. Risk factors for falls in adults with rheumatoid arthritis: A prospective study. Arthritis Care Res. 2013, 65, 1251–1258. [Google Scholar] [CrossRef] [Green Version]
  12. Rubenstein, L. Falls in older people: Epidemiology, risk factors and strategies for prevention. Age Ageing 2006, 35, ii37–ii41. [Google Scholar] [CrossRef] [Green Version]
  13. Weiss, R.; Wretenberg, P.; Stark, A.; Palmblad, K.; Larsson, P.; Gröndal, L.; Broström, E. Gait pattern in rheumatoid arthritis. Gait Posture 2008, 28, 229–234. [Google Scholar] [CrossRef]
  14. Jin, L.; Hahn, M. Modulation of lower extremity joint stiffness, work and power at different walking and running speeds. Hum. Mov. Sci. 2018, 58, 1–9. [Google Scholar] [CrossRef] [PubMed]
  15. Aleixo, P.; Atalaia, T.; Abrantes, J. Dynamic Joint Stiffness: A Critical Review. In Advances in Medicine and Biology 175; Berhardt, L., Ed.; Nova Science Publishers: New York, NY, USA, 2021; pp. 1–96. ISBN 978-1-53619-083-0. [Google Scholar]
  16. Davis, R.; De Luca, P. Pathological gait characterization via dynamic joint stiffness. Gait Posture 1995, 3, 173. [Google Scholar] [CrossRef]
  17. Davis, R.; DeLuca, P. Gait caracterization via dynamic joint stiffness. Gait Posture 1996, 4, 224–231. [Google Scholar] [CrossRef]
  18. Gabriel, R.; Abrantes, J.; Granata, K.; Bulas-Cruz, J.; Melo-Pinto, P.; Filipe, V. Dynamic joint stiffness of the ankle during walking: Gender-related differences. Phys. Ther. Sport 2008, 9, 16–24. [Google Scholar] [CrossRef] [PubMed]
  19. Aleixo, P.; Vaz Patto, J.; Abrantes, J. Dynamic joint stiffness of the ankle in rheumatoid arthritis postmenopausal women fallers and non-fallers. Gait Posture 2017, 57, 324–325. [Google Scholar] [CrossRef]
  20. Frigo, C.; Crenna, P.; Jensen, L. Moment-angle relationship at lower limb joints during human walking at different velocities. J. Electromyogr. Kinesiol. 1996, 6, 177–190. [Google Scholar] [CrossRef]
  21. Galli, M.; Rigoldi, C.; Brunner, R.; Virji-Babul, N.; Giorgio, A. Joint stiffness and gait pattern evaluation in children with Down syndrome. Gait Posture 2008, 28, 502–506. [Google Scholar] [CrossRef]
  22. McGinnis, K.; Snyder-Mackler, L.; Flowers, P.; Zeni, J. Dynamic joint stiffness and co-contraction in subjects after total knee arthroplasty. Clin. Biomech. 2013, 28, 205–210. [Google Scholar] [CrossRef] [Green Version]
  23. Shamaei, K.; Sawicki, G.; Dollar, A. Estimation of quasi-stiffness of the human knee in the stance phase of walking. PLoS ONE 2013, 8, e59993. [Google Scholar] [CrossRef] [Green Version]
  24. Williams, D.; Brunt, D.; Tanenberg, R. Diabetic neuropathy is related to joint stiffness during late stance phase. J. Appl. Biomech. 2007, 23, 251–260. [Google Scholar] [CrossRef]
  25. Zeni, J.; Higginson, J. Dynamic knee joint stiffness in subjects with a progressive increase in severity of knee osteoarthritis. Clin. Biomech. 2009, 24, 366–371. [Google Scholar] [CrossRef] [PubMed] [Green Version]
  26. Safaeepour, Z.; Esteki, A.; Ghomshe, F.; Osman, N. Quantitative analysis of human ankle characteristics at different gait phases and speeds for utilizing in ankle-foot prosthetic design. Biomed. Eng. Online 2014, 13, 19. [Google Scholar] [CrossRef] [PubMed] [Green Version]
  27. Atalaia, T.; Abrantes, J.; Castro-Caldas, A. Influence of footedness on dynamic joint stiffness during the gait stance phase. J. Sci. Res. Reports 2015, 5, 175–183. [Google Scholar] [CrossRef] [PubMed]
  28. Harlow, S.; Gass, M.; Hall, J.; Lobo, R.; Maki, P.; Rebar, R.; Sherman, S.; Sluss, P.; De Villiers, T. Executive summary of the Stages of Reproductive Aging Workshop + 10: Addressing the unfinished agenda of staging reproductive aging Methods-Scientists from five countries and multiple disciplines evaluated data from cohort studies of midlife women and in. Menopause 2012, 19, 387–395. [Google Scholar] [CrossRef] [Green Version]
  29. Shuster, L.; Rhodes, D.; Gostout, B.; Grossardt, B.; Rocca, W. Premature menopause or early menopause: Long-term health consequences. Maturitas 2010, 65, 161–166. [Google Scholar] [CrossRef] [Green Version]
  30. Smolen, J.; Breedveld, F.; Eberl, G.; Jones, I.; Leeming, M.; Wylie, G.; Kirkpatrick, J. Validity and reliability of the twenty-eight-joint count for the assessement of rheumatoid arthritis activity. Arthritis Rheum. 1995, 38, 38–43. [Google Scholar] [CrossRef]
Figure 1. Knee moment of force plotted as function of the knee angle in the sagittal plane during the gait stance phase. Gait stance phase split into three sub-phases: 1st KFS (purple); KES (green); 2nd KFS (black): (a) graph of the left knee of the RA post-menopausal woman; (b) graph of the right knee of the RA post-menopausal woman; (c) graph of the left knee of the age-matched post-menopausal woman; (d) graph of the right knee of the age-matched post-menopausal woman.
Rheumato 03 00005 g001
Table 1. Demographic characteristics and the reproductive and medical histories.
With RA (n = 18)Without RA (n = 18)Differences
Mean (sd)Mean (sd)p Value
Age (years)64.3 (8.4)64.3 (7.8)1.000
Disease duration (years)11.5 (10.7)--
DAS-28 score4.4 (1.2)--
Menopause duration (years)16.9 (8.7)15.0 (9.1)0.530
Body mass (kg)63.7 (9.8)64.5 (12.6)0.826
Height (m)1.52 (0.06)1.54 (0.06)0.301
Body mass index (kg/m2)27.8 (4.8)27.2 (4.6)0.705
DAS-28 score—Disease Activity Score (28 joints); RA—rheumatoid arthritis; SD—standard deviation.
Table 2. Mean, standard deviation, and CV (%) of the DJS of the knee (N.m/kg/°) and R2 regarding the age-matched post-menopausal women.
1st KFSKES2nd KFS
KneesDJSCVR2CVDJSCVR2CVDJSCVR2CV
L_10.0900 (0.0085)9.50.985 (0.007)0.70.0405 (0.0027)6.70.981 (0.009)0.9−0.0030 (0.0020)67.00.294 (0.184)62.4
L_20.0674 (0.0095)14.20.923 (0.028)3.00.0395 (0.0024)6.10.996 (0.002)0.20.0092 (0.0016)17.70.841 (0.072)8.5
L_30.0183 (0.0089)48.40.549 (0.123)22.40.0289 (0.0128)44.40.871 (0.287)32.90.0034 (0.0027)79.90.686 (0.089)13.0
L_40.0892 (0.0270)30.30.836 (0.202)24.20.0406 (0.0059)14.60.958 (0.050)5.2−0.0087 (0.0013)15.20.880 (0.046)5.2
L_50.0494 (0.0031)6.30.982 (0.007)0.70.0339 (0.0039)11.40.985 (0.009)0.9−0.0046 (0.0007)14.30.656 (0.057)8.6
L_60.1126 (0.0125)6.40.974 (0.007)0.80.0569 (0.0032)5.60.991 (0.006)0.60.0040 (0.0012)29.80.469 (0.102)21.8
L_70.1278 (0.0193)15.10.979 (0.011)1.10.0529 (0.0066)12.40.987 (0.008)0.8−0.0042 (0.0004)9.90.605 (0.051)8.4
L_80.1136 (0.0138)12.10.949 (0.016)1.70.0332 (0.0020)6.00.988 (0.008)0.80.0043 (0.0017)40.10.710 (0.161)22.6
L_90.0575 (0.0148)25.70.830 (0.175)21.10.0429 (0.0265)61.80.907 (0.199)22.0−0.0022 (0.0027)123.30.265 (0.196)73.9
L_100.0765 (0.0061)8.00.975 (0.014)1.40.0523 (0.0074)14.10.992 (0.008)0.80.0038 (0.0005)13.10.590 (0.061)10.4
L_110.0409 (0.0076)18.60.734 (0.116)15.90.0478 (0.0098)20.50.941 (0.033)3.50.0102 (0.0021)20.20.941 (0.027)2.8
L_120.2119 (0.1440)68.00.614 (0.237)38.60.0456 (0.0026)5.70.988 (0.021)2.10.0058 (0.0014)24.20.684 (0.076)11.1
L_130.0855 (0.0085)10.00.935 (0.046)5.00.0322 (0.0185)57.40.860 (0.167)19.4−0.0008 (0.0022)279.70.307 (0.184)60.0
L_140.1640 (0.0125)7.60.988 (0.006)0.60.0682 (0.0024)3.50.960 (0.012)1.3−0.0144 (0.0031)21.50.730 (0.049)6.8
L_150.0924 (0.0116)12.50.960 (0.007)0.70.0423 (0.0042)9.90.985 (0.008)0.8−0.0081 (0.0016)19.80.780 (0.096)12.4
L_160.0214 (0.0036)16.80.577 (0.108)18.80.0337 (0.0026)7.80.980 (0.010)1.00.0044 (0.0009)20.70.699 (0.091)13.0
L_170.1461 (0.0532)36.40.748 (0.101)13.50.0667 (0.0272)40.80.877 (0.137)15.70.0092 (0.0010)11.00.878 (0.030)3.4
L_180.0918 (0.0100)10.90.973 (0.013)1.30.0558 (0.0053)9.50.978 (0.007)0.7−0.0019 (0.0010)50.90.208 (0.095)45.5
R_10.1359 (0.0154)11.30.982 (0.010)1.00.0557 (0.0048)8.60.966 (0.008)0.8−0.0143 (0.0023)16.00.793 (0.060)7.5
R_20.0893 (0.0117)13.10.956 (0.016)1.70.0359 (0.0031)8.80.990 (0.005)0.50.0031 (0.0016)52.90.361 (0.149)41.4
R_30.0443 (0.0039)8.80.882 (0.072)8.10.0558 (0.0165)29.50.977 (0.010)1.0−0.0057 (0.0013)21.90.739 (0.072)9.7
R_40.0957 (0.0138)14.40.975 (0.007)0.70.0546 (0.0074)13.60.990 (0.003)0.3−0.0131 (0.0023)17.70.798 (0.074)9.3
R_50.0625 (0.0115)18.40.963 (0.024)2.50.0251 (0.0031)12.20.951 (0.024)2.50.0018 (0.0006)30.30.346 (0.094)27.0
R_60.1468 (0.0173)11.80.973 (0.009)0.90.0598 (0.0063)10.60.966 (0.011)1.2−0.0109 (0.0010)8.90.760 (0.041)5.4
R_70.1451 (0.0122)8.40.963 (0.014)1.40.0417 (0.0027)6.40.982 (0.005)0.5−0.0031 (0.0014)43.70.336 (0.135)40.1
R_80.1912 (0.0427)22.30.944 (0.019)2.00.0330 (0.0032)9.60.987 (0.012)1.20.0017 (0.0005)28.60.348 (0.094)27.0
R_90.0738 (0.0077)10.40.936 (0.018)2.00.0467 (0.0032)6.90.985 (0.008)0.8−0.0080 (0.0019)24.20.785 (0.100)12.8
R_100.0734 (0.0049)6.70.977 (0.011)1.20.0450 (0.0038)8.50.985 (0.017)1.80.0041 (0.0012)29.90.503 (0.109)21.8
R_110.0784 (0.0420)53.60.859 (0.085)9.90.0707 (0.0114)16.20.969 (0.028)2.9−0.0032 (0.0015)45.30.611 (0.184)30.0
R_120.5404 (0.2549)47.20.879 (0.111)12.70.0604 (0.0078)12.90.968 (0.027)2.8−0.0013 (0.0020)157.40.172 (0.119)69.5
R_130.1046 (0.0278)26.60.956 (0.023)2.40.0437 (0.0039)8.90.972 (0.031)3.2−0.0054 (0.0015)28.20.670 (0.116)17.3
R_140.1372 (0.0084)6.10.982 (0.005)0.50.0520 (0.0021)4.00.962 (0.009)0.9−0.0090 (0.0015)17.10.651 (0.098)15.0
R_150.0757 (0.0166)21.90.948 (0.050)5.20.0520 (0.0081)15.60.980 (0.010)1.0−0.0033 (0.0015)44.20.442 (0.172)38.8
R_160.0443 (0.0039)8.80.882 (0.072)8.10.0558 (0.0165)29.50.977 (0.010)1.0−0.0057 (0.0013)21.90.739 (0.072)9.7
R_170.2953 (0.1333)45.20.877 (0.055)6.20.0525 (0.0211)40.10.899 (0.174)19.30.0036 (0.0009)23.30.417 (0.098)23.5
R_180.0892 (0.0101)11.30.981 (0.006)0.60.0581 (0.0105)18.10.964 (0.024)2.5−0.0029 (0.0021)73.50.320 (0.200)62.5
mean (sd)0.1133 (0.0917)19.50.901 (0.117)6.60.0476 (0.0114)16.60.964 * (0.357)4.3 *−0.0018 * (0.0065)42.90.584 * (0.216)23.8
1st KFS—first knee flexion sub-phase; 2nd KFS—second knee flexion sub-phase; CV—coefficient of variation; DJS—dynamic joint stiffness of the knee; KES—knee extension sub-phase; L—left; R—right; R2—coefficient of regression; sd—standard deviation; * p < 0.05—difference regarding RA post-menopausal women (see Table 3).
Table 3. Mean, standard deviation, and CV (%) of the DJS of the knee (N.m/kg/°) and R2 regarding the RA post-menopausal women. Number of lower limb joints with pathological involvement and knee pathological involvement.
1st KFSKES2nd KFS
KneesInvol.N.DJSCVR2CVDJSCVR2CVDJSCVR2CV
L_1No50.1087 (0.0238)21.90.950 (0.035)3.70.0608 (0.0259)42.70.961 (0.059)6.1−0.0244 (0.038)15.70.926 (0.024)2.5
L_2No10.0347 (0.0147)42.40.667 (0.229)34.3−0.0200 (0.0639)320.00.688 (0.344)49.9−0.0139 (0.0170)122.60.758 (0.312)41.1
L_3Yes30.0787 (0.0086)11.00.957 (0.021)2.20.0412 (0.0052)12.60.963 (0.016)1.7−0.0039 (0.0013)32.90.658 (0.229)34.8
L_4No00.0799 (0.0203)25.40.993 (0.005)0.50.0422 (0.0082)19.30.889 (0.054)6.1−0.0093 (0.0019)21.00.938 (0.020)2.2
L_5Yes80.0779 (0.0161)20.60.972 (0.011)1.10.0611 (0.0109)17.80.979 (0.017)1.70.0020 (0.0021)105.40.478 (0.194)40.5
L_6No00.1020 (0.0085)8.40.978 (0.011)1.10.0253 (0.0045)17.80.932 (0.028)3.0−0.0066 (0.0010)14.70.761 (0.080)10.5
L_7No20.0846 (0.0055)6.50.985 (0.009)0.90.0428 (0.0058)13.60.938 (0.046)4.9−0.0075 (0.0029)38.50.683 (0.138)20.3
L_8Yes130.2011 (0.1255)62.40.919 (0.093)10.10.0754 (0.0338)44.80.755 (0.205)27.2−0.0445 (0.0070)15.80.970 (0.009)1.0
L_9Yes30.1178 (0.0174)14.80.954 (0.025)2.60.0509 (0.0039)7.70.984 (0.015)1.5−0.0057 (0.0016)27.50.688 (0.142)20.6
L_10Yes10.0913 (0.0072)7.90.987 (0.006)0.60.0470 (0.0053)11.20.980 (0.017)1.8−0.0063 (0.0020)31.40.872 (0.102)11.7
L_11Yes20.2504 (0.0768)30.70.969 (0.020)2.00.0153 (0.0409)267.00.232 (0.097)41.6−0.0250 (0.0036)14.50.971 (0.014)1.5
L_12No00.0800 (0.0184)22.90.864 (0.100)11.60.0361 (0.0040)11.20.981 (0.012)1.2−0.0057 (0.0024)42.00.701 (0.118)16.9
L_13No60.1120 (0.0391)34.90.941 (0.037)3.90.0009 (0.0353)325.40.767 (0.147)19.2−0.0078 (0.0033)42.10.786 (0.149)18.9
L_14No40.2049 (0.0789)38.50.977 (0.012)1.20.0683 (0.0062)9.10.995 (0.003)0.3−0.0012 (0.0010)83.10.170 (0.125)73.2
L_15No50.1605 (0.0385)24.00.935 (0.063)6.80.0513 (0.0161)31.40.846 (0.214)25.2−0.0010 (0.0024)228.30.347 (0.244)70.3
L_16Yes40.0639 (0.0185)29.00.868 (0.091)10.50.0257 (0.0134)52.20.809 (0.140)17.30.0001 (0.0017)271.60.376 (0.203)53.9
L_17No10.1419 (0.0097)6.80.988 (0.018)1.80.0915 (0.0127)13.80.973 (0.013)1.3−0.0110 (0.0024)21.40.892 (0.032)3.6
L_18No10.0713 (0.0229)32.10.872 (0.030)3.40.0511 (0.0107)20.90.976 (0.034)3.50.0012 (0.0012)103.10.347 (0.134)38.6
R_1No50.1190 (0.0313)26.30.891 (0.060)6.80.0269 (0.0246)91.30.560 (0.320)57.2−0.0230 (0.0048)20.80.974 (0.015)1.5
R_2No00.0986 (0.0091)9.20.974 (0.007)0.70.0302 (0.0080)26.60.925 (0.054)5.9−0.0108 (0.0019)17.40.893 (0.050)5.6
R_3No20.0859 (0.0130)15.10.942 (0.043)4.50.0297 (0.0043)14.40.917 (0.051)5.6−0.0031 (0.0005)15.40.584 (0.074)12.6
R_4Yes30.0889 (0.0460)51.70.960 (0.033)3.50.0165 (0.0500)303.20.453 (0.382)84.3−0.0213 (0.0032)15.10.903 (0.037)4.1
R_5Yes80.0589 (0.0096)16.30.971 (0.011)1.10.0512 (0.0086)16.70.990 (0.006)0.6−0.0008 (0.0020)266.50.208 (0.199)95.7
R_6No10.1718 (0.0370)21.50.929 (0.031)3.30.0201 (0.0032)16.10.970 (0.017)1.80.0004 (0.0014)359.50.228 (0.111)48.7
R_7No20.0869 (0.0135)15.50.980 (0.003)0.30.0445 (0.0028)6.20.966 (0.011)1.1−0.0212 (0.0011)5.20.934 (0.033)3.5
R_8Yes130.3206 (0.1206)37.60.887 (0.145)16.40.0639 (0.0356)55.60.539 (0.374)69.3−0.0482 (0.0042)8.70.951 (0.006)0.6
R_9Yes20.1136 (0.0119)10.50.982 (0.013)1.30.0544 (0.0058)10.70.976 (0.014)1.4−0.0124 (0.0012)9.80.828 (0.047)5.7
R_10No00.0805 (0.0170)21.10.943 (0.029)3.00.0342 (0.0089)26.00.972 (0.052)5.40.0050 (0.0015)30.00.670 (0.132)19.6
R_11Yes20.1809 (0.0445)24.60.887 (0.075)8.50.2751 (0.2542)92.40.544 (0.422)77.5−0.0716 (0.0195)27.20.897 (0.019)2.1
R_12No00.0835 (0.0170)20.30.858 (0.080)9.40.0326 (0.0052)15.80.981 (0.010)1.0−0.0005 (0.0022)404.20.200 (0.170)85.4
R_13No60.0925 (0.0140)15.20.909 (0.060)6.60.0219 (0.0113)51.60.545 (0.196)35.9−0.0105 (0.0027)25.50.937 (0.038)4.1
R_14No20.1461 (0.0210)14.40.952 (0.015)1.50.0479 (0.0048)9.90.995 (0.003)0.30.0027 (0.0009)33.00.363 (0.095)26.1
R_15No50.1270 (0.0279)22.00.969 (0.011)1.20.0455 (0.0137)30.00.866 (0.118)13.7−0.0141 (0.0012)8.30.906 (0.030)3.3
R_16No20.1089 (0.0250)23.00.963 (0.019)1.90.0348 (0.0068)19.60.873 (0.069)7.9−0.0048 (0.0017)34.80.750 (0.109)14.5
R_17No10.1229 (0.0108)8.80.990 (0.004)0.40.0758 (0.0108)14.20.974 (0.016)1.6−0.0135 (0.0022)16.60.876 (0.044)5.0
R_18No10.0542 (0.0097)18.00.874 (0.064)7.40.0302 (0.0060)19.90.980 (0.018)1.80.0108 (0.0011)9.80.972 (0.006)0.6
mean (sd)3 (3)0.1167 (0.0579)22.50.934 (0.062)4.90.0473 (0.0446)57.20.852 * (0.191)16.3 *−0.0113 * (0.0161)70.50.705 * (0.262)22.2
1st KFS—first knee flexion sub-phase; 2nd KFS—second knee flexion sub-phase; CV—coefficient of variation; DJS—dynamic joint stiffness of the knee; Invol—knee pathological involvement; KES—knee extension sub-phase; L—left; N.—number of lower limb joints with pathological involvement; R—right; R2—coefficient of regression; sd—standard deviation; * p < 0.05—difference regarding age-matched post-menopausal women (see Table 2).
Disclaimer/Publisher’s Note: The statements, opinions and data contained in all publications are solely those of the individual author(s) and contributor(s) and not of MDPI and/or the editor(s). MDPI and/or the editor(s) disclaim responsibility for any injury to people or property resulting from any ideas, methods, instructions or products referred to in the content.

