Article

An Engineered Escherichia coli Community for Studying Quorum Sensing

1
School of Food Science and Nutrition, University of Leeds, Leeds LS2 9JT, UK
2
Faculty of Biological Sciences, University of Leeds, Leeds LS2 9JT, UK
*
Authors to whom correspondence should be addressed.
SynBio 2023, 1(2), 144-157; https://doi.org/10.3390/synbio1020010
Submission received: 23 April 2023 / Revised: 24 May 2023 / Accepted: 4 July 2023 / Published: 7 July 2023

Abstract

:
In bacterial communities, quorum sensing (QS) is a process mediated via chemical signalling that individuals use to coordinate their collective phenotypes. It is closely associated with pathogenic traits such as virulence factor production and antibiotic resistance. In their natural habitats, bacteria live in small niches, forming intricate consortia, where the role of QS is little understood. This work aims to construct a tuneable, trackable, and reconfigurable model bacterial community for studying QS. To this end, three Escherichia coli fluorescent reporter strains were constructed based on the paradigm LuxI/LuxR QS system. The strains recreate the three major aspects of QS response: sensing (S), autoinducer production (P), and regulation (R). We found that the response of the S strain as a function of the N-(3-oxohexanoyl)-L-homoserine lactone (OHHL) concentration did not saturate and exhibited a concentration-dependent response (in the range 10−7 to 10−4 M). The P strain produced OHHL and showed the ability to activate the S response, while the R strain showed the ability to attenuate the response due to the expression of the lactonase AiiA. Monitoring the fluorescent signals of the strains permits tracking the activation and attenuation activities of the LuxI/LuxR QS system. Future studies can now also benefit from this straightforward subcloning strategy to study other QS systems.

1. Introduction

In bacterial communities, quorum sensing (QS) is the generalised cell-to-cell communication strategy that enables individuals to coordinate their phenotypes via chemical signalling. Phenotypes such as bioluminescence [1], antibiotic resistance [2], and the production of virulence factors [3] are known to be under QS genetic regulation and dependent on population density [4,5,6]. A QS system typically involves three parts: (i) an autoinducer that mediates (ii) the activation of a transcription regulator, thereby enabling the regulator to activate (iii) the expression of a QS regulon including the gene encoding the autoinducer [6]. The acyl homoserine lactone (AHL)-mediated QS system is common in Gram-negative bacteria. This type of system uses different AHLs as autoinducers and involves members of the LuxR family of transcription regulators as receptors [5,7,8]. The binding of AHLs to their cognate receptors is usually highly specific and is affected by their side-chain length and chemical decorations [6]. N-(3-oxohexanoyl)-L-homoserine lactone (OHHL) was the first AHL to be discovered from Vibrio fischeri [9]. Vibrio fischeri is a marine bacterium that employs the LuxI/LuxR QS system for bioluminescence [10]. This QS system involves three parts: (i) a lux operon luxICDABEG and (ii) a transcriptional regulatory gene luxR, which are, respectively, located at the right and left of (iii) a bidirectional lux promoter. Regarding the operon, the gene luxCDABEG is responsible for the bioluminescence, and the luxI gene encodes the OHHL synthase LuxI. OHHL works as an agonist that binds to LuxR, resulting in the dimerisation and activation of the regulator. The activated LuxR then binds to the lux promoter resulting in the expression of the lux operon genes [5,11,12].
Enzymes that degrade AHLs, such as AiiA (autoinducer inactivator), were discovered in the soil bacteria Bacillus [13]. Lactonase AiiA from Bacillus subtilis 240B1 was the first identified of its type. Plants expressing AiiA showed resistance to Erwinia carotovora infection by inactivating its QS signalling, thereby attenuating soft rot disease and tissue maceration in infected plants [13,14]. Such enzymes, including the AHL lactonases (EC 3.1.1.81) and acylases (EC 3.5.1.97), are known as quorum quenching enzymes, and they have potential applications in disease control [13,14,15,16,17].
A number of single-cell biosensors have been engineered for studies on QS [18]. The QS detection biosensors have been the basis for studies to propel the discovery of novel compounds with QS attenuation activity [19,20]. These studies have been of great value, but they fall short of representing the real-life context of microbial communities comprising numerous species in heterogenous niches and under continuous dynamic change, e.g., of shear flow, nutrients, public goods, and mechanical gradients [21]. Among the several limitations of single-biosensor studies, a major issue is the utilisation of single components of the QS response, such as the inclusion of the ‘listening’ element and the absence of the ‘transmitting’ and ‘regulation’ elements that occur in real multi-species bacterial communities. Therefore, it is challenging to study the QS activation and attenuation activities involving inter- and intra-species effects. Studies that model bacterial communities provide insight into how bacteria interact with one another and with their environment and aid the development of novel QS inhibition strategies. Moreover, given the extremely high complexity of wild-type microbial communities, model bacterial consortia offer a research platform for deconstructing part of their complexity.
The aim of this work presented here is to construct a tuneable, reconfigurable, and fluorescence-reporting bacterial community for studying QS. We designed three Escherichia coli (E. coli) strains to recreate three major aspects of the QS activities (sensing, activation, and attenuation) based on the LuxI/LuxR system (OHHL sensor, producer, and regulator). These QS activities were under the control of different inducible promoters and reported by imaging-compatible fluorescent proteins, allowing the monitoring of the cellular interactions and QS activities by fluorescence intensity (FI). In addition, the main genetic parts were flanked by restriction sites allowing the community to be modified to study other QS systems via routine cloning techniques. It was found that the sensor strain was able to report varying concentrations of OHHL. The producer strain showed good efficiency in activating the sensor, whilst the regulator strain was able to attenuate the sensor’s response, consistent with the expected degradation of OHHL.

2. Results

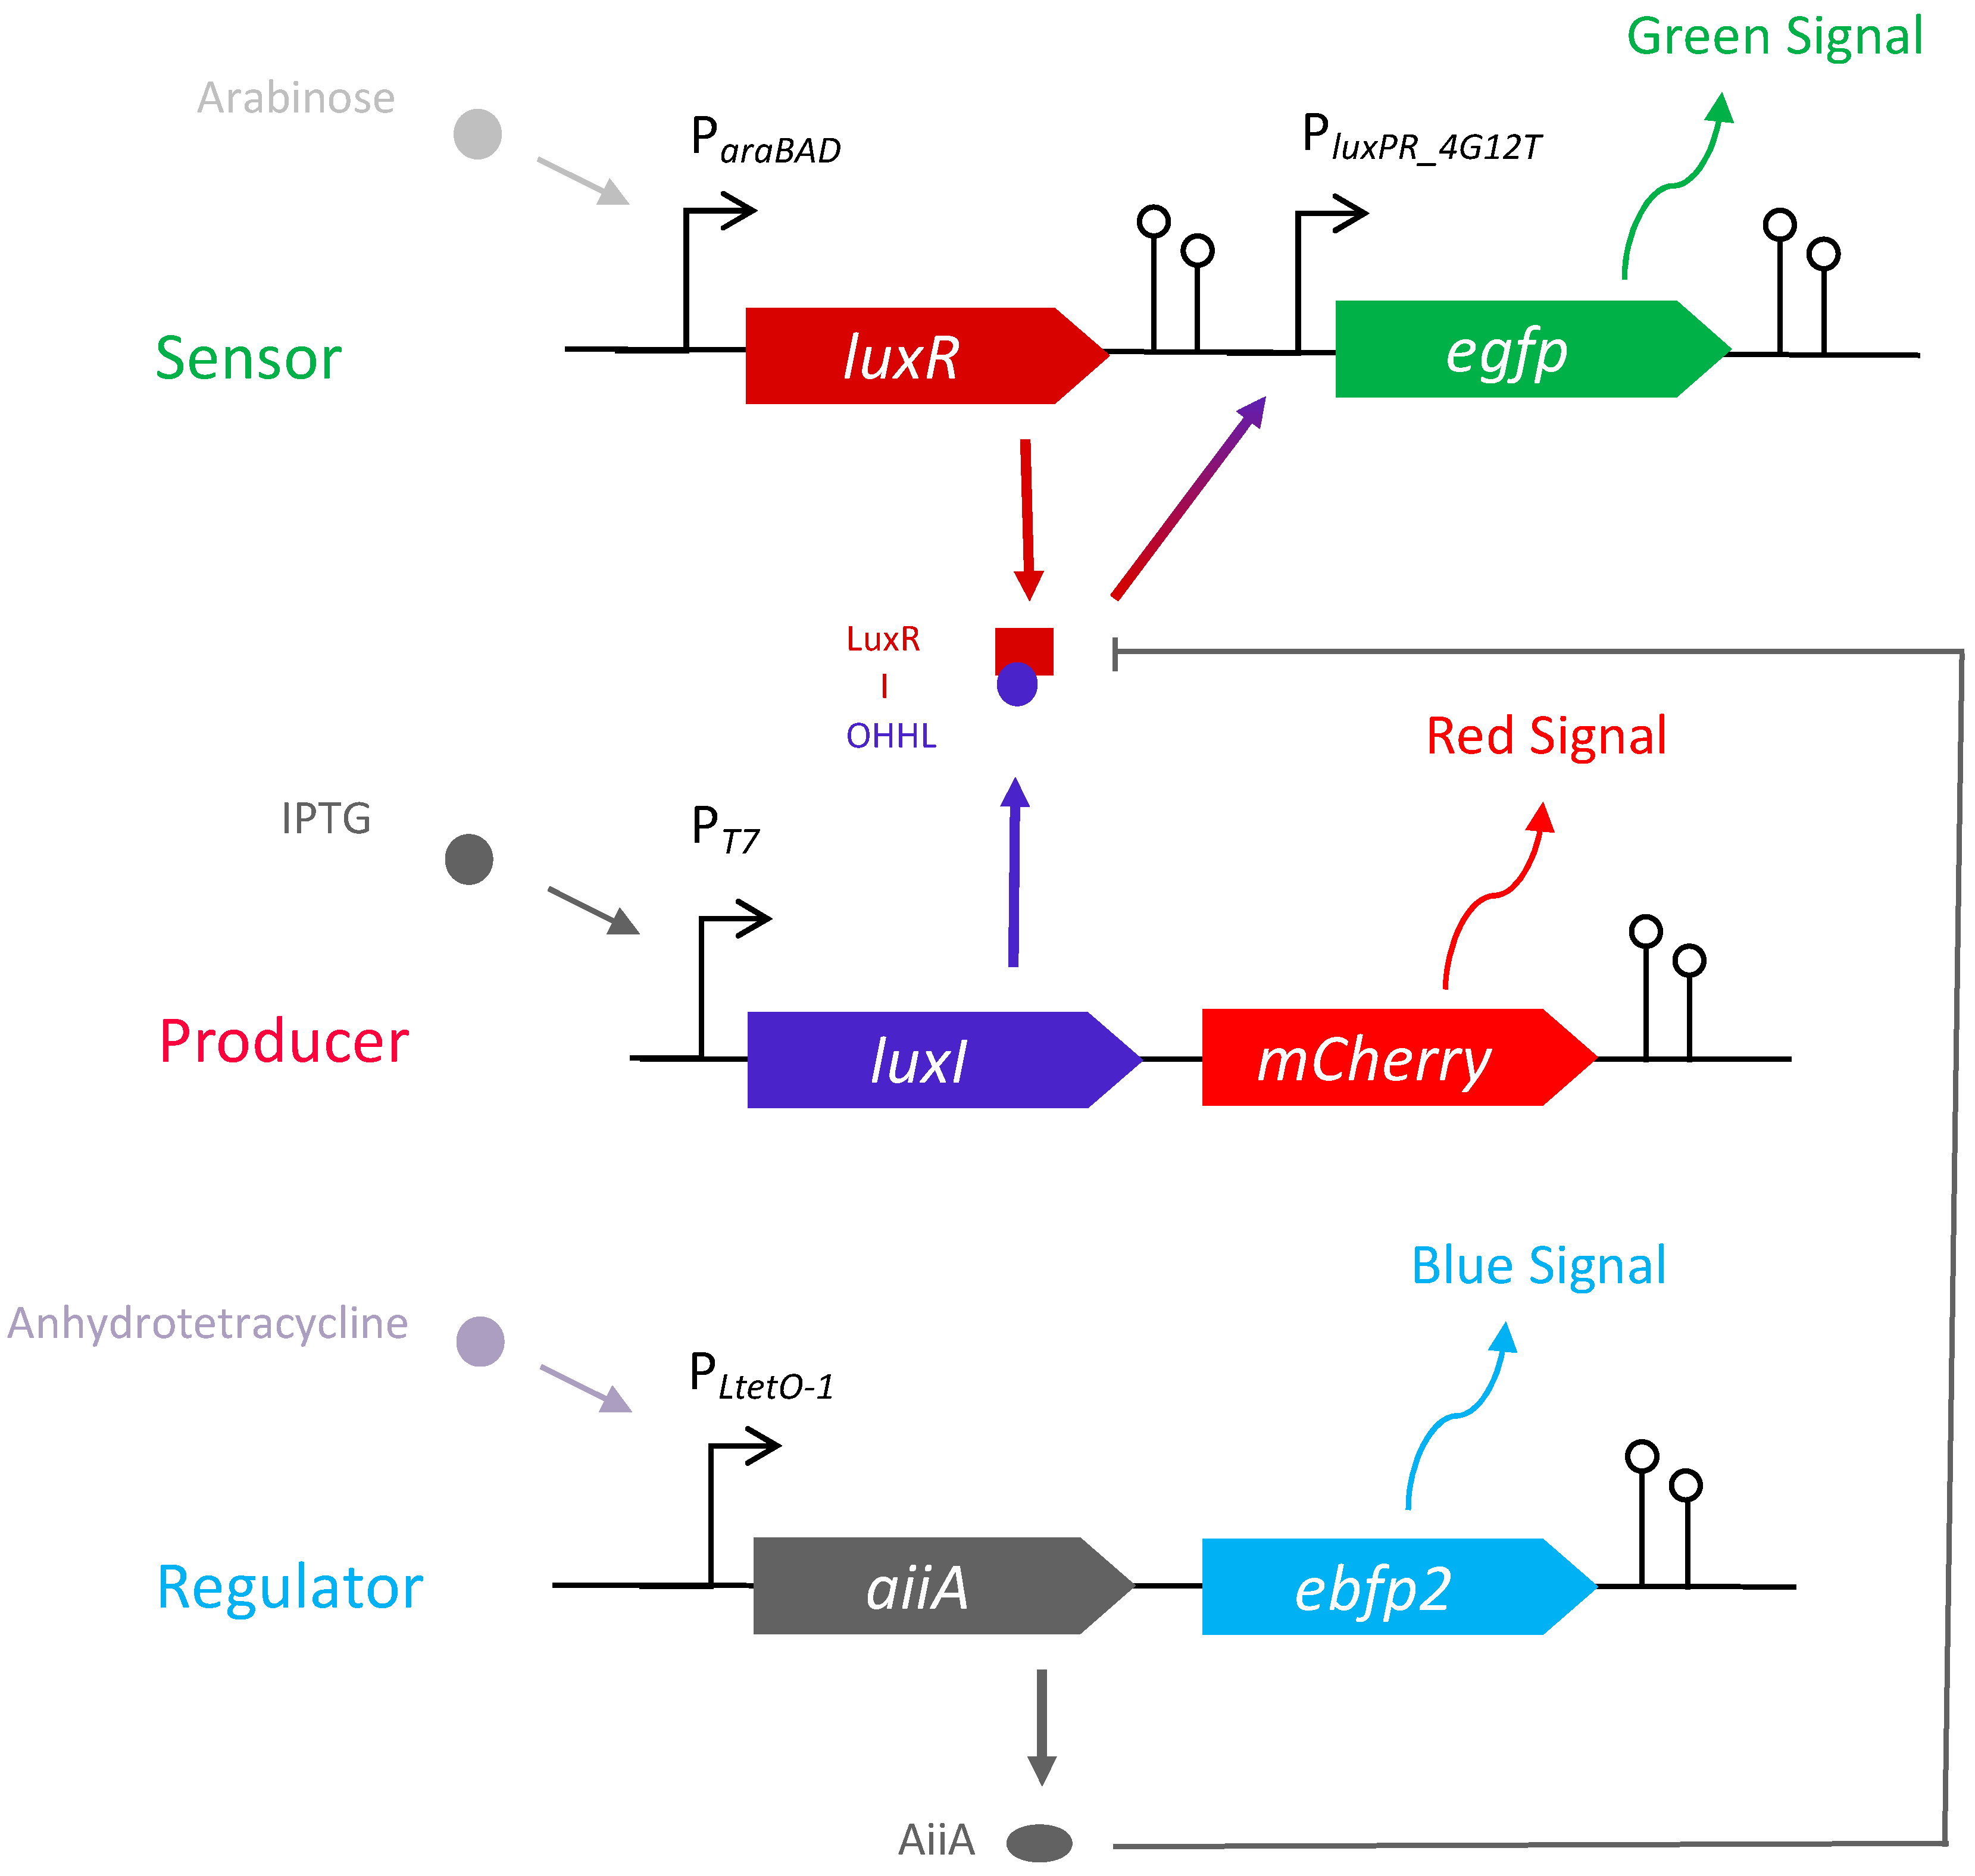
2.1. E. coli Community for Quorum Sensing Regulation Analysis

Three E. coli strains (OHHL sensor, producer, and regulator) were constructed to investigate the activation and attenuation of the LuxI/LuxR QS system in a model bacterial community. The key features of the strains are depicted in Figure 1. Each construct is under the control of a specific inducer. (i) The sensor strain consists of the gene encoding LuxR under the control of arabinose. Upon binding to OHHL, LuxR promotes transcription at luxPR_4G12T, resulting in the expression of an enhanced green fluorescent protein (EGFP). (ii) The producer strain consists of the gene encoding LuxI, which synthesises OHHL, followed by the gene encoding mCherry, both of which are under the control of isopropyl-beta-D-1-thiogalactopyranoside (IPTG). (iii) The regulator strain contains the gene aiiA encoding lactonase AiiA (with OHHL degrading ability) followed by the gene encoding blue fluorescent protein variant (EBFP2), both of which are under the control of anhydrotetracycline (AHT). The major components and plasmid structures of the three strains are provided in the supporting information (Table S1 and Figure S1). Two restriction sites (NheI and EcoRI) flank the inserts (Table S1), allowing the community to be modified to study other QS autoinducer synthases and QS quenching molecules by replacing the genetic parts. Whole plasmid sequencing results showed that the experimental strains might have 1–4 bp mutations, but no noticeable effect on the strain functions was found. Nucleotide sequence alignment results (performed using BLAST®, https://blast.ncbi.nlm.nih.gov/Blast.cgi?PAGE=MegaBlast&PROGRAM=blastn&BLAST_PROGRAMS=megaBlast&PAGE_TYPE=BlastSearch&BLAST_SPEC=blast2seq&DATABASE=n/a&QUERY=&SUBJECTS=, accessed on 23 March 2023) of the plasmids of the three strains are provided in the supplementary files.

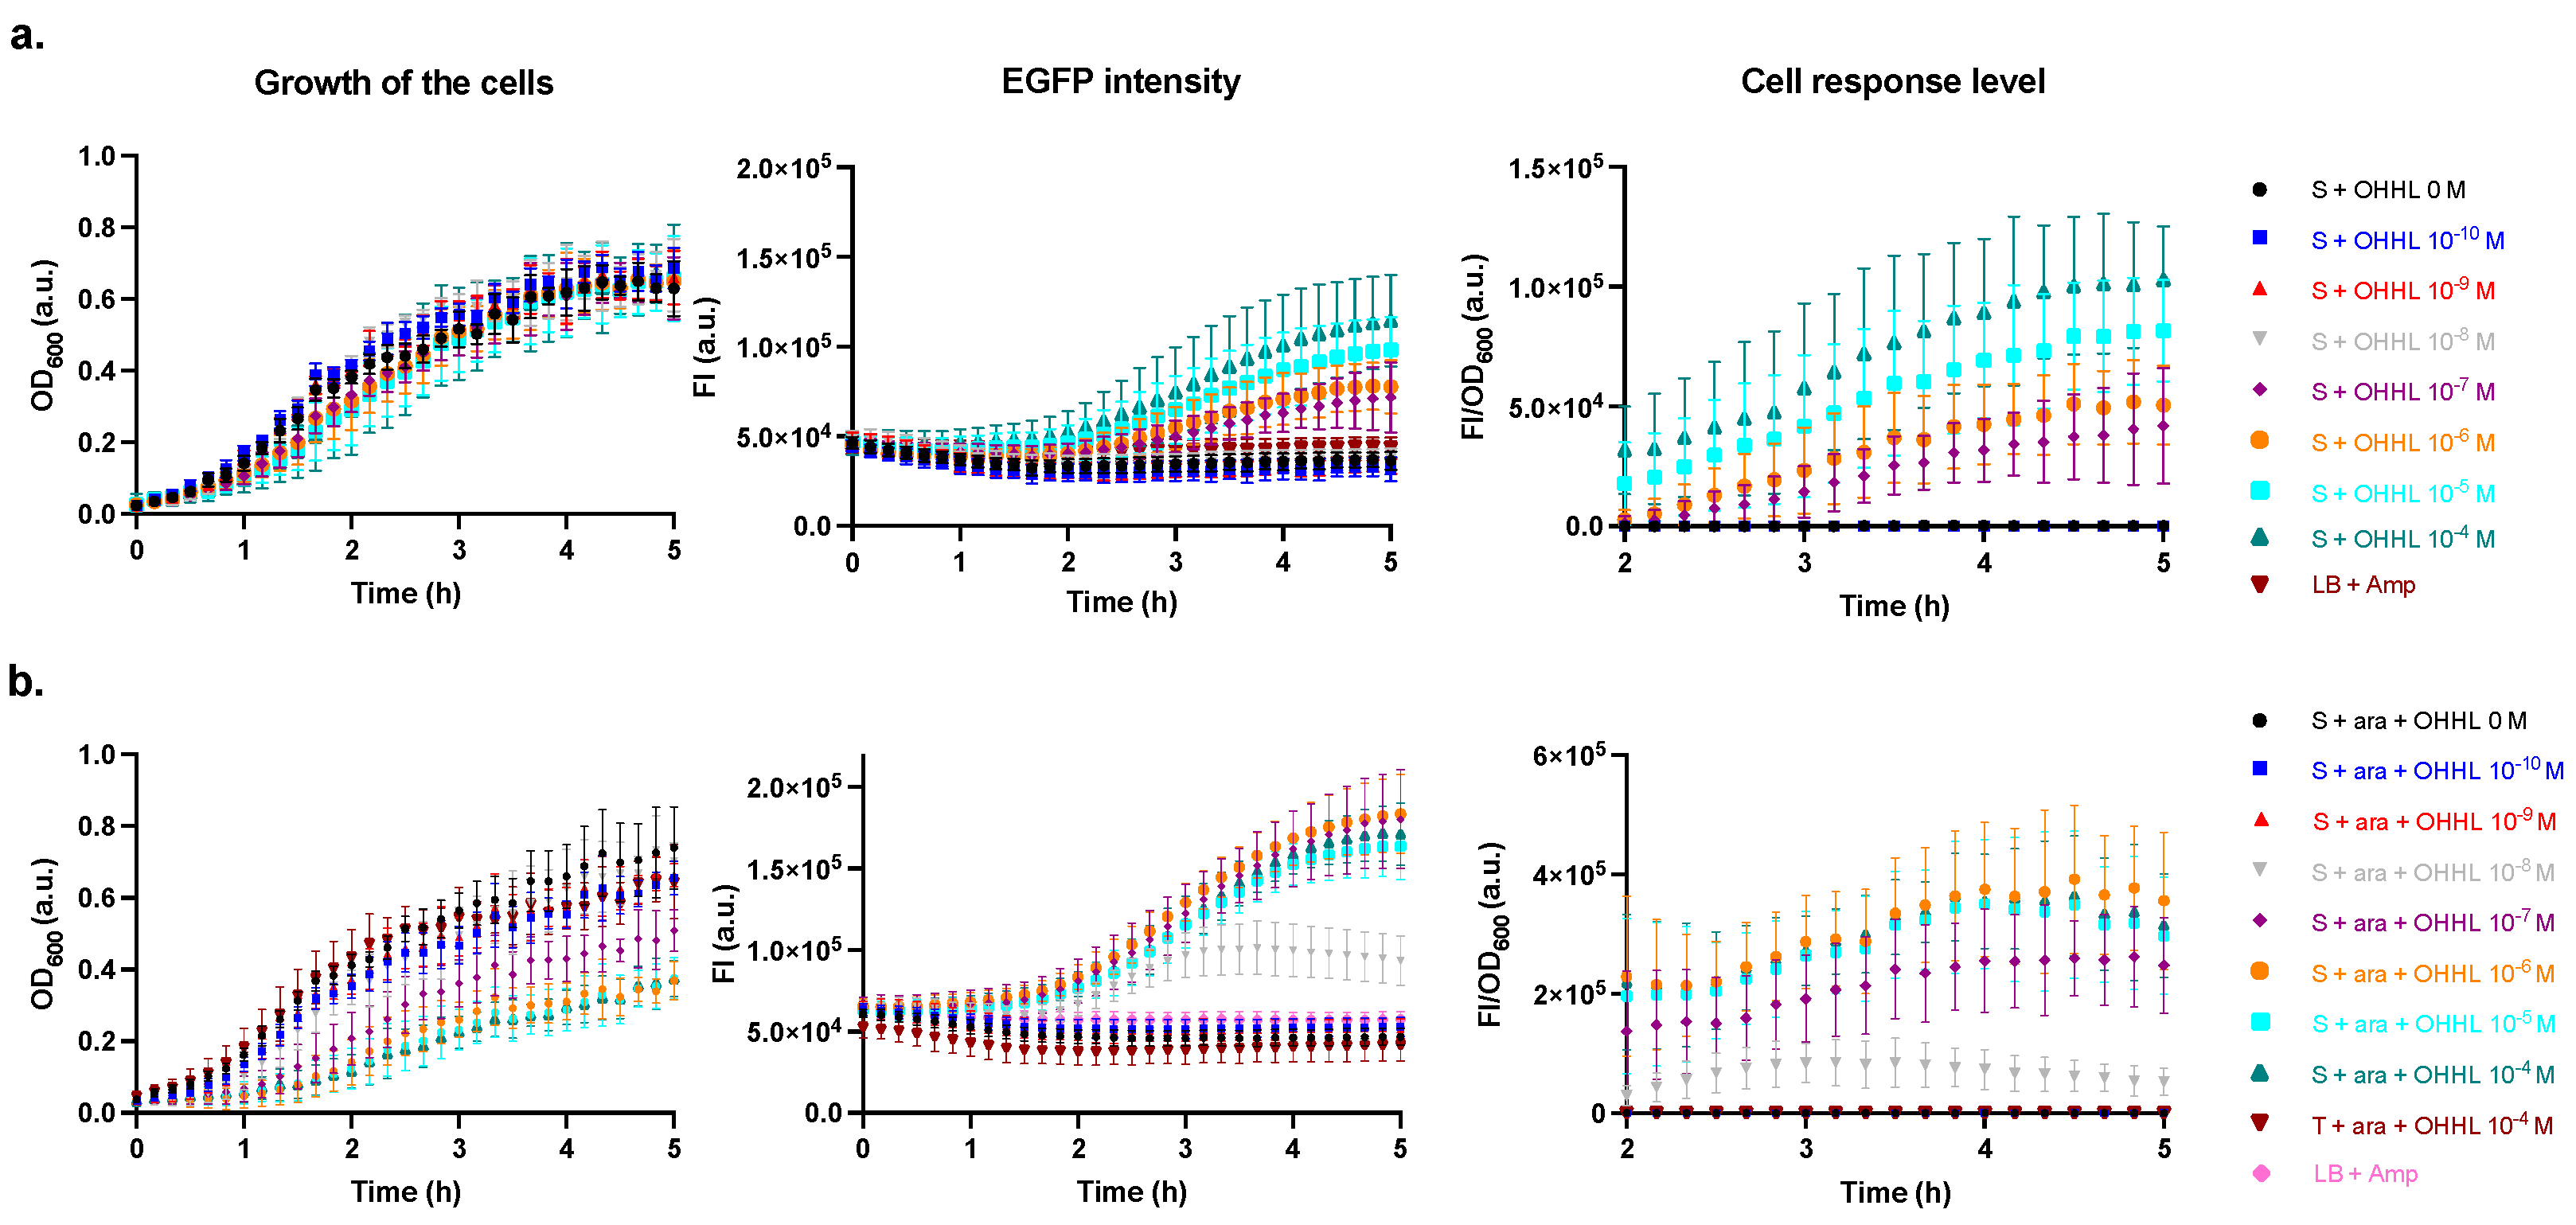
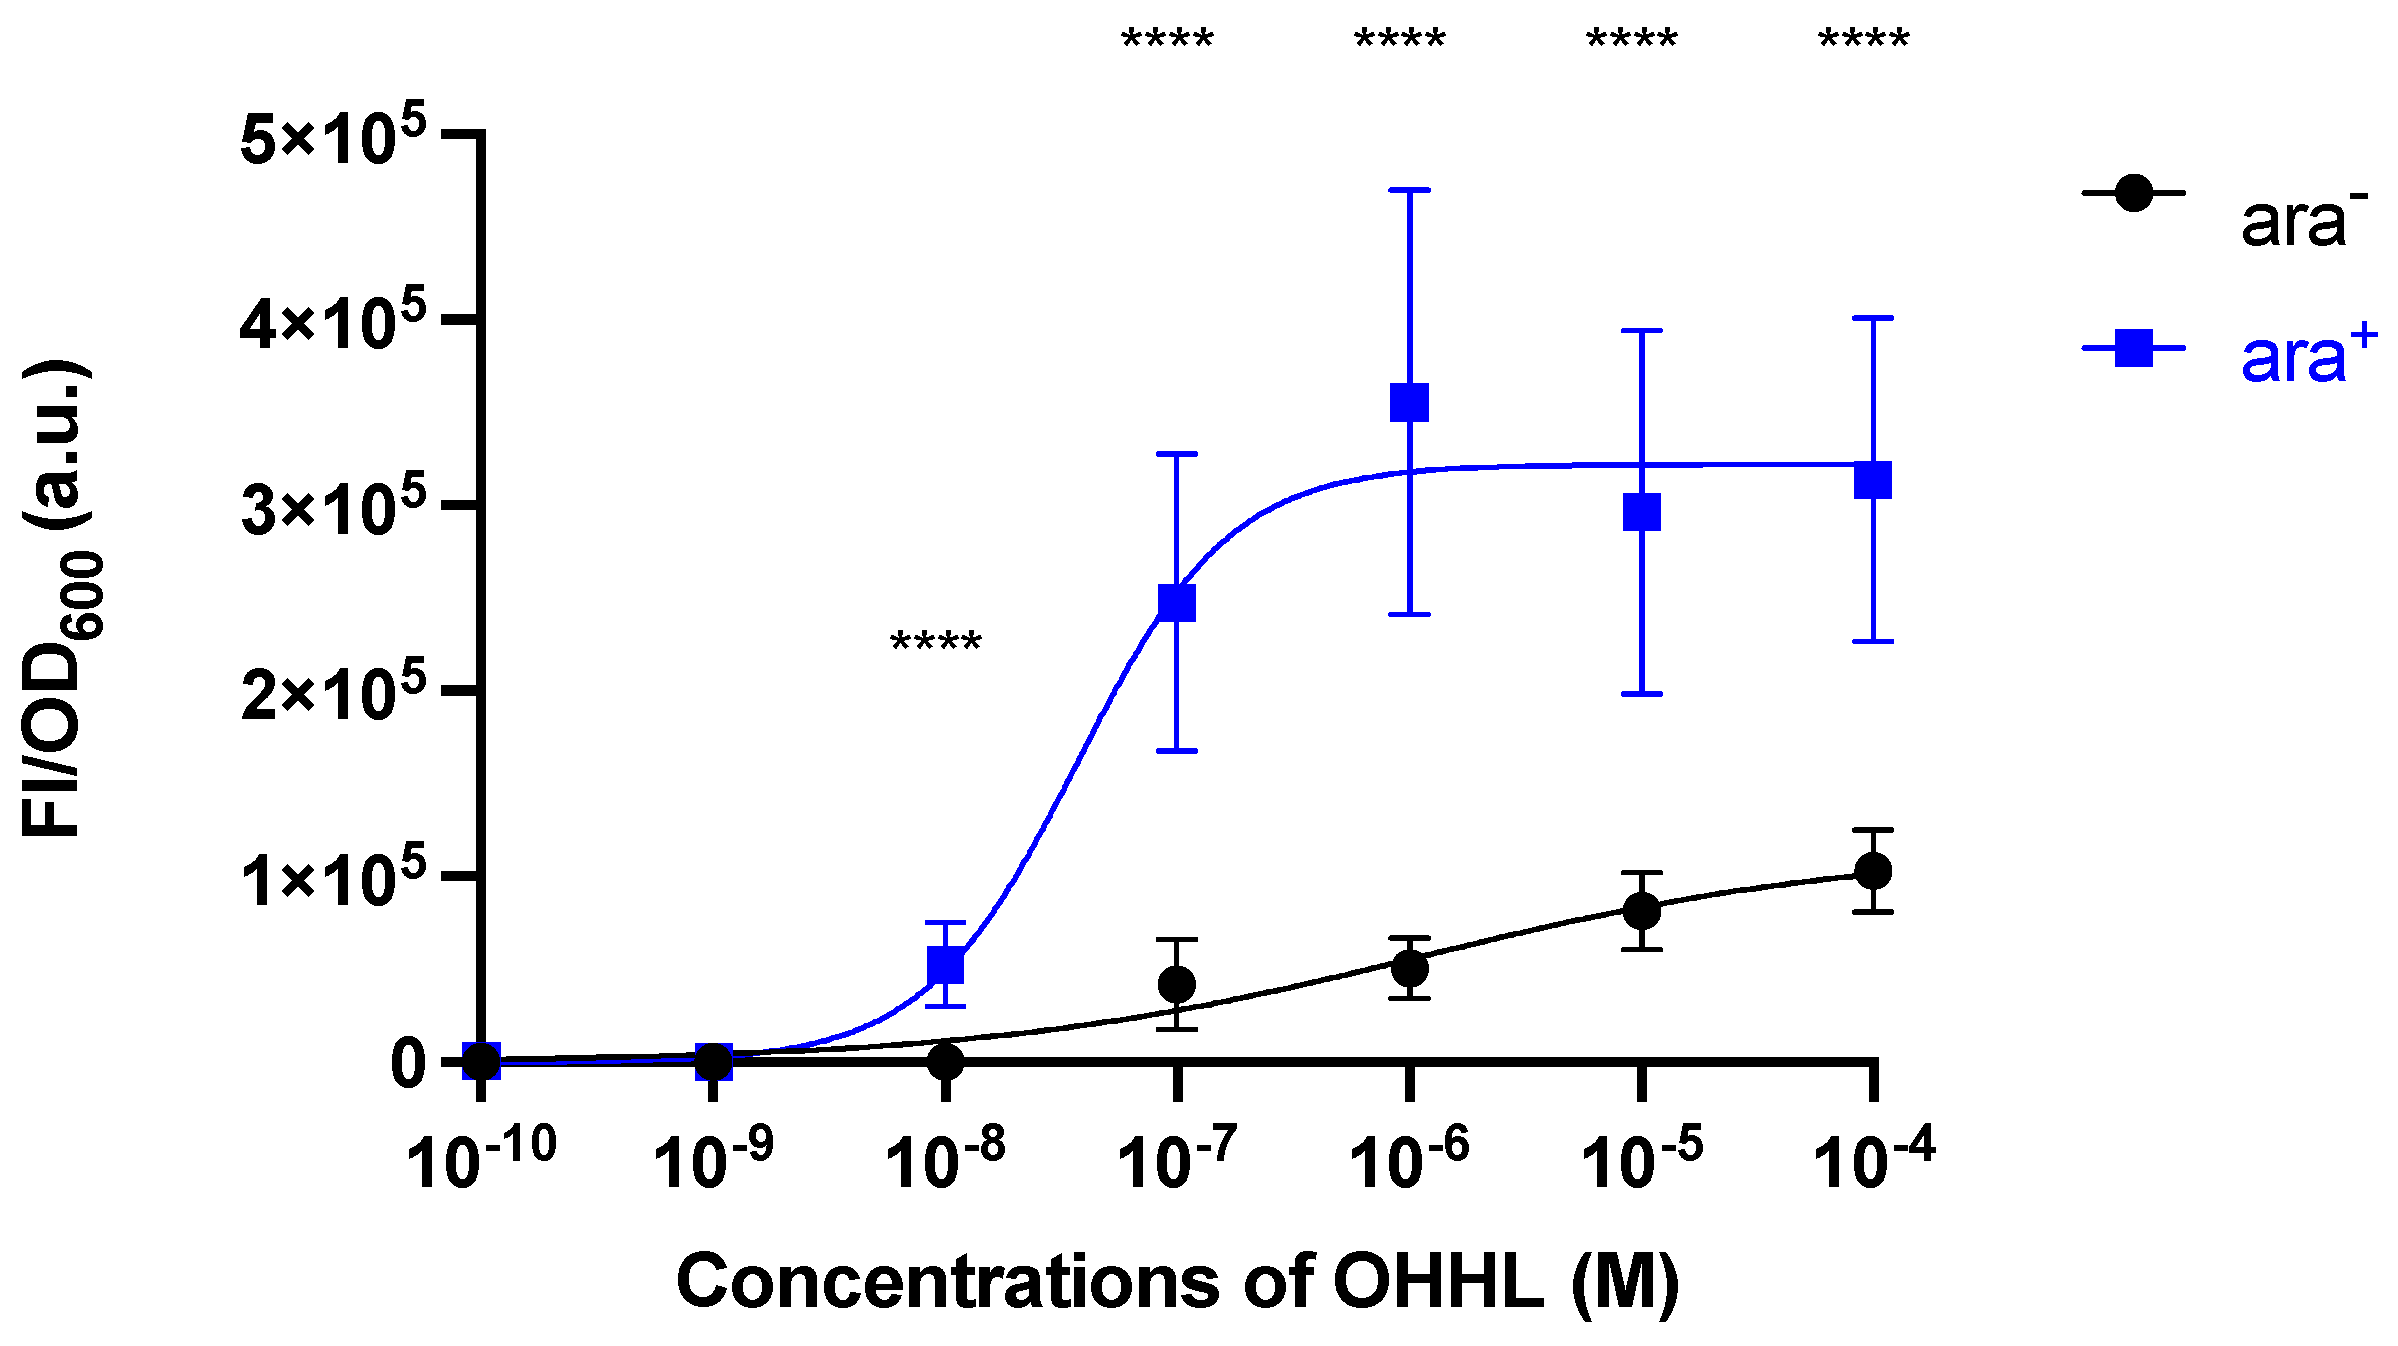
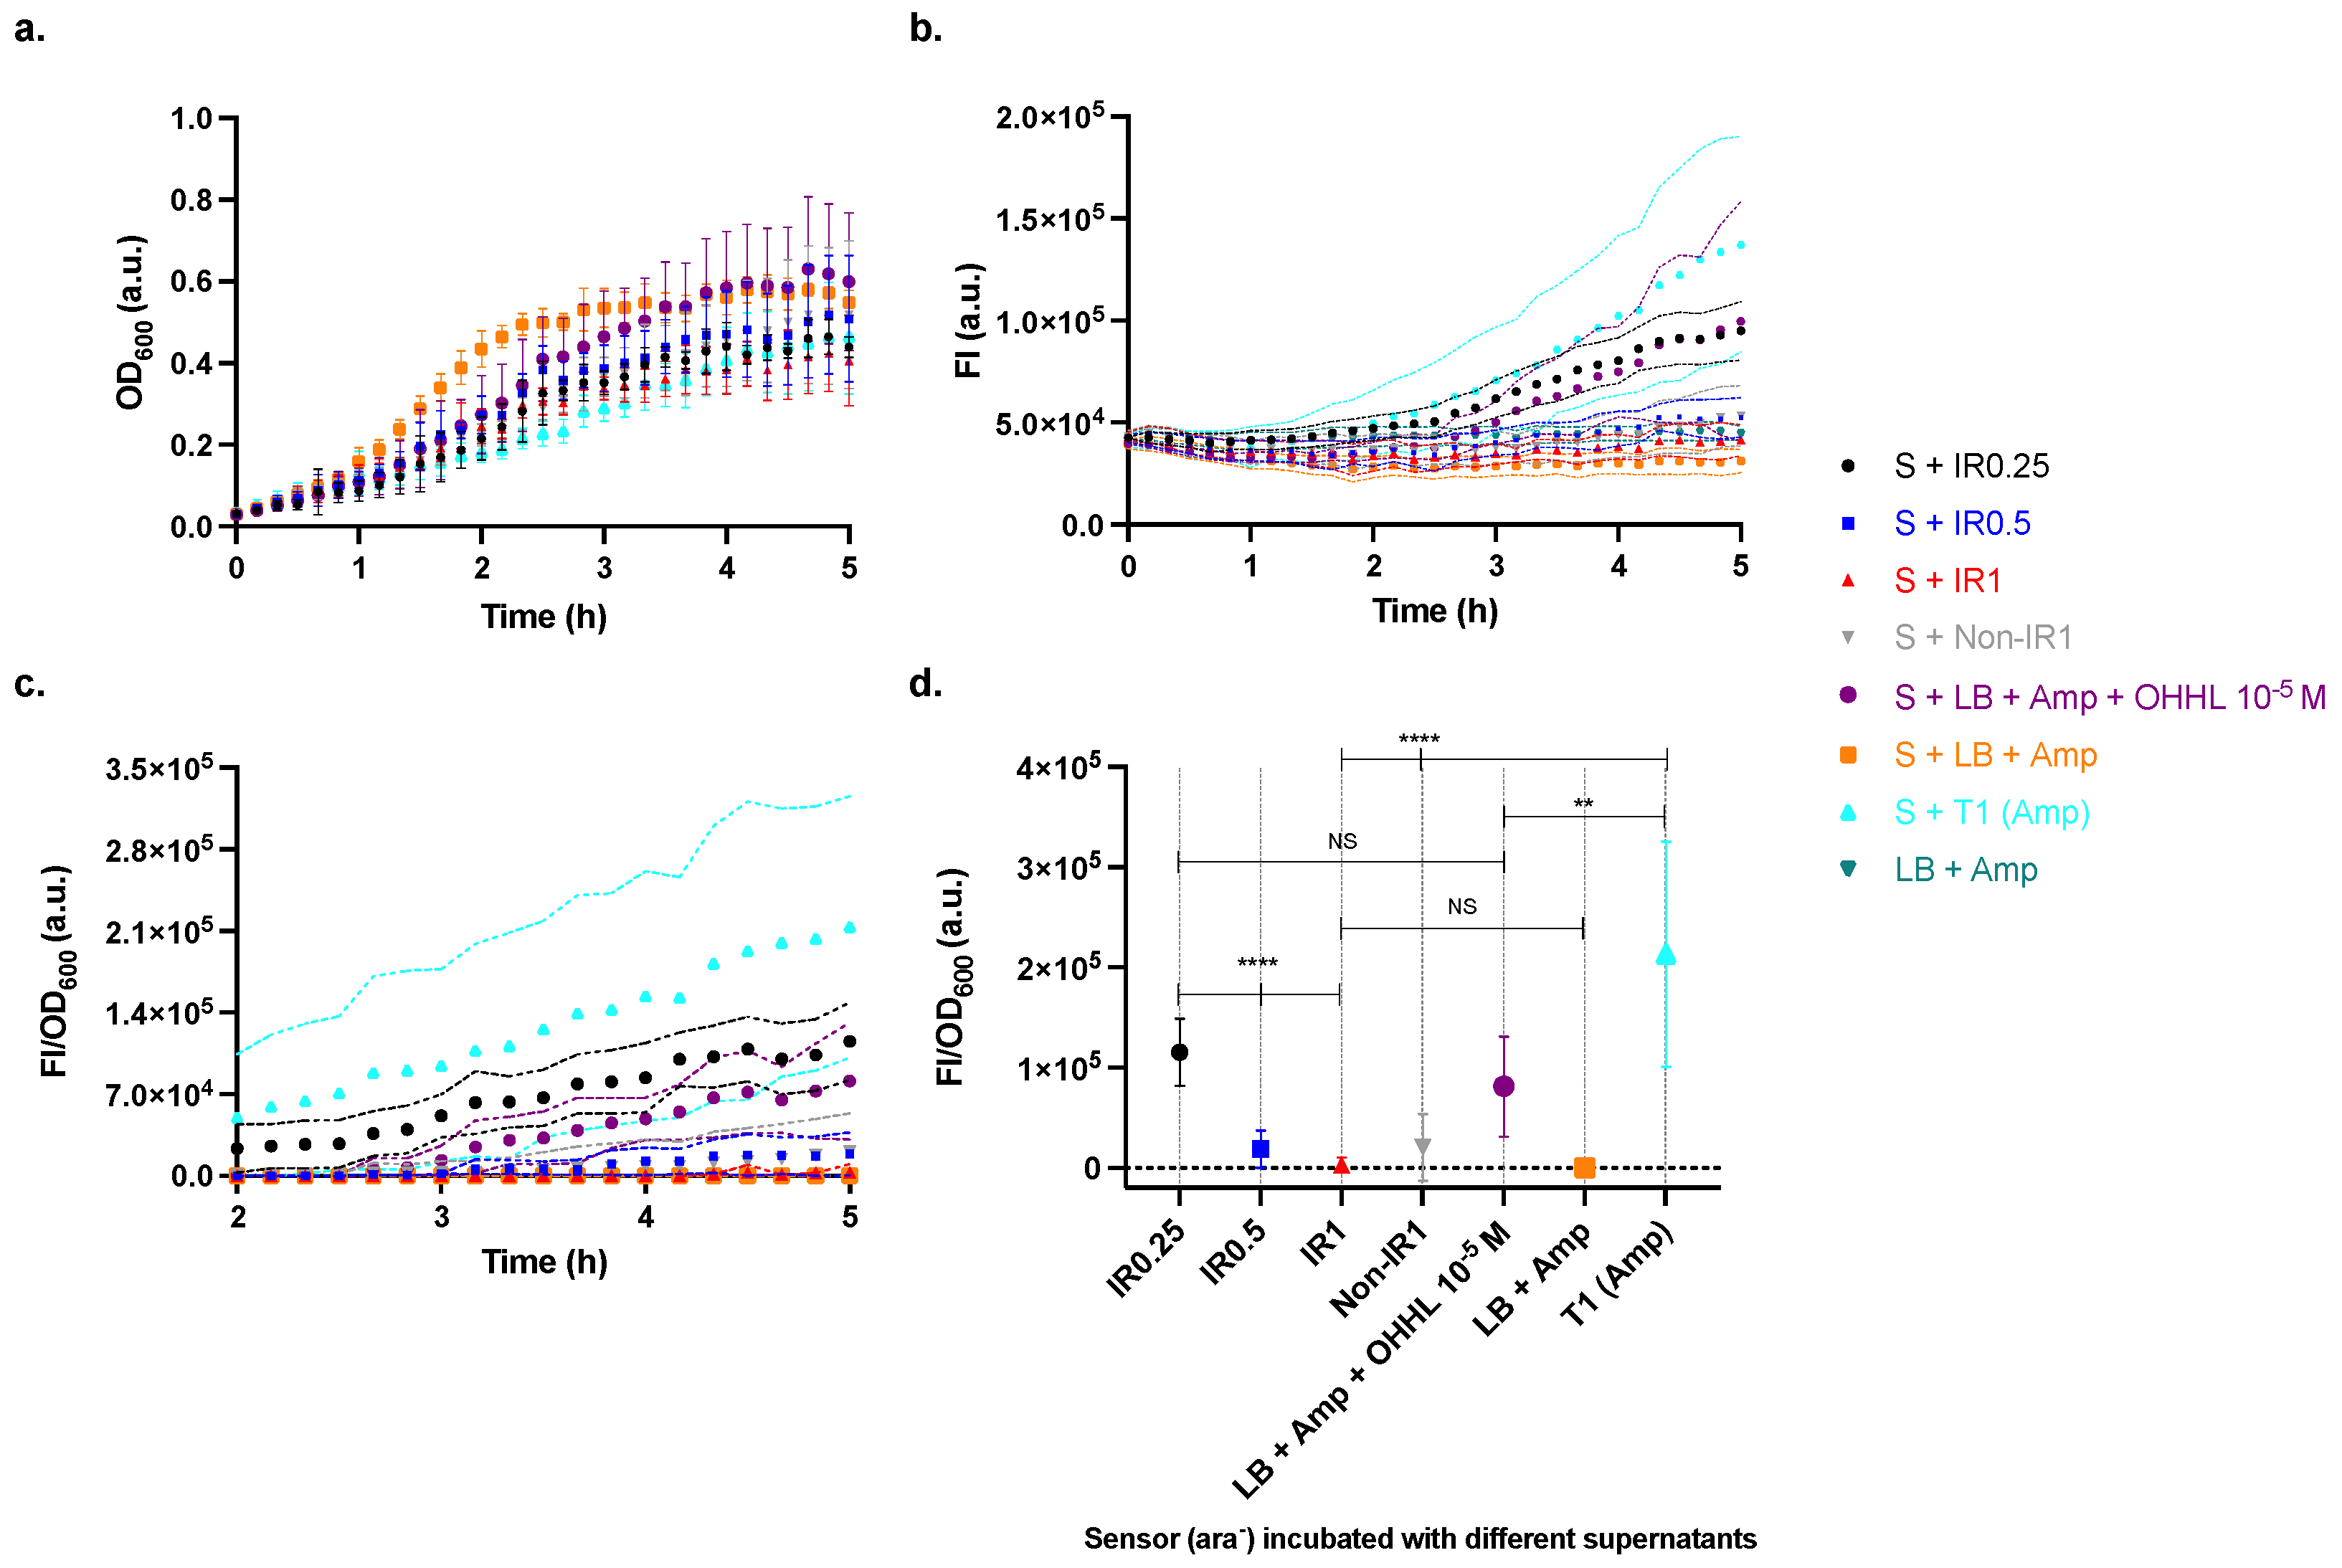
2.2. Characterisation of the Sensor Strain

The first set of experiments aimed to test the performance of the sensor stain regarding its capacity to report on OHHL concentration in the environment. To this end, we treated the sensor strain with varying concentrations of OHHL in the range from 0 to 10−4 M in the absence (ara) and the presence (ara+) of arabinose. In ara (Figure 2a), the sensor showed a concentration-dependent response when treated with OHHL concentrations greater than 10−7 M. At lower doses, the FI was indistinguishable from that of untreated cells (OHHL 0 M) and medium control (lysogeny broth (LB) supplemented with ampicillin (Amp)). In contrast, in ara+ (Figure 2b), the expected pronounced transcription of sensor promoters resulted in concomitant enhanced FI/OD600 when treated with OHHL concentrations greater than 10−8 M. The sensor detected an OHHL concentration down to 10−8 M and saturated at a dose of 10−4–10−6 M. However, with ara, the sensor did not seem to saturate even at OHHL 10−4 M and showed a clearer concentration-dependent response. It is also interesting to note that the growth in ara was less affected by the response to OHHL compared with that in ara+ (Figure 2). These findings indicate that, despite its lower response levels, the sensor in ara may be more suitable for subsequent experiments.
As shown in Figure 3, the FI/OD600 endpoint data of the sensor in ara and ara+ were also fitted to a specific binding equation with Hill slope as follows (Equation (1)) [22]:
y = V m a x x h k H i l l h + x h
where Vmax is the maximum specific binding in the same units as y , h is the Hill slope, and k H i l l is the OHHL concentration required for half-maximum binding in the same units as x . The best-fit values of the parameters are shown in Table 1. The best-fit V m a x is unstable because of the wide estimated ranges. However, it is noticeable that the sensor in ara+ showed a pronounced response to the added OHHL compared with that in ara (i.e., the concentration required for half-maximal binding was two orders of magnitude lower and the slope was approximately three-fold greater in ara+, compared to those in ara).

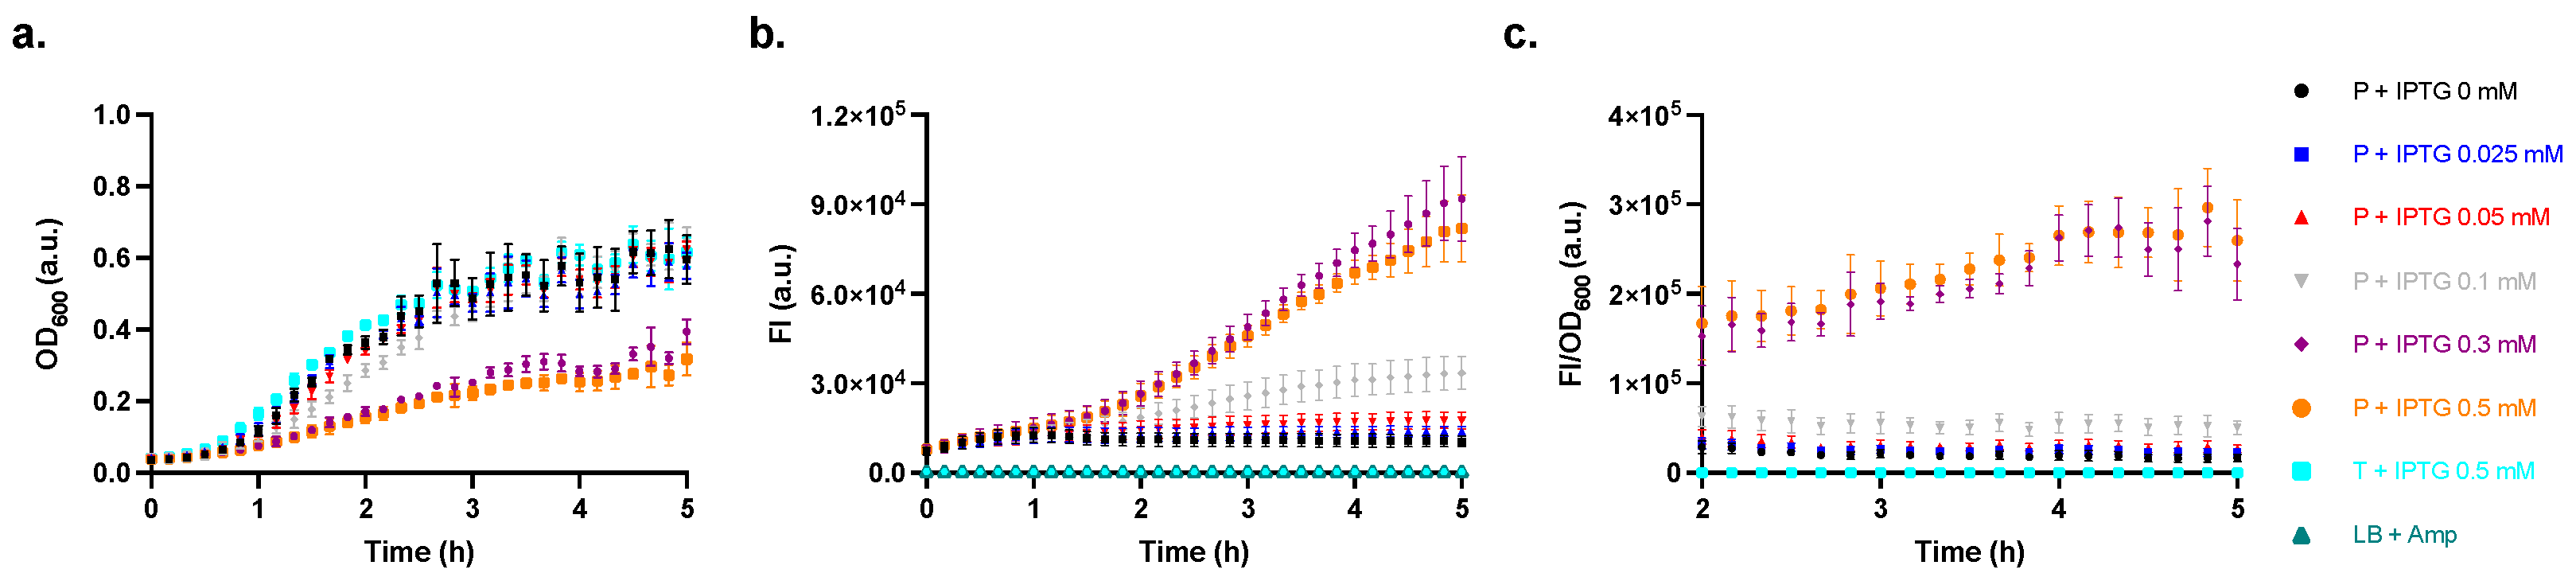
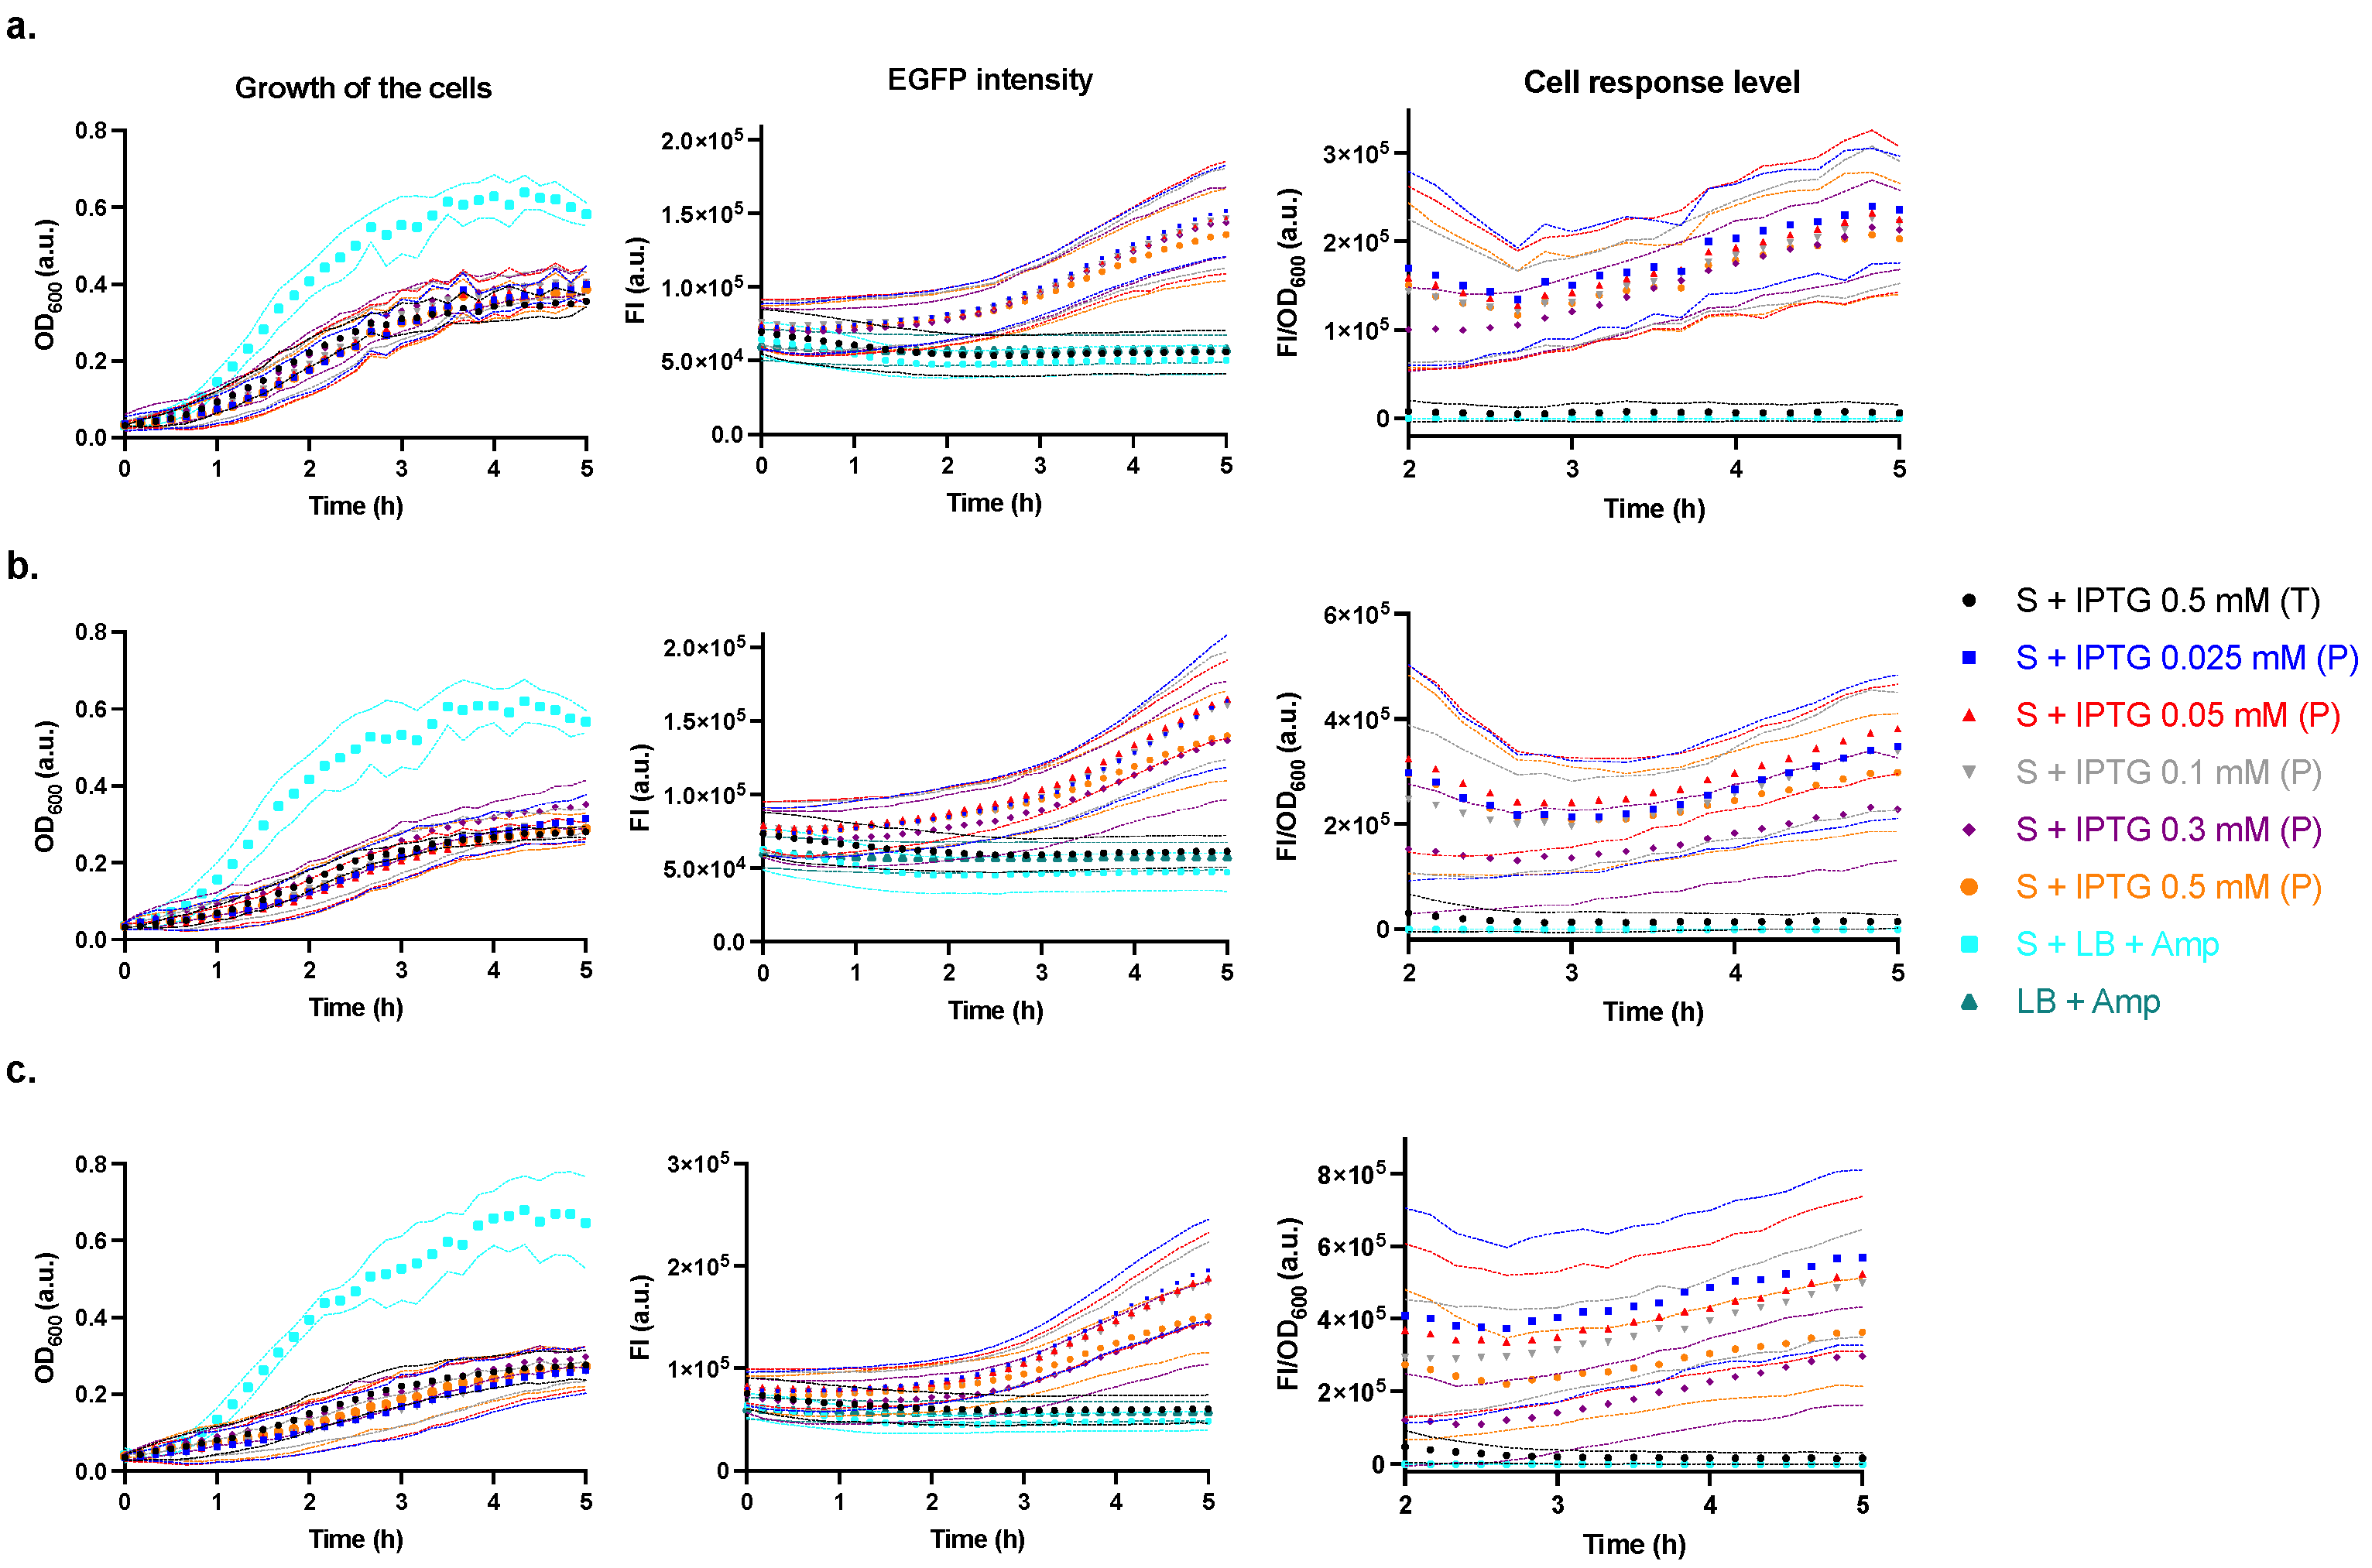
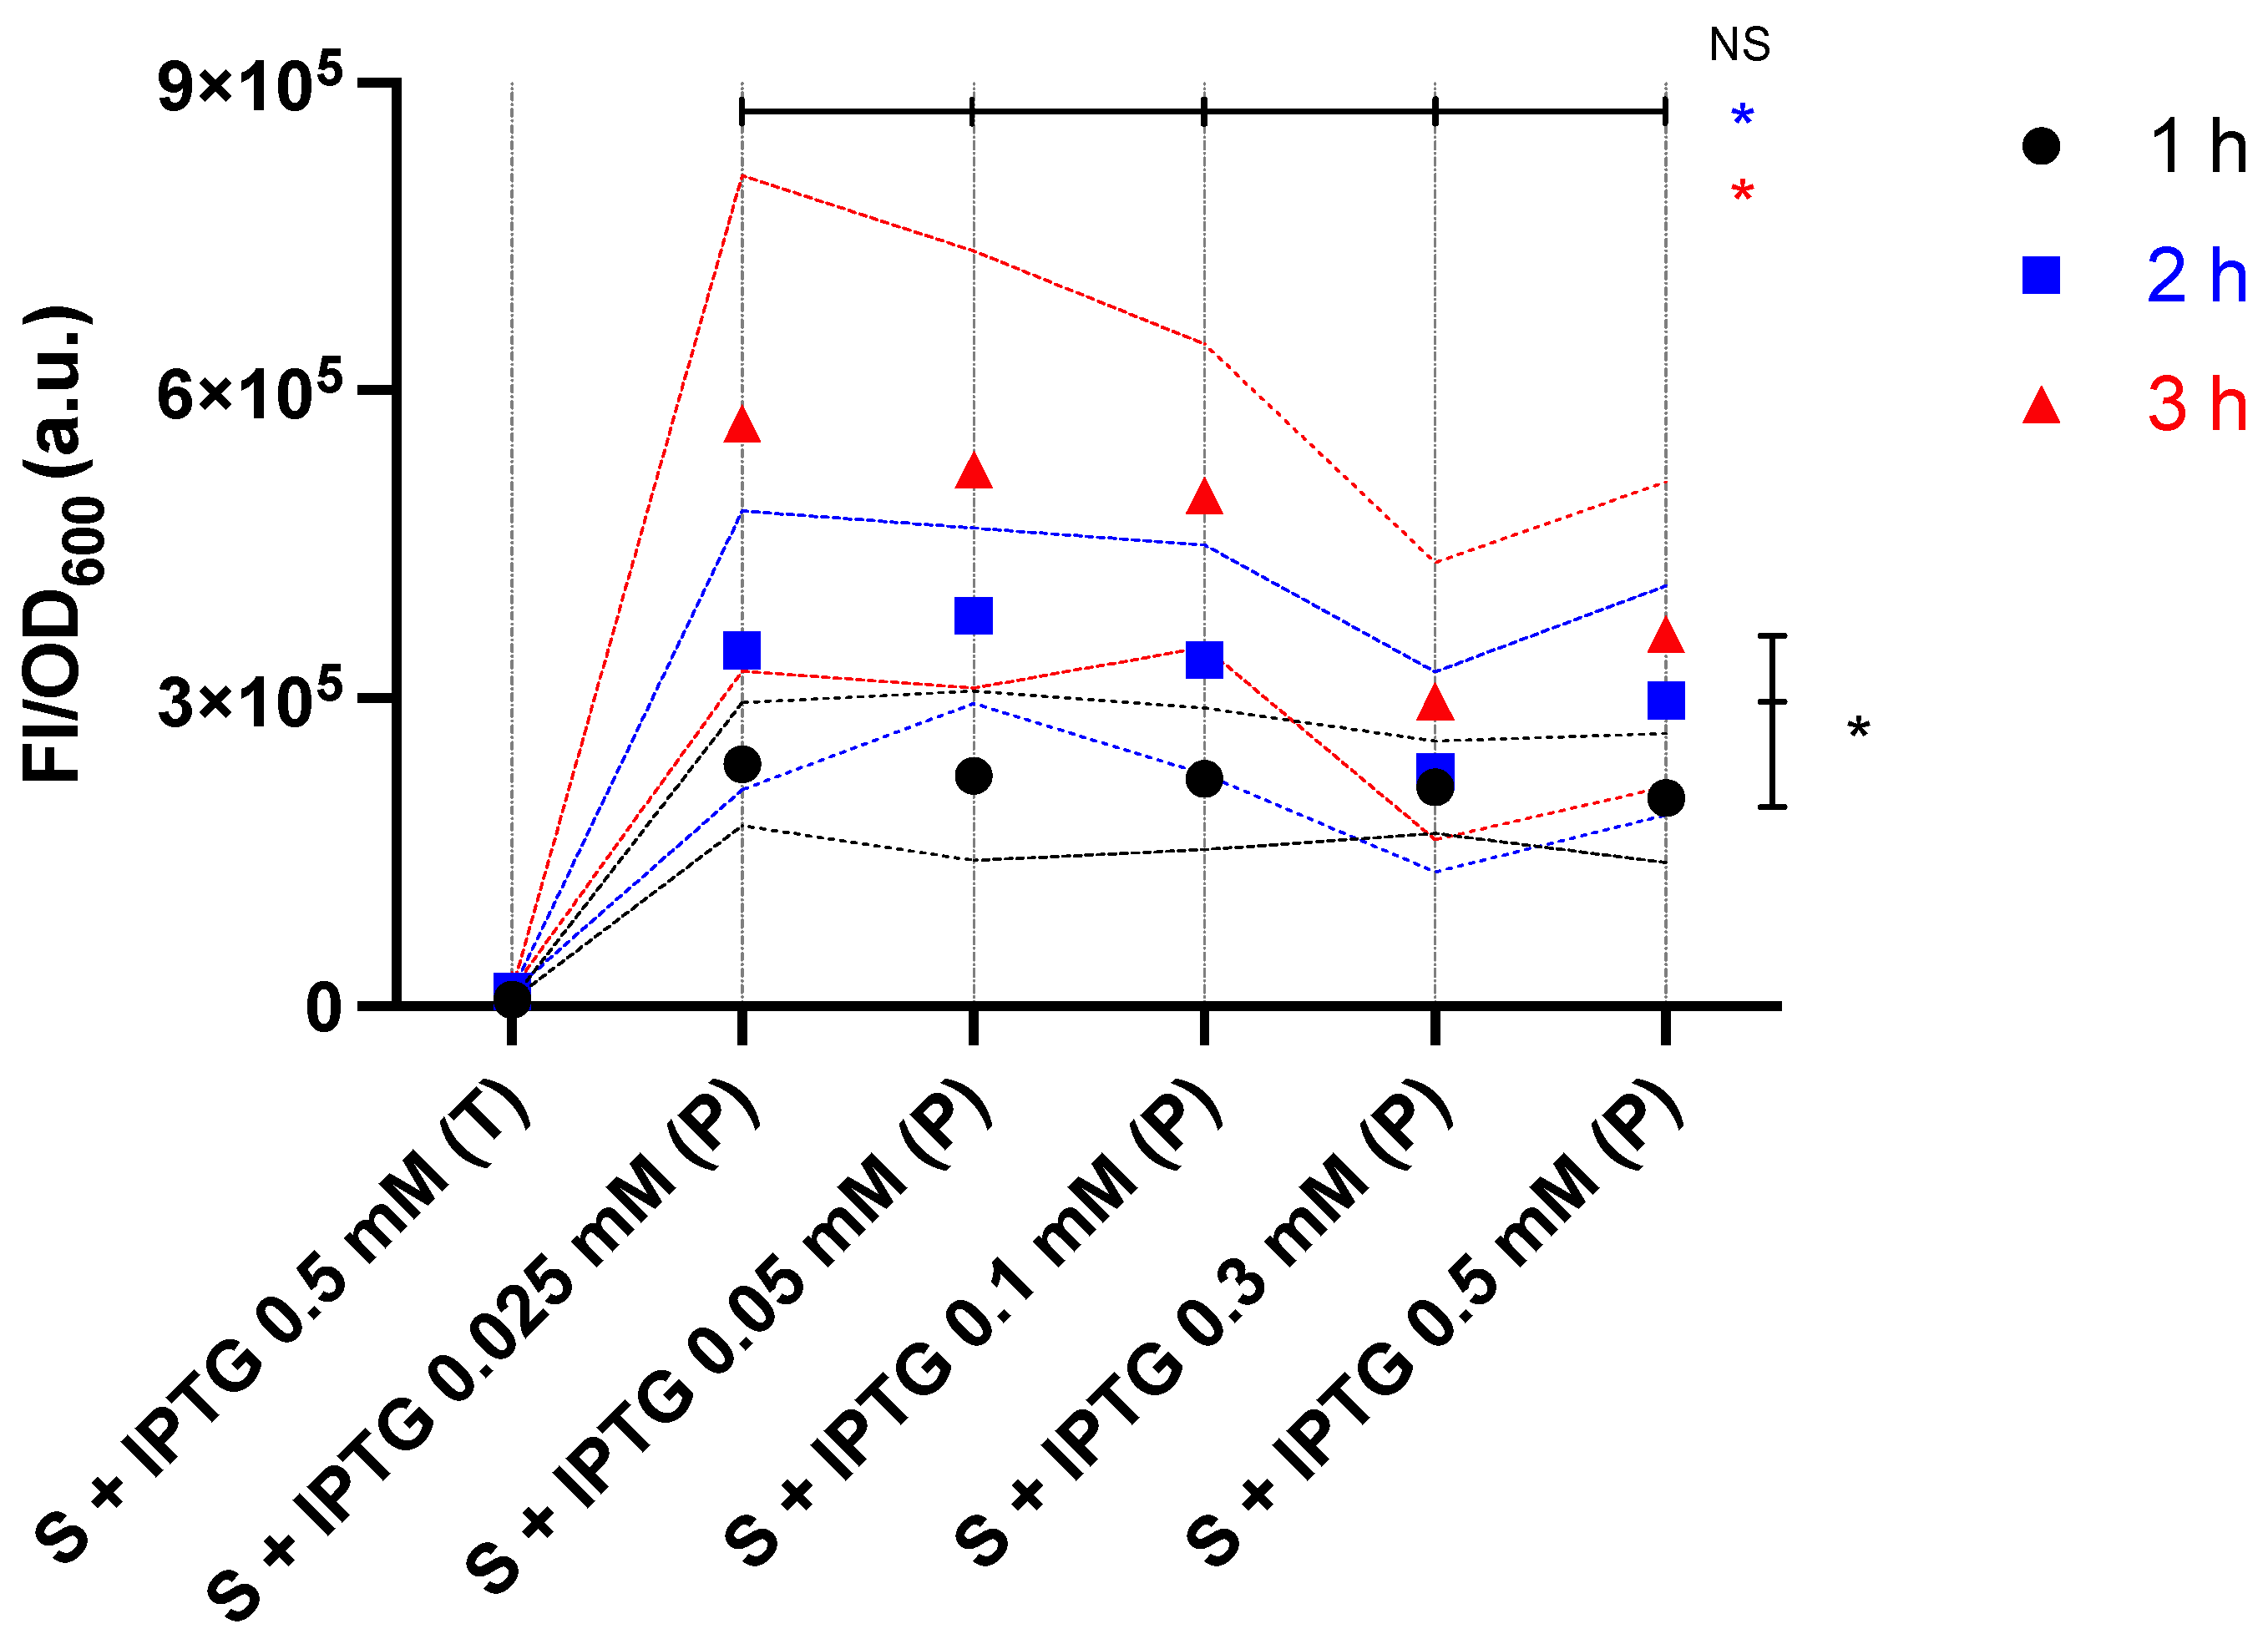
2.3. Characterisation of the Producer Strain

The next set of experiments aimed to test the performance of the producer strain regarding its capacity to produce LuxI and mCherry when induced at varying concentrations of IPTG. In Figure 4, the producer’s FI and the cell response level (FI/OD600) induced by even the lowest concentration of IPTG 0.025 mM were higher compared to those of the host Tuner (DE3) strain induced by IPTG 0.5 mM. The FI and cell response levels increased when the cultures were induced by IPTG 0.05 and 0.1 mM and sharply increased when the cultures were induced by IPTG 0.3 and 0.5 mM, albeit displaying compromised growth. The differences in FI were less distinguishable at earlier time points but became more noticeable over time.
When testing the activating ability of the producer, the supernatants of IPTG-producer cultures after 1 h (Figure 5a), 2 h (Figure 5b), and 3 h (Figure 5c) inductions were used to activate the sensor (ara). For all induction times, the growth of the sensor incubated with the supernatants of cultures was similar, however, lower than that of the sensor incubated with medium control (LB + Amp) (Figure 5, 1st column). The FI/OD600 of the sensor incubated with supernatant of host Tuner (DE3) culture and medium control were similar and noticeably lower than those of the sensor incubated with producer supernatants. Furthermore, even when induced with IPTG for only 1 h, all producer supernatants showed approximately two-fold greater activating ability than OHHL 10−4 M (cf. Figure 3 and Figure 6), indicating the producer strain has good activating efficiency. However, even in ara, the strong activating ability of the producer may lead to sensor saturation.

2.4. Characterisation of the Regulator Strain

The regulator strain features the aiiA gene that encodes OHHL-degrading enzyme AiiA. Initially, this strain was tested for its capacity to express EBFP2 using a microplate reader. However, the FI reading of the regulator strain was lower than that of the medium control. This may result from the high background noise of the LB medium and the cover film that impaired the fluorescent signal. Considering this, the FI was determined at λex = 367 nm using a quartz cuvette and a more sensitive FluoroMax-4 (HORIBA) fluorometer. The emission spectra (λem = 400–500 nm) of overnight cultures (initial OD600~0.05 and 16 h incubation) were measured (Figure S2). In the emission spectrum region of the highest FI readings, namely λem = 440–460 nm, even in the absence of AHT, the FI and the cell response level (FI/OD600) of the regulator strain were significantly higher than those of the host Tuner (DE3) strain, while those of AHT-induced regulator culture was significantly higher compared to non-induced regulator culture (**** p < 0.0001). This suggests the intrinsic leakage of the regulator plasmid.
When testing the function of the regulator strain, the overnight cultures of Tuner (DE3) and AHT-induced and non-induced regulator were pelleted via centrifugation, followed by resuspension in LB supplemented with OHHL at 10−5 M. Suspensions were incubated for 1 h followed by further centrifugation. The supernatants were then incubated with the sensor (ara) for 5 h. The sensor incubated with cell-treated supernatants showed lower growth than sensors incubated with non-cell-treated supernatants (Figure 7a). The sensor incubated with Tuner (DE3) (initial OD600~1) treated OHHL 10−5 M supernatant showed a significantly higher response than the sensor incubated with non-treated OHHL 10−5 M (Figure 7 cf. cyan and purple) (** p < 0.01), indicating that Tuner (DE3) strain may produce molecule(s) that can activate the sensor. The regulator was able to degrade OHHL even in the absence of AHT due to the intrinsic leakage of the pLtetO-1 promoter, though the effect was pronounced in the presence of AHT (Figure 7 cf. red, grey, and cyan) (**** p < 0.0001). In addition, the induced regulator with higher initial OD600 values showed higher degrading abilities (Figure 7 cf. black, blue, and red) (**** p < 0.0001).

3. Discussion

This work has produced a tuneable and trackable model bacterial community based on the LuxI/LuxR QS system, containing OHHL sensing, production, and degradation functions genetically engineered in three E. coli strains.
Biosensors are fundamental tools used to study AHL QS systems [18] and QS inhibitors [23]. The sensor is also the key strain to our study. It employs the luxPR_4G12T promoter [24], improved from the original lux promoter displaying lower levels of leaky expression and, therefore, more tightly controlled. Adding arabinose (ara+) induces the araBAD promoter to express LuxR in the sensor strain, which subsequently activates the luxPR_4G12T promoter upon binding to OHHL. Consequently, the downstream gene encoding EGFP is expressed, and the observed FI is, therefore, dependent on OHHL concentrations in the range 10−8–10−6 M. However, the cellular response became saturated at OHHL 10−6 M and beyond with no further concentration dependence (Figure 2b and Figure 3). In addition, in Figure 2, the expression controlled via luxPR_4G12T showed inactivity during the early stages of growth and became active during the exponential growth phase, which is similar to the original lux promoter from Vibrio fischeri [11,25]. A similar E. coli sensor employing the lux2 promoter also showed to be inactive at early stages when using it to detect OHHL [26]. For the whole-cell sensor, this early inactivity may be caused by several factors, such as low cell density, and the time required for OHHL to diffuse into the cells.
In the absence of arabinose (ara), the sensor strain still displayed an OHHL concentration-dependent response, which may be due to the intrinsic leakage of the araBAD promoter leading to a basal expression of LuxR. In contrast with ara+, in ara, the fluorescence response displayed a more attenuated OHHL concentration-dependent intensity but a wider detection range (10−7–10−4 M or greater) (Figure 3). In addition, the growth of the sensor (ara) was less affected by the OHHL concentration (Figure 2). These findings suggest that the sensor in ara may be more suitable for detecting OHHL concentration over a wider range of concentrations without reaching saturation and, therefore, was used in subsequent experiments. Notwithstanding this, it should be noted that the sensor in ara+ was more sensitive to the lower OHHL concentration 10−8 M. One reason for this may be the faster expression of LuxR in ara+, which maximised the binding of OHHL to LuxR before OHHL degradation. A previous study showed that OHHL is unstable and can be non-enzymatically degraded at a high temperature and under aerobic conditions in a complex medium [27]. However, at high expression levels of LuxR in ara+, there are no significant differences in the EGFP intensity when concentrations of OHHL were ≥10−7 M nor in cell response levels when the concentrations of OHHL were ≥10−6 M (Figure 2b). This may result from the binding saturation of OHHL-LuxR, as it was suggested in a previous study that the effective equilibrium constant for the formation of OHHL-LuxR is approximately 10−7 M [8]. The sensor (ara+), therefore, may be better suited to detect lower OHHL concentrations than the sensor (ara). These findings suggest that the optional addition of arabinose may optimise the functionality of the sensor strain depending on the induction condition. Interestingly, Steindler and Venturi [18] reviewed various bacterial biosensors designed to detect different AHLs, of which plasmids based on the original lux promoter showed the ability to respond to other AHLs besides OHHL. This suggests that our sensor may also be able to measure other AHLs.
The producer plasmid employs the T7 promoter to control the bicistronic expression of luxI and mCherry. Therefore, the FI of the mCherry is expected to reflect the relative yield of OHHL synthase LuxI. Additionally, using the Tuner (DE3) strain, a lacZY deletion mutant of E. coli BL21 carrying the phage λDE3, as the host strain, IPTG concentration-dependent expression of the T7 promoter was achieved by allowing IPTG to enter the cells only via passive diffusion. However, a previous study found that the expression was not always positively correlated with IPTG concentration [28]. In our case, as seen in Figure 4, the FI of the producer culture induced by 0.3 mM IPTG was greater compared to that induced by 0.5 mM IPTG, which may be due to the growth burden imposed by a higher cell response level (FI/OD600) at a higher IPTG concentration. A higher induction concentration also did not bring a higher activating ability (Figure 5 and Figure 6). This may be caused by the sensor saturation in ara. On the other hand, a previous study found that BL21 StarTM (DE3) E. coli cells subjected to increasing incubation temperature during 6 h (15, 25, and 37 °C) decreased the amount of the protein expressed from the IPTG-induced T7 promoter [29]. This finding suggests that the expression of the producer strain may not be fully fledged at 37 °C used in our experiments. Nevertheless, this is unlikely to cause a major problem as all producer supernatants showed strong QS activating abilities even one-hour-incubated supernatants showed approximately two-fold greater activating ability than OHHL 10−4 M (cf. Figure 3 and Figure 6). Ongoing studies in our lab are geared to track the activating ability of the producer on the sensor starting from early growth stages, using a microfluidic chip platform for cell phenotype profiling adapted from previous studies [30] to enable co-culture and time-lapse imaging of the strains in agarose hydrogel microbeads.
Similarly to the producer strain, the LtetO-1 promoter of the regulator strain controls the bicistronic expression of aiiA and ebfp2 upon induction of anhydrotetracycline (AHT). Although currently, it is not possible to measure its FI over time, the regulator showed the ability to attenuate the QS response of the sensor (ara) by degrading OHHL (Figure 7). Interestingly, the sensor incubated with host Tuner (DE3)-treated OHHL 10−5 M supernatant showed a higher response than the sensor incubated with untreated OHHL 10−5 M supernatant (Figure 7 cf. cyan and purple). This result revealed that the Tuner (DE3) strain may produce molecule(s) that activate the sensor, therefore affecting the sensor accuracy. E. coli is not known to produce AHLs [18,31]. However, a previous study found that diketopiperazines produced via Pseudomonas aeruginosa were able to activate an E. coli biosensor employing the Lux/LuxR QS system [32]. At this stage, we can only speculate that there were compounds, yet to be identified, in the supernatant of Tuner (DE3) strain treated with OHHL 10−5 M that led to an enhanced sensor response. This result may also explain why the sensor incubated with IR0.25 (i.e., AHT-induced regulator with OD600~0.25)-treated OHHL 10−5 M supernatant showed a somewhat greater (though non-significant) response level than the sensor incubated with untreated OHHL 10−5 M supernatant (Figure 7 cf. black and purple). This suggests that, under the current experimental setup, an OD600 greater than 0.25 is required to observe the QS attenuation ability of the regulator.
The engineered community we describe has some limitations. Firstly, it should be noted that the measured FI of the fluorescent reporter proteins (mCherry and EGFP) can only be considered as indirect indicators of the relative OHHL concentration produced via the producer strain and of the environmental OHHL concentration reported via the sensor strain, respectively. This does not account for the far more complex events involved in mounting the components of the QS response, such as the diffusion and binding of the cognate OHHL to the LuxR receptor, nor its chemical or enzymatic degradation. Secondly, the FI reading was highly affected by the medium background. A previous study found that fluorescent reporters were subject to background noise caused by autofluorescence from cells and LB medium. In particular, the green, fluorescent signal was more severely affected than the red one [26]. Our results were consistent with this finding. Moreover, the noise was much higher when measuring the blue signal of the regulator strain than the green one of the sensor strain. Background noise was also the main reason for indistinguishable FI of cultures and medium control at earlier time points. Therefore, the corresponding FI/OD600 values were zeroed when plotting. Thirdly, due to the intrinsic leakage of the promoters, in addition to the LB medium control, induced host strain and non-induced function strain are required as controls. Finally, the fact that this study was conducted in the planktonic state and not in confined niches such as those that operate in real-life natural bacterial communities is an oversimplification of the complex phenomena at play.
The plasmid sequencing data showed there may be 1–4 bp spontaneous mutations that have occurred in the designed plasmids. Among the mutations, 1 bp deletion occurring at intrinsic terminators L3S2P21 and ECK120033737 and 1 bp deletion occurring at the pBR322 origin were related to the strain functions. The intrinsic terminators L3S2P21 lost 1 bp in the hairpin area, and ECK120033737 lost 1 bp in the U-tract area. These two terminators were used in combination following the fluorescent protein genes to ensure termination. For the sensor and producer strains, only one terminator was mutated. Therefore, read-through was unlikely to occur. For the regulator strain, both terminators were mutated. Given that the genes encoding AiiA and EBFP2 upstream of the terminators were successfully expressed, these mutations were unlikely to have had a large effect on termination. This suggestion may be in line with a previous study that found 1 bp deletion of the terminator (λtI) did not always abolish but reduced the termination efficiency to varying degrees [33]. Furthermore, these two terminators were found mutated in two different strains, respectively, while the deletions were located at the same loci. This suggests these gene loci are more prone to mutate, which is also consistent with the findings that spontaneous deletion frequently occurs in short, direct repeats [34,35]. Similarly, deletion at pBR322 origin was also at the location of short, direct repeats. However, this strain showed reasonable functionality. Therefore, this mutation is unlikely to have a noticeable effect on function. The sequence alignment results of the plasmids of the three strains are provided in the supplementary files.
It is feasible that future studies could include the optimisation of the use of producer and regulator strains by exploring their inducer concentration-dependent expression [28,36] at different cell densities. In ongoing studies in our lab, we are addressing co-culturing and imaging the sensor and producer strains on microfluid chips and may further supplement LB with QS inhibitors or include the regulator strain in niches. On the other hand, all designed plasmids’ inserts are flanked by restriction sites. It would be straightforward to modify the community to investigate other QS signal synthases and quenching enzymes or other QS systems by replacing the genetic parts. The strains may also help validate the in silico expression prediction of the inducible promoters used [37]. The community also provides a reconfigurable platform for experimental data collection and the validation of QS mathematical models. Finally, the developed QS consortium might be used in future studies to screen QS inhibitors.

4. Materials and Methods

4.1. Bacterial Strains and Plasmids

E. coli Tuner (DE3) was purchased from Merck. Plasmid pBAD24 cells were purchased from ATCC. Plasmid pET-21 (+) and the DNA inserts were from Twist Bioscience and were optimised using the Twist Bioscience codon optimisation tool. The gene parts luxR (BBa_C0062), luxPR_4G12T (BBa_K3205005), aiiA (BBa_C0160), terminator rrnB T1 (BBa_B0010), and a strong ribosome binding site (BBa_K3288007) that was modified at the ribosome binding sites were all obtained from iGEM Parts (parts.igem.org, accessed on 10 May 2021). The other terminators used were characterised by Chen et al. [38]. The tetR gene under constitutive expression from promoter PN25 [39] was derived from plasmid pZH509, which was a gift from Zach Hensel (Addgene plasmid # 102664; http://n2t.net/addgene:102664, accessed on 21 July 2021; RRID: Addgene_102664 [40]. All plasmids used (pBAD24, pET-21(+), and pZH509) have the ampR gene that confers ampicillin resistance. The genes encode EGFP (GenBank: U55761.1) [41], LuxI (GenBank: M19039.1) [42], mCherry (GenBank: AY678264.1) [43], and EBFP2 (GenBank: EF517318.1) [44] were all obtained from NCBI (https://www.ncbi.nlm.nih.gov/, accessed on 10 May 2021). The major components of the three strains are provided in the supporting information (Table S1 and Figure S1).

4.2. Preparation of the Strains and Overnight Cultures

Plasmids and synthesised DNA fragments were incubated with NheI-HF and EcoRI-HF (New England Biolabs, Ipswich, MA, USA). Digest products were separated using a DNA cleanup kit (New England Biolabs, Ipswich, MA, USA) or separated on an agarose gel (Cambridge Reagents, Barton-upon-Humber, UK) and purified using a gel extraction kit (Qiagen, Hilden, Germany). Digested plasmids and corresponding insert fragments were ligated using the LigaFast Rapid DNA Ligation System (Promega, Madison, WI, USA). The ligation products were then introduced via the chemical transformation to E. coli Tuner (DE3) cells, which were subsequently plated on LB agar (Merck, Darmstadt, Germany) plates supplemented with 100 μg/mL ampicillin (Merck, Darmstadt, Germany). Single colonies were used to inoculate 10 mL LB tubes supplemented with 100 μg/mL ampicillin and incubated overnight with shaking. Overnight cultures were used to prepare glycerol (Merck, Darmstadt, Germany) stocks which were stored at −80 °C. Overnight broth cultures for subsequent experiments and for plasmid miniprep for sequencing were grown from the colonies picked from plates spread from glycerol stocks. Whole plasmid sequencing was performed at the DNA Sequencing Facility (Department of Biochemistry, University of Cambridge, UK).
All cultures were grown at 37 °C for 17 ± 1 h. Broth cultures were shaken at 200 rpm. The OD600 of overnight cultures were measured with Jenway 6715 UV/Vis spectrophotometer (Cole-Parmer, Vernon Hills, IL, USA).

4.3. Characterisation of Strains

OHHL (Merck, Darmstadt, Germany) was dissolved in acetonitrile (Fisher Scientific, Hampton, NH, USA) to a stock concentration of 10−1 M and serially diluted to working concentrations of 10−2 to 10−8 M with Milli-Q water (Merck, Darmstadt, Germany); L-(+)-arabinose (Merck, Darmstadt, Germany) 10% (w/v) stock and IPTG (Thermo Fisher, Waltham, MA, USA) 100 mM stocks were prepared in Milli-Q water; Ampicillin (Merck, Darmstadt, Germany) 100 mg/mL and anhydrotetracycline (Stratech, Ely, UK) 100 μg/mL stocks were prepared in 50% (v/v) ethanol (Honeywell, Charlotte, NC, USA). All stocks were sterilised using 0.22 µm syringe filters (Fisher Scientific, Hampton, NH, USA). The media of the designed strains and LB medium control were always supplemented with 100 µg/mL ampicillin. The media of the Tuner (DE3) cells were always without ampicillin supplementation.
Overnight sensor and producer strain cultures were diluted to OD600~0.05. The sensor was induced by varying concentrations of OHHL in the range of 10−4–10−10 M and was tested in the absence or the presence of 0.1% (w/v) arabinose. The producer was induced by 0.025, 0.05, 0.1, 0.3, and 0.5 mM IPTG. Cultures in a total volume of 200 μL were measured in a 96-well black plate (655090, Greiner, Kremsmünster, Austria) covered with an optically clear, moisture-resistant, and gas-permeable seal (PCR0548, Azenta Life Sciences, Burlington, MA, USA). The cultures were measured using a CLARIOstar Plate Reader (BMG LABTECH, Ortenberg, Germany) every 10 min for 5 h (incubated at 37 °C, double orbital 400 rpm, top optic, 7.6 mm focal height, 2 mm scan width 2 × 2 matrix scan, and 25 flashes per well). The FI of EGFP of the sensor was measured with λex = 470 (15) nm, λem = 515 (20) nm, and gain 1398. The FI of mCherry of the producer was measured with λex = 570 (15) nm, λem = 620 (20) nm, and gain of 1594. Tuner (DE3) induced by the highest inducer concentration tested and LB were measured in parallel as controls.

4.4. QS Activation and Attenuation Ability

The sensor strain (ara) was used to test the QS activation and attenuation ability of producer and regulator strains. The overnight producer culture was diluted to 10 mL with LB and induced with varying concentrations of IPTG (OD600~0.5). The diluted cultures were then covered with aluminium foil, incubated at 37 °C, and shaken at 200 rpm for 3 h. Tuner (DE3) culture (10 mL, OD600~0.5) supplemented with the highest concentration of IPTG and 10 mL LB were incubated in parallel as controls. Every hour, all cultures were centrifuged at 4696× g for 10 min (Thermo Scientific SL16, Waltham, MA, USA), and 1 mL supernatants were taken and stored at 4 °C for subsequent mixing with sensor cultures.
The overnight regulator culture was diluted to 10 mL with LB and induced with 100 ng/μL AHT and without (OD600~0.05). The diluted cultures were then covered with aluminium foil, incubated at 37 °C, and shaken at 200 rpm for 16 h. Tuner (DE3) culture was incubated in parallel. These further overnight cultures were diluted to 5 mL (OD600~0.25 to 1), followed by centrifuging at 4696× g for 10 min. The pellets were resuspended with 5 mL LB supplemented with 10−5 M OHHL. The resuspended cultures were covered with aluminium foil, incubated at 37 °C, and shaken at 200 rpm for 1 h. LB (5 mL) with and without 10−5 M OHHL were cultured in parallel as controls. After 1 h, the supernatants were used to mix with sensor cultures.
Aliquots of 10 μL sensor (OD600~1) were mixed with 190 μL of the above supernatants and measured using a CLARIOstar Plate Reader (software version: 5.40 R3; firmware version: 1.21) using the above-described protocol.

4.5. Statistical Analysis

Mann-Whitney and Kruskal-Wallis tests were used for comparisons of two or more groups, respectively. Data were collected from at least three biological independent experiments. GraphPad Prism (version 9.5.0, San Diego, CA, USA) was used for data analysis and data presentation.

Supplementary Materials

The following supporting information can be downloaded at: https://www.mdpi.com/article/10.3390/synbio1020010/s1, Table S1: Major components of the three E. coli engineered strains used in this study; Figure S1: Constructs of the three plasmids; Figure S2: Influence of the addition of anhydrotetracycline on induction of the regulator strain. Supplementary files of nucleotide sequence alignment results of the plasmids of the three strains.

Author Contributions

Conceptualisation, Y.L., J.S. and F.M.G.; methodology, Y.L. and J.E.C.; software, Y.L.; formal analysis, Y.L.; investigation, Y.L.; resources, J.S., F.M.G. and A.J.O.; writing—original draft preparation, Y.L.; writing—review and editing, Y.L., J.E.C., A.J.O., J.S. and F.M.G.; supervision, J.S. and F.M.G.; project administration, J.S. and F.M.G. All authors have read and agreed to the published version of the manuscript.

Funding

This research was funded by the University of Leeds School of Food Science and Nutrition.

Institutional Review Board Statement

Not applicable.

Informed Consent Statement

Not applicable.

Data Availability Statement

The data presented in this study are openly available in Li, Yuwei, Clarke, Justin E., O’Neill, Alex J., Goycoolea, Francisco M. and Smith, James (2023) An engineered Escherichia coli community for studying quorum sensing data set. The University of Leeds. [Dataset] https://doi.org/10.5518/1341.

Acknowledgments

We are indebted to Helen Chappell for critically reading the manuscript and valuable suggestions, Celina Vila Sanjurjo for advice and helpful discussions, Luiza Galarion for technical help in the subcloning, and Nick Sheppard for kind support in preparing the data repository of our manuscript.

Conflicts of Interest

The authors declare no conflict of interest.

References

  1. Engebrecht, J.; Nealson, K.; Silverman, M. Bacterial bioluminescence: Isolation and genetic analysis of functions from Vibrio fischeri. Cell 1983, 32, 773–781. [Google Scholar] [CrossRef]
  2. Zhao, X.; Yu, Z.; Ding, T. Quorum-Sensing Regulation of Antimicrobial Resistance in Bacteria. Microorganisms 2020, 8, 425. [Google Scholar] [CrossRef] [PubMed] [Green Version]
  3. Lee, S.J.; Park, S.Y.; Lee, J.J.; Yum, D.Y.; Koo, B.T.; Lee, J.K. Genes encoding the N-acyl homoserine lactone-degrading enzyme are widespread in many subspecies of Bacillus thuringiensis. Appl. Environ. Microbiol. 2002, 68, 3919–3924. [Google Scholar] [CrossRef] [PubMed] [Green Version]
  4. Schuster, M.; Sexton, D.J.; Diggle, S.P.; Greenberg, E.P. Acyl-homoserine lactone quorum sensing: From evolution to application. Annu. Rev. Microbiol. 2013, 67, 43–63. [Google Scholar] [CrossRef] [PubMed]
  5. Whitehead, N.A.; Barnard, A.M.L.; Slater, H.; Simpson, N.J.L.; Salmond, G.P.C. Quorum-sensing in Gram-negative bacteria. FEMS Microbiol. Rev. 2001, 25, 365–404. [Google Scholar] [CrossRef]
  6. Rutherford, S.T.; Bassler, B.L. Bacterial quorum sensing: Its role in virulence and possibilities for its control. Cold Spring Harb. Perspect. Med. 2012, 2, a012427. [Google Scholar] [CrossRef]
  7. Parsek, M.R.; Greenberg, E.P. Acyl-homoserine lactone quorum sensing in Gram-negative bacteria: A signaling mechanism involved in associations with higher organisms. Proc. Natl. Acad. Sci. USA 2000, 97, 8789–8793. [Google Scholar] [CrossRef]
  8. Urbanowski, M.L.; Lostroh, C.P.; Greenberg, E.P. Reversible acyl-homoserine lactone binding to purified Vibrio fischeri LuxR protein. J. Bacteriol. 2004, 186, 631–637. [Google Scholar] [CrossRef] [Green Version]
  9. Eberhard, A.; Burlingame, A.L.; Eberhard, C.; Kenyon, G.L.; Nealson, K.H.; Oppenheimer, N.J. Structural identification of autoinducer of Photobacterium fischeri luciferase. Biochemistry 1981, 20, 2444–2449. [Google Scholar] [CrossRef]
  10. Engebrecht, J.; Silverman, M. Identification of genes and gene products necessary for bacterial bioluminescence. Proc. Natl. Acad. Sci. USA 1984, 81, 4154–4158. [Google Scholar] [CrossRef]
  11. Boo, A.; Ledesma Amaro, R.; Stan, G.-B. Quorum sensing in synthetic biology: A review. Curr. Opin. Syst. Biol. 2021, 28, 100378. [Google Scholar] [CrossRef]
  12. Ruby, E.G.; Urbanowski, M.; Campbell, J.; Dunn, A.; Faini, M.; Gunsalus, R.; Lostroh, P.; Lupp, C.; McCann, J.; Millikan, D.; et al. Complete genome sequence of Vibrio fischeri: A symbiotic bacterium with pathogenic congeners. Proc. Natl. Acad. Sci. USA 2005, 102, 3004–3009. [Google Scholar] [CrossRef] [PubMed]
  13. Dong, Y.H.; Xu, J.L.; Li, X.Z.; Zhang, L.H. AiiA, an enzyme that inactivates the acylhomoserine lactone quorum-sensing signal and attenuates the virulence of Erwinia carotovora. Proc. Natl. Acad. Sci. USA 2000, 97, 3526–3531. [Google Scholar] [CrossRef] [PubMed]
  14. Dong, Y.-H.; Wang, L.-H.; Xu, J.-L.; Zhang, H.-B.; Zhang, X.-F.; Zhang, L.-H. Quenching quorum-sensing-dependent bacterial infection by an N-acyl homoserine lactonase. Nature 2001, 411, 813–817. [Google Scholar] [CrossRef]
  15. Chen, F.; Gao, Y.; Chen, X.; Yu, Z.; Li, X. Quorum quenching enzymes and their application in degrading signal molecules to block quorum sensing-dependent infection. Int. J. Mol. Sci. 2013, 14, 17477–17500. [Google Scholar] [CrossRef]
  16. Fetzner, S. Quorum quenching enzymes. J. Biotechnol. 2015, 201, 2–14. [Google Scholar] [CrossRef]
  17. Sikdar, R.; Elias, M. Quorum quenching enzymes and their effects on virulence, biofilm, and microbiomes: A review of recent advances. Expert Rev. Anti-Infect. Ther. 2020, 18, 1221–1233. [Google Scholar] [CrossRef]
  18. Steindler, L.; Venturi, V. Detection of quorum-sensing N-acyl homoserine lactone signal molecules by bacterial biosensors. FEMS Microbiol. Lett. 2007, 266, 1–9. [Google Scholar] [CrossRef] [Green Version]
  19. Müh, U.; Schuster, M.; Heim, R.; Singh, A.; Olson, E.R.; Greenberg, E.P. Novel Pseudomonas aeruginosa Quorum-Sensing Inhibitors Identified in an Ultra-High-Throughput Screen. Antimicrob. Agents Chemother. 2006, 50, 3674–3679. [Google Scholar] [CrossRef] [Green Version]
  20. Qin, X.; Vila-Sanjurjo, C.; Singh, R.; Philipp, B.; Goycoolea, F.M. Screening of Bacterial Quorum Sensing Inhibitors in a Vibrio fischeri LuxR-Based Synthetic Fluorescent E. coli Biosensor. Pharmaceuticals 2020, 13, 263. [Google Scholar] [CrossRef]
  21. Mukherjee, S.; Bassler, B.L. Bacterial quorum sensing in complex and dynamically changing environments. Nat. Rev. Microbiol. 2019, 17, 371–382. [Google Scholar] [CrossRef] [PubMed]
  22. Neubig, R.R.; Spedding, M.; Kenakin, T.; Christopoulos, A. International Union of Pharmacology Committee on Receptor Nomenclature and Drug Classification. XXXVIII. Update on terms and symbols in quantitative pharmacology. Pharmacol. Rev. 2003, 55, 597–606. [Google Scholar] [CrossRef] [PubMed] [Green Version]
  23. Defoirdt, T.; Brackman, G.; Coenye, T. Quorum sensing inhibitors: How strong is the evidence? Trends Microbiol. 2013, 21, 619–624. [Google Scholar] [CrossRef] [PubMed]
  24. Han, Y. luxPR_4G12T. 2019. Available online: http://parts.igem.org/Part:BBa_K3205005 (accessed on 10 May 2021).
  25. Nealson, K.H.; Platt, T.; Hastings, J.W. Cellular control of the synthesis and activity of the bacterial luminescent system. J Bacteriol. 1970, 104, 313–322. [Google Scholar] [CrossRef] [Green Version]
  26. Lopreside, A.; Wan, X.; Michelini, E.; Roda, A.; Wang, B. Comprehensive Profiling of Diverse Genetic Reporters with Application to Whole-Cell and Cell-Free Biosensors. Anal. Chem. 2019, 91, 15284–15292. [Google Scholar] [CrossRef] [Green Version]
  27. Byers, J.T.; Lucas, C.; Salmond, G.P.; Welch, M. Nonenzymatic turnover of an Erwinia carotovora quorum-sensing signaling molecule. J. Bacteriol. 2002, 184, 1163–1171. [Google Scholar] [CrossRef] [Green Version]
  28. Mühlmann, M.; Forsten, E.; Noack, S.; Büchs, J. Optimising recombinant protein expression via automated induction profiling in microtiter plates at different temperatures. Microb. Cell Fact. 2017, 16, 220. [Google Scholar] [CrossRef]
  29. Namdev, P.; Dar, H.Y.; Srivastava, R.K.; Mondal, R.; Anupam, R. Induction of T7 Promoter at Higher Temperatures May Be Counterproductive. Indian J. Clin. Biochem. 2019, 34, 357–360. [Google Scholar] [CrossRef]
  30. Kleine-Brüggeney, H.; Weingarten, R.; Schulze Bockeloh, F.; Engwer, C.; Fartmann, V.; Schäfer, J.; Rezaei, M.; Bühren, S. A Macro-to-Micro Interface for Performing Comprehensive Microfluidic Cell Culture Assays. Adv. Mater. Interfaces 2021, 8, 2100785. [Google Scholar] [CrossRef]
  31. Michael, B.; Smith, J.N.; Swift, S.; Heffron, F.; Ahmer, B.M. SdiA of Salmonella enterica is a LuxR homolog that detects mixed microbial communities. J. Bacteriol. 2001, 183, 5733–5742. [Google Scholar] [CrossRef] [Green Version]
  32. Holden, M.T.; Ram Chhabra, S.; de Nys, R.; Stead, P.; Bainton, N.J.; Hill, P.J.; Manefield, M.; Kumar, N.; Labatte, M.; England, D.; et al. Quorum-sensing cross talk: Isolation and chemical characterisation of cyclic dipeptides from Pseudomonas aeruginosa and other gram-negative bacteria. Mol. Microbiol. 1999, 33, 1254–1266. [Google Scholar] [CrossRef] [PubMed]
  33. Martínez-Trujillo, M.; Sánchez-Trujillo, A.; Ceja, V.; Avila-Moreno, F.; Bermúdez-Cruz, R.M.; Court, D.; Montañez, C. Sequences required for transcription termination at the intrinsic lambdatI terminator. Can. J. Microbiol. 2010, 56, 168–177. [Google Scholar] [CrossRef] [PubMed]
  34. Weston-Hafer, K.; Berg, D.E. Deletions in plasmid pBR322: Replication slippage involving leading and lagging strands. Genetics 1991, 127, 649–655. [Google Scholar] [CrossRef]
  35. Rogozin, I.B.; Pavlov, Y.I. Theoretical analysis of mutation hotspots and their DNA sequence context specificity. Mutat. Res./Rev. Mutat. Res. 2003, 544, 65–85. [Google Scholar] [CrossRef] [PubMed] [Green Version]
  36. Silva João, P.N.; Lopes Soraia, V.; Grilo Diogo, J.; Hensel, Z. Plasmids for Independently Tunable, Low-Noise Expression of Two Genes. mSphere 2019, 4, 10–1128. [Google Scholar] [CrossRef] [Green Version]
  37. Bandiera, L.; Hou, Z.; Kothamachu, V.B.; Balsa-Canto, E.; Swain, P.S.; Menolascina, F. On-Line Optimal Input Design Increases the Efficiency and Accuracy of the Modelling of an Inducible Synthetic Promoter. Processes 2018, 6, 148. [Google Scholar] [CrossRef] [Green Version]
  38. Chen, Y.-J.; Liu, P.; Nielsen, A.A.K.; Brophy, J.A.N.; Clancy, K.; Peterson, T.; Voigt, C.A. Characterization of 582 natural and synthetic terminators and quantification of their design constraints. Nat. Methods 2013, 10, 659–664. [Google Scholar] [CrossRef]
  39. Muthukrishnan, A.-B.; Kandhavelu, M.; Lloyd-Price, J.; Kudasov, F.; Chowdhury, S.; Yli-Harja, O.; Ribeiro, A.S. Dynamics of transcription driven by the tetA promoter, one event at a time, in live Escherichia coli cells. Nucleic Acids Res. 2012, 40, 8472–8483. [Google Scholar] [CrossRef] [Green Version]
  40. Hensel, Z. pZH509, A plasmid-based Escherichia coli gene expression system with cell-to-cell variation below the extrinsic noise limit. PLoS ONE 2017, 12, e0187259. [Google Scholar] [CrossRef] [Green Version]
  41. Cormack, B.P.; Valdivia, R.H.; Falkow, S. FACS-optimized mutants of the green fluorescent protein (GFP). Gene 1996, 173, 33–38. [Google Scholar] [CrossRef]
  42. Devine, J.H.; Countryman, C.; Baldwin, T.O. Nucleotide sequence of the luxR and luxI genes and structure of the primary regulatory region of the lux regulon of Vibrio fischeri ATCC 7744. Biochemistry 1988, 27, 837–842. [Google Scholar] [CrossRef]
  43. Shaner, N.C.; Campbell, R.E.; Steinbach, P.A.; Giepmans, B.N.G.; Palmer, A.E.; Tsien, R.Y. Improved monomeric red, orange and yellow fluorescent proteins derived from Discosoma sp. red fluorescent protein. Nat. Biotechnol. 2004, 22, 1567–1572. [Google Scholar] [CrossRef] [PubMed]
  44. Ai, H.W.; Shaner, N.C.; Cheng, Z.; Tsien, R.Y.; Campbell, R.E. Exploration of new chromophore structures leads to the identification of improved blue fluorescent proteins. Biochemistry 2007, 46, 5904–5910. [Google Scholar] [CrossRef] [PubMed]
Figure 1. A schematic representation of the major genetic components of the designed plasmids and their interrelationships of the sensor, producer, and regulator strains. Functional genes are represented as arrowed ribbons. Promoters are indicated as black arrows, and terminators are indicated as hairpins.
Synbio 01 00010 g001
Figure 2. The growth of cells (optical density at λ = 600 nm, OD600), the fluorescence intensity (FI) of EGFP (λex = 470 (15) nm and λem = 515 (20) nm), and the cell response levels (FI/OD600) (as shown in column labels) of the E. coli sensor strain at varying OHHL concentrations in the absence (a) and presence (b) of arabinose during a 5 h incubation time. Data are shown as the mean values with their standard deviations (shown as error bars) of at least three independent experiments.
Synbio 01 00010 g002
Figure 3. Variation of the cell response levels (FI/OD600) with OHHL concentration of the E. coli sensor strain in the absence (ara) and presence (ara+) of arabinose. Data were obtained after 5 h incubation (endpoint data of 3rd column, Figure 2). The lines are non-linear regression best fit of the Hill equation (Equation (1), Table 1). Data are shown as the mean values with their standard deviations (shown as error bars) of at least three independent experiments. Statistical analysis was performed using Mann-Whitney test (**** p < 0.0001).
Synbio 01 00010 g003
Figure 4. Influence of the addition of IPTG (0 to 0.5 mM) on the induction of the producer strain as assessed on (a) the growth of the cells (optical density at λ = 600 nm, OD600), (b) fluorescence intensity (FI) of mCherry (λex = 570 (15) nm, λem = 620 (20) nm), and (c) the cell response levels (FI/OD600). Data are shown as the mean values with their standard deviations (shown as error bars) of at least three independent experiments.
Synbio 01 00010 g004
Figure 5. Effects of the supernatants of producer (P) induced by varying IPTG concentrations (0.025 to 0.5 mM) and of controls on the sensor (ara). The growth of the cells (optical density at λ = 600 nm, OD600), the fluorescence intensity (FI) of EGFP (λex = 470 (15) nm and λem = 515 (20) nm), and cell response levels (FI/OD600) were assessed. The supernatants were obtained at varying incubation times of (a) 1 h, (b) 2 h, and (c) 3 h. Control treatments were medium (LB + Amp) and host strain supernatant (T). Data are shown as the mean values with their standard deviations (shown as dotted lines) of at least three independent experiments.
Synbio 01 00010 g005
Figure 6. The cell response levels of sensor (ara) activated by producer supernatants. Sensor cells were incubated for 5 h with supernatants of 1 h (black), 2 h (blue), and 3 h (red) IPTG-induced Tuner (DE3) (T) and producer (P) cultures. Data are shown as the mean values with their standard deviations (shown as dotted lines) of at least three independent experiments. Statistical analysis was performed using Kruskal-Wallis test (* p < 0.05, NS = not significant), where arrowheads indicate the groups being compared.
Synbio 01 00010 g006
Figure 7. The OHHL-degrading activity of the regulator strain. LB supplemented with OHHL 10−5 M was used to assess the degrading ability of the regulator strain over 1 h incubation followed by incubation of the supernatants with the sensor strain (ara). Tests include the AHT-induced regulator (initial OD600~0.25, 0.5, and 1, labelled as IR0.25, IR0.5, and IR1, respectively), non-induced regulator (initial OD600~1, labelled as Non-IR1) and Tuner (DE3) (initial OD600~1, labelled as T1 (Amp)). (a) The growth of the cells (optical density at λ = 600 nm, OD600). (b) The fluorescence intensity (FI) of EGFP (λex = 470 (15) nm and λem = 515 (20) nm). (c) The cell response levels (FI/OD600). (d) The cell response levels at the endpoints (5 h). Data are shown as the mean values with their standard deviations (shown as error bars or dotted lines) of at least three independent experiments. Statistical analysis was performed using Mann-Whitney test for two groups and using Kruskal-Wallis test for three groups (** p < 0.01, **** p < 0.0001, and NS = not significant), where arrowheads indicate the groups being compared.
Synbio 01 00010 g007
Table 1. Non-linear best-fit values for the Hill equation (Equation (1)) for sensor strain response as a function of OHHL concentration.
ResponseTreatmentVmax k H i l l (M)hR2
FI/OD600araUnstable1.124 × 10−60.46400.854
ara+Unstable3.701 × 10−81.3140.831
Disclaimer/Publisher’s Note: The statements, opinions and data contained in all publications are solely those of the individual author(s) and contributor(s) and not of MDPI and/or the editor(s). MDPI and/or the editor(s) disclaim responsibility for any injury to people or property resulting from any ideas, methods, instructions or products referred to in the content.

