Article

Hygroscopicity in Epoxy Powder Composites

by
James M. Maguire
1,*,
Jin-Yu Wang
2 and
Conchúr M. Ó Brádaigh
1,†
1
School of Engineering, Institute for Materials and Processes, The University of Edinburgh, Edinburgh EH9 3FB, UK
2
Research Centre for Carbon Solutions, School of Engineering & Physical Sciences, Heriot-Watt University, Edinburgh EH14 4AS, UK
*
Author to whom correspondence should be addressed.
Current address: Department of Materials Science & Engineering, Faculty of Engineering, The University of Sheffield, Sir Robert Hadfield Building, Mappin Street, Sheffield S1 3JD, UK.
Powders 2024, 3(2), 168-189; https://doi.org/10.3390/powders3020011
Submission received: 31 December 2023 / Revised: 25 February 2024 / Accepted: 25 March 2024 / Published: 3 April 2024
(This article belongs to the Special Issue Feature Papers in Powders 2023)

Abstract

:
Epoxy powders offer a low-cost way of manufacturing thick-section composite parts, such as those found in wind and tidal turbines. Currently, their processing cycle includes a lengthy drying stage (≥15 h) to remove ambient moisture. This drying stage prevents void defect formation and, thereby, a reduction in mechanical properties; however, it constitutes up to 60% of the processing time. Little research has been published which studies the drying stage or its optimisation. In the present work, experimental and simulated analyses are used to investigate the effects of hygroscopicity in epoxy powder composites. Tests are performed to quantify the void content of dried and undried laminates and to measure its impact on transverse flexural strength. Dynamic vapour sorption analysis is used to study the sorption behaviour of the epoxy powder. It is shown that the epoxy powder is slightly hygroscopic (1.36 wt%) and exhibits sorption behaviour that is characteristic of glassy polymers. This results in up to 4.8% voids (by volume) if processed in an undried state, leading to a 43% reduction in transverse flexural strength. A modified linear driving force model is fitted to the desorption data and then implemented in existing process-simulation tools. The drying of a thick epoxy powder composite section is simulated to investigate the influence of powder sintering on the duration of the drying stage. Process simulations reveal that a standard drying cycle prematurely sinters the powder, which inhibits moisture release. By maintaining the powder state, simulations show that the drying cycle can be reduced to 5 h.

1. Introduction

Advanced composite materials have become an important global commodity due to their use in light-weighting critical infrastructure. Their high stiffness/strength to weight ratio facilitates reduced energy consumption in transport sectors and increased energy production for renewable energy sources. For example, the Boeing 787 Dreamliner contains 50% composite materials by weight [1], while several companies have been successful in deploying 100+ m length composite wind turbine blades [2].
Generally, fibre-reinforced composites are composed of a fibre bed (carbon, glass, basalt, etc.) impregnated with a polymer matrix (thermoset or thermoplastic). Cost and performance dictate fibre choice as carbon fibres offer higher specific strength and stiffness than glass fibres but also come at an increased cost [3]. Polymer selection, on the other hand, is often driven by the ease of manufacturing; for example, low viscosity thermosets (0.1–100 Pa.s) allow large components to be infused in a cost-effective manner [4], whereas higher pressures and temperatures are typically required for processing thermoplastics (>100 Pa.s).
In the context of advanced composite materials, powder-based systems occupy several niches within the market: powder binder for preforming [5,6,7,8,9], powder towpregging [10,11,12,13,14], and powder semi-pregging [15,16,17,18,19]; each of which is shown in Figure 1.
In the case of powder binders, typically, only 3–9 wt% of polymer powder is added to dry reinforcing fabric. The fabric can be draped and formed prior to melting the powder, which then binds the fabric layers and fixes them into their formed shape. Subsequently, this “preformed” fabric can be infused with a low-viscosity resin via resin transfer moulding or a similar process [5,6].
In contrast, for powder towpregging and powder semi-pregging, the powder acts as the primary polymer matrix for the composite. For towpregging, the powder is typically dispersed between spread reinforcing fibres in an automated production process using electrostatic deposition or similar [20,21]. This is particularly attractive for thermoplastic powders due to their high viscosity, i.e., the dispersion between the fibres reduces the distance that molten polymer must flow to achieve full impregnation. As such, thermoplastic powder towpregging systems have undergone significant development in the last four decades [10,13,21,22]. Despite this, the high viscosity of thermoplastics means that towpreg quality plays an important role in subsequent composite manufacturing processes, such as automated tape placement [23], i.e., it is difficult to remove void defects without the use of expensive high-pressure equipment, such as autoclaves and heated presses. For this reason, recent developments in powder towpreg production have introduced the use of low-viscosity (<10 Pa s) epoxy powders, which can be reprocessed under low pressure conditions to improve final part quality [14,20]. Reprocessing is a possibility for these epoxy powders because they contain latent, heat-activated curing agents and have a glass transition temperature above 40 °C. This means that they require no refrigerated storage to prevent curing, i.e., the epoxy powder is stable at ambient conditions for several months, unlike conventional liquid epoxy systems which undergo ageing [24,25].
Likewise, epoxy powders have undergone significant development for powder semi-pregs; a form of vacuum-bag-only (VBO) prepreg developed for low-cost out-of-autoclave (OoA) processing [16,17,19,26,27]. Vacuum-bag-only (VBO) prepregs differ from conventional prepregs in that the fibre bed is only partially impregnated with resin. This allows entrapped air and moisture to be evacuated during processing via dry fibre pathways [28,29,30]. Through-thickness permeability is particularly desirable for evacuation as the through-thickness flow paths tend to be significantly shorter than the in-plane flow paths [31]. As such, several recent studies have been dedicated to studying how resin deposition can improve through-thickness gas evacuation [19,32,33,34]. Powder semi-pregs have inherent three-dimensional gas permeability, assuming the powder is left unsintered.
While gas permeability is important for evacuating VBO prepregs, moisture transport in these systems is largely driven by diffusion [35]. Many polymers used in composites manufacturing can be categorised as slightly hygroscopic (0.2–2 wt%) or moderately hygroscopic (2–15 wt%) [36], meaning that they attract moisture from the atmosphere during storage, cutting, lay-up, etc. It has been shown that entrapped moisture leads to significant void growth and reductions in thermal and mechanical properties [35,37,38], as well as changes to manufacturing characteristics, such as cure kinetics, viscosity, and tackiness [39,40,41]. As a result, vacuum holds of up to 16 h are often used for drying VBO prepregs. In the case of polymer powders; however, their high surface area-to-volume ratio means that sorption kinetics play a large role in the drying process [42], with desorption being several orders of magnitude faster than diffusion. For example, Padaki and Drzal [43] modelled the drying of powder towpreg as it was being consolidated. Their simulations suggested that the drying process was in the order of several minutes rather than several hours, and that this drying time was a function of particle size. Despite this, the drying process for powder semi-pregs has not been optimised in industry, e.g., drying times are still in the range of 15 h for thick-section parts of wind and tidal turbine blades [44].
In this work, the effect of hygroscopicity is explored for epoxy powder composites. Mechanical testing and microscopy are performed on dried and undried epoxy powder composites to demonstrate the effect of drying on the composite properties. Dynamic vapour sorption (DVS) is used to analyse the sorption behaviour of the epoxy powder, considering the effect of both relative humidity and temperature, as well as the impact of powder sintering. A semi-empirical model is fitted to the desorption kinetics to perform first-order simulations of the drying process. These simulations are used to determine optimal drying conditions for thick epoxy powder composite sections.

2. Materials and Methodology

2.1. Materials

Epoxy powder was supplied by ÉireComposites Teo. (Galway, Ireland), under the product number GRN 918. Note, this was the same epoxy powder used in other works [14,20] under its original product number PE6405. Optical micrographs of the epoxy powder are shown in Figure 2, as well as the differential volume distribution of particle sizes. Optical microscopy was performed using a Zeiss Axioskop 2 (Zeiss, Cambridge, UK) fitted with an AxioCam MRc 5 camera (Leica Microsystems, Milton Keynes, UK). The particle size analysis was performed using a Beckmann Coulter LS100, which uses laser diffraction to measure grain sizes in a liquid suspension. For mechanical testing, the epoxy powder was combined with a 1200 g/m2, stitched unidirectional glass fabric (UD-GF) supplied by Johns Manville (Denver, CO, USA).

2.2. Experimental

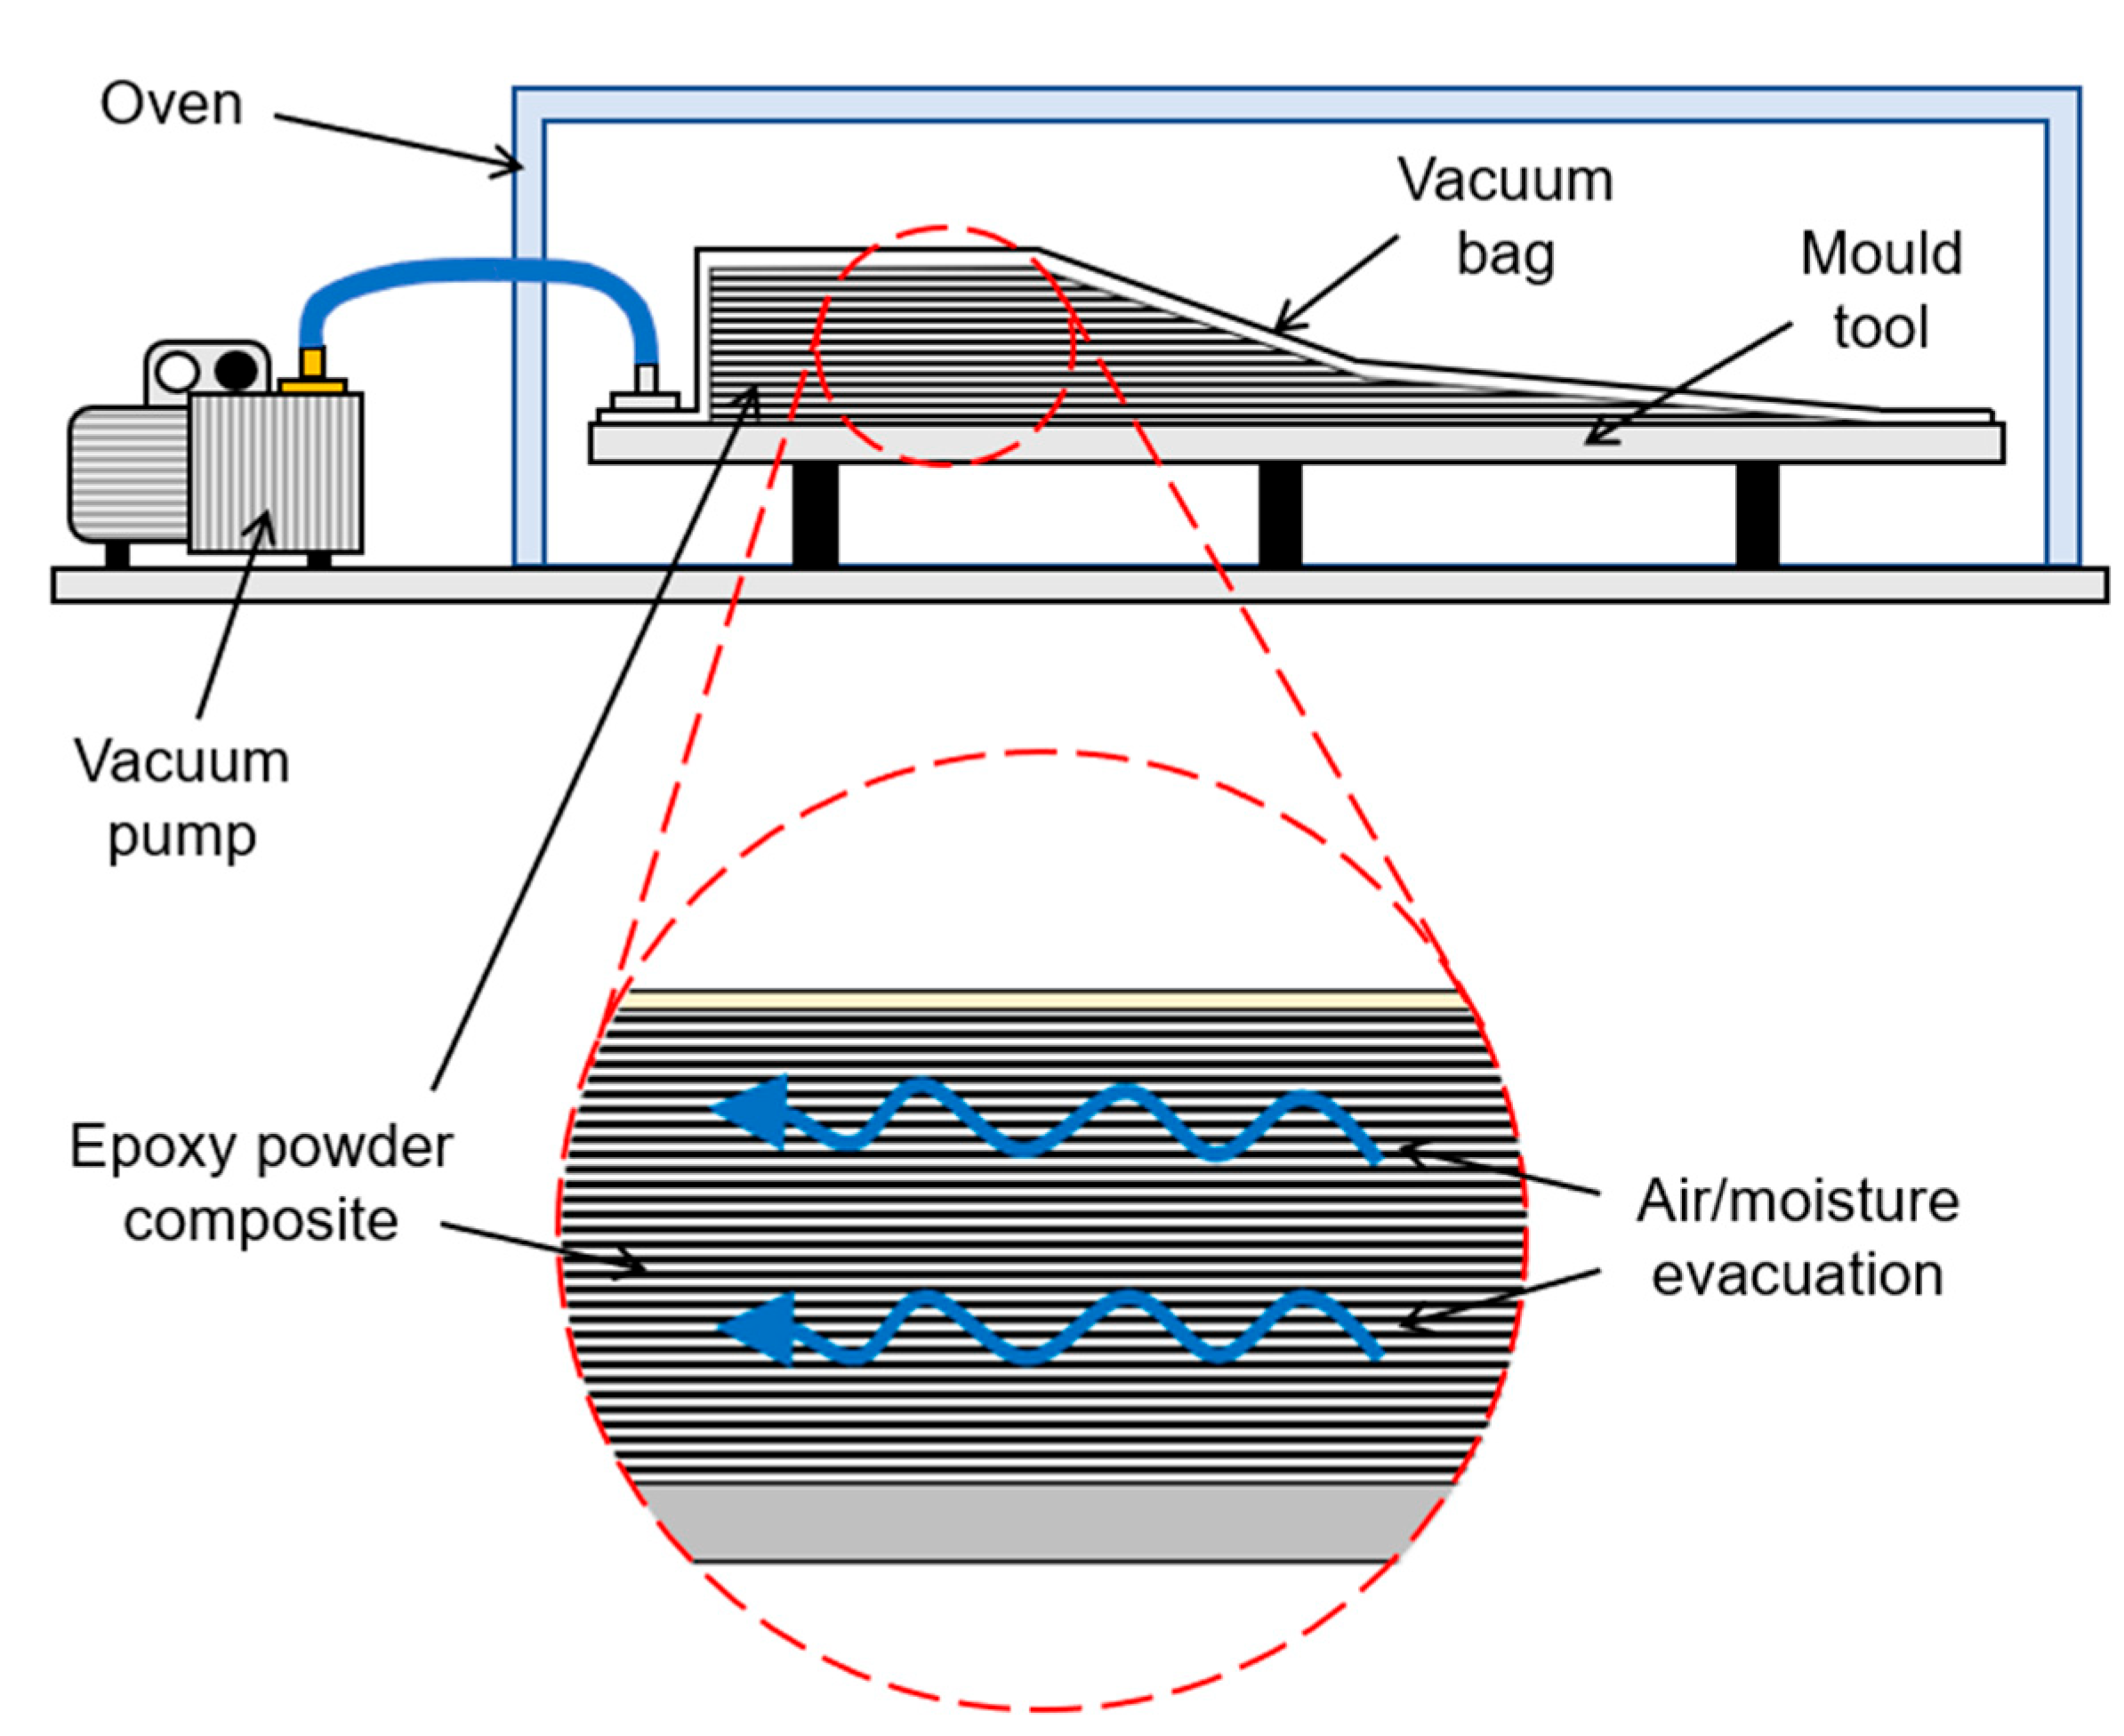
2.2.1. Composite Manufacturing

A schematic of the VBO process is shown in Figure 3 for the manufacture of a thick epoxy powder composite part. This is representative of the process simulated later in this work (discussed in Section 2.3.2 and Section 3.3) as well as the process used to manufacture composite test laminates (discussed in Section 2.2.2 and Section 3.1). For VBO processing, plies (i.e., layers) of powder semi-preg are stacked on a mould tool and then sealed in a flexible vacuum bag. The mould is placed in an oven and heated to the desired drying temperature while air/moisture are evacuated via a vacuum pump. When the drying stage is complete, the temperature is increased to lower the viscosity of the epoxy so that it will infuse through the dry fibre reinforcement. Finally, the temperature is increased again to cure the epoxy.
Two UD-GF/Epoxy test laminates were manufactured using VBO processing in an oven. A drying stage was included (16 h at 45 °C) for one laminate and excluded in the other laminate. Both laminates were subsequently processed with the following temperature cycle:
-
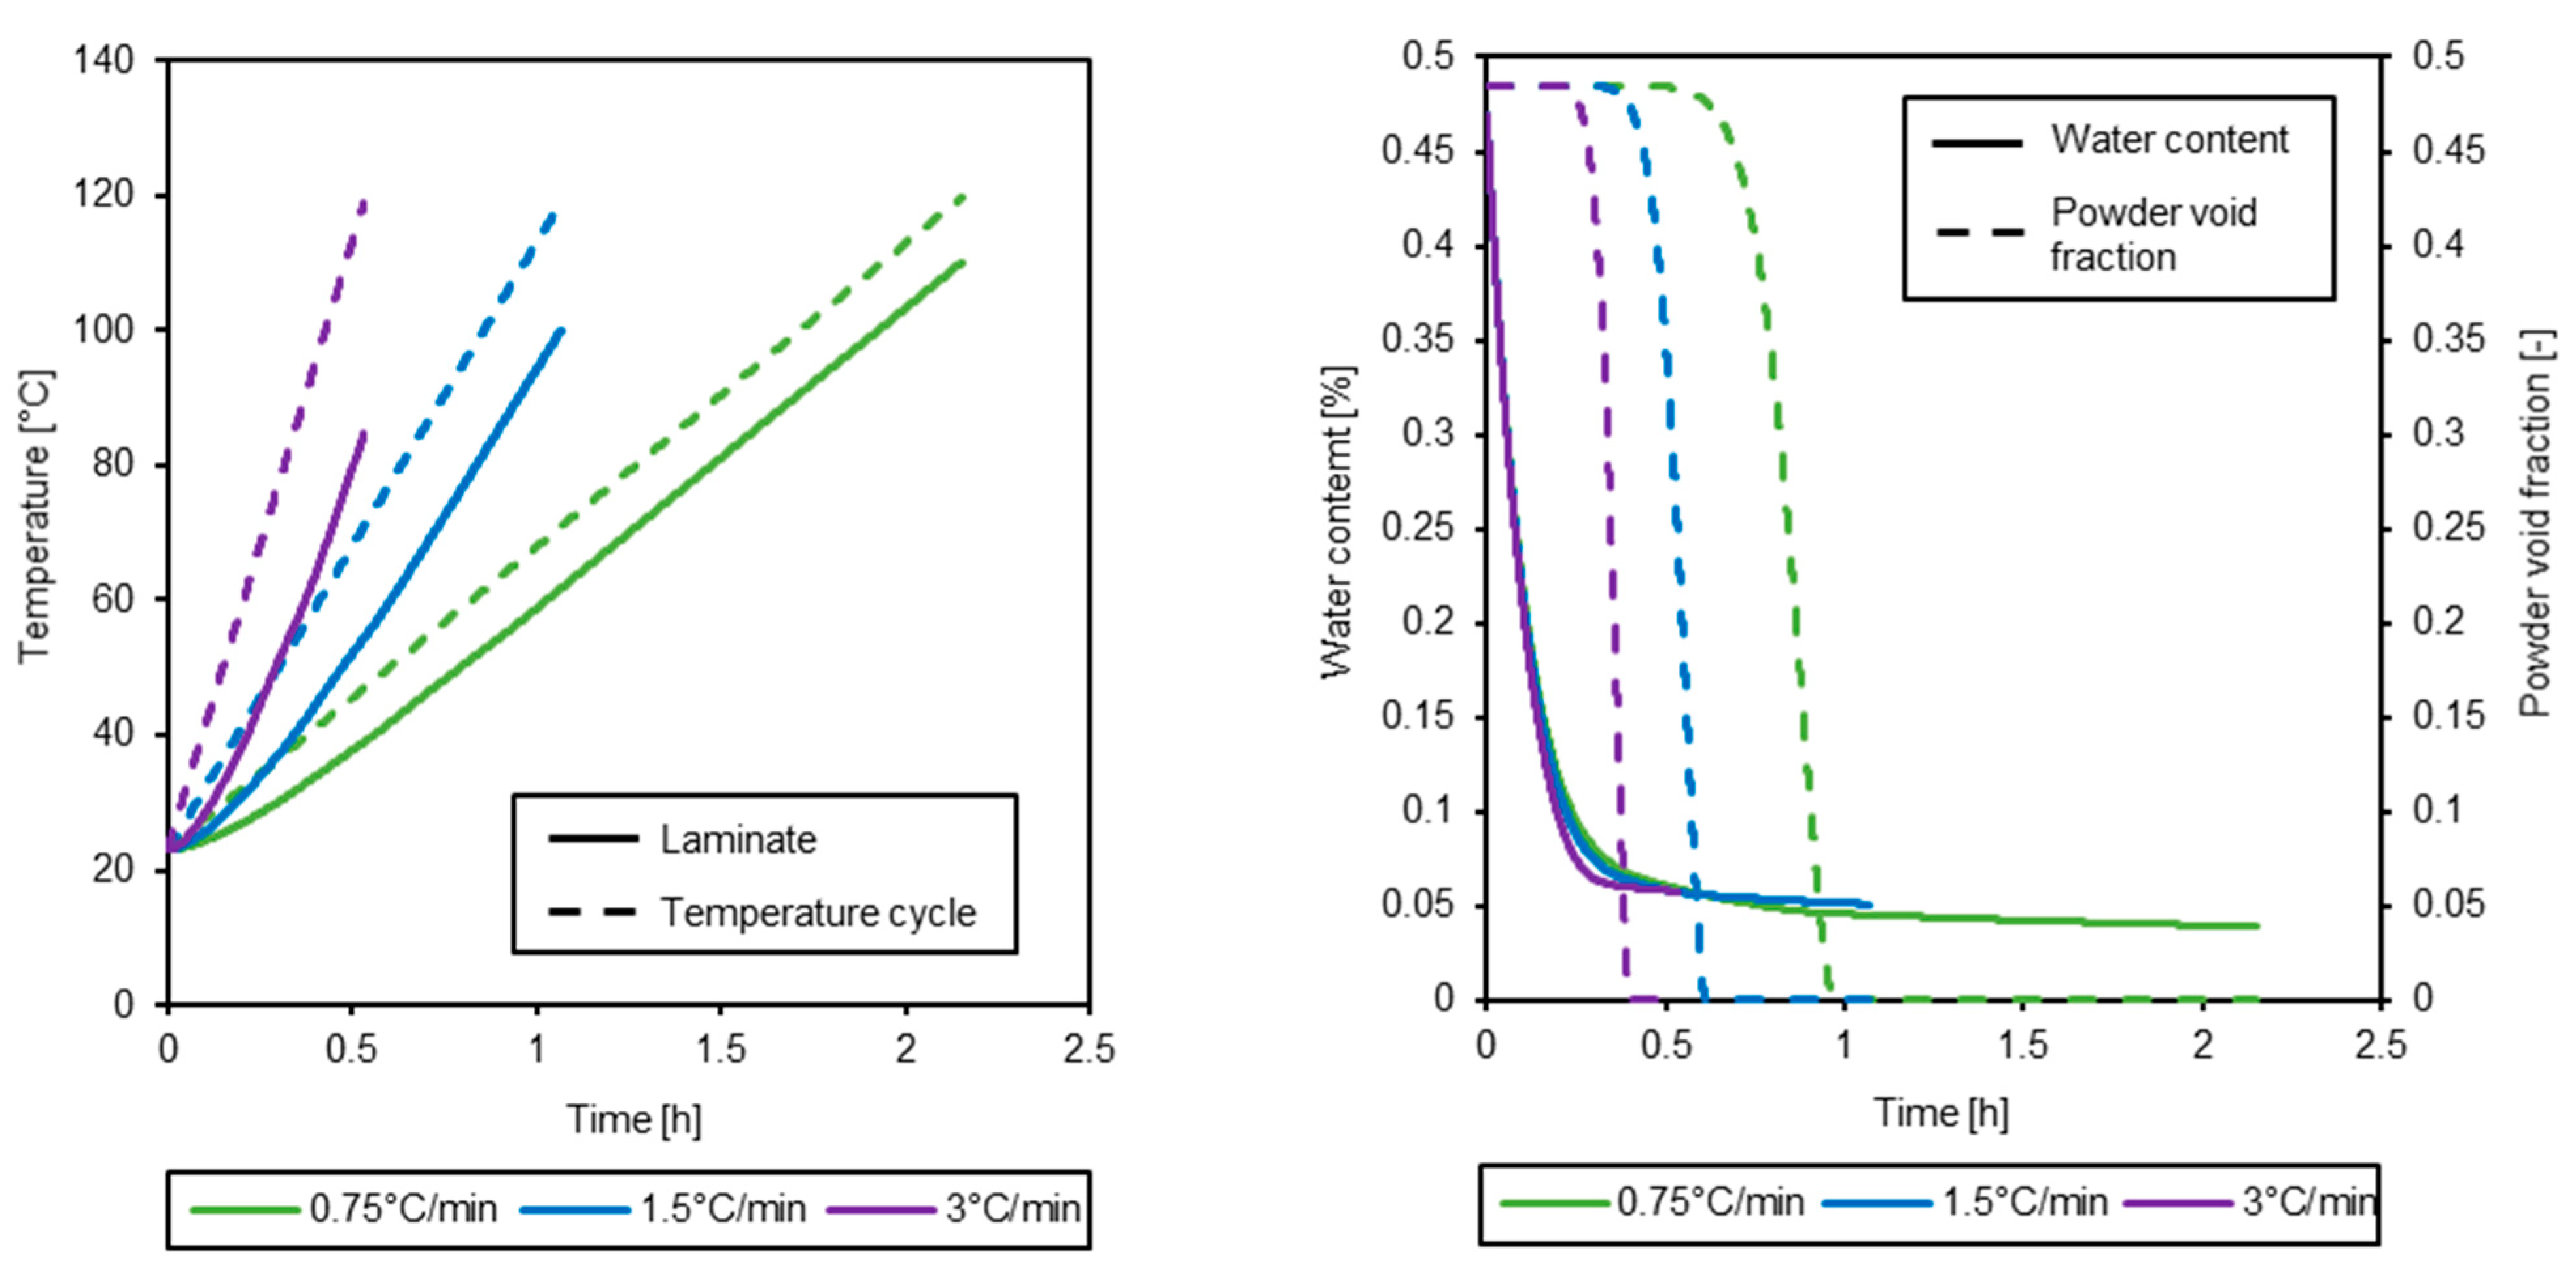
Ramp to 120 °C at 1.5 °C/min
-
Soak at 120 °C for 30 min
-
Ramp to 180 °C at 1.5 °C/min
-
Soak at 180 °C for 60 min.

2.2.2. Mechanical Testing

Transverse flexural test specimens were extracted from the composite laminate using a diamond-coated wet saw. Three-point bending tests were performed using a Zwick 10 kN test frame to the specifications of BS ISO EN 14125. For each laminate, 5 specimens were tested at a crosshead speed of 5 mm/min. Test specimens had dimensions of 60 × 15 × 2 mm (length × width × thickness), with a span of 40 mm.

2.2.3. Void Content

The fibre volume fraction and void content of the composite laminates were determined by the acid digestion method, in accordance with ASTM D 3171-09. Additionally, scanning electron microscopy (SEM) was performed on the fracture surface of the transverse flexural test specimens using a Hitachi S-4700 (Tokyo, Japan) with an acceleration voltage of 15 kV. The fracture surface was sputter-coated with gold to improve image quality.

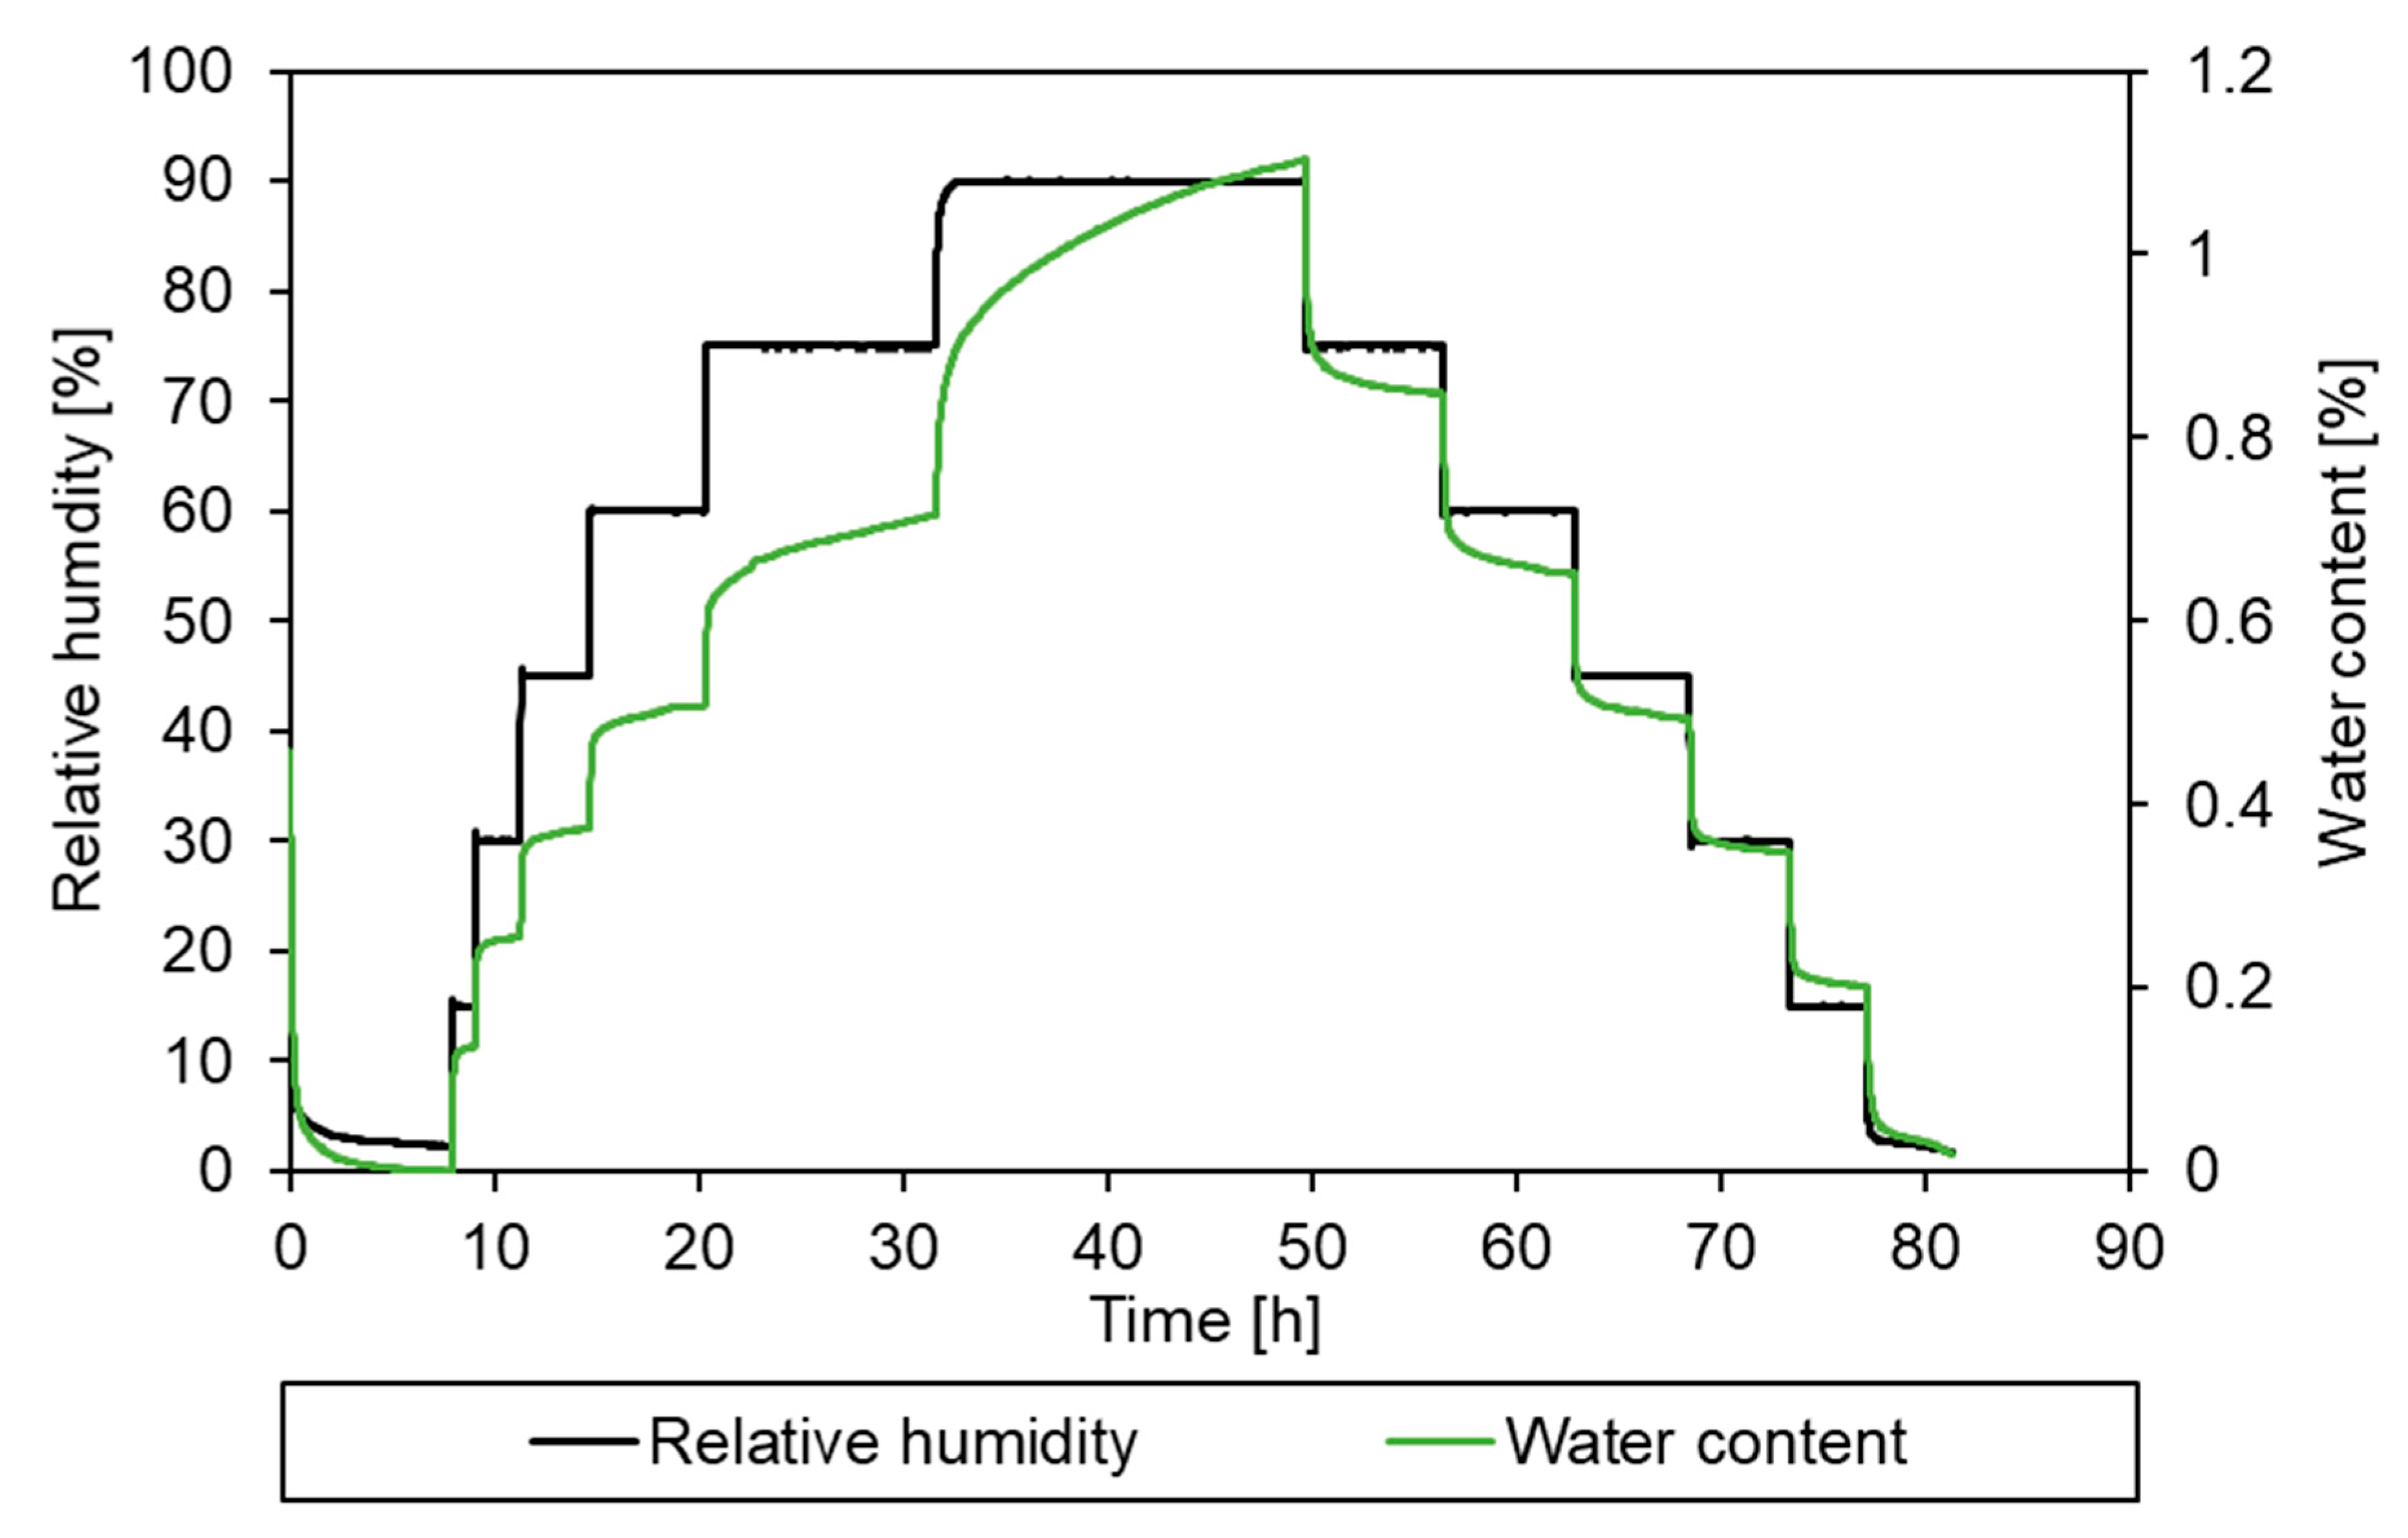
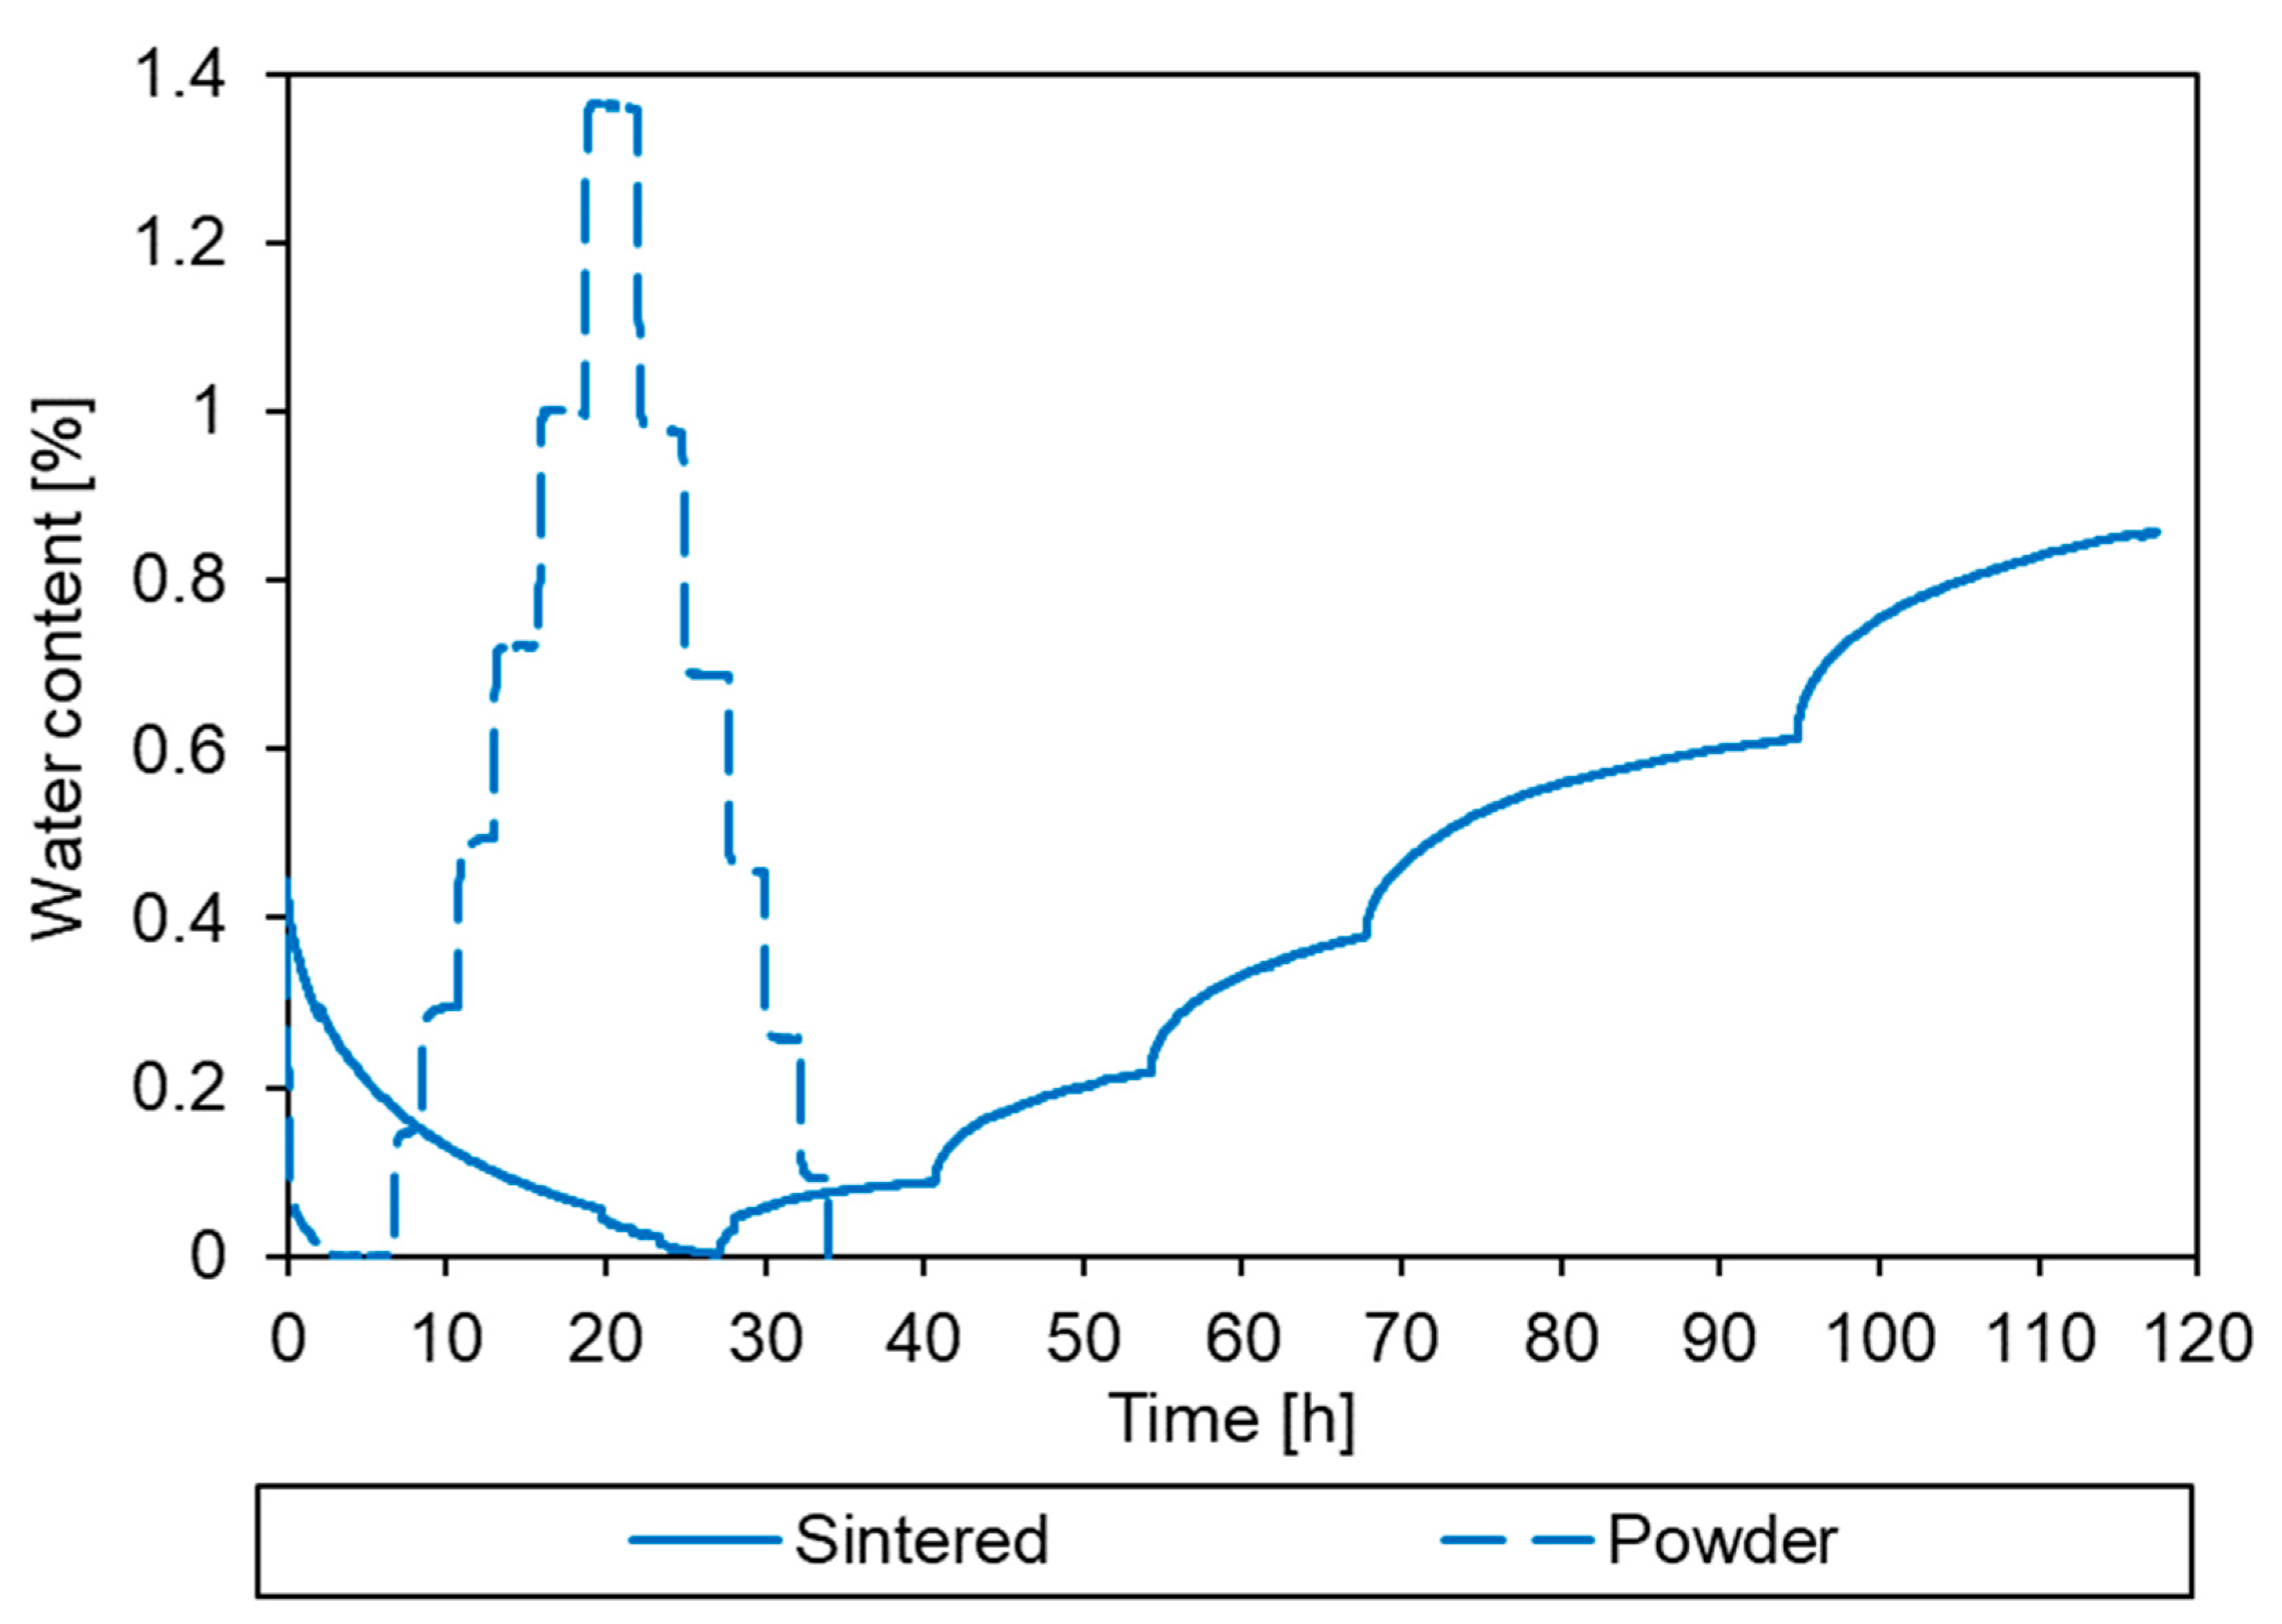
2.2.4. Dynamic Vapour Sorption

Dynamic vapour sorption (DVS) was performed on epoxy powder samples using an Aquadyne DVS-2 from Quantachrome Instruments (Hook, UK). As the Aquadyne DVS-2 is a dual-gravimetric system, all tests were performed in duplicate with deionized water. Samples were weighed in glass crucibles at a variety of isothermal conditions (e.g., 23, 35, and 45 °C) across a range of relative humidity (RH), i.e., 1–90%. Weight calibration was performed for each test temperature. At ambient conditions, each powder sample had a mass of 60 ± 13 mg. The nitrogen gas flow rate was limited to a minimum and maximum of 50 cm3/min and 150 cm3/min, respectively.
At the start of each test, the RH was set as low as possible (i.e., 1–2% RH) until the powder mass reached an equilibrium. After equilibrium was achieved, the RH level was increased in increments of 15% RH up to 90% RH, and then decreased again in 15% RH increments. For each test, the equilibrium criterion was set as mass change ≤0.0005 wt%/min. Time limits were also set in the event that equilibrium was not achieved within a given duration.
The only exception to the above procedure were samples tested at 45 °C. These samples fully sintered above 60% RH, resulting in a drastic change to the sorption characteristics. Consequently, the following additional tests were carried out:
-
Sintered samples—tested at 35 °C using the above procedure.
-
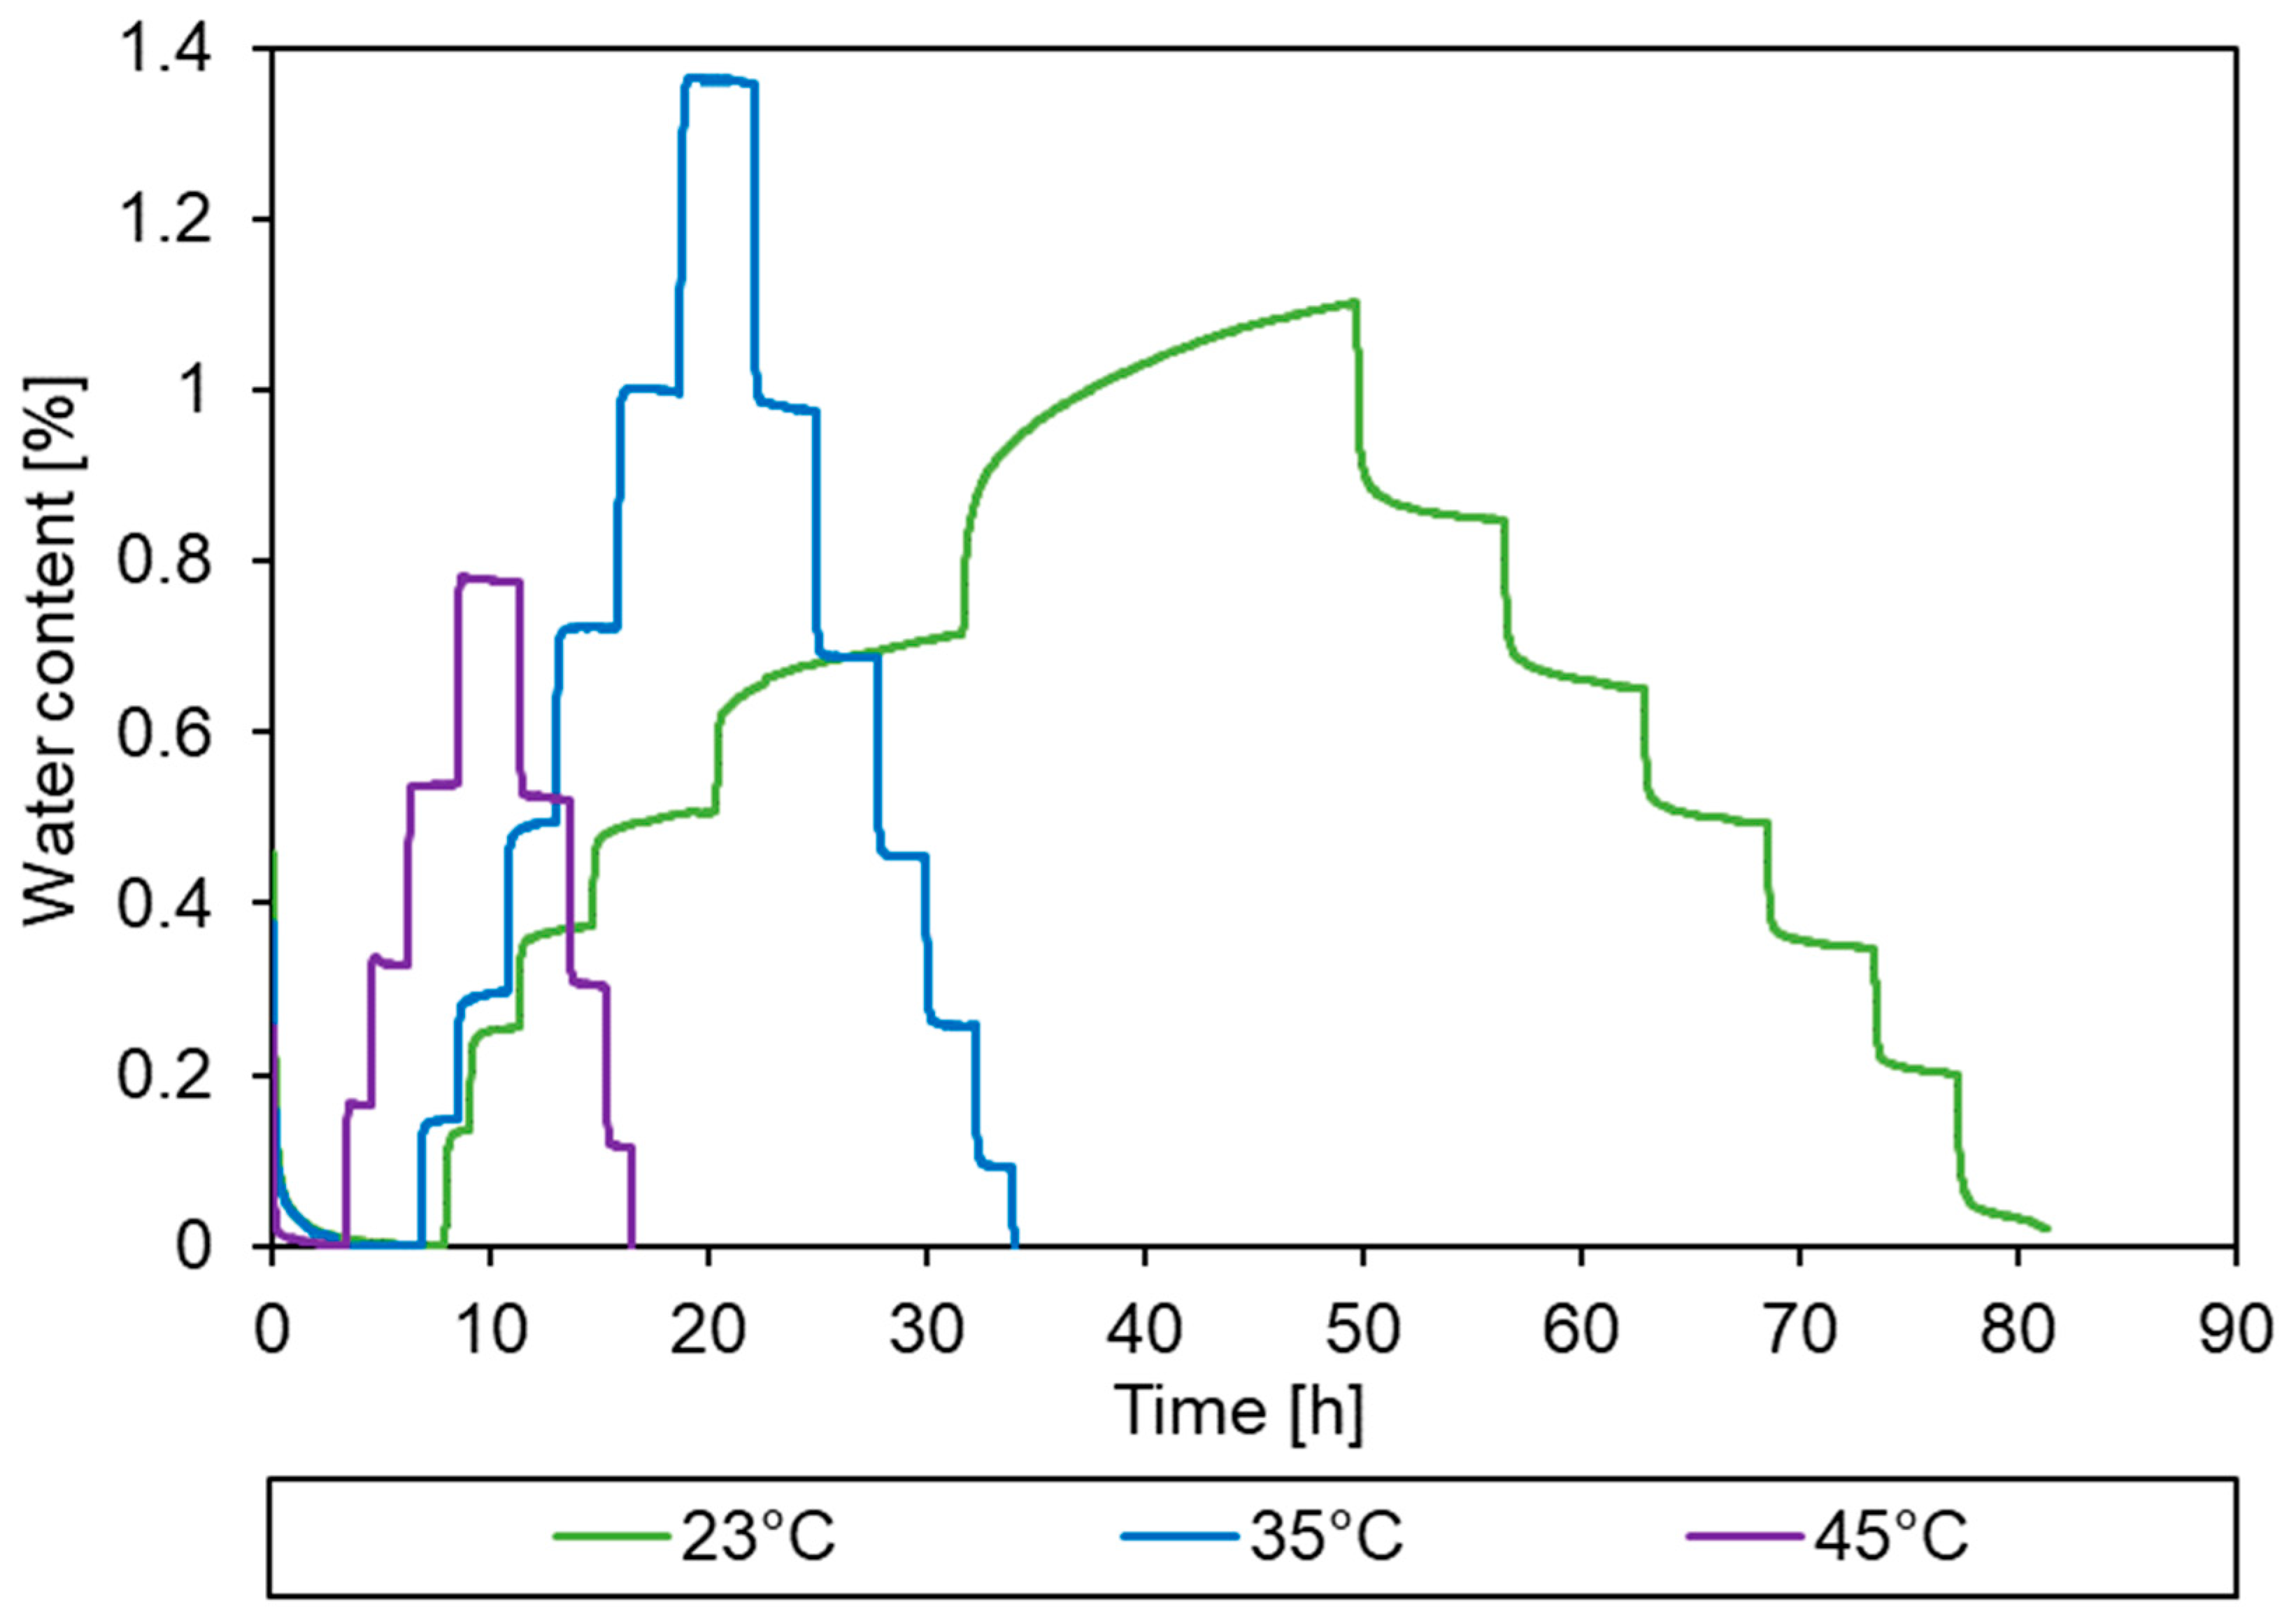
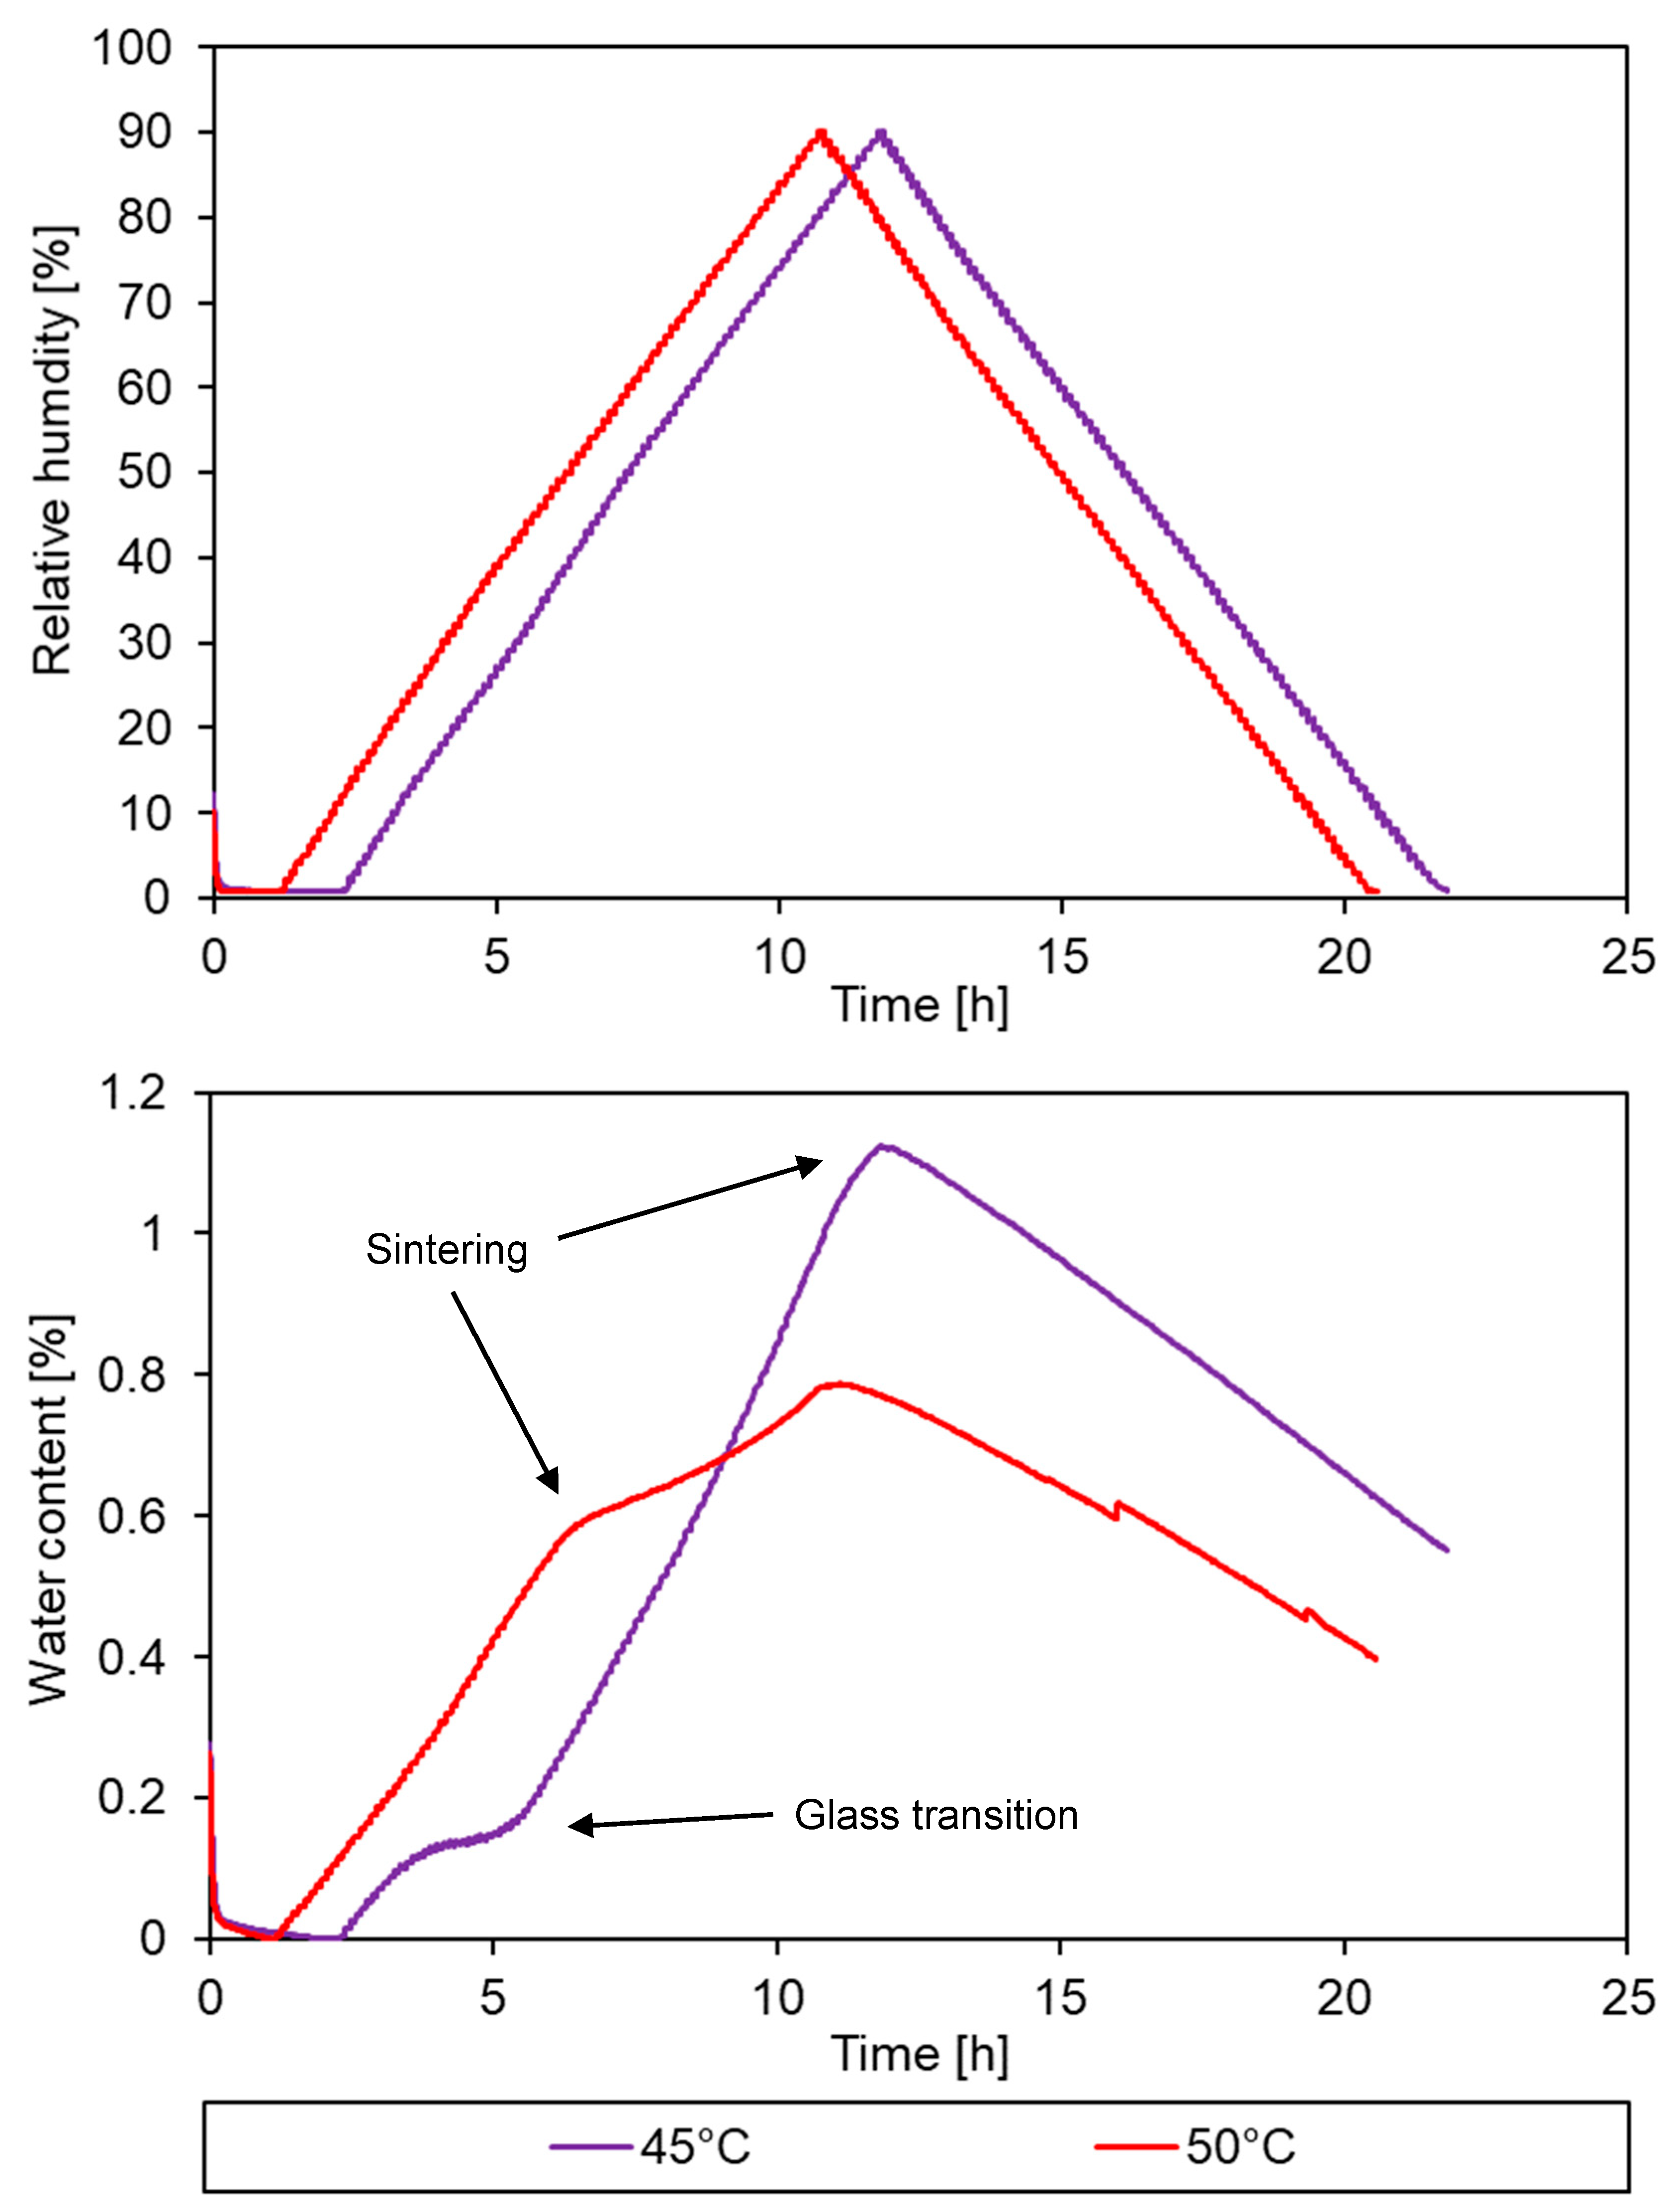
Powder samples—tested at 45 °C and 50 °C, with the RH increasing from 1–2% to 90% in increments of approx. 1% RH every 6 min, then decreasing at the same rate.

2.3. Modelling

2.3.1. Sorption Kinetics

In the context of composites manufacturing, the key sorption process occurs during the drying cycle, i.e., desorption from ambient conditions. As such, only the first step of the DVS data is considered for modelling the drying cycle. In this step, the RH is reduced from circa 57% to 1–2% and water is desorbed from the polymer. The linear driving force (LDF) model, a pseudo first-order model, is an efficient means of analysing the sorption kinetics [45],
d q d t = k · q 0 q
where q is water content of the powder particle [wt%], k is the effective mass transfer coefficient [h−1], and q 0 is the equilibrium water content of the powder particle for a given relative humidity and time.
For an initial water content of q m , Equation (1) can be integrated to determine an analytical solution for desorption kinetics,
q m q d q q 0 q = 0 t k · d t
ln q 0 q ln q 0 q m = k · t
Assuming q 0 = 0, Equation (3) becomes
q = q m · e k · t
In this form, Equation (4) can be fitted to DVS data at a given temperature; however, several considerations must be made:
  • Geometry: The LDF model was originally developed for analysing the kinetics of a packed adsorbent column with beads or pellets (i.e., spherical or cylindrical geometries—not composite systems with irregular particles as shown in Figure 1 and Figure 2).
  • Effect of temperature and isotherm non-linearity:
    • If the experiment is not isothermal (e.g., due to the endothermic enthalpy of desorption), the desorption kinetics will appear to be slower due to the combined effect of shifted equilibrium and slower diffusion at lower temperatures.
    • The diffusivity also depends on the shape of isotherm. If the experiment is performed over the linear part of the isotherm, the diffusivity can be assumed to be constant. Otherwise, more careful treatment is required and the Darken correction factor can be used to account for the isotherm non-linearity [45].
  • q 0 is the equilibrium loading with RH at a given time. The derivation from Equation (3) to Equation (4) assumes that RH drops instantaneously to almost 0, which is not the case for DVS experiments. As described in [45], solutions have been derived for constant pressure/constant volume experiments (for an initial step change in pressure in an infinite medium/finite medium, respectively). However, a more complex analysis would be required to take into account the varying RH.
Given the above considerations, the LDF model was modified with an additional term, J , to enable semi-empirical fitting
q * = q m · J · e k · t
J = 1 + e C · ( t t c )
where C is a rate coefficient [h−1], and t c is a time constant [h].
In this instance, k and C vary with temperature, T [°C], according to the following relations,
k = A k e B k · T
C = A C e B C · T
The parameters for Equations (5)–(8) were fitted to the DVS data using MATLAB’s nonlinear least-squares curve fitting solver, lsqcurvefit. The fitting parameters are shown in Table 1.
As will be described in the next section, the sorption kinetics model must be solved numerically along with a system of equations for heat transfer, powder sintering, and thickness change to simulate the drying stage of the composite manufacturing cycle. To solve the model numerically, its derivative must be determined. Equation (5) can be expanded to the form
q * = q m · e k · t ( 1 + e C · ( t t c ) )
q * = q m ( e k · t + e C · ( t t c ) k · t )
Differentiating with respect to time
d q * d t = q m ( C k ) e C · ( t t c ) k · t k · e k · t
This derivative can then be rearranged as follows
d q * d t = q m C e k · t e C · ( t t c ) k e k · t e C · ( t t c ) k · e k · t
d q * d t = q m C e k · t e C · ( t t c ) k · q m · e k · t 1 + e C · t t c
Substituting in Equation (9), the derivative becomes
d q * d t = q * C e C · ( t t c ) 1 + e C · ( t t c ) k · q *

2.3.2. Process Simulations

Using experimentally validated process simulation tools [44,46], the drying stage of the manufacturing cycle is simulated for a 100-ply thick composite laminate. Such a laminate is representative of the root section of large wind and tidal turbine blades. As previously mentioned, the process simulation tools combine the modified LDF model (Equation (14)) with a through-thickness heat transfer model and powder sintering model to predict the behaviour of the system during drying. This heat transfer model is based on the following one-dimensional (1D) heat conduction equation
ρ p l y c P ,   c d T d t = κ 2 T
where ρ p l y is the ply density [kg/m3], c P ,   c is the specific heat capacity of the composite [J/kg K], κ is the through-thickness thermal conductivity [W/m K].
During the drying cycle, the thickness of each ply, h p l y [m], and thereby ρ p l y , can vary as a function of the powder void fraction, χ [-]
h p l y = h f a b + h r
where h f a b is the fabric thickness [m] and h r is the thickness of the resin layer [m]
h r = h r * 1 χ
where h r * is the thickness of the fully sintered resin.
The powder void fraction, χ , tends towards zero as the epoxy powder sinters according to the following semi-empirical relationship [46],
d χ d t = χ E exp C χ 1 T T θ C χ 2 + T T θ χ χ B
where χ E is a pre-exponential rate constant, χ is the powder void fraction at t = , T θ is the onset temperature for melting [K], and C χ 1 , C χ 2 [K], and B are fitting constants.
As will be shown for the DVS results, sintering also had a large effect on the drying kinetics of the epoxy; however, fully modelling the complex interaction was outside the scope of the current work. Rather, the modified LDF model (Equation (9)) was fitted to DVS data for sintered epoxy flakes at 35 °C ( k = 2.0964 [h−1], C = 1.9784 [h−1], and t c = −0.7829 [h]), and subsequently implemented in the simulation via the following relationship,
d q * d t = χ χ 0 · d q * d t p o w + 1 χ χ 0 · d q * d t s i n
where χ 0 is the initial powder fraction.
While this does not capture the temperature-dependency of the drying process for sintered epoxy, nor the exact relationship between desorption and powder void fraction, it was deemed sufficient to illustrate the undesirable effect of sintering on drying times, i.e., for a given temperature, the rate of drying is up to 7 times slower for sintered epoxy than it is for epoxy powder. It should also be noted that air evacuation is not modelled in the simulations, as it is assumed that t d r y i n g t e v a c u a t i o n . This is based on experimental observations that a 400 × 400 × 60 mm laminate can be fully evacuated within 1 min, similar to dry fabric, whereas drying is in the order of hours.
The above system of equations was solved in MATLAB R2019a. Equation (15) was solved using the Euler method for a time step of 0.5 s. For the simulations, it was assumed that the composite section was heated in a forced convection oven (heat transfer coefficient: 40 W/m2K) on a 10-mm-thick steel tool under vacuum bag pressure, as shown in Figure 3 and described in previous works [44,46]. While the process simulation tools are also capable of predicting through-thickness resin infusion and curing, only the drying stage has been simulated due to its immediate relevance to the current work. Interested readers are directed to previous works [16,44,46] for details of the resin infusion and curing stages of the process cycle.

3. Results and Discussion

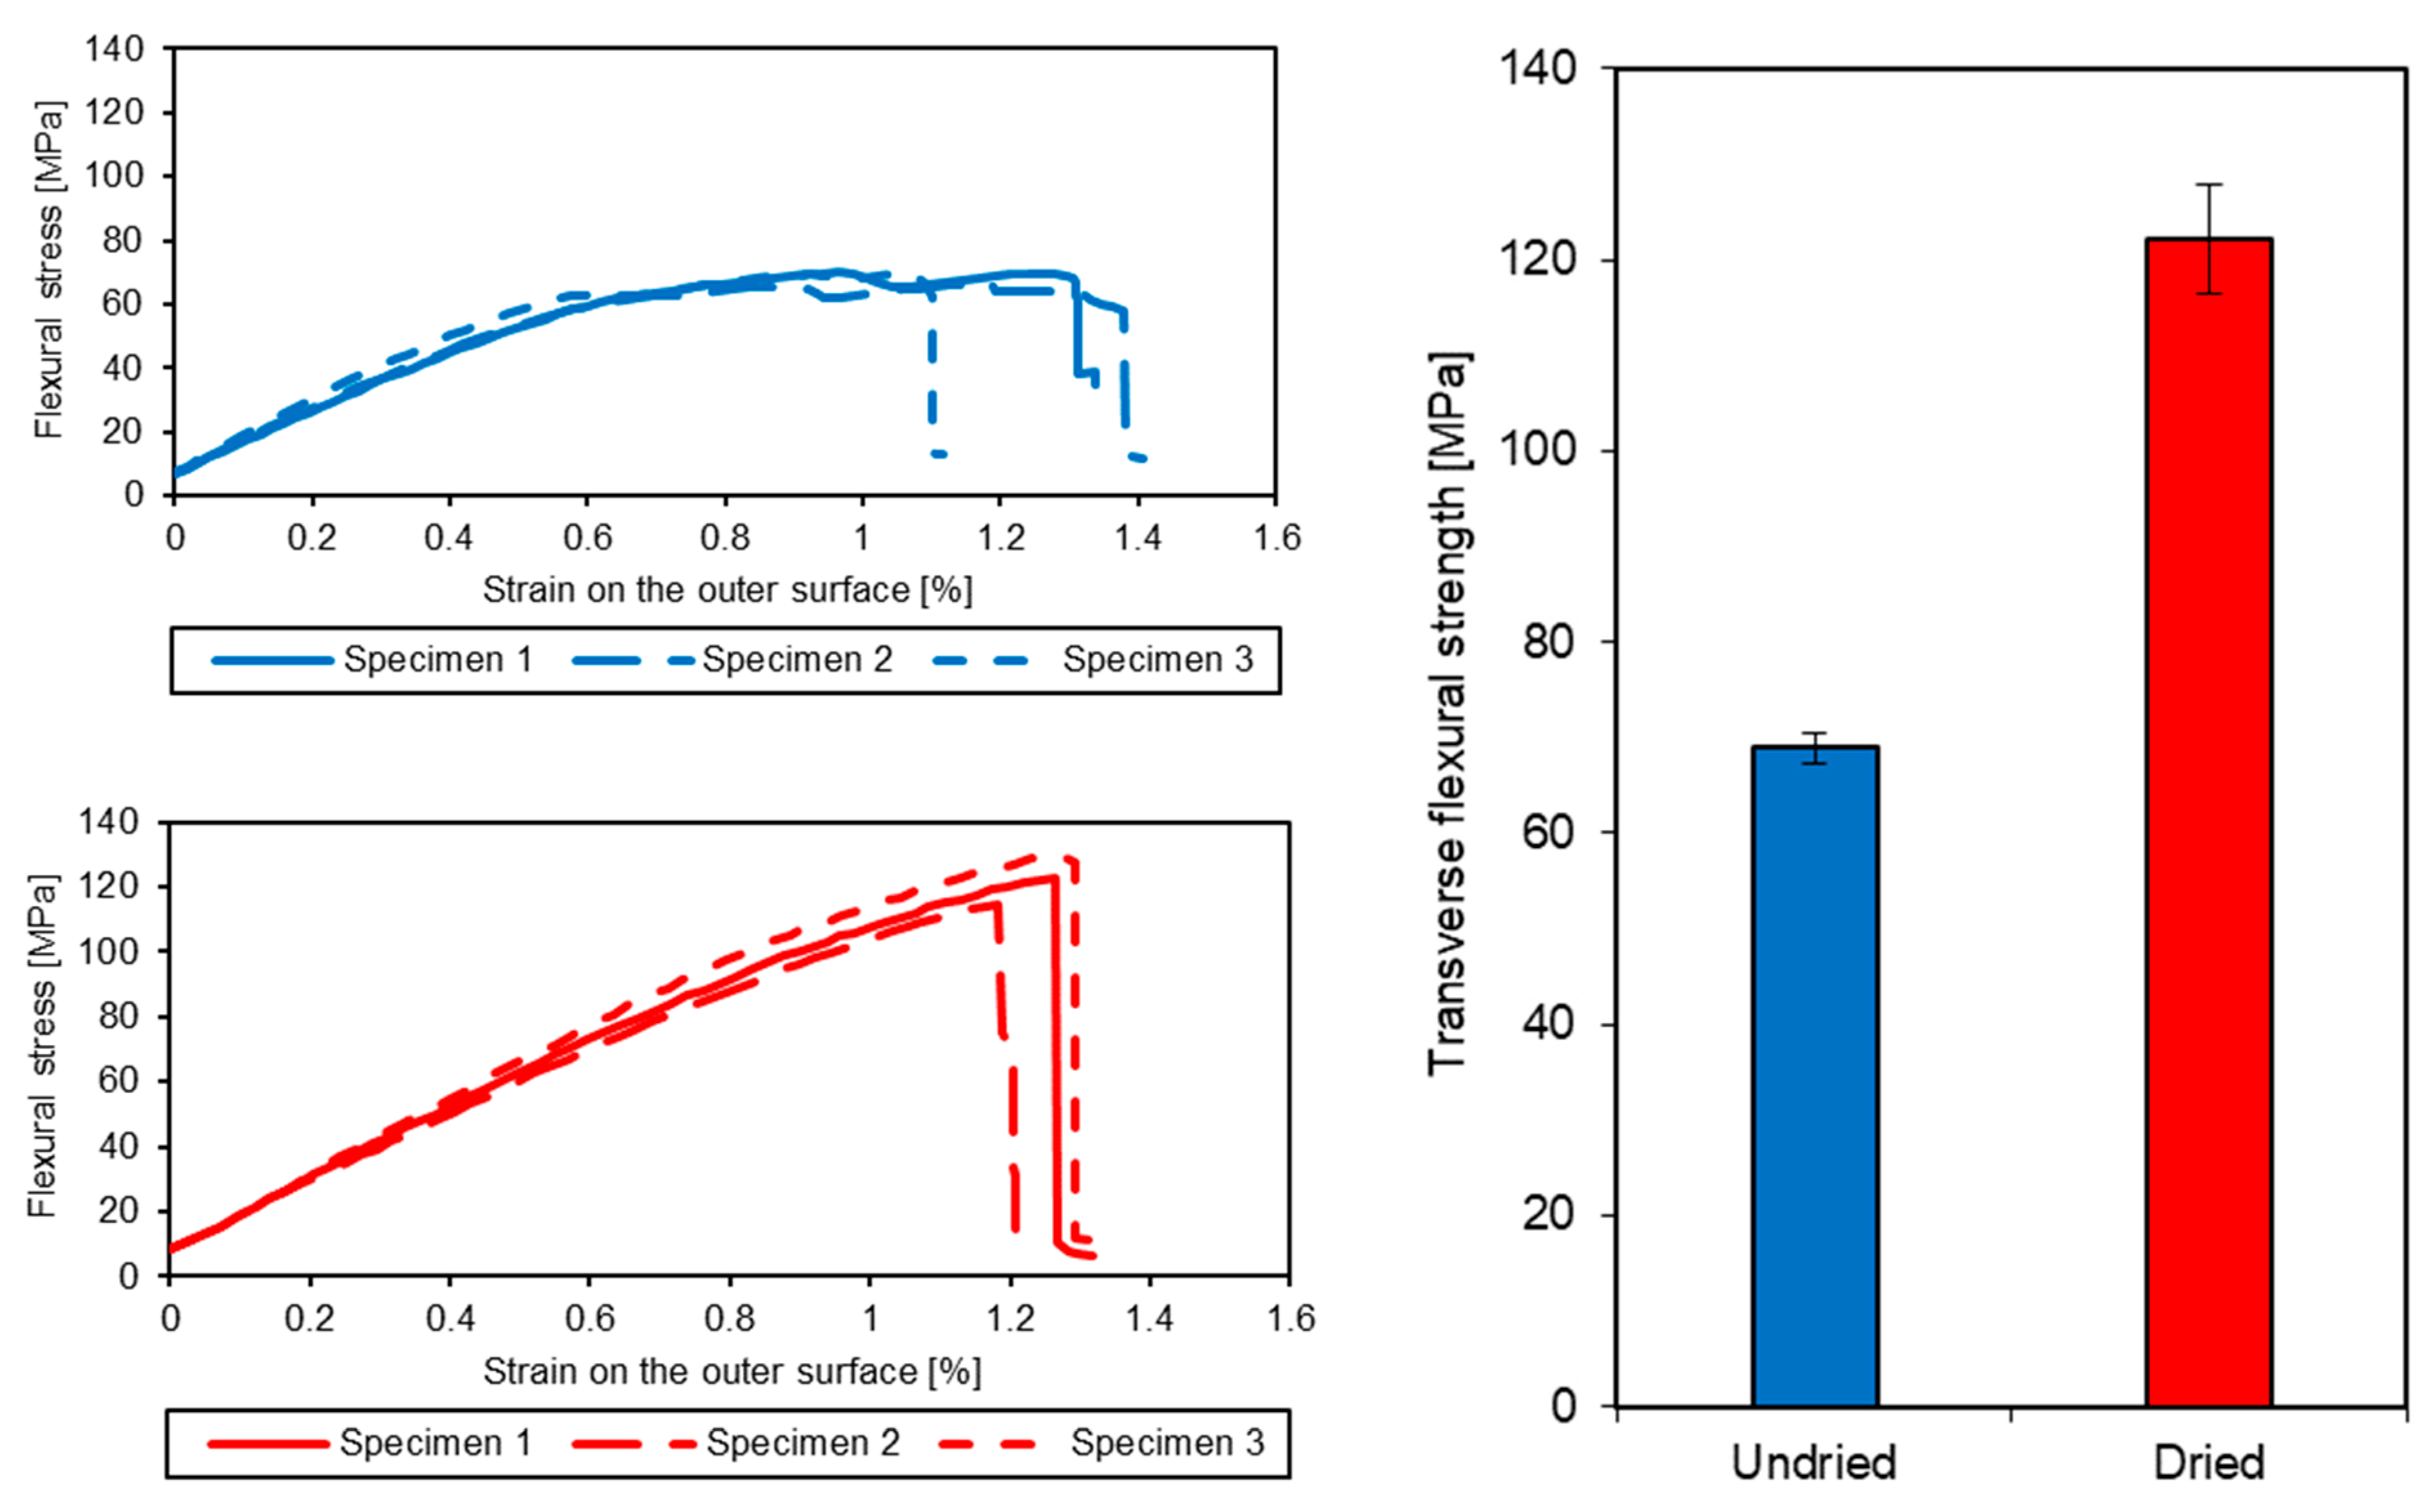
3.1. Effect of Entrapped Moisture on Epoxy Powder Composite Properties

While epoxies tend to be only slightly hygroscopic, even small amounts of moisture can have significant effects on the void content of cured composites. Grunenfelder and Nutt [35] studied this effect by first conditioning VBO prepreg samples at 35 °C with 70, 80, and 90% RH, and then by measuring their moisture contents using both thermogravimetric analysis and Fischer titration. Under autoclave pressures (e.g., 6 atm) they found that void growth was easily suppressed. For VBO conditions (i.e., 1 atm), however, the vapour pressure of entrapped moisture was sufficient to form up to 2.62% voids by volume. Moreover, the void content increased as a function of the initial moisture content.
As described in Section 2.2.1, Section 2.2.2 and Section 2.2.3, two UD-GF/epoxy powder laminates were manufactured and tested to determine the effect of moisture on the composite properties. One laminate was manufactured with a drying cycle, while the other was manufactured without. Upon visual inspection, the undried laminate had visible voids on the surface of the laminate. The results of the acid digestion analysis (Table 2) revealed that while the laminates had similar FVF (circa 48%), the void content of the undried laminate was 5 times higher than that of the dried laminate.
As shown in Figure 4, the presence of voids resulted in a significant reduction in the transverse flexural strength (i.e., 43.4%). This reduction was unsurprising as void defects affect load transfer between polymer and fibres, and can aid crack growth [47]. Moreover, it was in agreement with the findings of Patou et al. [48] who reported a 40% reduction in flexural strength for woven powdered laminates when the void content increased from 1.5% to 4.5%. Using SEM, voids were also observed at the fracture surface of the undried test specimens, confirming their influence on mechanical failure (see Figure 5). In contrast, the absence of void defects at the fracture surface of the dried specimens indicated that failure did not occur due to voids in that case.

3.2. Sorption Behaviour of Epoxy Powder

For polymer powders, adsorption occurs via electrostatic interaction with functional groups on the polymer chains [42]. This can be achieved both on the outer surface of the powder particles and within the bulk polymer. The latter requires diffusion through the polymer chains to reach the adsorption sites. The adsorption process varies as a function of numerous parameters, such as time, temperature, relative humidity (RH), chemical structure, etc.
To investigate the sorption behaviour of epoxy powder, DVS analyses were performed for a range of conditions, as described in Section 2.2.4. An initial analysis was performed at ambient temperature (23 °C) to determine its behaviour for typical storage conditions (see Figure 6).
For each step, the initial step change response in water content indicated that water vapour was being adsorbed/desorbed to/from the surface of the epoxy powder particles; however, equilibrium was not achieved at 75% RH or 90% RH. The gradual increase in water content at higher % RH was indicative of continued water diffusion into the powder particles. In relation to this latter point, plotting water content against relative humidity (see Figure 7) revealed hysteresis in the 23 °C isotherm. It should also be noted that Figure 7 is a type II isotherm. This is typical behaviour for polymers, which are nonporous networks of tangled macromolecules [42].
To investigate how the sorption behaviour varied with temperature, additional isothermal tests were run at 35 °C and 45 °C. Figure 8 shows that temperature had a strong effect on the rate of sorption: at 35 °C, equilibrium was reached in 30–60 min; at 45 °C, equilibrium was reached within several minutes. The water content at each RH also changed with temperature, e.g., at 23 °C, 1.1 wt% was reached, while at 35 °C, 1.36 wt% was reached. As such, for the range of conditions tested, the epoxy powder can be categorised as slightly hygroscopic [36].
It should be noted that for 45 °C, the epoxy powder was only tested up to 60% RH, because above this point, the epoxy passed through its glass transition and the powder began to sinter. This phenomenon has been reported by others for polymer powders [49], i.e., increases in the RH cause a reduction in the polymer’s glass transition temperature (Tg), resulting in the ‘caking’ and sintering of powders as the Tg approaches the test temperature. Even in the ‘caked’ state, handling becomes difficult as the powder particles have already begun to melt and adhere together. This can be problematic for processes like powder towpregging, where a high degree of control is required for uniform powder deposition [50]. As such, the relationship between the Tg and RH is important for the storage stability of epoxy powders.
To further explore the effects of caking and sintering, additional DVS analyses were performed at higher temperatures with smaller RH increments. The test data for 45 °C and 50 °C are shown in Figure 9. At 45 °C, the water content of the powder temporarily equilibrated between 16% RH and 26% RH, before increasing again due to bulk adsorption and surface adsorption. This is indicative of the glass transition, as reported by Burnett et al. for amorphous materials under linearly increasing RH [51]. Above 80% RH, sintering occurred due to the collapse of the powder structure under its own weight. This separation of glass transition from sintering is akin to the separation between melting and sintering observed by Greco and Maffezzoli for polymer powders [52]. They found that the sintering process lagged behind the melting process due to the high initial viscosity of the polymer. In this regard, the viscosity of epoxy powder has been recorded as high as 20,000 Pa s at 70 °C [26]. This separation, or lag, has also been observed for epoxy powder when comparing DSC data to powder compaction data [53].
The sintering process was clearer for the test at 50 °C, during which the slope of the water content curve changed suddenly at approx. 50% RH. It should be noted that the glass transition is not observed for 50 °C, as the test temperature was already above the glass transition temperature. For both 45 °C and 50 °C, the change in slope of the desorption curve (compared to the adsorption curve) was further indication of sintering. Moreover, post-test, visual observation confirmed that both sets of powder samples had completely sintered. This confirmed that the glass transition and sintering process were dependent on RH as well as temperature. While this is of interest for storage and handling, Burnett et al. [51] demonstrated that a more complete series of testing is required to fully characterise the relationship between phase transitions and time, temperature, and relative humidity. As the study herein is predominantly focused on composite manufacturing under VBO conditions (i.e., in the absence of humidity), full characterisation of the relationship is outside the current scope of work. Nevertheless, it should be noted that it is standard industrial practice to store epoxy powder in sealed containers under controlled conditions (e.g., 23 °C, 50–60% RH) to avoid caking.
More critical for VBO processing of epoxy powder composites, Figure 9 showed that the form of the epoxy (i.e., powder or sintered) had a significant impact on the sorption behaviour, with epoxy powder having a greater surface area-to-volume ratio than sintered epoxy. Padaki and Drzal [43] also studied this phenomenon when developing powder towpreg. They modelled moisture diffusion in powder particles and showed that the diffusion time increases with increasing particle size. Although their study did not consider sorption phenomena, it stands to reason that moisture removal for smaller particles was dominated by desorption due to their higher surface area-to-volume ratio. In contrast, moisture diffusion through the bulk polymer would have played a larger role as the particle size increased. As noted above, temperature also plays a significant role; however, temperature dependencies were not accounted for in their model.
As a final analysis, sintered flakes of epoxy were tested at 35 °C, as shown in Figure 10. The characteristics of the water uptake differed greatly from the previous epoxy powder samples. This was most likely due to the reduced surface area of the epoxy, which impacted the sorption mechanism, forcing water to diffuse through the polymer to find adsorption sites. Consequently, equilibrium was not achieved at each RH and the test was stopped prematurely due to time limitations.
The behaviour displayed by sintered epoxy in Figure 10 is directly linked to the lengthiness of drying cycles for conventional VBO prepregs (i.e., >16 h for large laminates [54]). It suggests that, by using powder semi-pregs, the drying process can be transitioned away from being diffusion-controlled towards being sorption-controlled. In doing so, manufacturers may be able to reduce their drying times significantly.
While the results of the DVS analyses were promising, further research was required to test the hypothesis that the drying cycle time could be reduced significantly. To do this, the modified LDF model described in Section 2.3.1 was fit to the initial desorption step of each DVS analysis. The results of the model are shown plotted along with the DVS data in Figure 11.
As previously discussed, the DVS data displayed high rates of desorption initially (0.4 wt% within 30 min or less), followed by gradual water loss (i.e., 0.1 wt% or less) over a period of hours as the RH reached equilibrium. Note, the gradual equilibration of RH can be observed within the first 8 h of the test in Figure 6. This effect at low RH, along with the other considerations outlined in Section 2.3.1, meant that a modified LDF model was used to achieve a semi-empirical fit for the DVS data, with an R2 value above 0.95 in each case. While the model did not capture the physics of the behaviour, it was deemed sufficient for predicting water content during the drying stage of the composite manufacturing process. In this way, the model could be combined with an existing process simulation tool to investigate the drying stage holistically, i.e., accounting for heat transfer and powder sintering.

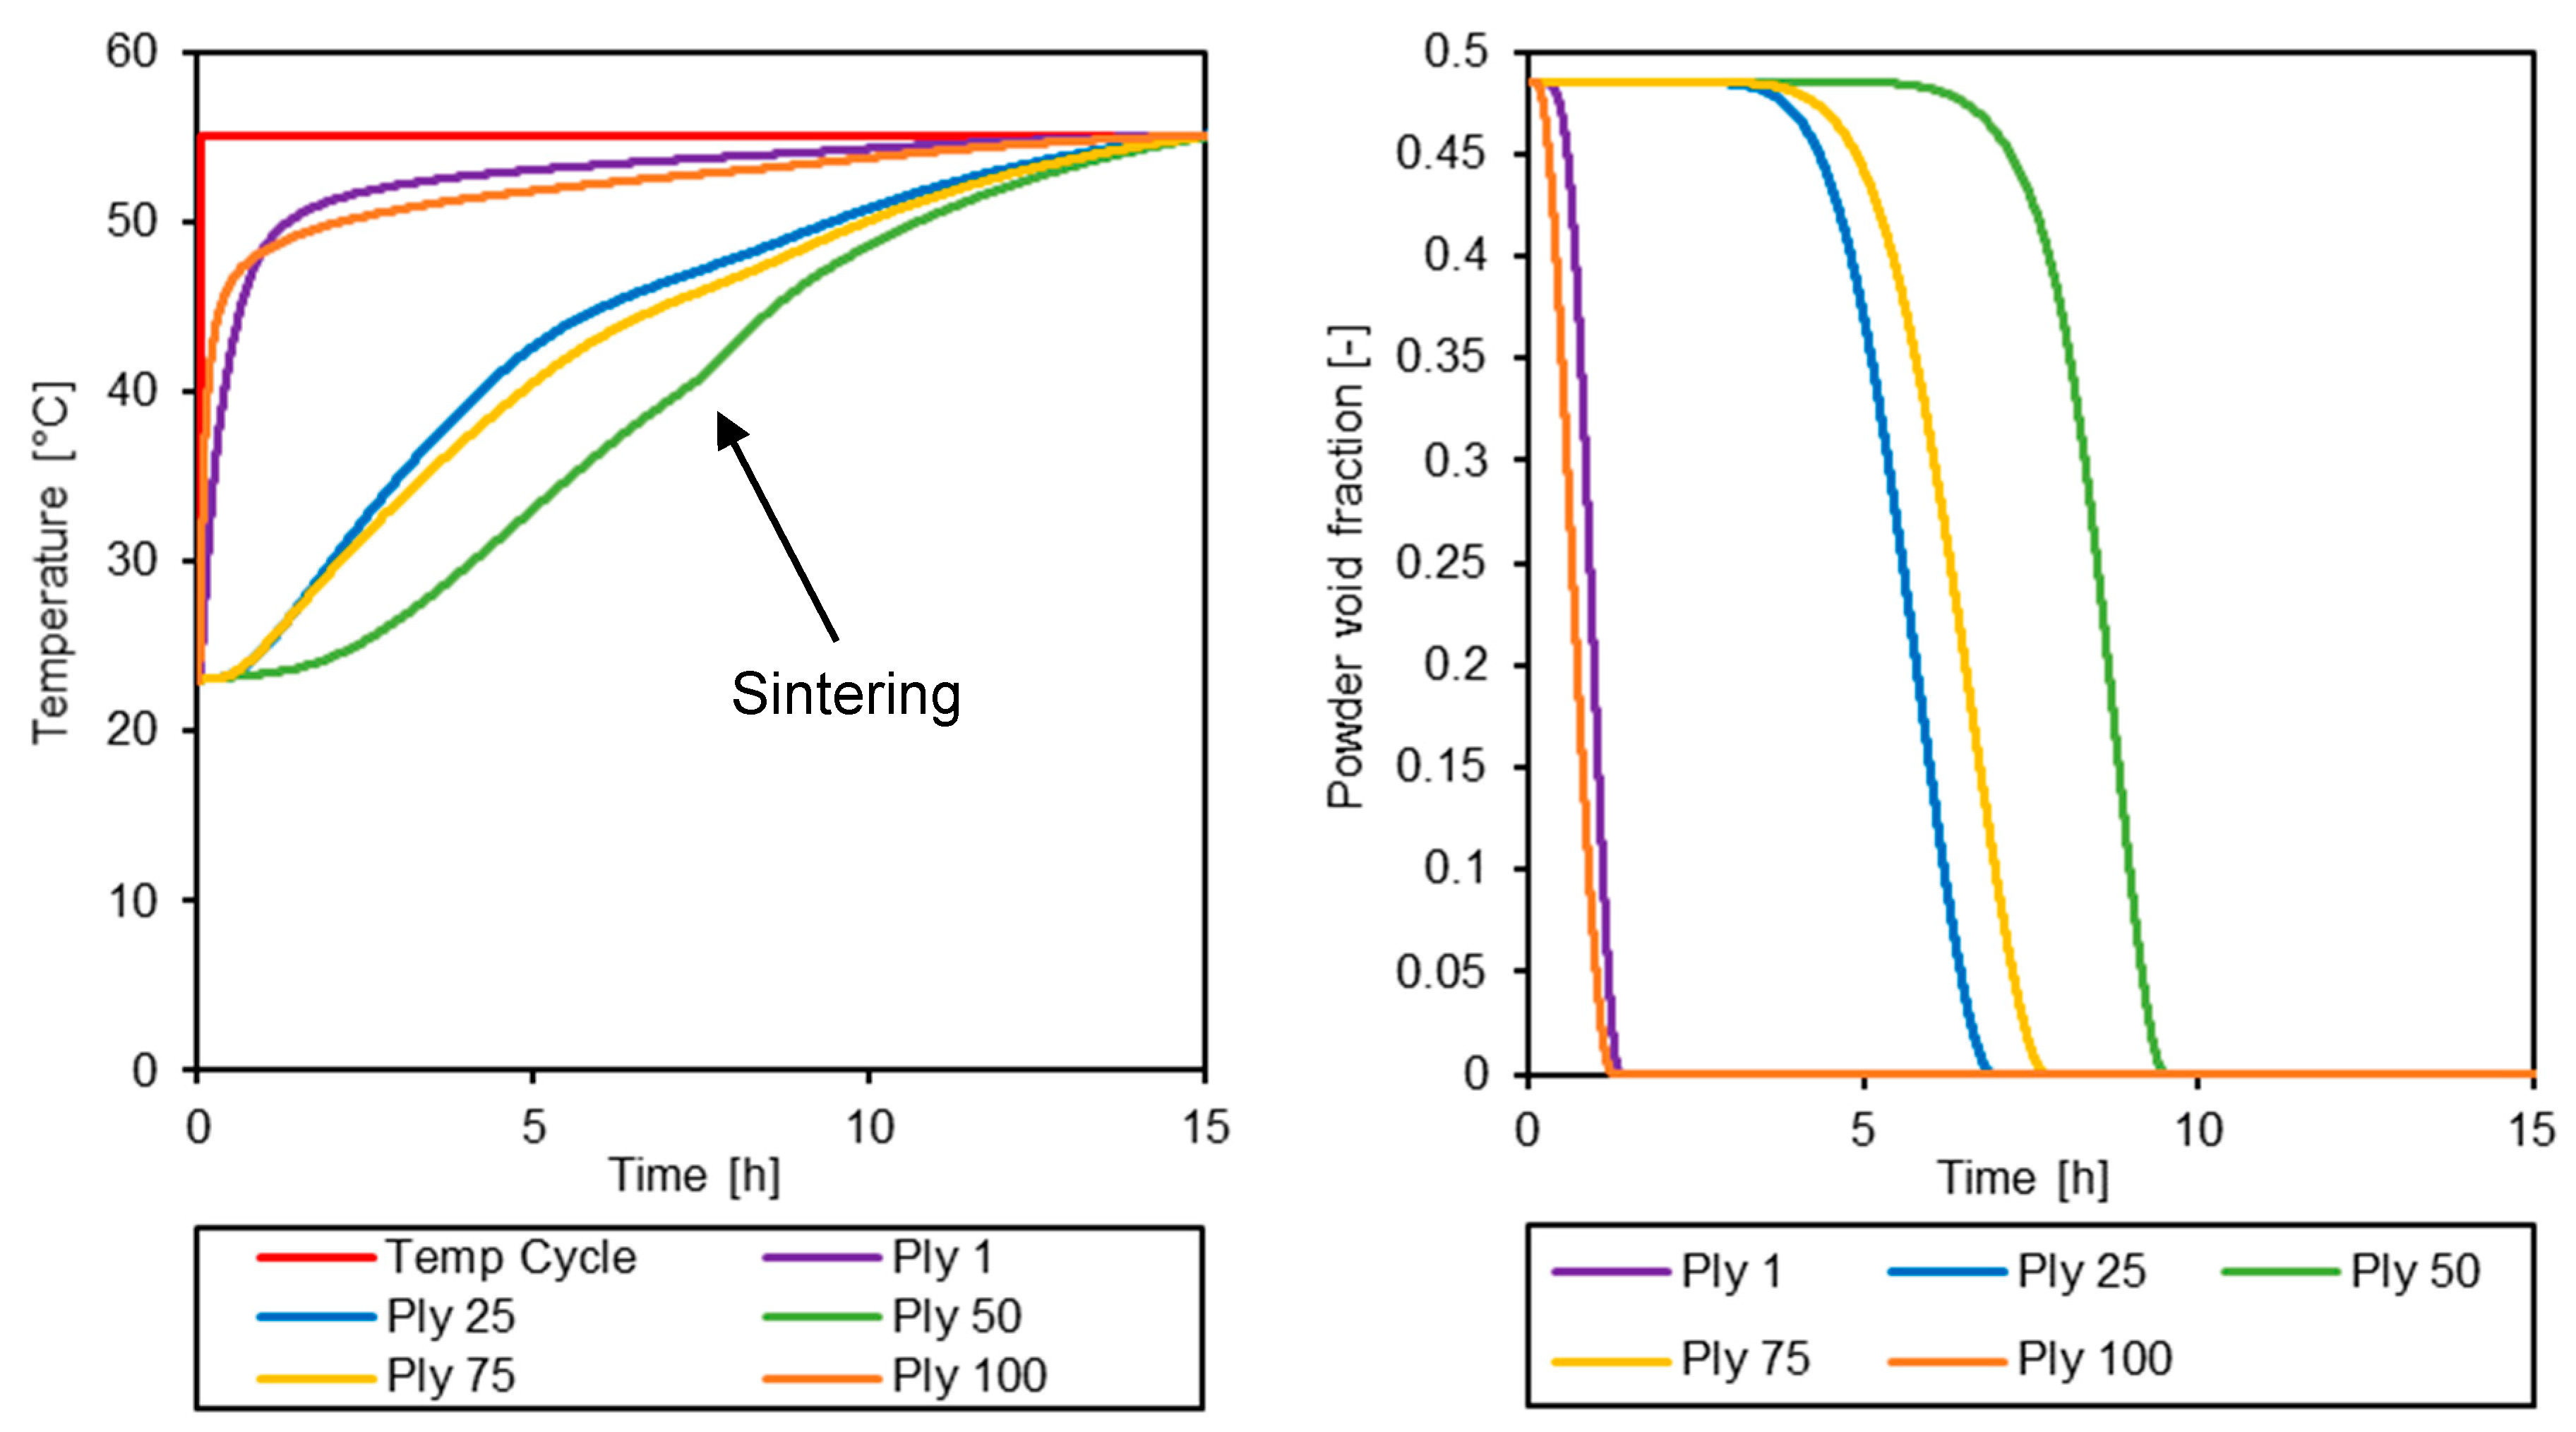
3.3. Simulation of the Drying Process

As an initial investigation, a two-ply laminate was simulated for three linear temperature ramps (0.75, 1.5, and 3 °C/min) from 23 °C to 120 °C. These simulations were performed to predict the water content of the undried laminate described in Section 3.1, and to determine how it would be influenced by the temperature ramp rate. As shown in Figure 12, the epoxy powder was not fully dried for any of the simulated heating rates (plateauing near 0.05 wt% in each case), thus confirming that a low-temperature dwell period was necessary to fully dry the composite. Predominantly, this was due to the powder sintering above 40 °C, which inhibited the release of water. It should be noted that the 1.5 °C/min simulation replicated the process cycle used for the undried composite test laminate described in Section 2.2.1, i.e., 1.5 °C/min from 23 °C to 120 °C with no drying stage. As such, it can be inferred from the simulation that as little as 0.05 wt% water content was sufficient to produce a void content (by volume) of up to 5% in the cured composite, as observed in Table 2 and Figure 5.
To investigate the drying stage under realistic conditions, a 100-ply laminate was simulated. As previously mentioned, this thickness is representative of a large blade root section. Figure 13 shows contour plots of the simulation at various time steps within the first 4 h of the drying stage. The contour plots of temperature and powder void fraction displayed an outside-to-inside profile that is characteristic of temperature-dependent processes in this material system [16,44,46]; however, heat transfer was slow within the first hour. By contrast, the water content was reduced to 0.05 wt% within that time. Moreover, the latter was largely uniform as desorption could occur as soon as vacuum pressure was applied. In reality, this profile may be less uniform if gas evacuation was modelled, as moisture on the outside of the laminate has a shorter path to evacuation. Nevertheless, as previously mentioned, it is expected that gas evacuation would be in the order of seconds/minutes due to the high permeability of the epoxy powder and fibres. As such, large gradients would not be expected to develop for water content, provided sintering does not occur before the powder is fully dried.
While the laminate appeared to be fully dried in Figure 13, closer inspection (see Figure 14) revealed that the outer plies of the laminate sintered before the water content could reach zero. By magnifying the water content plot, it was clear to see that the outer plies plateaued initially between 0.03 wt% and 0.04 wt%. Consequently, the entire 15 h dwell was required to remove the remaining entrapped moisture. As observed in previous work [46], powder sintering improved heat transfer because liquid epoxy has a higher thermal conductivity than powder; however, powder presented better characteristics for drying. Although the water diffusion from sintered/liquid epoxy was not fully modelled, the data presented in Figure 14 clearly indicated that the standard processing cycle used in industry was not efficient for drying epoxy powder composites and that sintering should be delayed until drying is complete.
To delay sintering, a second simulation was performed with a drying temperature of 40 °C; the results of which are shown in Figure 15. Relatively little sintering was predicted to occur within the first 5 h due to the temperature dependency of the sintering process. As a result, the powder in the laminate was dried to a water content of ≤0.005 wt%, i.e., the same water content achieved after 15 h of drying at 55 °C. This indicated that significant time savings can be made if the powder format is maintained during the drying stage. In the context of the standard processing cycle used by industry, resin infusion and curing may account for another 9 h of processing time. Assuming those times remain similar, shortening the drying time by 10 h would constitute a reduction of 38%. Not only would this allow for faster blade production, but drying for 5 h at 40 °C, rather than 15 h at 55 °C, would also enable energy savings within the production process. This is important considering the production process requires heating large ovens and moulds as well as the composite itself (as shown in Figure 3).

4. Conclusions

An investigation of hygroscopicity in epoxy powder composites has been performed. It has been shown that the hygroscopicity of the powder gave rise to void defects (up to 5% by volume) when epoxy powder composites were manufactured in an undried state. This had a negative effect on the mechanical properties of the composite; in particular, the transverse flexural strength (i.e., 43.4% reduction). It was shown via simulation that moisture became entrapped in the composite (approximately 0.05 wt% by mass) regardless of the heating rate due to powder sintering. As such, it was concluded that a drying stage is always required for this material system to avoid void defects.
Dynamic vapour sorption analysis was performed on the epoxy powder to better understand its sorption behaviour. This provided useful information, both for understanding the drying process and for understanding the effect of storage conditions on the epoxy powder handling. The epoxy powder displayed typical behaviour for a glassy polymer (i.e., type II isotherm), with temperature-dependent sorption kinetics. It was also shown that the epoxy powder’s glass transition temperature varied with relative humidity, with the powder sintering above the glass transition temperature. This had significant effects on the sorption behaviour of the epoxy as the surface area-to-volume ratio was drastically altered by the sintering process. From this, it was concluded that storage conditions should be controlled sufficiently to avoid powder ‘caking’ or sintering due to their detrimental effects on handling.
It was also considered that sintering should be avoided or delayed during the drying stage of composite manufacturing to ensure adequate drying. To investigate this further, a modified linear driving force model was fit to data from the initial drying stage of the dynamic vapour sorption analysis. Subsequently, this model was implemented into existing process simulation tools to simulate the drying stage. The simulations predicted that the standard drying cycle (15 h at 55 °C) used in industry would sinter the outer plies of a 100-ply thick laminate before all moisture could be removed. As a result, the full 15 h of drying was required to achieve an adequately low water content (i.e., ≤0.005 wt%) throughout the laminate. In contrast, the same simulation performed with a drying temperature of 40 °C achieved a water content of ≤0.005 wt% in all plies within 5 h. This means that the total manufacturing cycle time could be reduced by as much as 10 h for thick-section composite parts, such as those found in the roots and spars of wind and tidal turbine blades. For this reason, it can be concluded that their powder format should be maintained during the drying stage of manufacturing to maximise the advantages of epoxy powder composites.

Author Contributions

J.M.M.: Conceptualisation, Methodology, Software, Validation, Formal analysis, Investigation, Writing—Original Draft, Visualisation, Project administration. J.-Y.W.: Methodology, Writing—Review and Editing. C.M.Ó.B.: Conceptualisation, Resources, Writing—Review and Editing, Supervision, Project administration, Funding acquisition. All authors have read and agreed to the published version of the manuscript.

Funding

This research was funded by the Institute of Materials and Processes at the University of Edinburgh, Science Foundation Ireland’s MaREI (Marine Renewable Energy Ireland) Centre, and the University of Galway.

Data Availability Statement

The raw data supporting the conclusions of this article will be made available by the authors on request.

Acknowledgments

We acknowledge Composites Testing Laboratory (CTL, Ireland) for their assistance in performing mechanical testing and void content analysis, Éadaoin Timmins of NCBES (University of Galway) for assistance with performing SEM, and the University of Edinburgh’s School of Geosciences for performing particle size analysis. We also acknowledge the support of industrial partners Johns Manville and EireComposites Teo. For the purpose of open access, the author has applied a Creative Commons Attribution (CC BY) licence to any Author Accepted Manuscript version arising from this submission.

Conflicts of Interest

The authors declare that they have no known competing financial interests or personal relationships that could have appeared to influence the work reported in this paper.

References

  1. Johnson, T. Boeing’s 787 Dreamliner—How Composites and Carbon Fiber Are Used. Available online: https://www.thoughtco.com/boeings-787-dreamliner-820385 (accessed on 29 December 2023).
  2. NES Fircroft. The Biggest Wind Turbines in the World. Available online: https://www.nesfircroft.com/resources/blog/the-biggest-wind-turbines-in-the-world/ (accessed on 29 December 2023).
  3. Agarwal, B.D.; Broutman, L.J.; Chandrashekhara, K. Chapter 2—Fibers, Matrices, and Fabrication of Composites. In Analysis and Performance of Fiber Composites; John Wiley & Sons, Inc.: Hoboken, NJ, USA, 2006; ISBN 978-0-471-26891-8. [Google Scholar]
  4. Advani, S.G.; Hsiao, K.-T. 1—Introduction to Composites and Manufacturing Processes. In Manufacturing Techniques for Polymer Matrix Composites (PMCs); Woodhead Publishing Limited: Cambridge, UK, 2012; pp. 1–12. ISBN 9780857090676. [Google Scholar]
  5. Brody, J.C.; Gillespie, J.W. Reactive and Non-Reactive Binders in Glass/Vinyl Ester Composites. Polym. Compos. 2005, 26, 377–387. [Google Scholar] [CrossRef]
  6. Lionetto, F.; Moscatello, A.; Maffezzoli, A. Effect of Binder Powders Added to Carbon Fiber Reinforcements on the Chemoreology of an Epoxy Resin for Composites. Compos. Part B Eng. 2016, 112, 243–250. [Google Scholar] [CrossRef]
  7. Daelemans, L.; van der Heijden, S.; De Baere, I.; Muhammad, I.; Van Paepegem, W.; Rahier, H.; De Clerck, K. Bisphenol A Based Polyester Binder as an Effective Interlaminar Toughener. Compos. Part B Eng. 2015, 80, 145–153. [Google Scholar] [CrossRef]
  8. Wu, W.; Klunker, F.; Xie, L.; Jiang, B.; Ziegmann, G. Simultaneous Binding and Ex Situ Toughening Concept for Textile Reinforced PCBT Composites: Influence of Preforming Binders on Interlaminar Fracture Properties. Compos. Part A Appl. Sci. Manuf. 2013, 53, 190–203. [Google Scholar] [CrossRef]
  9. Schmidt, S.; Mahrholz, T.; Kühn, A.; Wierach, P. Powder Binders Used for the Manufacturing of Wind Turbine Rotor Blades. Part 2. Investigation of Binder Effects on the Mechanical Performance of Glass Fiber Reinforced Polymers. J. Compos. Mater. 2019, 53, 2261–2270. [Google Scholar] [CrossRef]
  10. Edie, D.; Lickfield, G.C.; Allen, L.E.; McCollum, J.R. Thermoplastic Coating of Carbon Fibres; The National Aeronautics and Space Administration Langley Research Center: Langley, VA, USA, 1989.
  11. Miller, A.; Wei, C.; Gibson, A.G. Manufacture of Polyphenylene Sulfide (PPS) Matrix Composites via the Powder Impregnation Route. Compos. Part A Appl. Sci. Manuf. 1996, 27, 49–56. [Google Scholar] [CrossRef]
  12. Allred, R.E.; Wesson, S.P.; Babow, D.A. Powder Impregnation Studies for High Temperature Towpregs. SAMPE J. 2004, 40, 40–48. [Google Scholar]
  13. Novo, P.J.; Silva, J.F.; Nunes, J.P.; Marques, A.T. Pultrusion of Fibre Reinforced Thermoplastic Pre-Impregnated Materials. Compos. Part B Eng. 2016, 89, 328–339. [Google Scholar] [CrossRef]
  14. Çelik, M.; Noble, T.; Haseeb, A.; Maguire, J.; Robert, C.; Ó Brádaigh, C.M. Contact Resistance Heating of Unidirectional Carbon Fibre Tows in a Powder-Epoxy Towpregging Line. Plast. Rubber Compos. 2022, 51, 383–392. [Google Scholar] [CrossRef]
  15. Mitschang, P.; Blinzler, M.; Wöginger, A. Processing Technologies for Continuous Fibre Reinforced Thermoplastics with Novel Polymer Blends. Compos. Sci. Technol. 2003, 63, 2099–2110. [Google Scholar] [CrossRef]
  16. Maguire, J.M.; Sharp, N.D.; Pipes, R.B.; Ó Brádaigh, C.M. Advanced Process Simulations for Thick-Section Epoxy Powder Composite Structures. Compos. Part A Appl. Sci. Manuf. 2022, 161, 107073. [Google Scholar] [CrossRef]
  17. Finnegan, W.; Allen, R.; Glennon, C.; Maguire, J.; Flanagan, M.; Flanagan, T. Manufacture of High-Performance Tidal Turbine Blades Using Advanced Composite Manufacturing Technologies. Appl. Compos. Mater. 2021, 28, 2061–2086. [Google Scholar] [CrossRef] [PubMed]
  18. Feuillerat, L.; De Almeida, O.; Fontanier, J.C.; Schmidt, F. Effect of Poly(Ether Ether Ketone) Degradation on Commingled Fabrics Consolidation. Compos. Part A Appl. Sci. Manuf. 2021, 149, 106482. [Google Scholar] [CrossRef]
  19. Janzen, J.P.; May, D. Solid Epoxy Prepregs with Patterned Resin Distribution: Influence of Pattern and Process Parameters on Part Quality in Vacuum-Bag-Only Processing. Polym. Compos. 2023, 44, 8153–8167. [Google Scholar] [CrossRef]
  20. Çelik, M.; Maguire, J.M.; Noble, T.; Robert, C.; Ó Brádaigh, C.M. Numerical and Experimental Investigation of Joule Heating in a Carbon Fibre Powder Epoxy Towpregging Line. Compos. Part A Appl. Sci. Manuf. 2023, 164, 107285. [Google Scholar] [CrossRef]
  21. Asensio, M.; Esfandiari, P.; Núñez, K.; Silva, J.F.; Marques, A.; Merino, J.C.; Pastor, J.M. Processing of Pre-Impregnated Thermoplastic Towpreg Reinforced by Continuous Glass Fibre and Recycled PET by Pultrusion. Compos. Part B Eng. 2020, 200, 108365. [Google Scholar] [CrossRef]
  22. Ramasamy, A.; Wang, Y.; Muzzy, J. Braided Thermoplastic Composites from Powder-Coated Towpregs. Part I: Towpreg Characterization. Polym. Compos. 1996, 17, 497–504. [Google Scholar] [CrossRef]
  23. Gruber, M.B.; Lockwood, I.Z.; Dolan, T.L.; Funck, S.B.; Tierney, J.; Simacek, P.; Gillespie, J.; Advani, S.G.; Jensen, B.J.; Cano, R.J.; et al. Thermoplastic in Situ Placement Requires Better Impregnated Tapes and Tows. In Proceedings of the International SAMPE Technical Conference, Baltimore, MD, USA, 21–24 May 2012. [Google Scholar]
  24. Grunenfelder, L.K.; Nutt, S.R. Prepreg Age Monitoring via Differential Scanning Calorimetry. J. Reinf. Plast. Compos. 2012, 31, 295–302. [Google Scholar] [CrossRef]
  25. Grunenfelder, L.K.; Centea, T.; Hubert, P.; Nutt, S.R. Effect of Room-Temperature out-Time on Tow Impregnation in an out-of-Autoclave Prepreg. Compos. Part A Appl. Sci. Manuf. 2013, 45, 119–126. [Google Scholar] [CrossRef]
  26. Maguire, J.M.; Nayak, K.; Ó Brádaigh, C.M. Characterisation of Epoxy Powders for Processing Thick-Section Composite Structures. Mater. Des. 2018, 139, 112–121. [Google Scholar] [CrossRef]
  27. Floreani, C.; Cuthill, F.; Steynor, J.; Maguire, J.M.; McCarthy, E.D.; Niessink, M.J.; Di Noi, S.; Wittevrongel, L.; Flanagan, T.; Ó Brádaigh, C.M.; et al. Testing of a 6 m Hybrid Glass/Carbon Fibre Powder Epoxy Composite Wind Blade Demonstrator. SAMPE J. 2021, 57, 6–14. [Google Scholar]
  28. Kratz, J.; Hubert, P. Anisotropic Air Permeability in Out-of-Autoclave Prepregs: Effect on Honeycomb Panel Evacuation Prior to Cure. Compos. Part A Appl. Sci. Manuf. 2013, 49, 179–191. [Google Scholar] [CrossRef]
  29. Kourkoutsaki, T.; Comas-Cardona, S.; Binetruy, C.; Upadhyay, R.K.; Hinterhoelzl, R. The Impact of Air Evacuation on the Impregnation Time of Out-of-Autoclave Prepregs. Compos. Part A Appl. Sci. Manuf. 2015, 79, 30–42. [Google Scholar] [CrossRef]
  30. Zhang, D.; Heider, D.; Gillespie, J.W. Void Reduction of High-Performance Thermoplastic Composites via Oven Vacuum Bag Processing. J. Compos. Mater. 2017, 51, 4219–4230. [Google Scholar] [CrossRef]
  31. Sequeira Tavares, S.; Michaud, V.; Månson, J.-A. Through Thickness Air Permeability of Prepregs during Cure. Compos. Part A Appl. Sci. Manuf. 2009, 40, 1587–1596. [Google Scholar] [CrossRef]
  32. Grunenfelder, L.K.; Dills, A.; Centea, T.; Nutt, S. Effect of Prepreg Format on Defect Control in Out-of-Autoclave Processing. Compos. Part A Appl. Sci. Manuf. 2017, 93, 88–99. [Google Scholar] [CrossRef]
  33. Schechter, S.G.K.; Centea, T.; Nutt, S. Effects of Resin Distribution Patterns on Through-Thickness Air Removal in Vacuum-Bag-Only Prepregs. Compos. Part A Appl. Sci. Manuf. 2020, 130, 105723. [Google Scholar] [CrossRef]
  34. Schechter, S.G.K.; Grunenfelder, L.K.; Nutt, S.R. Air Evacuation and Resin Impregnation in Semi-Pregs: Effects of Feature Dimensions. Adv. Manuf. Polym. Compos. Sci. 2020, 6, 101–114. [Google Scholar] [CrossRef]
  35. Grunenfelder, L.K.; Nutt, S.R. Void Formation in Composite Prepregs—Effect of Dissolved Moisture. Compos. Sci. Technol. 2010, 70, 2304–2309. [Google Scholar] [CrossRef]
  36. Allada, R.; Maruthapillai, A.; Palanisamy, K.; Chappa, P. Hygroscopicity Categorization of Pharmaceutical Solids by Gravimetric Sorption Analysis: A Systematic Approach. Asian J. Pharm. 2016, 10, 279–286. [Google Scholar]
  37. Mohan, J.; Ivanković, A.; Murphy, N. Effect of Prepreg Storage Humidity on the Mixed-Mode Fracture Toughness of a Co-Cured Composite Joint. Compos. Part A Appl. Sci. Manuf. 2013, 45, 23–34. [Google Scholar] [CrossRef]
  38. Agius, S.L.; Magniez, K.J.C.; Fox, B.L. Cure Behaviour and Void Development within Rapidly Cured Out-of-Autoclave Composites. Compos. Part B Eng. 2013, 47, 230–237. [Google Scholar] [CrossRef]
  39. Sharp, N.; Li, C.; Strachan, A.; Adams, D.; Pipes, R.B. Effects of Water on Epoxy Cure Kinetics and Glass Transition Temperature Utilizing Molecular Dynamics Simulations. J. Polym. Sci. Part B Polym. Phys. 2017, 55, 1150–1159. [Google Scholar] [CrossRef]
  40. Kim, D.; Centea, T.; Nutt, S.R. Modelling and Monitoring of Out-Time and Moisture Absorption Effects on Cure Kinetics and Viscosity for an out-of-Autoclave (OoA) Prepreg. Compos. Sci. Technol. 2017, 138, 201–208. [Google Scholar] [CrossRef]
  41. Netzel, C.; Hoffmann, D.; Battley, M.; Hubert, P.; Bickerton, S. Effects of Environmental Conditions on Uncured Prepreg Characteristics and Their Effects on Defect Generation during Autoclave Processing. Compos. Part A Appl. Sci. Manuf. 2021, 151, 106636. [Google Scholar] [CrossRef]
  42. Toribio, F.; Bellat, J.P.; Nguyen, P.H.; Dupont, M. Adsorption of Water Vapor by Poly(Styrenesulfonic Acid), Sodium Salt: Isothermal and Isobaric Adsorption Equilibria. J. Colloid Interface Sci. 2004, 280, 315–321. [Google Scholar] [CrossRef] [PubMed]
  43. Padaki, S.; Drzal, L.T. A Simulation Study on the Effects of Particle Size on the Consolidation of Polymer Powder Impregnated Tapes. Compos. Part A Appl. Sci. Manuf. 1999, 30, 325–337. [Google Scholar] [CrossRef]
  44. Maguire, J.M.; Nayak, K.; Ó Brádaigh, C.M. Novel Epoxy Powder for Manufacturing Thick-Section Composite Parts under Vacuum-Bag-Only Conditions. Part II: Experimental Validation and Process Investigations. Compos. Part A Appl. Sci. Manuf. 2020, 136, 105970. [Google Scholar] [CrossRef]
  45. Sircar, S.; Hufton, J.R. Why Does the Linear Driving Force Model for Adsorption Kinetics Work? Adsorption 2000, 6, 137–147. [Google Scholar] [CrossRef]
  46. Maguire, J.M.; Simacek, P.; Advani, S.G.; Ó Brádaigh, C.M. Novel Epoxy Powder for Manufacturing Thick-Section Composite Parts under Vacuum-Bag-Only Conditions. Part I: Through-Thickness Process Modelling. Compos. Part A Appl. Sci. Manuf. 2020, 136, 105969. [Google Scholar] [CrossRef]
  47. Mehdikhani, M.; Gorbatikh, L.; Verpoest, I.; Lomov, S.V. Voids in Fiber-Reinforced Polymer Composites: A Review on Their Formation, Characteristics, and Effects on Mechanical Performance. J. Compos. Mater. 2019, 53, 1579–1669. [Google Scholar] [CrossRef]
  48. Patou, J.; Bonnaire, R.; De Luycker, E.; Bernhart, G. Influence of Consolidation Process on Voids and Mechanical Properties of Powdered and Commingled Carbon/PPS Laminates. Compos. Part A Appl. Sci. Manuf. 2019, 117, 260–275. [Google Scholar] [CrossRef]
  49. Yuan, X.; Carter, B.P.; Schmidt, S.J. Determining the Critical Relative Humidity at Which the Glassy to Rubbery Transition Occurs in Polydextrose Using an Automatic Water Vapor Sorption Instrument. J. Food Sci. 2011, 76, E78–E89. [Google Scholar] [CrossRef] [PubMed]
  50. Hasrin, H.; Noble, T.; Kamarudin, A.; Ó Brádaigh, C.M.; Robert, C. Powder Epoxy Towpreg Consolidation Using Compaction Roller System. In Proceedings of the SAMPE Europe Conference, Madrid, Spain, 3–5 October 2023. [Google Scholar]
  51. Burnett, D.J.; Thielmann, F.; Booth, J. Determining the Critical Relative Humidity for Moisture-Induced Phase Transitions. Int. J. Pharm. 2004, 287, 123–133. [Google Scholar] [CrossRef]
  52. Greco, A.; Maffezzoli, A. Polymer Melting and Polymer Powder Sintering by Thermal Analysis. J. Therm. Anal. Calorim. 2003, 72, 1167–1174. [Google Scholar] [CrossRef]
  53. Maguire, J.M. Processing of Thick Section Epoxy Powder Composite Structures. Ph.D. Thesis, The University of Edinburgh, Edinburgh, UK, 2019. [Google Scholar]
  54. Centea, T.; Grunenfelder, L.K.; Nutt, S.R. A Review of Out-of-Autoclave Prepregs—Material Properties, Process Phenomena, and Manufacturing Considerations. Compos. Part A Appl. Sci. Manuf. 2015, 70, 132–154. [Google Scholar] [CrossRef]
Figure 1. Illustrations of powder-based composite systems. (Left) Microstructure of powder towpreg with powder dispersed between fibres. (Middle) Macrostructure of fibre reinforcement coated with powder binder (note: tows are bundles of fibres used to create fabrics). (Right) Macrostructure of fibre reinforcement which has been partially impregnated with powder (i.e., powder semi-preg).
Powders 03 00011 g001
Figure 2. Details of epoxy powder particle size. (Top Left) Micrograph of epoxy powder at ×5 magnification. (Top Right) Micrograph of epoxy powder at ×20 magnification. (Bottom) Differential volume distribution of epoxy particles based on size (i.e., diameter).
Powders 03 00011 g002aPowders 03 00011 g002b
Figure 3. Schematic of a thick epoxy powder composite part being manufactured in an oven using VBO processing. Air/moisture is drawn out of the part using a vacuum pump connected to the vacuuming bag.
Powders 03 00011 g003
Figure 4. Results of the transverse flexural testing. (Top Left) Stress–strain data for undried test specimens. (Bottom Left) Stress–strain data for the dried test specimens. (Right) Mean transverse flexure strengths for both sets of specimens, with error bars representing ±1 standard deviation.
Powders 03 00011 g004
Figure 5. Scanning electron micrographs showing the fracture surface of the transverse flexural test specimens. (Top) Macroscale voids were visible at the fracture surface of the undried test specimens, while none were visible for the dried test specimens (Bottom). Note, for both top and bottom, the left micrograph shows ×35 magnification, while the right shows ×200 magnification.
Powders 03 00011 g005aPowders 03 00011 g005b
Figure 6. DVS data for epoxy powder under isothermal conditions (23 °C). The water content changes as a function of relative humidity (RH) due to adsorption and desorption of water vapour.
Powders 03 00011 g006
Figure 7. Sorption isotherm for epoxy powder at 23 °C.
Powders 03 00011 g007
Figure 8. DVS data for the epoxy powder at three different temperatures. The sorption behaviour was highly temperature-dependent. Note, for 45 °C, epoxy powder was only tested up to 60% RH due to powder sintering.
Powders 03 00011 g008
Figure 9. DVS data (Bottom) for epoxy powder at 45 °C and 50 °C using smaller increments of RH (Top). For 45 °C, the glass transition was observed in the water content curve at approx. 10% RH. At approx. 85% RH, powder sintering caused a second transition in water uptake as the epoxy became a rubbery liquid. In this latter form, there was a dramatic change in sorption behaviour, both in terms of adsorption and desorption. This effect was more evident for the 50 °C data, where the slope of the water content curve suddenly changed at 50% RH and did not recover during desorption.
Powders 03 00011 g009
Figure 10. DVS data for flakes of sintered epoxy at 35 °C, which have been overlapped with data for powder at the same temperature. The water uptake was much slower for the sintered flakes, and equilibrium was not achieved at any RH. Consequently, the test was terminated due to time constraints.
Powders 03 00011 g010
Figure 11. (Left) DVS data plotted against the results of the modified linear driving force model. (Right) DVS data and model results plotted on a log time scale.
Powders 03 00011 g011
Figure 12. Simulation results for a two-ply thick UD-GF/epoxy powder laminate. Three simulations were performed at three heating rates. The water content plateaued at approx. 0.05 wt% in each case. Note, the water content is a weight percentage of the epoxy powder, not of the whole laminate.
Powders 03 00011 g012
Figure 13. Contour plots for a 1D simulation of a 100-ply laminate processed in an oven, with time progressing from left to right. A standard drying stage was applied to the laminate (i.e., 15 h at 55 °C). (Top) The temperature change was slow and non-uniform (i.e., outside-to-inside profile) due to the low thermal conductivity of the epoxy powder and glass fibres. (Middle) In contrast, a large, uniform change in water content was predicted early in the drying stage (i.e., within 1 h). (Bottom) The sintering process followed the temperature profile and resulted in significant thickness change after 1 h.
Powders 03 00011 g013
Figure 14. Simulated results for a 100-ply laminate processed using a standard drying stage (i.e., 55 °C for 15 h). Data were taken from equispaced locations through the thickness of the laminate. (Top Left) Temperature plots show that heat was slow to transfer through the laminate when in powder form, but the rate increased as the powder sintered (Top Right). (Bottom Left) Most of the moisture desorbed before the powder sintered; however, magnifying the plot (Bottom Right) revealed that the outside of the laminate (Plies 1 and 100) sintered before they could be dried completely.
Powders 03 00011 g014aPowders 03 00011 g014b
Figure 15. Simulated results for a 100-ply laminate processed using a modified drying temperature (i.e., 40 °C). Data were taken from equispaced locations through the thickness of the laminate. Lowering the drying temperature (Top Left) helped to delay sintering (Top Right). (Bottom) By keeping the epoxy in its powder form, the water content of the powder was reduced to ≤0.005 wt% within 5 h.
Powders 03 00011 g015
Table 1. Fitting parameters for the modified linear driving force model.
Parameter [Units]Value
t c [h]0.170
A k [h−1]4.937
B k [°C−1]0.030
A C [h−1]4.580
B C [°C−1]0.031
Table 2. Results of the acid digestion analysis.
LaminateFibre Volume Fraction [%]Void Content [%]
Undried47.74.80
Dried48.10.91
Disclaimer/Publisher’s Note: The statements, opinions and data contained in all publications are solely those of the individual author(s) and contributor(s) and not of MDPI and/or the editor(s). MDPI and/or the editor(s) disclaim responsibility for any injury to people or property resulting from any ideas, methods, instructions or products referred to in the content.

