
Testing Cosmic Acceleration from the Late-Time Universe

Instituto de Física, Universidad Nacional Autónoma de México, Ciudad de México 04510, Mexico
Astronomy 2023, 2(4), 300-314; https://doi.org/10.3390/astronomy2040020
Submission received: 18 August 2023
/
Revised: 1 December 2023
/
Accepted: 11 December 2023
/
Published: 14 December 2023
Abstract
:We investigate the accelerated cosmic expansion in the late universe and derive constraints on the values of the cosmic key parameters according to different cosmologies such as CDM, wCDM, and CDM. We select 24 baryon acoustic oscillation (BAO) uncorrelated measurements from the latest galaxy surveys measurements in the range of redshift combined with the Pantheon SNeIa dataset, the latest 33 measurements using the cosmic chronometers (CCs) method, and the recent Hubble constant value measurement measured by Riess 2022 (R22) as an additional prior. In the CDM framework, the model fit yields and . Combining BAO with Pantheon plus the cosmic chronometers datasets we obtain km s Mpc and the sound horizon result is Mpc. For the flat wCDM model, we obtain . For the dynamical evolution of the dark energy equation of state, CDM cosmology, we obtain . We apply the Akaike information criterion approach to compare the three models, and see that all cannot be ruled out from the latest observational measurements.
1. Introduction
The values and constraints of the cosmological parameters in the framework of CDM cosmology have been estimated and highly constrained through various observational experiments [1,2] with unprecedented accuracy. The measurement results from Planck 2018 provide robust and detailed constraints for various cosmic parameters. In the LCDM scene, [1] measured the Hubble constant indirectly to be km s Mpc, with an uncertainty below 1 km s Mpc. However, measurements of the Hubble constant in our local neighborhood at low redshifts () performed by Riess et al. [3,4,5,6,7] have caused tension and, ironically, a window of opportunity to test alternative models beyond the CDM model. In particular, the SH0ES project [4] developed a distance ladder method from standard candles known as Cepheid stars to estimate . They have been improving the precision of the value of and obtained the updated results as km s Mpc in 2022 [7]. Although the LCDM model is widely accepted by the scientific community, the current measurements of late-time accelerated cosmic expansion [7] and early-time accelerated cosmic expansion [1] disagree with each other, causing a crisis in cosmology known as Hubble tension; the discrepancy between them is situated in the range of 4–5.7. Such a discrepancy implies that either early- and late-time measurements have systematic and calibration issues or the standard cosmological model fails to describe the universe. Furthermore, this tension may provide a hint of new physics beyond the standard model. Following this motivation, a wide range of alternative models have been developed to alleviate inconsistencies between data surveys [8,9,10,11,12,13,14,15,16,17,18,19,20].
In the opposite case, many studies have been made to provide estimates of the Hubble constant based on other observations, such as quasar lensing [21,22], gravitational-wave events [23,24,25], fast radio bursts (FRBs) [26,27], megamasers [28,29,30], the red giant branch tip method (TRGS) [31,32,33], BAOs [34], etc. [35]. For example, the H0LiCOW research group [36] demonstrated another method to estimate via gravitational lensing effects. Under the CDM scenario, they obtained a value of km s Mpc [36]. The Advanced LIGO and Virgo research teams detected a gravitational-wave event GW170817 coming from a neutron-star merging system. They measured km s Mpc [24]. These observations present an advantage: they are independent from cosmic microwave background and distance ladder measurements, offering an answer to the observed tension. As for baryon acoustic oscillations (BAOs), which are a matter of interest in our study, they are sound waves traveling in the primordial plasma, frozen at the recombination epoch. These oscillations have been found in the spider’s-web-like galactic structures by different independent observational surveys. The BAOs surveys give measurement results in terms of , , , , , , and , where is the sound horizon distance at the drag epoch. In the recombination era, the photons depart from the baryon matter, at , giving rise to the CMB. The baryons do not sense the dragging effect of photons until , which sets the standard ruler for the BAOs. The Hubble constant and the sound horizon are strongly related, forming the so-called plane, linking the early- and late-time universe. In general, is subject to the conditions of the early universe, hence constrained via early observations performed by Planck 2018 [37]. Instead of the calibration of via early observations as per Planck, an alternative method is to combine BAO measurements with other low-redshift observations.
In this study, we select the final BAO measurement results from different observational experiments covering 24 BAO data points and test whether these BAO points could be correlated or not. According to [38], despite the existence of large galaxy survey datasets, it is recommended to use a small sample to minimize correlations among the selected data points, thus reducing the errors. One way is to examine the concordance of this subsample is incorporating random correlations and perform the analysis on the cosmological parameters. Furthermore, in our study we take into account the CDM, wCDM, and CDM cosmological models. Combining the latest BAO measurements with the Pantheon SNeIA dataset, the cosmic chronometers dataset, and the latest measurement of the Hubble constant obtained by Riess 2022 as an additional prior [7], we estimate the and parameters. The structure of the paper is the following: In Section 2, we present the cosmological models under study. The datasets and methodology are explained in Section 3. In Section 4, we present our estimated results from the latest low-redshift survey datasets. In Section 5, we present our results and their implications for the cosmological models under study.
2. Theoretical Background
2.1. Standard Cosmological Model
The cold dark matter (CDM) model takes the dark energy equation of state (EoS) as the cosmological constant with , acting as a negative pressure to counteract the effect of gravity. The Friedmann equation for this model is expressed as
where we can set , with EOS . The Friedmann equation (1) depends on the free parameters , , . Although the radiation parameter is usually not considered for a flat late-universe, we include it for a complete description. The term is the function rate and is the ratio , where is the Hubble parameter at redshift z and is the Hubble constant measured at present time.
2.2. Flat Constant wCDM Model
The cosmological model wCDM assumes a constant EoS w. The Friedmann equation for wCDM model is expressed as
where Equation (2) depends on the free parameters , , , and .
2.3. CPL Parametrization
The dark energy EoS w can be treated as a function of the cosmic time translated in redshift z or scale factor of the FLRW metric universe, noting that , where given by the current time. Here, we consider a dynamical EoS w parametrization called the Chevallier–Polarski–Linder (CPL) model. This model introduces a parametrization that varies as a function of time. This model is given by [39,40,41]
or in terms of redshift z,
where represents the cosmological constant or the current value of EoS, that means, , and noting that , one can regard this as a free time parameter. From the CPL parametrization, we can write the Friedmann equation in terms of the expansion function as
where Equation (5) depends on the free parameters , , , , and . The measured values of redshift and angles on the celestial sphere need to be translated into cosmological distances by setting a fiducial model, estimating the ratio of the observed BAO scale to that predicted in the fiducial model. The studies of the BAO feature in the transverse direction provide a measurement of , with the comoving angular diameter distance in a flat space,
Furthermore, the BAO data are also expressed in cosmological observables such as and , which encodes the BAO peak coordinates information,
where is the sound horizon distance at the drag epoch measured by [1] in Mpc.
3. Data and Methodology
For our analysis we select a subset of data points of the latest BAO measurements from different galaxy survey experiments. The data points mainly come from the Sloan Digital Sky Survey (SDSS) [42,43,44,45,46,47]. In addition, we also include data measurements from the Dark Energy Survey (DES) [48], the Dark Energy Camera Legacy Survey (DECaLS) [49], and 6dFGS BAO [50]. The BAO data points are listed in Table 1 with their corresponding redshifts , observables, measurements, and errors. Although we choose a subset of data points from a huge set of BAO data points to avoid highly correlated data points, it is still possible that our subset of data points listed in Table 1 can exhibit correlations between the different measurements in the data releases. To estimate the systematic error, one needs to use mocks based on N-body simulations to find out the correct covariance matrices. Since we use a collection of measurements from different observational surveys, we do not use a precise covariance matrix between them. To overcome this issue, we follow the covariance analysis given in [38]. The covariance matrix for uncorrelated points is
To simulate the impact of correlations in our subsample listed in Table 1, we can incorporate a certain number of non-diagonal elements randomly in the covariance matrix while keeping it symmetric. Based on this method, we establish non-negative correlations in up to twelve pairs of aleatory data points, which represents of the BAO dataset given in Table 1. The locations of the non-diagonal elements are selected as aleatory and their magnitudes are set to
where are the errors of the data points . We implemented a nested sampling algorithm tailored for high-dimensional parameter space called Polychord, developed by [51], to perform the calculations. The prior we selected was with a uniform distribution given by
In the case of the fiducial cosmology, we selected as a prior for the ratio . Furthermore, the latest measurement of the Hubble constant estimated by Riess in 2022 [7] and confirmed with the observations carried out by the James Webb space telescope (JWST) [52] km s Mpc was integrated into our analysis as an additional Gaussian prior, we refer to it as R22. The “full-dataset” encodes the sum of the BAO + CC + Pantheon datasets.

Table 1.
Sample of 24 BAO uncorrelated data points on which we perform our analysis. Our data points mainly come from the final measurements of the SDSS-III BOSS-DR12 and SDSS-IV eBOSS-DR16 samples for strengthening our results.
Table 1.
Sample of 24 BAO uncorrelated data points on which we perform our analysis. Our data points mainly come from the final measurements of the SDSS-III BOSS-DR12 and SDSS-IV eBOSS-DR16 samples for strengthening our results.
| Observable | Measurement | Error | Year | Dataset Survey | Reference | |
|---|---|---|---|---|---|---|
| 0.106 | 0.336 | 0.015 | 2011 | 6dFGS BAO | [50] | |
| 0.15 | 4.47 | 0.17 | 2021 | SDSS Main Galaxy Sample | [53] | |
| 0.31 | 6.29 | 0.14 | 2017 | SDSS-III BOSS-DR12 | [54] | |
| 0.36 | 7.09 | 0.16 | 2017 | SDSS-III BOSS-DR12 | [54] | |
| 0.38 | 25.00 | 0.76 | 2021 | SDSS BOSS Galaxy Sample | [54] | |
| 0.40 | 7.70 | 0.16 | 2017 | SDSS-III BOSS-DR12 | [54] | |
| 0.44 | 8.20 | 0.13 | 2017 | SDSS-III BOSS-DR12 | [54] | |
| 0.48 | 8.64 | 0.11 | 2017 | SDSS-III BOSS-DR12 | [54] | |
| 0.51 | 13.36 | 0.21 | 2021 | SDSS BOSS Galaxy Sample | [53] | |
| 0.52 | 8.90 | 0.12 | 2017 | SDSS-III BOSS-DR12 | [54] | |
| 0.56 | 9.16 | 0.14 | 2017 | SDSS-III BOSS-DR12 | [54] | |
| 0.59 | 9.45 | 0.17 | 2017 | SDSS-III BOSS-DR12 | [54] | |
| 0.64 | 9.62 | 0.22 | 2017 | SDSS-III BOSS-DR12 | [54] | |
| 0.697 | 1529 | 73 | 2020 | DECaLS DR8 Footprint LRG | [49] | |
| 0.698 | 19.77 | 0.47 | 2020 | eBOSS DR16 LRG Sample | [44] | |
| 0.698 | 17.65 | 0.30 | 2020 | eBOSS DR16 LRG Sample | [44] | |
| 0.70 | 17.96 | 0.51 | 2021 | eBOSS DR16 ELG Sample | [55] | |
| 0.835 | 18.92 | 0.51 | 2022 | Dark Energy Survey Year 3 | [48] | |
| 0.845 | 20.91 | 2.86 | 2021 | eBOSS DR16 ELG Sample | [55] | |
| 0.874 | 1680 | 109 | 2020 | DECaLS DR8 Footprint LRG | [49] | |
| 1.48 | 13.23 | 0.47 | 2021 | eBOSS DR16 Quasar Sample | [46] | |
| 1.48 | 30.21 | 0.79 | 2021 | eBOSS DR16 Quasar Sample | [46] | |
| 2.33 | 8.99 | 0.19 | 2020 | eBOSS DR16 Ly-Quasar | [47] | |
| 2.33 | 37.5 | 1.1 | 2020 | eBOSS DR16 Ly-Quasar | [47] |
4. Analysis and Results
In order to constraint our models, aside from the collection of BAO data points listed in Table 1, we use the Pantheon dataset given in [56], the latest Hubble parameter measurements using the cosmic chronometers (CCs) method containing 33 uncorrelated data points listed in Table 2, and the latest Hubble constant measurement, labeled as R22 [7], as an additional Gaussian prior.
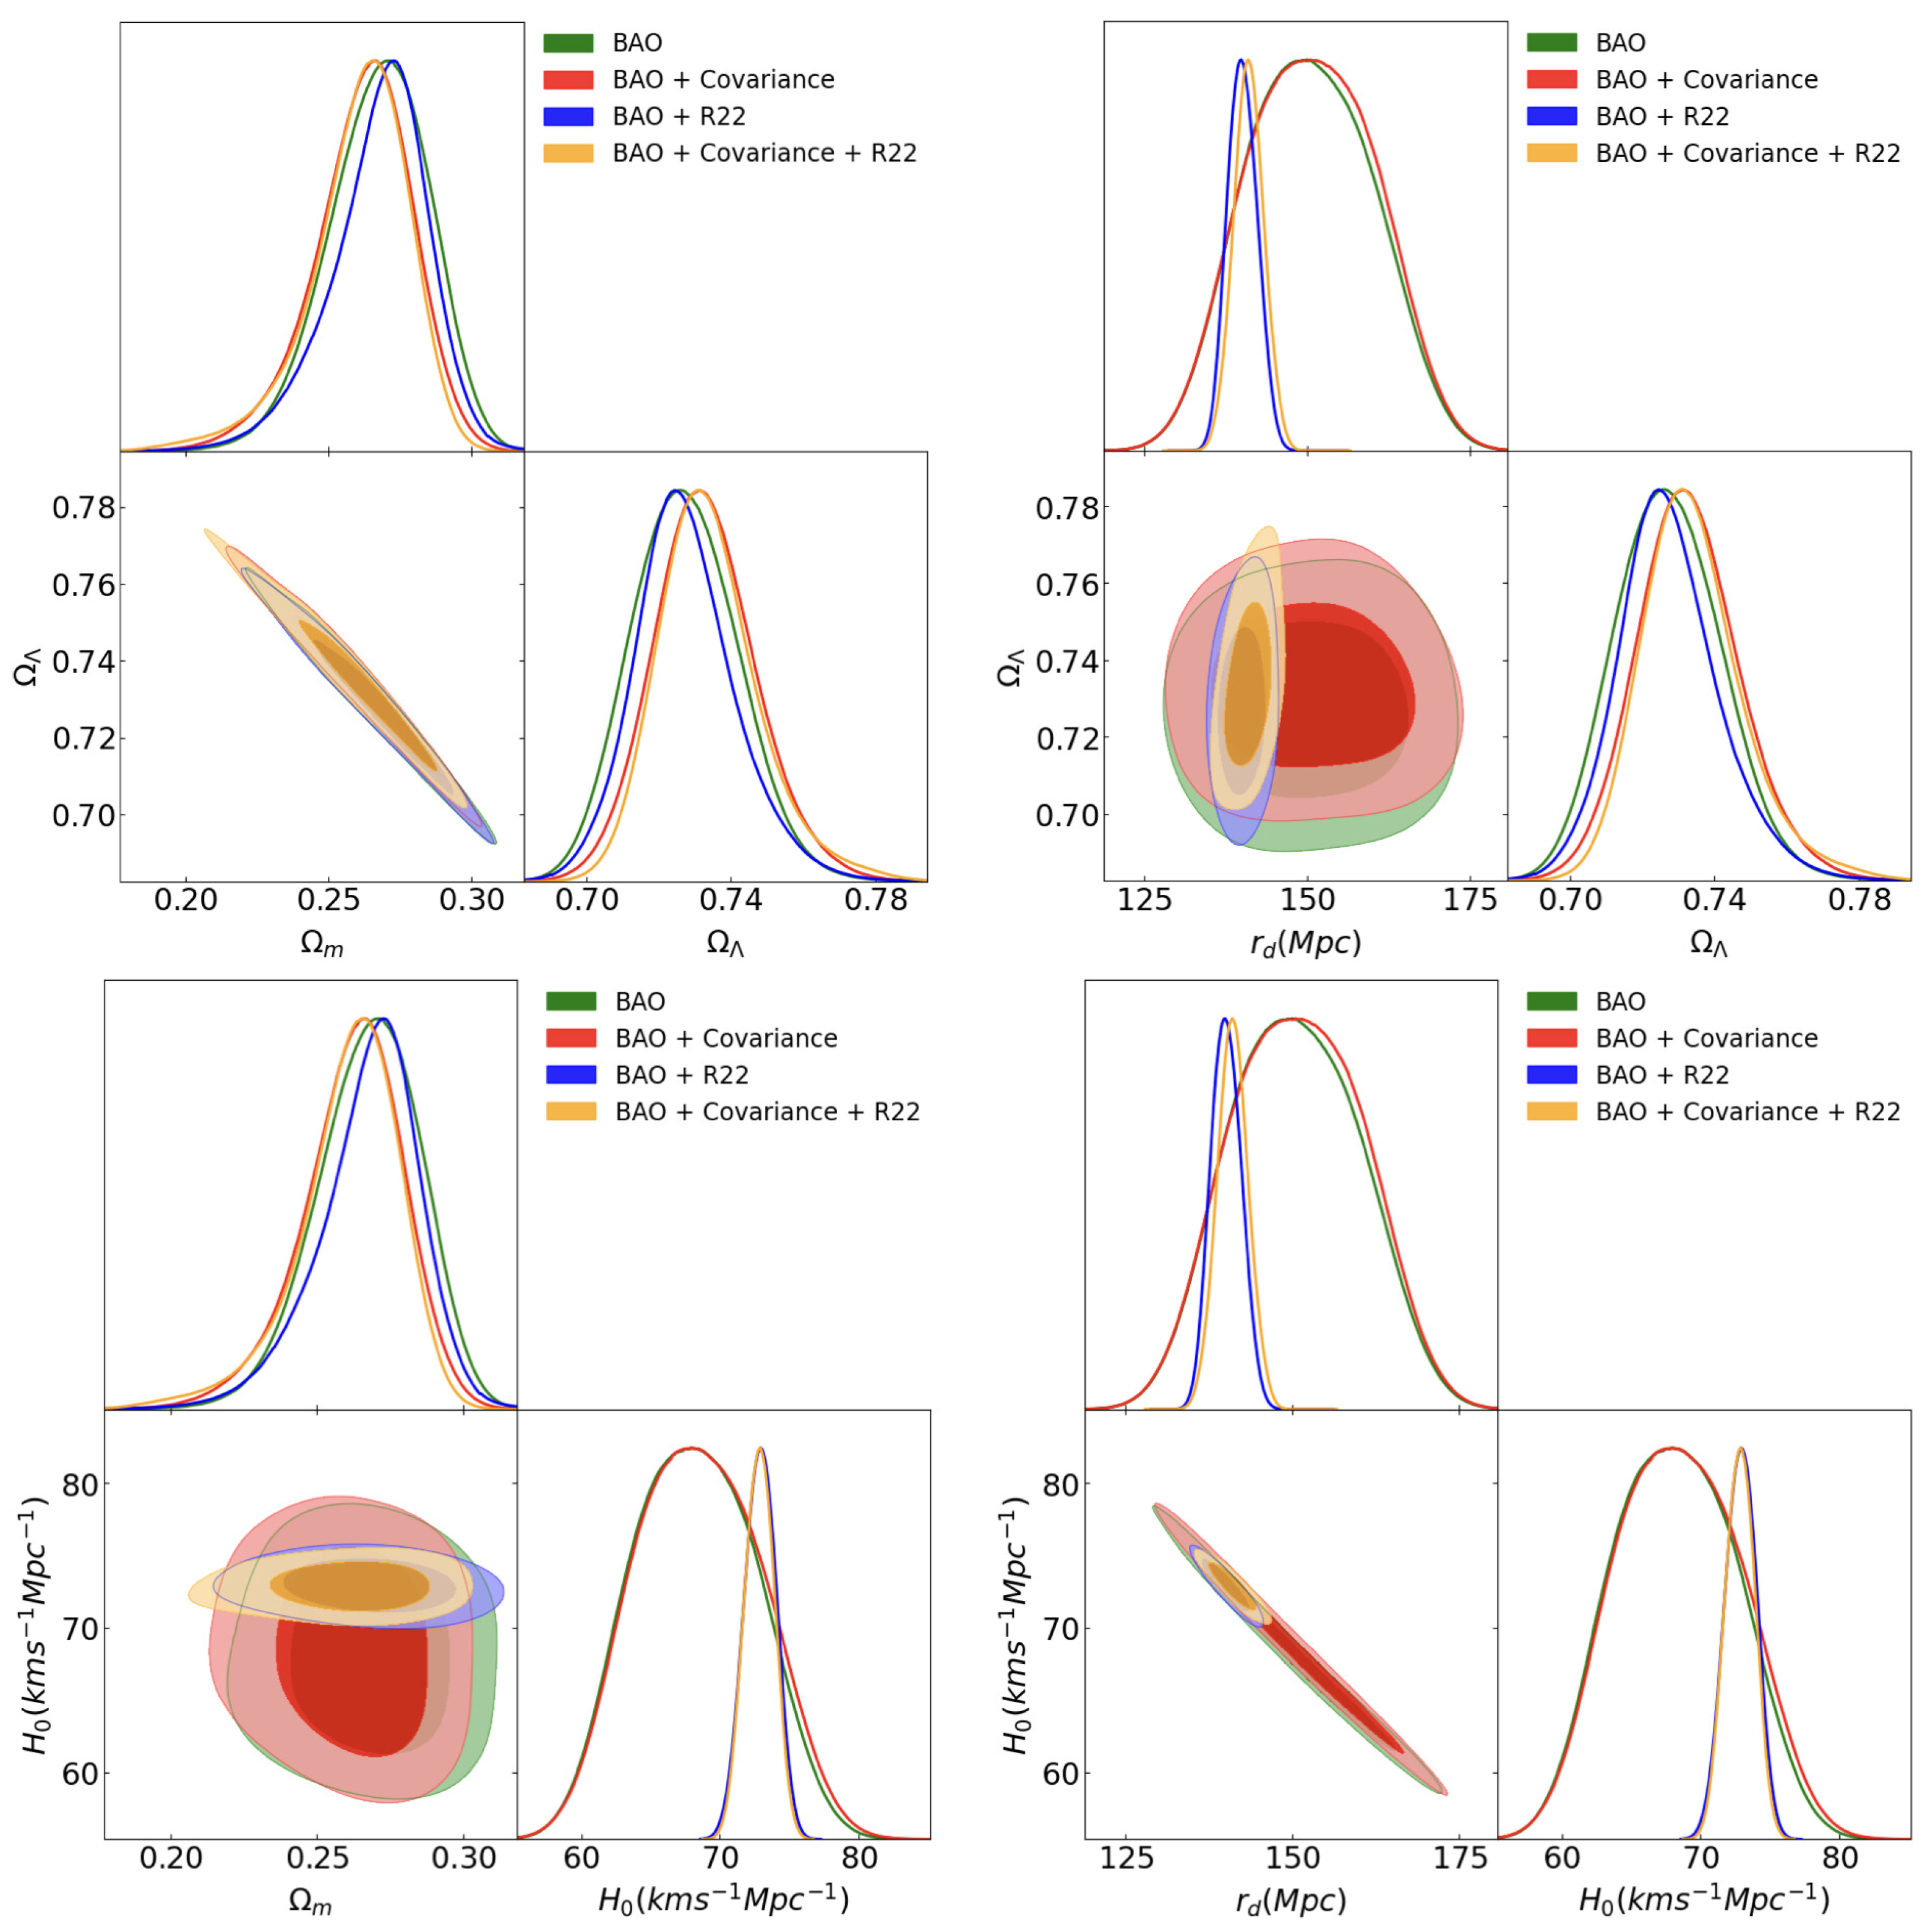
The results for the BAO and the BAO+R22 in the context of test random correlations are depicted in Figure 1 and listed in Table 3. Introducing some random correlations changes the values of the cosmological parameters and . However, the difference between no correlation () and 50% correlated points () is surprisingly about 5%, allowing us to consider our BAO dataset uncorrelated, which is very low compared to the discrepancy given in [38].
4.1. Standard Cosmological Model
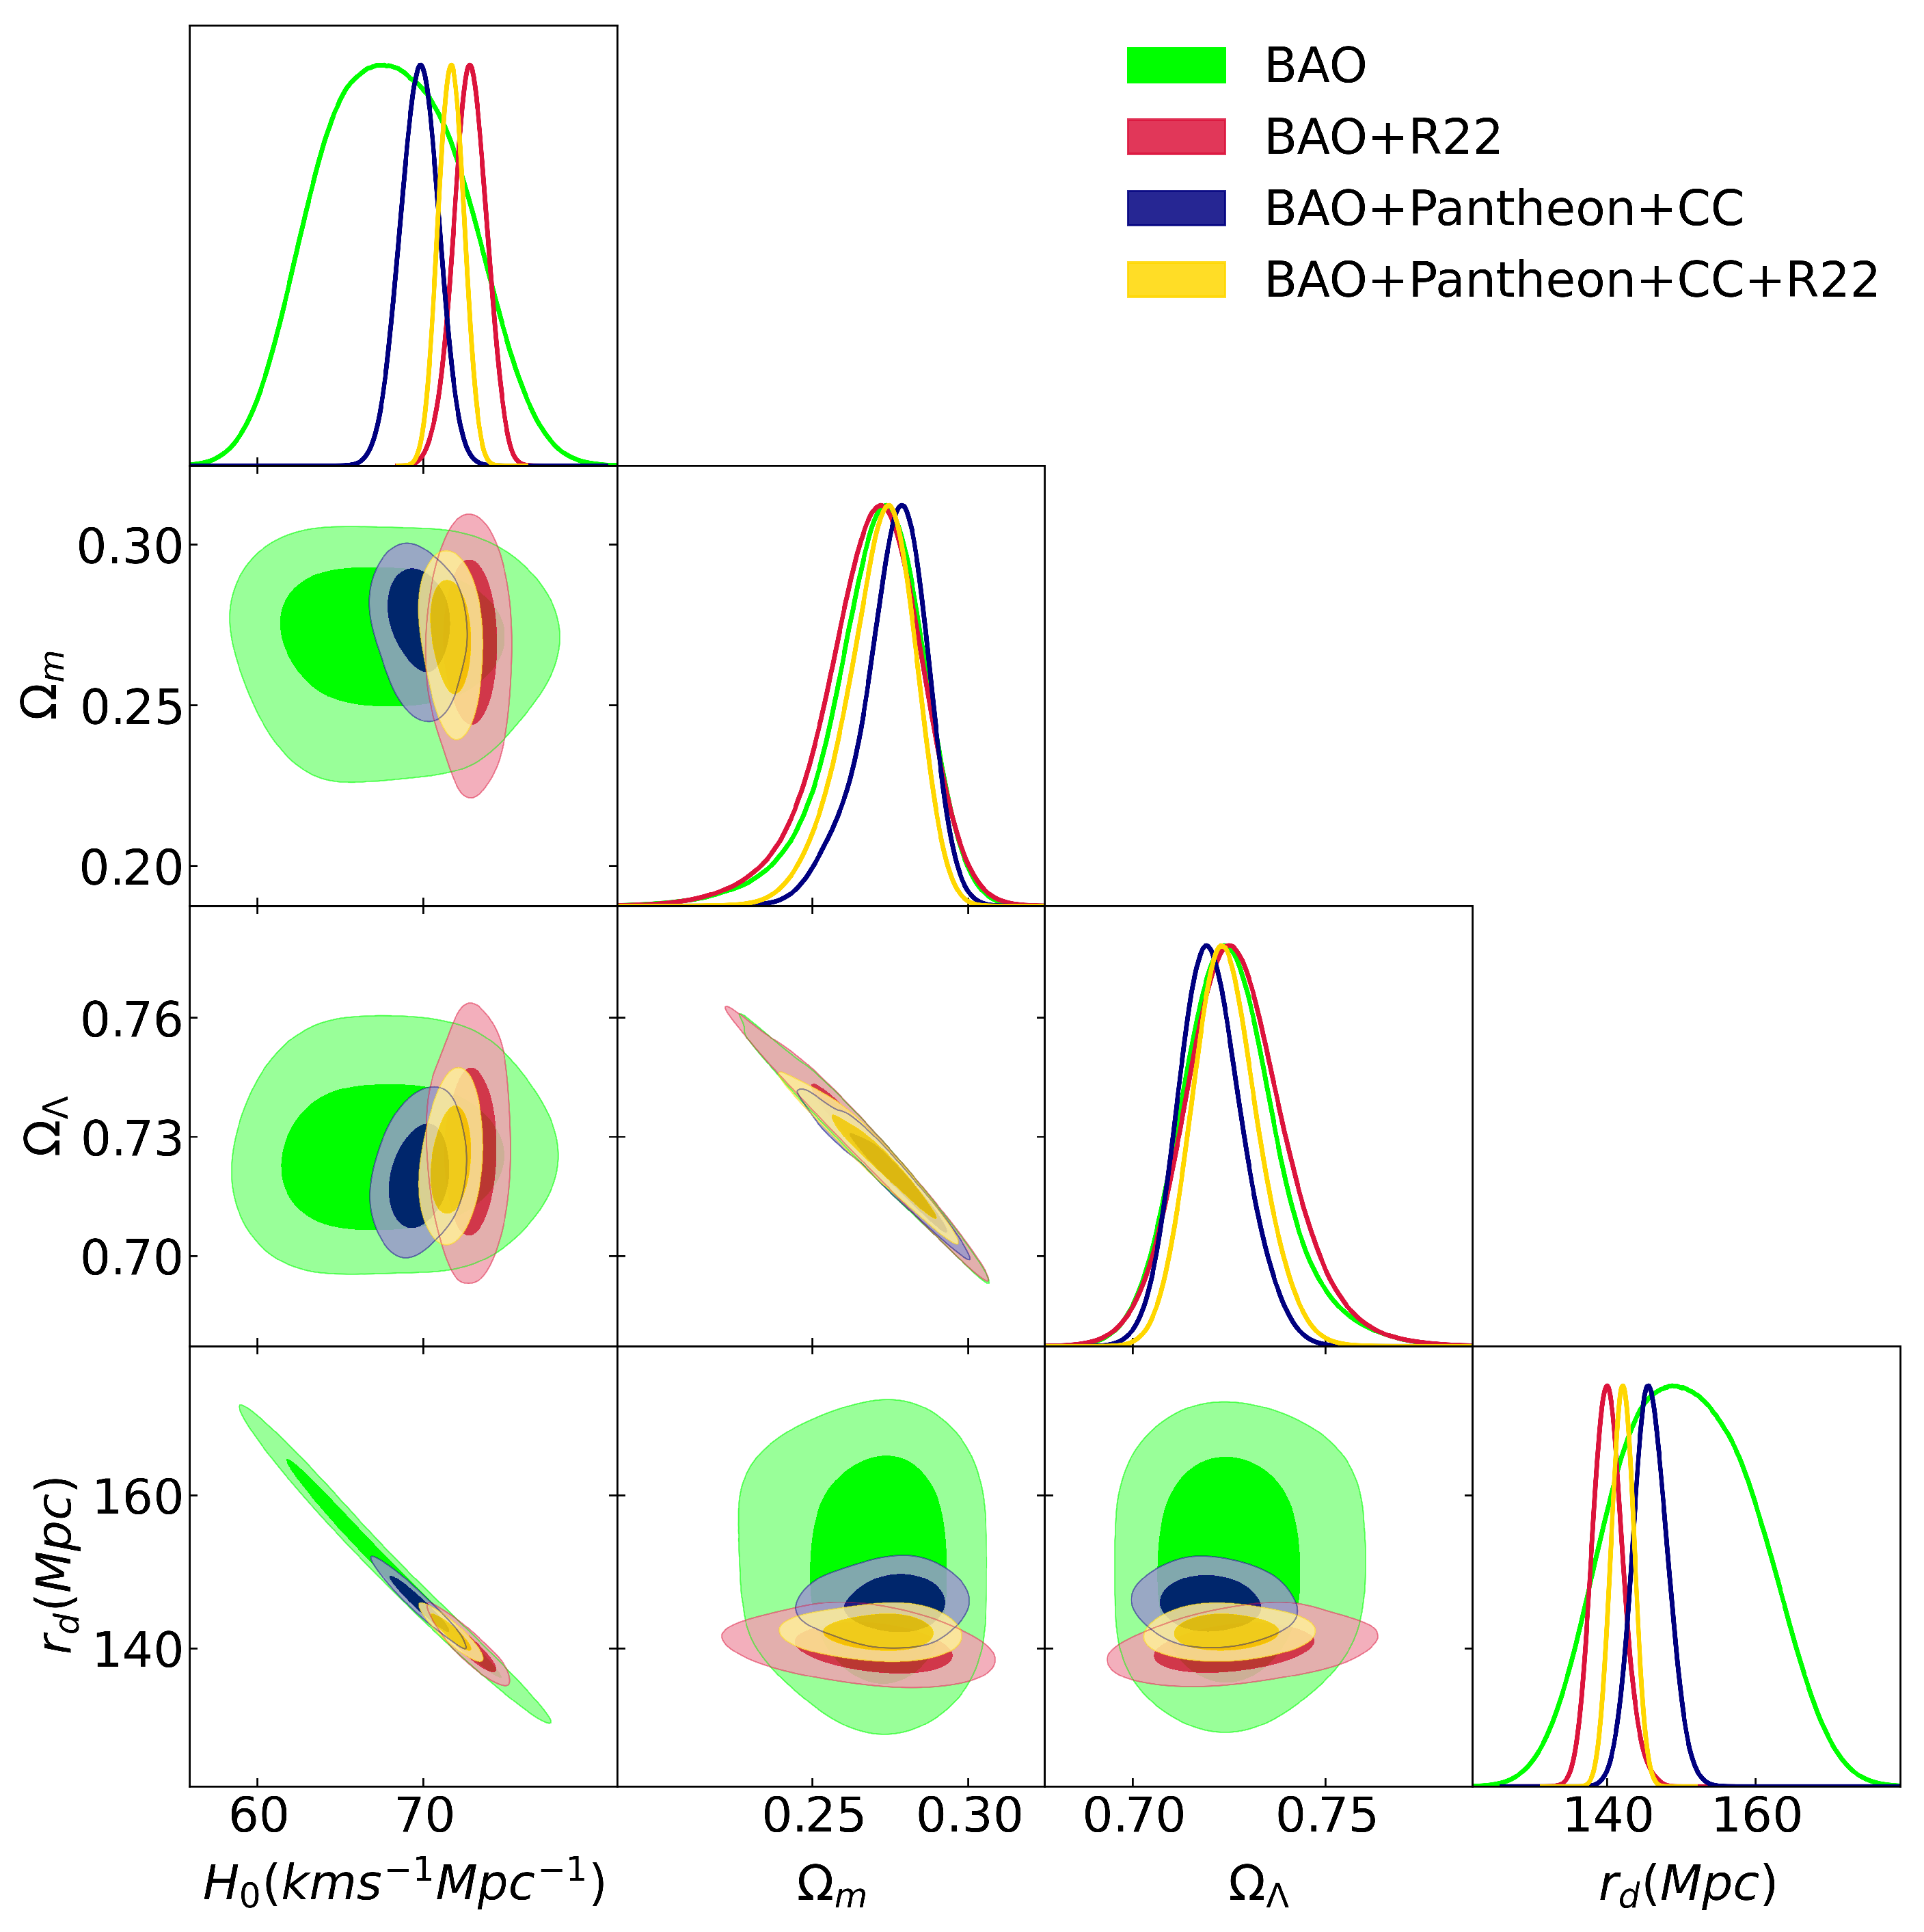
We can start evaluating the cosmological models based on the data measurements. For the CDM model we vary the following parameters: , , , , and . The estimated values of our varied parameters in the CDM scenario for different combinations of datasets can be depicted in Figure 2, including the contours of the and planes.
In Figure 2, the 68% and 95% confidence levels for the posterior distribution of some of the cosmological key parameters of the standard CDM model are reported. The numerical results of the evaluated cosmological parameters are listed in Table 4. When the BAO dataset alone is regarded, our estimated values of and are closely in agreement with those obtained by Planck 2018 [1]. However, our estimated values of matter density and dark energy density are smaller than the values reported in [1]. When we combine the R22 prior for , the fit gives an estimated value for away from [1] and closer to the one measured in the SNe sample by [7]. On the other hand, when we have the full dataset (BAO+Pantheon+CC), the value of the Hubble constant is closer to that value estimated by [1]. We also observe that the matter–energy densities are smaller to the values estimated by [1](, ), but this observation has been reported in other studies [66,67]. In the framework of the BAO scale, it is set by the cosmic sound horizon imprinted in the cosmic microwave background at the drag epoch when the sea of baryons and photons decouple from each other, according to
where the speed of sound is expressed as , where . The data from [1] gives the redshift at the drag epoch . For a flat CDM, the measurements in [1] estimate Mpc. In our analysis, the posterior distribution of the contour plane is shown at the bottom of the first column in Figure 2. We find for the full dataset Mpc, close to the Planck results. Adding the Riess 2022 prior into the full dataset gives Mpc. Ref. [68] finds Mpc. Ref. [69] reports that using binning and Gaussian methods to combine measurements of the 2D BAO and SNe data, the values of the absolute BAO scale range from 141.45 Mpc 159.44 Mpc (binning) and 143.35 Mpc 161.59 Mpc (Gaussian). The above results demonstrate a clear discrepancy between early- and late-time observational measurements, analogously to the tension. It should be noticed that our results depend on the range of priors for and , shifting the estimated values in the contour plane. A noticeable feature is that when we do not include the Riess 2022 prior the results of and tend to be in agreement with the Planck and SDSS results.
4.2. Models beyond Standard Model
Aside from the standard CDM cosmological model, we test two more cosmological models whose dark energy EoSs are non-dynamical, dynamical, and different from : the wCDM model and the CDM model. For the wCDM model, we use , while for the CDM model, we use and . The rest of the priors are the same as for the CDM model.
4.2.1. wCDM Model
This model considers a fixed dark energy equation of state . The results for different combinations of dataset surveys are depicted in Figure 3 and listed in Table 5. From our results, the dark energy EoS is similar to the cosmological constant for the full dataset: ; and in agreement with [1] () when taking into account the full dataset BAO+CC+Pantheon plus Riess 2022 (R22): . On the other hand, when we consider the BAO and BAO+R22 datasets, the EoS is .
The above results imply that we cannot rule out when we consider the full dataset and full dataset plus R22. In Figure 4, we observe the plane in the framework of the wCDM model.
We observe that the sound horizon distance value from the full-dataset and BAO dataset alone are in agreement with the value estimated by [1]. However, when we incorporate R22 into the full-dataset and BAO dataset alone the sound horizon at drag epoch yields Mpc and Mpc, respectively. Although these values are in tension with the value estimated by Planck, our estimated results with Riess 2022 are clearly in agreement with those obtained by [68] Mpc, [66] independent of CMB data Mpc (from ), and [70] Mpc.
4.2.2. CDM Model
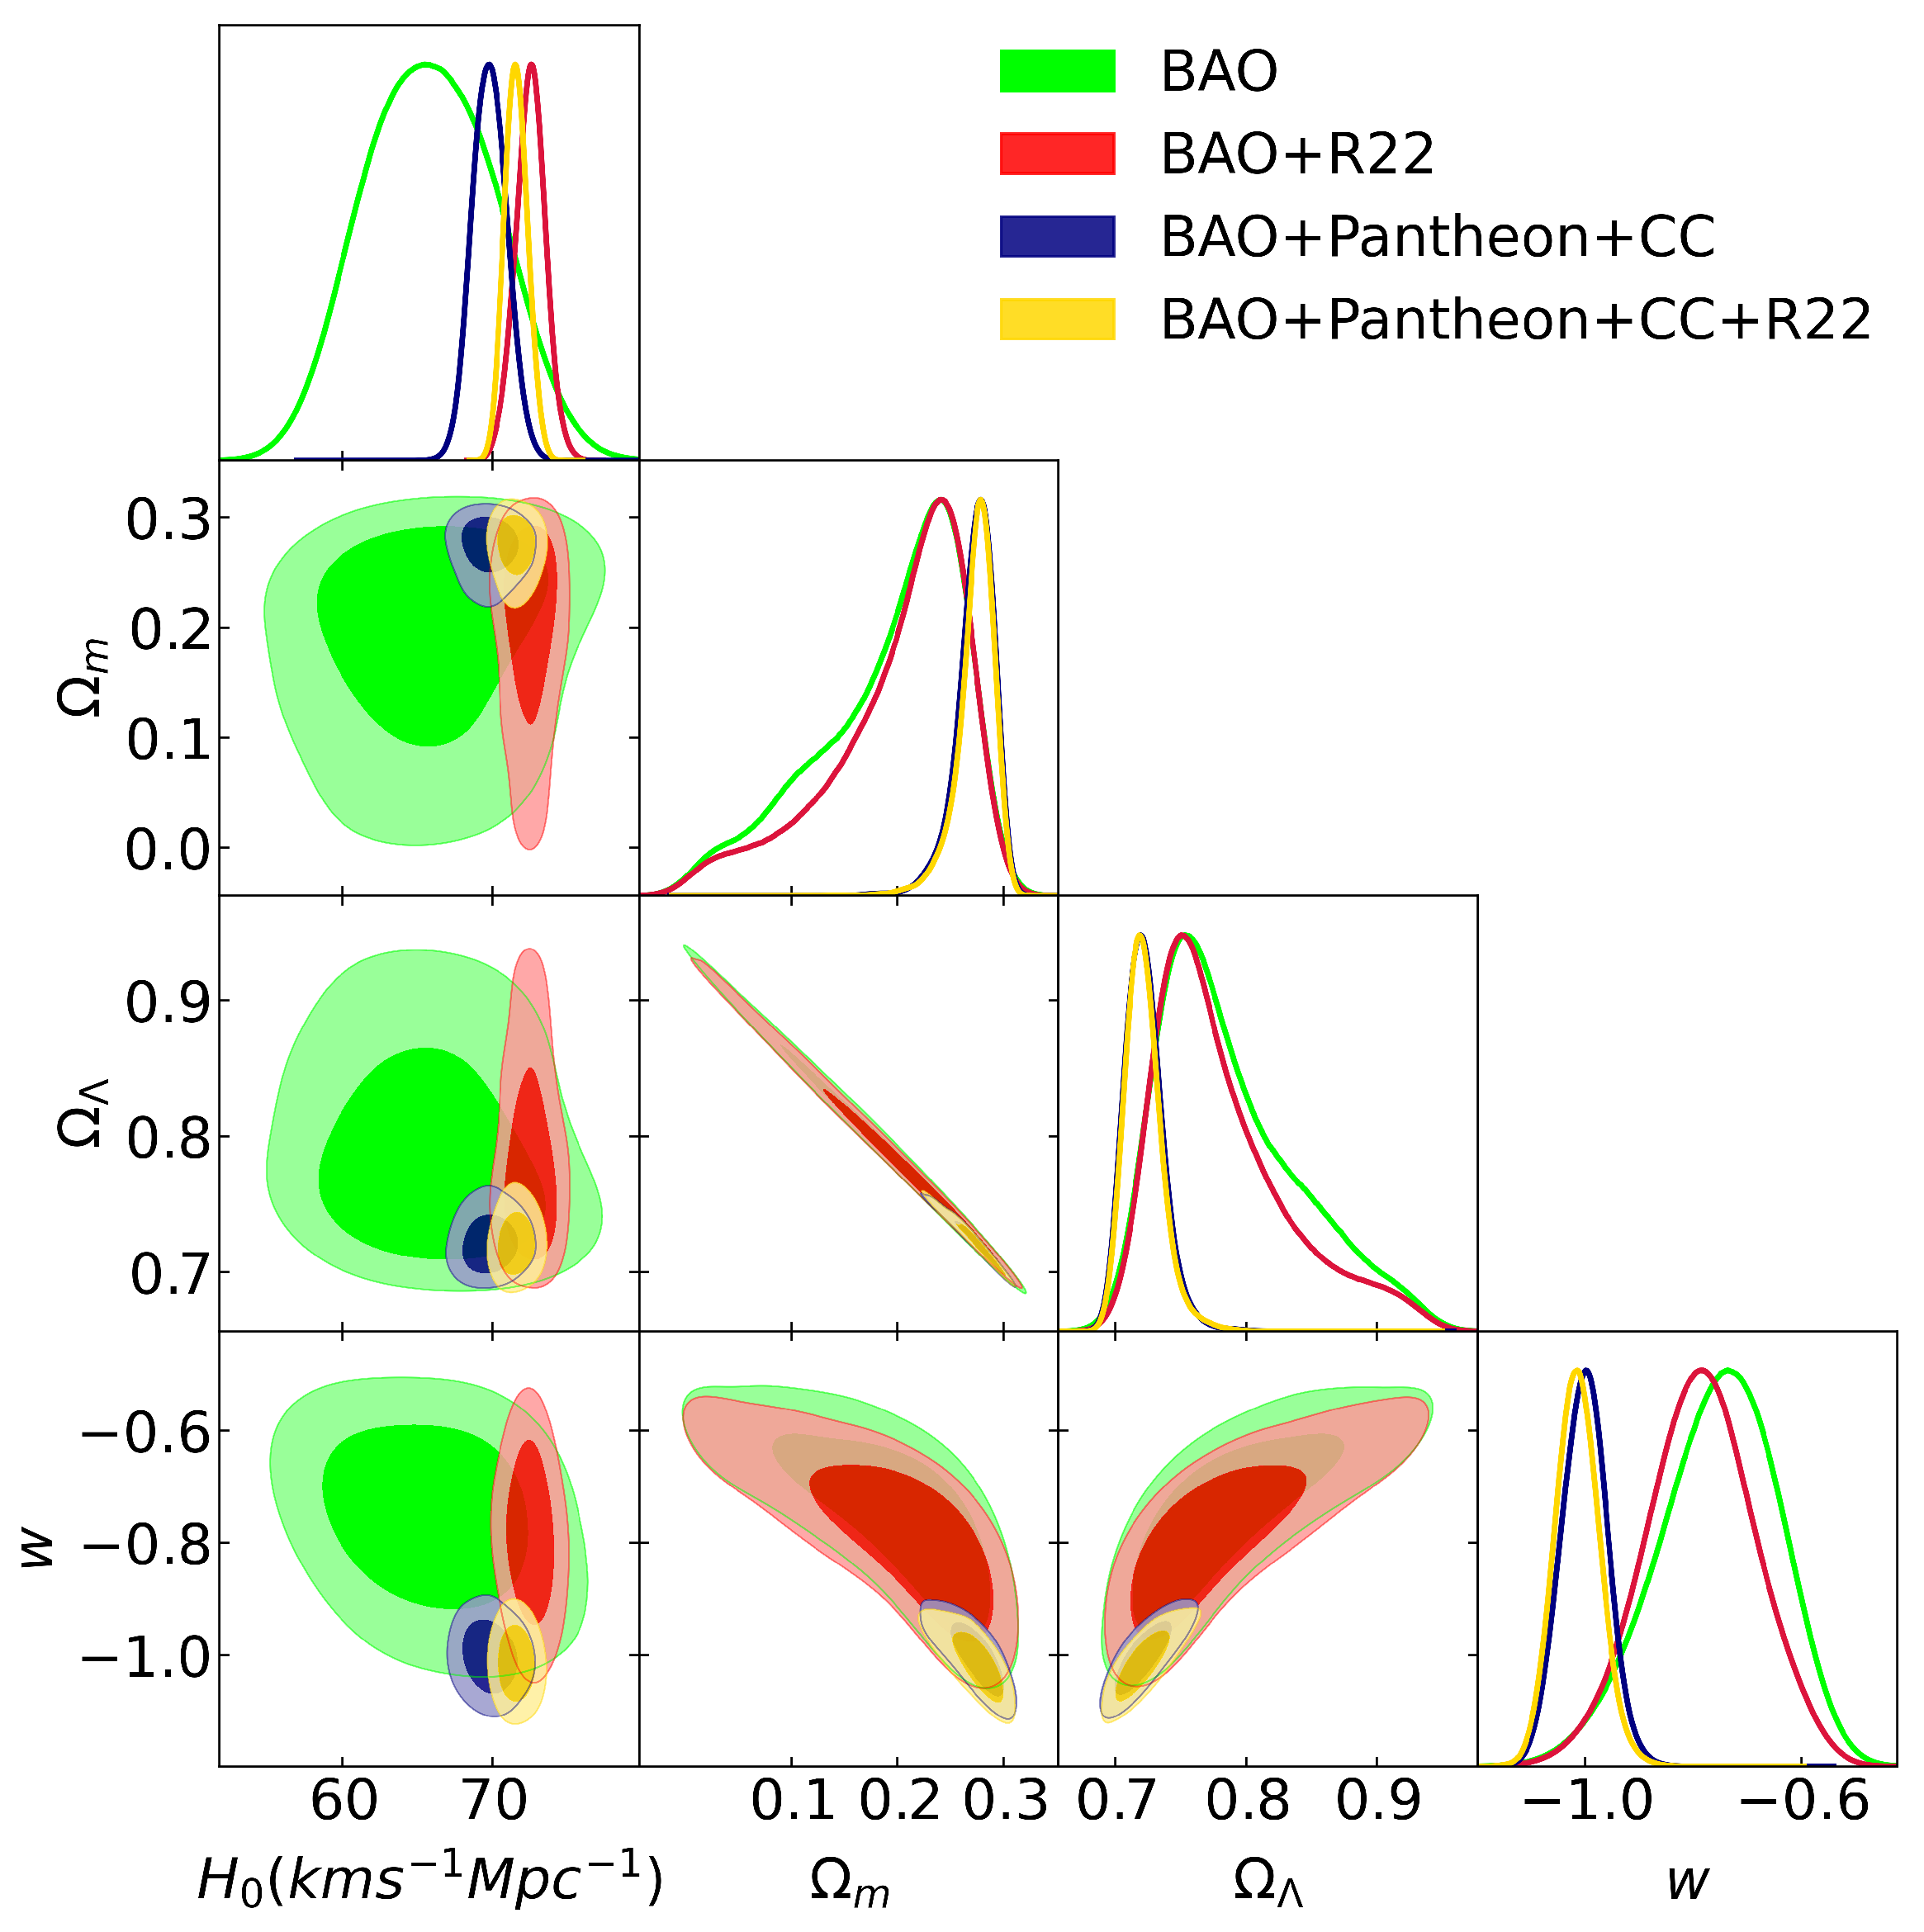
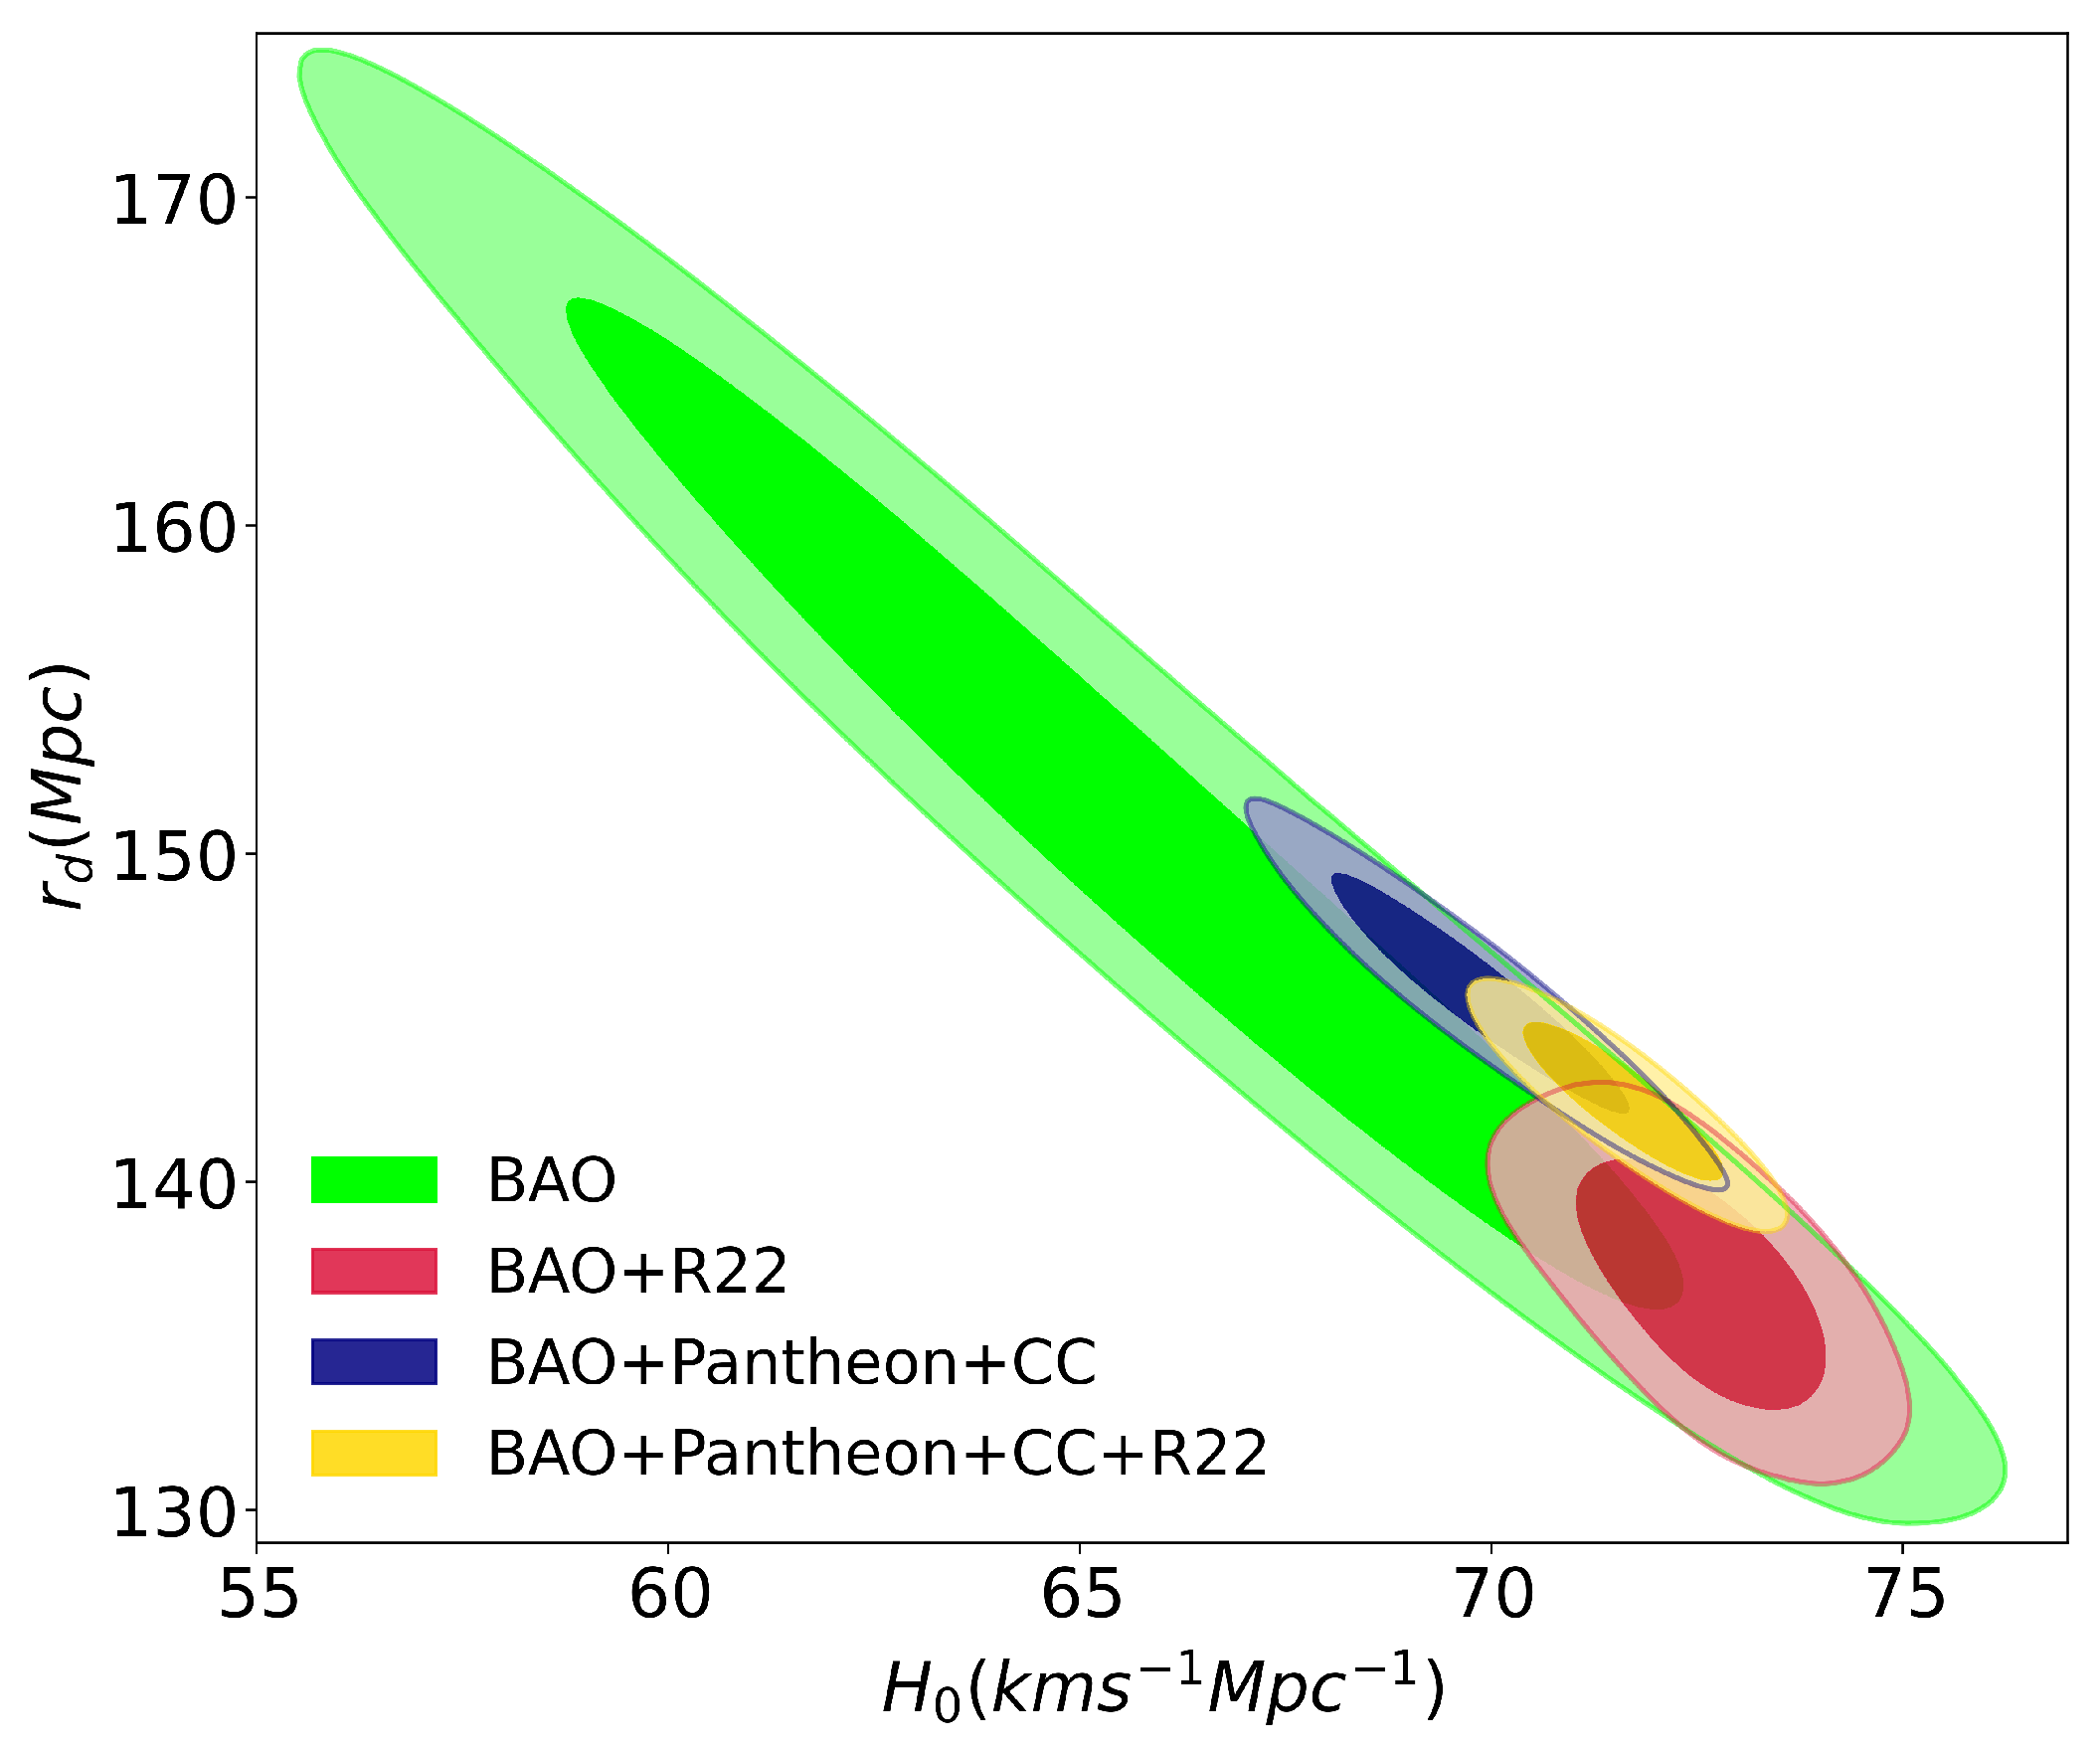
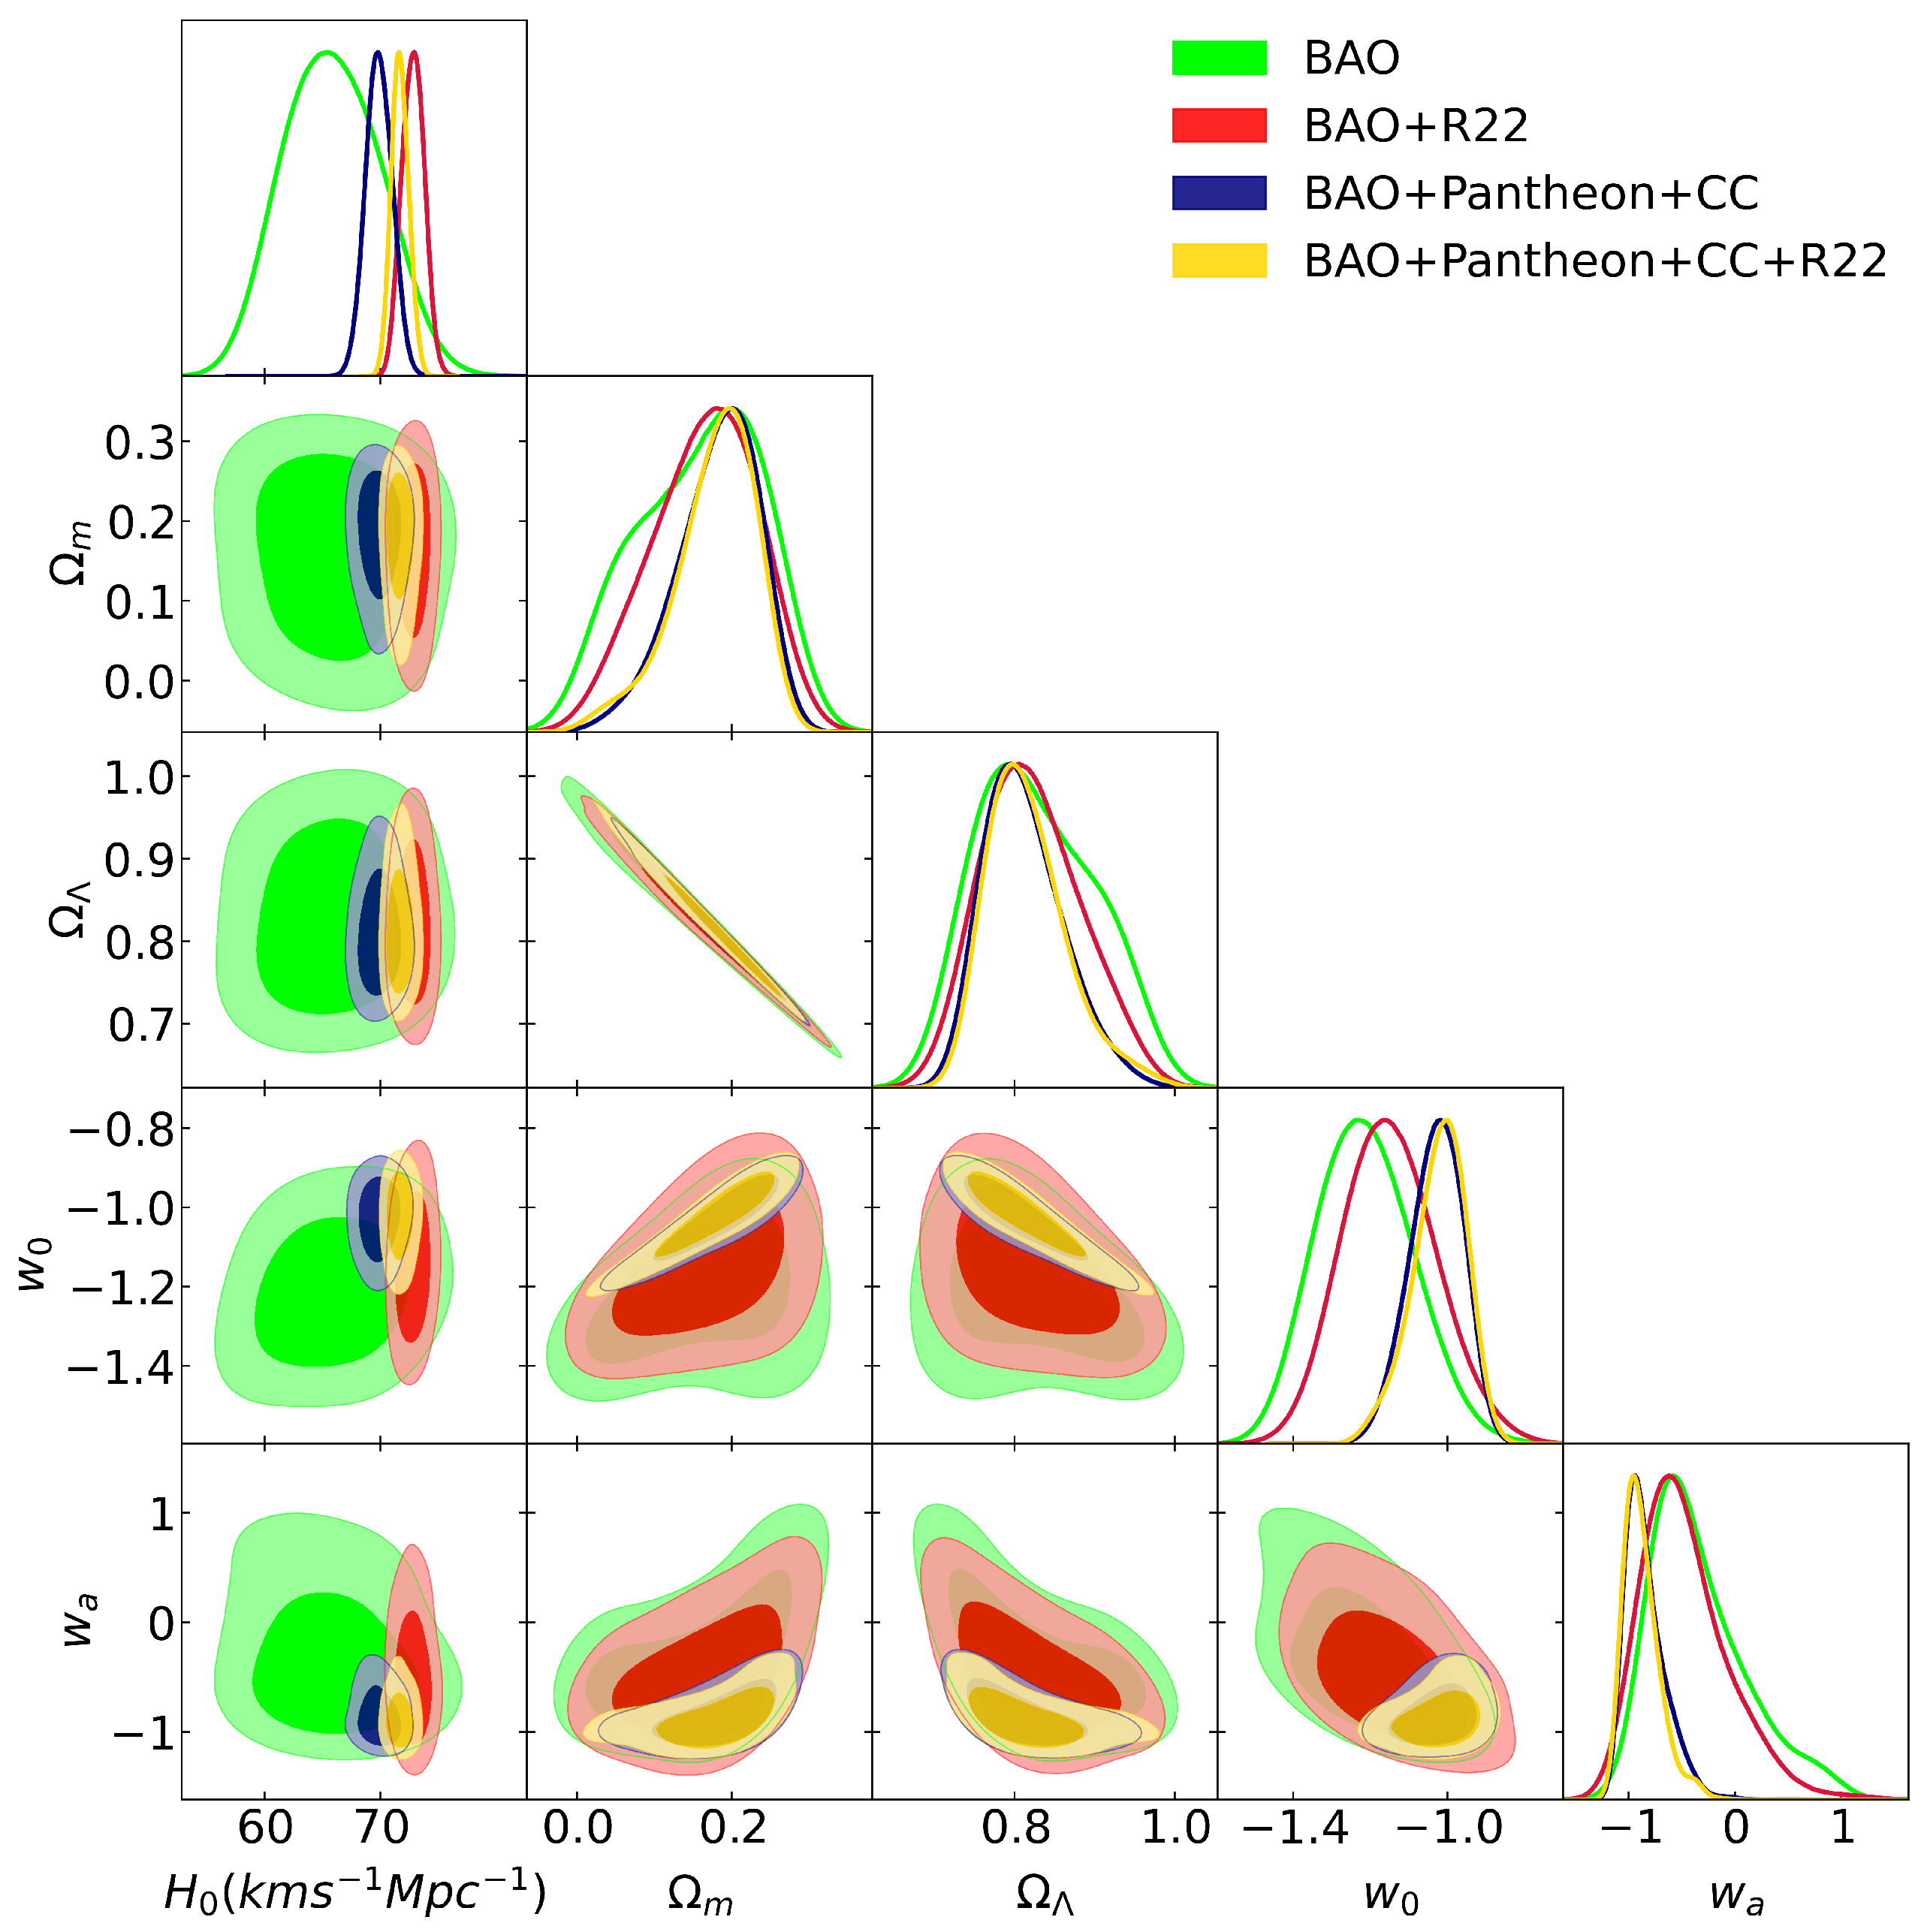
Our estimated value of the parameter for different datasets combinations are depicted in Figure 5 and listed in Table 6. It is interesting to observe that our value is nearly in agreement with the one obtained by [1] with TT, TE, EE + lowE + lensing with other datasets: (from Planck + BAO/RSD + WL) even though we take different combinations of datasets. The plane in the framework of CDM model is presented in Figure 6.
5. Discussion
Our study selected 24 data points that represent the latest and final BAO measurements from different observational surveys in the last two decades in combination with the dataset of measurements using the cosmic chronometers method (33 data points), the Pantheon SNeIa dataset (40 data points), and the latest measurement of the Hubble constant made by Riess 2022. Although our results based on the latest measurements from different observational tests demonstrate that the Hubble tension is still there it has been alleviated: for the . By introducing the sound horizon as a free parameter we find for the full dataset (BAO+Pantheon+CC) km s Mpc and Mpc in the CDM model, km s Mpc and Mpc in the wCDM model, and km s Mpc and Mpc in the CDM model. To compare our different cosmological models, we apply the Akaike information criterion (AIC) and the Bayesian information criterion (BIC). The Akaike information criterion is defined as [71]
where is the maximum likelihood of the data taken into consideration in which we take the full dataset without the Riess 2022 prior, is the total number of data points, and k is the numbers of parameters. For large , our expression is reduced to
which is the standard form of the AIC criterion [71]. On the other hand, the Bayesian information criterion is defined as [72]
Thus, we can calculate the AIC and BIC for the standard CDM, wCDM, and CDM models. We find for CDM, wCDM, and CDM, AIC = 98.0, 100.7, and 98.6, respectively. On the other hand, we find BIC = 97.9, 100.6, and 98.5, respectively. Although the CDM model has the best fit due the lowest AIC, our AIC and BIC values clearly show a good support in favor of all our tested models and cannot be ruled out from the current data.
Referring to our results, we see that the values of the Hubble constant and the sound horizon distance based on low-redshift measurements (BAO+Pantheon+CC), are in agreement with the early measurements estimated by Planck [1], even though the dark energy and matter densities are lower. Therefore, in our analysis, the tension between low-redshift and high-redshift measurements is not exhibited here in all our cosmological models as long as we do not include the Riess 2022 prior. Furthermore, it is striking that, based on the full dataset, we see that , taking the form of the cosmological constant and in agreement with Planck [1] and closely to the result obtained by [53]. Our analysis and results show the robustness of the CDM, wCDM, and CDM models based on our full dataset, showing consistency with the Planck measurements for and . Although the R22 prior changes the values of and , creating a tension, they still agree with other studies [66,67,69].
Funding
This research received no external funding.
Institutional Review Board Statement
Not applicable.
Informed Consent Statement
Not applicable.
Data Availability Statement
The data underlying this article is already given with references during the analysis of this work.
Acknowledgments
We would like to thank CONAHCYT for sponsoring this project.
Conflicts of Interest
The author declares no conflict of interest. The funders had no role in the design of the study; in the collection, analyses, or interpretation of data; in the writing of the manuscript; or in the decision to publish the results.
References
- Planck Collaboration. Planck 2018 Results—VI. Cosmological Parameters. Astron. Astrophys. 2020, A6, 641. [Google Scholar]
- Bennett, C.L.; Larson, D.; Weil, J.L.; Jarosik, N.; Hinshaw, G.; Odegard, N.; Smith, K.M.; Hill, R.S.; Gold, B.; Halpern, M.; et al. Nine-year Wilkinson microwave anisotropy probe (WMAP) observations: Final maps and results. Astrophys. J. Suppl. Ser. 2013, 208, 20. [Google Scholar] [CrossRef]
- Riess, A.G.; Filippenko, A.V.; Challis, P.; Clocchiatti, A.; Diercks, A.; Garnavich, P.M.; Gillil, R.L.; Hogan, C.J.; Jha, S.; Kirshner, R.P.; et al. Observational Evidence from Supernovae for an Accelerating Universe and a Cosmological Constant. Astron. J. 1998, 116, 1009. [Google Scholar] [CrossRef]
- Riess, A.G.; Macri, L.; Casertano, S.; Lampeitl, H.; Ferguson, H.C.; Filippenko, A.V.; Jha, S.W.; Li, W.; Chornock, R. A 3% solution: Determination of the Hubble constant with the Hubble space telescope and wide field camera 3. Astron. J. 2011, 730, 119. [Google Scholar] [CrossRef]
- Riess, A.G.; Macri, L.M.; Hoffmann, S.L.; Scolnic, D.; Casertano, S.; Filippenko, A.V.; Tucker, B.E.; Reid, M.J.; Jones, D.O.; Silverman, J.M.; et al. A 2.4% determination of the local value of the Hubble constant. Astron. J. 2016, 826, 56. [Google Scholar] [CrossRef]
- Riess, A.G.; Casertano, S.; Yuan, W.; Macri, L.M.; Scolnic, D. Large Magellanic Cloud Cepheid Standards Provide a 1% Foundation for the Determination of the Hubble Constant and Stronger Evidence for Physics beyond ΛCDM. Astron. J. 2019, 876, 55. [Google Scholar] [CrossRef]
- Riess, A.G.; Yuan, W.; Macri, L.M.; Scolnic, D.; Brout, D.; Casertano, S.; Jones, D.O.; Murakami, Y.; Anand, G.S.; Breuval, L.; et al. A Comprehensive Measurement of the Local Value of the Hubble Constant with 1 km/s/Mpc Uncertainty from the Hubble Space Telescope and the SH0ES Team. Astrophys. J. Lett. 2022, 934, L7. [Google Scholar] [CrossRef]
- Huang, Q.G.; Wang, K. How the dark energy can reconcile Planck with local determination of the Hubble constant. Eur. Phys. J. 2016, 76, 506. [Google Scholar] [CrossRef]
- Di Valentino, E.; Melchiorri, A.; Silk, J. Reconciling Planck with the local value of H0 in extended parameter space. Phys. Lett. B 2016, 761, 242–246. [Google Scholar] [CrossRef]
- Xu, L.; Huang, Q.G. Detecting the neutrinos mass hierarchy from cosmological data. Sci. China Phys. Mech. Astron. 2018, 61, 039521. [Google Scholar] [CrossRef]
- Yang, W.; Pan, S.; Di Valentino, E.; Saridakis, E.N.; Chakraborty, S. Observational constraints on one-parameter dynamical dark-energy parametrizations and the H0 tension. Phys. Rev. D 2019, 99, 043543. [Google Scholar] [CrossRef]
- Poulin, V.; Smith, T.L.; Karwal, T.; Kamionkowsk, M. Early Dark Energy can Resolve the Hubble Tension. Phys. Rev. Lett. 2019, 122, 221301. [Google Scholar] [CrossRef] [PubMed]
- Vagnozzi, S. New physics in light of the H0 tension: An alternative view. Phys. Rev. D 2020, 102, 023518. [Google Scholar] [CrossRef]
- Liu, M.; Huang, Z.; Luo, X.; Miao, H.; Singh, N.K.; Huang, L. Can non-standard recombination resolve the Hubble tension? Sci. China Phys. Mech. Astron. 2020, 63, 290405. [Google Scholar] [CrossRef]
- Ding, Q.; Nakama, T.; Wang, Y. A gigaparsec-scale local void and the Hubble tension. Sci. China Phys. Mech. Astron. 2020, 63, 290403. [Google Scholar] [CrossRef]
- Ryan, J.; Chen, Y.; Ratra, B. Baryon acoustic oscillation, Hubble parameter, and angular size measurement constraints on the Hubble constant, dark energy dynamics, and spatial curvature. Mon. Not. R. Astron. Soc. 2019, 488, 3844–3856. [Google Scholar] [CrossRef]
- Zhao, G.B.; Raveri, M.; Pogosian, L.; Wang, Y.; Crittenden, R.G.; Handley, W.J.; Percival, W.J.; Beutler, F.; Brinkmann, J.; Chuang, C.; et al. Dynamical dark energy in light of the latest observations. Nat. Astron. 2017, 1, 627–632. [Google Scholar] [CrossRef]
- Li, X.; Shafieloo, A. A Simple Phenomenological Emergent Dark Energy Model can Resolve the Hubble Tension. Astrophys. J. Lett. 2019, 883, L3. [Google Scholar] [CrossRef]
- Di Valentino, E. Investigating Cosmic Discordance. Astrophys. J. Lett. 2021, 908, L9. [Google Scholar] [CrossRef]
- Haitao, M.; Zhiqi, H. The H0 Tension in Non-flat QCDM Cosmology. Astron. J. 2018, 868, 20. [Google Scholar]
- Millon, M.; Galan, A.; Courbin, F.; Treu, T.; Suyu, S.H.; Ding, X.; Birrer, S.; Chen, G.C.-F.; Shajib, A.J.; Sluse, D.; et al. An exploration of systematic uncertainties in the inference of H0 from time-delay cosmography. Astron. Astrophys. 2020, 639, A101. [Google Scholar] [CrossRef]
- Wong, K.C.; Suyu, S.H.; Chen, G.C.-F.; Rusu, C.E.; Millon, M.; Sluse, D.; Bonvin, V.; Fassnacht, C.D.; Taubenberger, S.; Auger, M.W.; et al. H0LiCOW—XIII. A 2.4 percent measurement of H0 from lensed quasars: 5.3σ tension between early- and late-Universe probes. Mon. Not. R. Astron. Soc. 2020, 498, 1420–1439. [Google Scholar] [CrossRef]
- Mooley, K.P.; Deller, A.T.; Gottlieb, O.; Nakar, E.; Hallinan, G.; Bourke, S.; Frail, D.A.; Horesh, A.; Corsi, A.; Hotokezaka, K. Superluminal motion of a relativistic jet in the neutron-star merger GW170817. Nature 2018, 561, 355–359. [Google Scholar] [CrossRef]
- The LIGO Scientific Collaboration and The Virgo Collaboration; The 1M2H Collaboration; The Dark Energy Camera GW-EM Collaboration and the DES Collaboration; The DLT40 Collaboration; The Las Cumbres Observatory Collaboration; The VINROUGE Collaboration; The MASTER Collaboration. A gravitational-wave standard siren measurement of the Hubble constant. Nature 2017, 551, 85–88. [Google Scholar] [CrossRef] [PubMed]
- Hotokezaka, K.; Nakar, E.; Gottlieb, O.; Nissanke, S.; Masuda, K.; Hallinan, G.; Mooley, K.P.; Deller, A.T. A Hubble constant measurement from the superluminal motion of the jet in GW170817. Nat. Astron. 2019, 3, 940–944. [Google Scholar] [CrossRef]
- Wu, Q.; Zhang, G.-Q.; Wang, F.-Y. An 8 percent determination of the Hubble constant from localized fast radio bursts. Mon. Not. R. Astron. Soc. Lett. 2022, 515, L1–L5. [Google Scholar] [CrossRef]
- James, C.W.; Ghosh, E.M.; Prochaska, J.X.; Bannister, K.W.; Bhandari, S.; Day, C.K.; Deller, A.T.; Glowacki, M.; Gordon, A.C.; Heintz, K.E.; et al. A measurement of Hubble’s Constant using Fast Radio Bursts. Mon. Not. R. Astron. Soc. 2022, 516, 4862–4881. [Google Scholar] [CrossRef]
- Pesce, D.W.; Braatz, J.A.; Reid, M.J.; Riess, A.G.; Scolnic, D.; Condon, J.J.; Gao, F.; Henkel, C.; Impellizzeri, C.M.V.; Kuo, C.Y.; et al. The Megamaser Cosmology Project. XIII. Combined Hubble Constant Constraints. Astrophys. J. Lett. 2020, 891, L1. [Google Scholar] [CrossRef]
- Reid, J.; Pesce, D.W.; Riess, A.G. An Improved Distance to NGC 4258 and Its Implications for the Hubble Constant. Astrophys. J. Lett. 2019, 886, L27. [Google Scholar] [CrossRef]
- Kuo, C.Y.; Braatz, J.A.; Lo, K.Y.; Reid, M.J.; Suyu, S.H.; Pesce, D.W.; Condon, J.J.; Henkel, C.; Impellizzeri, C.M.V. The Megamaser Cosmology Project. VI. Observations of NGC 6323. Astron. J. 2015, 800, 26. [Google Scholar] [CrossRef]
- Freedman, W.L.; Madore, B.F.; Hatt, D.; Hoyt, T.J.; Jang, I.S.; Beaton, R.L.; Burns, C.R.; Lee, M.G.; Monson, A.J.; Neeley, J.R.; et al. The Carnegie-Chicago Hubble Program. VIII. An Independent Determination of the Hubble Constant Based on the Tip of the Red Giant Branch. Astron. J. 2019, 882, 34. [Google Scholar] [CrossRef]
- Freedman, W.L.; Madore, B.F.; Hoyt, T.; Jang, I.S.; Beaton, R.; Lee, M.G.; Monson, A.; Neeley, J.; Jeffrey, R. Calibration of the Tip of the Red Giant Branch. Astron. J. 2020, 891, 57. [Google Scholar] [CrossRef]
- Freedman, W.L. Measurements of the Hubble Constant: Tensions in Perspective. Astron. J. 2021, 919, 16. [Google Scholar] [CrossRef]
- Addison, G.E.; Watts, D.J.; Bennett, C.L.; Halpern, M.; Hinshaw, G.; Weil, J.L. Elucidating ΛCDM: Impact of Baryon Acoustic Oscillation Measurements on the Hubble Constant Discrepancy. Astron. J. 2021, 853, 119. [Google Scholar] [CrossRef]
- Moresco, M.; Amati, L.; Amendola, L.; Birrer, S.; Blakeslee, J.P.; Cantiello, M.; Cimatti, A.; Darling, J.; Valle, M.D.; Fishbach, M.; et al. Unveiling the Universe with emerging cosmological probes. Living Rev. Relativ. 2022, 25, 6. [Google Scholar] [CrossRef]
- Suyu, S.H.; Bonvin, V.; Courbin, F.; Fassnacht, C.D.; Rusu, C.E.; Sluse, D.; Treu, T.; Wong, K.C.; Auger, M.W.; Ding, X.; et al. H0LiCOW—I. H0 Lenses in COSMOGRAIL’s Wellspring: Program overview. Mon. Not. R. Astron. Soc. 2017, 468, 2590–2604. [Google Scholar] [CrossRef]
- Zhang, X.; Huang, Q.G. Measuring H0 from low-z datasets. Sci. China Phys. Mech. Astron. 2020, 63, 290402. [Google Scholar] [CrossRef]
- Kazantzidis, L.; Perivolaropoulos, L. Evolution of the fσ8 tension with the Planck15/ΛCDM determination and implications for modified gravity theories. Phys. Rev. D 2018, 97, 103503. [Google Scholar] [CrossRef]
- Linder, E.V. Probing gravitation, dark energy, and acceleration. Phys. Rev. D 2004, 70, 023511. [Google Scholar] [CrossRef]
- Chevallier, M.; Polarski, D. Accelerating universes with scaling dark matter. Int. J. Mod. Phys. D 2001, 10, 213–223. [Google Scholar] [CrossRef]
- Linder, E.V. Exploring the Expansion History of the Universe. Phys. Rev. Lett. 2003, 90, 091301. [Google Scholar] [CrossRef] [PubMed]
- Ross, A.J.; Samushia, L.; Howlett, C.; Percival, W.J.; Burden, A.; Manera, M. The clustering of the SDSS DR7 main Galaxy sample—I. A 4 per cent distance measure at z = 0.15. Mon. Not. R. Astron. Soc. 2015, 449, 835–847. [Google Scholar] [CrossRef]
- Alam, S.; Ata, M.; Bailey, S.; Beutler, F.; Bizyaev, D.; Blazek, J.A.; Bolton, A.S.; Brownstein, J.R.; Burden, A.; Chuang, C.-H.; et al. The clustering of galaxies in the completed SDSS-III Baryon Oscillation Spectroscopic Survey: Cosmological analysis of the DR12 galaxy sample. Mon. Not. R. Astron. Soc. 2017, 470, 2617–2652. [Google Scholar] [CrossRef]
- Gil-Marin, H.; Bautista, J.E.; Paviot, R.; Vargas, M.; De la Torre, S.; Fromenteau, S.; Alam, S.; Avila, S.; Burtin, E.; Chuang, C.-H.; et al. The Completed SDSS-IV extended Baryon Oscillation Spectroscopic Survey: Measurement of the BAO and growth rate of structure of the luminous red galaxy sample from the anisotropic power spectrum between redshifts 0.6 and 1.0. Mon. Not. R. Astron. Soc. 2020, 498, 2492–2531. [Google Scholar] [CrossRef]
- Raichoor, A.; De Mattia, A.; Ross, A.J.; Zhao, C.; Alam, S.; Avila, S.; Bautista, J.; Brinkmann, J.; Brownstein, J.R.; Burtin, E.; et al. The completed SDSS-IV extended Baryon Oscillation Spectroscopic Survey: Large-scale structure catalogues and measurement of the isotropic BAO between redshift 0.6 and 1.1 for the Emission Line Galaxy Sample. Mon. Not. R. Astron. Soc. 2021, 500, 3254–3274. [Google Scholar] [CrossRef]
- Hou, J.; Sanchez, A.G.; Ross, A.J.; Smith, A.; Neveux, R.; Bautista, J.; Burtin, E.; Zhao, C.; Scoccimarro, R.; Dawson, K.S.; et al. The completed SDSS-IV extended Baryon Oscillation Spectroscopic Survey: BAO and RSD measurements from anisotropic clustering analysis of the quasar sample in configuration space between redshift 0.8 and 2.2. Mon. Not. R. Astron. Soc. 2021, 500, 1201–1221. [Google Scholar] [CrossRef]
- du Mas des Bourboux, H.; Rich, J.; Font-Ribera, A.; de Sainte Agathe, V.; Farr, J.; Etourneau, T.; Le Goff, J.-M.; Cuceu, A.; Balland, C.; Bautista, J.E.; et al. The Completed SDSS-IV Extended Baryon Oscillation Spectroscopic Survey: Baryon Acoustic Oscillations with Lyα Forests. Astron. J. 2020, 901, 153. [Google Scholar] [CrossRef]
- DES Collaboration. Dark Energy Survey Year 3 results: A 2.7 percent measurement of baryon acoustic oscillation distance scale at redshift 0.835. Phys. Rev. D 2022, 105, 043512. [Google Scholar] [CrossRef]
- Sridhar, S.; Song, Y.-S.; Ross, A.J.; Zhou, R.; Newman, J.A.; Chuang, C.-H.; Blum, R.; Gaztanaga, E.; Landriau, M.; Prada, F. Clustering of LRGs in the DECaLS DR8 Footprint: Distance Constraints from Baryon Acoustic Oscillations Using Photometric Redshifts. Astron. J. 2020, 904, 69. [Google Scholar] [CrossRef]
- Beutler, F.; Blake, C.; Colless, M.; Jones, D.H.; Staveley-Smith, L.; Campbell, L.; Parker, Q.; Saunders, W.; Watson, F. The 6dF Galaxy Survey: Baryon acoustic oscillations and the local Hubble constant. Mon. Not. R. Astron. Soc. 2011, 416, 3017–3032. [Google Scholar] [CrossRef]
- Handley, W.J.; Hobson, M.P.; Lasenby, A.N. POLYCHORD: Nested sampling for cosmology. Mon. Not. R. Astron. Soc. Lett. 2015, 450, L61–L65. [Google Scholar] [CrossRef]
- Riess, A.G.; Anand, G.S.; Yuan, W.; Casertano, S.; Dolphin, A.; Macri, L.M.; Breuval, L.; Scolnic, D.; Perrin, M.; Anderson, R.I. Crowded No More: The Accuracy of the Hubble Constant Tested with High-resolution Observations of Cepheids by JWST. Astrophys. J. Lett. 2023, 956, L18. [Google Scholar] [CrossRef]
- Alam, S.; Aubert, M.; Avila, S.; Ball, C.; Bautista, J.E.; Bershady, M.A.; Bizyaev, D.; Blanton, M.R.; Bolton, A.S.; Bovy, J.; et al. Completed SDSS-IV extended Baryon Oscillation Spectroscopic Survey: Cosmological implications from two decades of spectroscopic surveys at the Apache Point Observatory. Phys. Rev. D 2021, 103, 083533. [Google Scholar] [CrossRef]
- Wang, Y.; Zhao, G.; Chuang, C.; Ross, A.J.; Percival, W.J.; Gil-Marín, H.; Cuesta, A.J. The clustering of galaxies in the completed SDSS-III Baryon Oscillation Spectroscopic Survey: Tomographic BAO analysis of DR12 combined sample in configuration space. Mon. Not. R. Astron. Soc. 2017, 469, 3762–3774. [Google Scholar] [CrossRef]
- Zhao, G.-B.; Wang, Y.; Taruya, A.; Zhang, W.; Gil-Marin, H.; de Mattia, A.; Ross, A.J.; Raichoor, A.; Zhao, C.; Percival, W.J.; et al. The completed SDSS-IV extended Baryon Oscillation Spectroscopic Survey: A multitracer analysis in Fourier space for measuring the cosmic structure growth and expansion rate. Mon. Not. R. Astron. Soc. 2021, 504, 33–52. [Google Scholar] [CrossRef]
- Scolnic, D.M.; Jones, D.O.; Rest, A.; Pan, Y.C.; Chornock, R.; Foley, R.J.; Huber, M.E.; Kessler, R.; Narayan, G.; Riess, A.G.; et al. The Complete Light-curve Sample of Spectroscopically Confirmed SNe Ia from Pan-STARRS1 and Cosmological Constraints from the Combined Pantheon Sample. Astron. J. 2018, 859, 101. [Google Scholar] [CrossRef]
- Zhang, C.; Zhang, H.; Yuan, S.; Liu, S.; Zhang, T.-J.; Sun, Y.-C. Four new observational H(z) data from luminous red galaxies in the Sloan Digital Sky Survey data release seven. Res. Astron. Astrophys. 2014, 14, 1221. [Google Scholar] [CrossRef]
- Simon, J.; Verde, L.; Jimenez, R. Constraints on the redshift dependence of the dark energy potential. Phys. Rev. D 2005, 71, 123001. [Google Scholar] [CrossRef]
- Moresco, M.; Cimatti, A.; Jimenez, R.; Pozzetti, L.; Zamorani, G.; Bolzonella, M.; Dunlop, J.; Lamareille, F.; Mignoli, M.; Pearce, H.; et al. Improved constraints on the expansion rate of the Universe up to z ≈ 1.1 from the spectroscopic evolution of cosmic chronometers. J. Cosmol. Astropart. Phys. 2012, 8, 6. [Google Scholar] [CrossRef]
- Moresco, M.; Pozzetti, L.; Cimatti, A.; Jimenez, R.; Maraston, C.; Verde, L.; Thomas, D.; Citro, A.; Tojeiro, R.; Wilkinson, D. A 6 percent measurement of the Hubble parameter at z ≈ 0.45: Direct evidence of the epoch of cosmic re-acceleration. J. Cosmol. Astropart. Phys. 2016, 5, 14. [Google Scholar] [CrossRef]
- Ratsimbazafy, A.L.; Loubser, S.I.; Crawford, S.M.; Cress, C.M.; Bassett, B.A.; Nichol, R.C.; Väisänen, P. Age-dating luminous red galaxies observed with the Southern African Large Telescope. Mon. Not. R. Astron. Soc. 2017, 467, 3239–3254. [Google Scholar] [CrossRef]
- Stern, D.; Jimenez, R.; Verde, L.; Kamionkowski, M.; Stanford, S.A. Cosmic chronometers: Constraining the equation of state of dark energy. I: H(z) measurements. J. Cosmol. Astropart. Phys. 2010, 2, 8. [Google Scholar] [CrossRef]
- Borghi, N.; Moresco, M.; Cimatti, A. Toward a Better Understanding of Cosmic Chronometers: A New Measurement of H(z) at z ≈ 0.7. Astrophys. J. Lett. 2022, 928, L4. [Google Scholar] [CrossRef]
- Jiao, K.; Borghi, N.; Moresco, M.; Zhang, T.-J. New Observational H(z) Data from Full-spectrum Fitting of Cosmic Chronometers in the LEGA-C Survey. Astrophys. J. Suppl. Ser. 2023, 265, 48. [Google Scholar] [CrossRef]
- Moresco, M. Raising the bar: New constraints on the Hubble parameter with cosmic chronometers at z ≈ 2. Mon. Not. R. Astron. Soc. Lett. 2015, 450, L16–L20. [Google Scholar] [CrossRef]
- Nunes, R.C.; Yadav, S.K.; Jesus, J.F.; Bernui, A. Cosmological parameter analyses using transversal BAO data. Mon. Not. R. Astron. Soc. 2020, 497, 2133–2141. [Google Scholar] [CrossRef]
- Nunes, R.C.; Bernui, A. BAO signatures in the 2-point angular correlations and the Hubble tension. Eur. Phys. J. C 2020, 80, 1025. [Google Scholar] [CrossRef]
- Verde, L.; Bernal, J.L.; Heavens, A.F.; Jimenez, R. The length of the low-redshift standard ruler. Mon. Not. R. Astron. Soc. 2017, 467, 731–736. [Google Scholar] [CrossRef]
- Lemos, T.; Ruchika; Carvalho, J.C.; Alcaniz, J. Low-redshift estimates of the absolute scale of baryon acoustic oscillations. Eur. Phys. J. C 2023, 83, 495. [Google Scholar] [CrossRef]
- Pogosian, L.; Zhao, G.-B.; Jedamzik, K. Recombination-independent Determination of the Sound Horizon and the Hubble Constant from BAO. Astrophys. J. Lett. 2020, 904, L7. [Google Scholar] [CrossRef]
- Akaike, H. A new look at the statistical model identification. IEEE Trans. Autom. Control. 1974, 19, 716–723. [Google Scholar] [CrossRef]
- Schwarz, G. Estimating the Dimension of a Model. Ann. Statist. 1978, 6, 461–464. [Google Scholar] [CrossRef]
Figure 1.
The constraints of the posterior distributions for CDM with and without a test random covariance matrix with twelve components. The distribution with covariance matrix between null and twelve components is almost negligible, nearly indistinguishable from the uncorrelated dataset.
Figure 1.
The constraints of the posterior distributions for CDM with and without a test random covariance matrix with twelve components. The distribution with covariance matrix between null and twelve components is almost negligible, nearly indistinguishable from the uncorrelated dataset.

Figure 2.
The constraints on the parameters using different observational data measurements in the CDM model with and . BAO refers to the baryon acoustic oscillations dataset from Table 1. CC refers to the Hubble measurements based on the cosmic chronometers method listed in Table 2 and Pantheon refers to the SNeIa dataset. R22 denotes the measurement of the Hubble constant as a Gaussian prior [7].

Figure 3.
The posterior distributions for different observational data measurements with the wCDM model with and . BAO refers to the baryon acoustic oscillations dataset from Table 1. CC refers to the cosmic chronometers and Pantheon refers to the Hubble diagram from SNeIa. R22 denotes the Riess 2022 measurement of the Hubble constant as a Gaussian prior [7].

Figure 4.
The posterior distributions for different observational data measurements of wCDM model with and in the contour plane. The BAO refers to the baryon acoustic oscillations dataset from Table 1. The CC dataset refers to the cosmic chronometers and Pantheon refers to the Hubble diagram from SNeIa. R22 denotes [7] measurement of the Hubble constant as a Gaussian prior.

Figure 5.
The posterior distributions for different observational data measurements with the CDM model with and . BAO represents the dataset given in Table 1. CC represents the dataset given in Table 2, and Pantheon refers to the Hubble diagram from SNeIa. R22 denotes [7] measurement of the Hubble constant as a Gaussian prior.

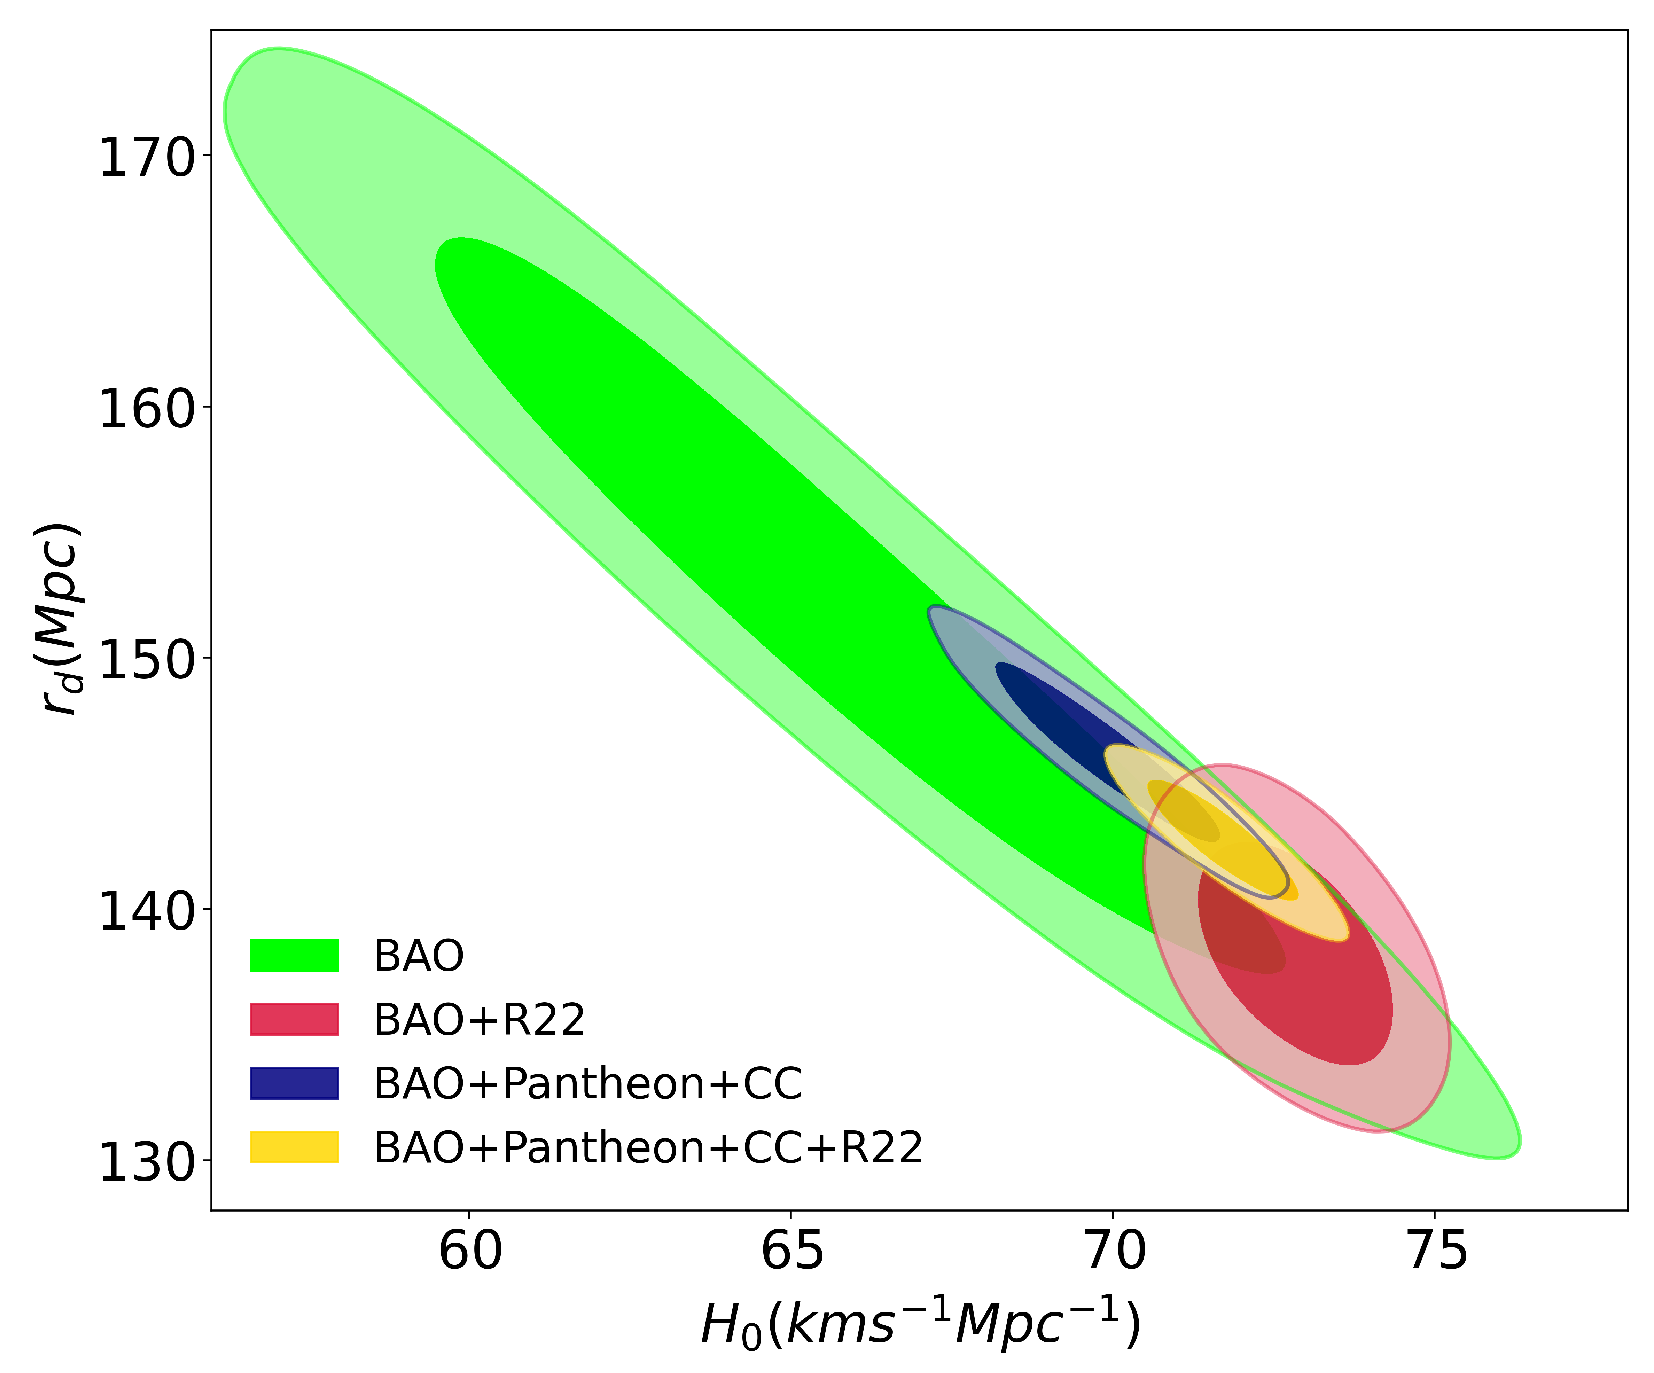
Figure 6.
The figure exhibits the posterior distributions for different observational data measurements with the CDM with and in the contour plane. BAO refers to the baryon acoustic oscillations dataset in Table 1. CC refers to the cosmic chronometers dataset listed in Table 2, and Pantheon refers to the Hubble diagram from SNeIa. R22 denotes Riess 2022 measurement of the Hubble constant [7].

Table 2.
The latest 33 measurements (in units of (km s Mpc)) obtained with the CC method and their associated errors on which we perform our analysis. It is noted that all these measurements are independent, since they come from different datasets.
Table 2.
The latest 33 measurements (in units of (km s Mpc)) obtained with the CC method and their associated errors on which we perform our analysis. It is noted that all these measurements are independent, since they come from different datasets.
| z | Method | Reference | ||
|---|---|---|---|---|
| 0.07 | 69 | 19.6 | Full-spectrum fitting | [57] |
| 0.09 | 69 | 12 | Full-spectrum fitting | [58] |
| 0.12 | 68.6 | 26.2 | Full-spectrum fitting | [57] |
| 0.17 | 83 | 8 | Full-spectrum fitting | [58] |
| 0.179 | 75 | 4 | Calibrated D4000 | [59] |
| 0.199 | 75 | 5 | Calibrated D4000 | [59] |
| 0.20 | 72.9 | 29.6 | Full-spectrum fitting | [57] |
| 0.27 | 77 | 14 | Full-spectrum fitting | [58] |
| 0.28 | 88.8 | 36.6 | Full-spectrum fitting | [57] |
| 0.352 | 83 | 14 | Calibrated D4000 | [59] |
| 0.38 | 83 | 13.5 | Calibrated D4000 | [60] |
| 0.4 | 95 | 17 | Full-spectrum fitting | [58] |
| 0.4004 | 77 | 10.2 | Calibrated D4000 | [60] |
| 0.425 | 87.1 | 11.2 | Calibrated D4000 | [60] |
| 0.445 | 92.8 | 12.9 | Calibrated D4000 | [60] |
| 0.47 | 89.0 | 49.6 | Full-spectrum fitting | [61] |
| 0.4783 | 80.9 | 9 | Calibrated D4000 | [60] |
| 0.48 | 97 | 62 | Full-spectrum fitting | [62] |
| 0.593 | 104 | 13 | Calibrated D4000 | [59] |
| 0.68 | 92 | 8 | Calibrated D4000 | [59] |
| 0.75 | 98.8 | 33.6 | Lick indices | [63] |
| 0.781 | 105 | 12 | Calibrated D4000 | [59] |
| 0.80 | 113.1 | 28.5 | Full-spectrum fitting | [64] |
| 0.875 | 125 | 17 | Calibrated D4000 | [59] |
| 0.88 | 90 | 40 | Full-spectrum fitting | [62] |
| 0.9 | 117 | 23 | Full-spectrum fitting | [58] |
| 1.037 | 154 | 20 | Calibrated D4000 | [59] |
| 1.3 | 168 | 17 | Full-spectrum fitting | [58] |
| 1.363 | 160 | 33.6 | Calibrated D4000 | [65] |
| 1.43 | 177 | 18 | Full-spectrum fitting | [58] |
| 1.53 | 140 | 14 | Full-spectrum fitting | [58] |
| 1.75 | 202 | 40 | Full-spectrum fitting | [58] |
| 1.965 | 186.5 | 50.4 | Calibrated D4000 | [65] |
Table 3.
Variation of some cosmological parameters according to the number of correlated pairs. The values with uncorrelated pairs () are slightly different when and random correlated pairs are introduced.
Table 3.
Variation of some cosmological parameters according to the number of correlated pairs. The values with uncorrelated pairs () are slightly different when and random correlated pairs are introduced.
| n Correlated Pairs | BAO | BAO + R22 |
|---|---|---|
| n = 0 | = 0.269 ± 0.015 | = 0.269 ± 0.017 |
| = 0.725 ± 0.011 | = 0.725 ± 0.013 | |
| n = 6 | = 0.263 ± 0.015 | = 0.264 ± 0.015 |
| = 0.731 ± 0.015 | = 0.730 ± 0.014 | |
| n = 12 | = 0.262 ± 0.017 | = 0.263 ± 0.015 |
| = 0.732 ± 0.012 | = 0.732 ± 0.011 |
Table 4.
Constraints at 95% CL on the cosmological parameters for the standard CDM model based on the baryon acoustic oscillations dataset (BAO) listed in Table 1, the Hubble measurements based on cosmic chronometers (CCs) method listed in Table 2, Pantheon dataset, and additional Gaussian prior R22.
| Parameter | BAO | BAO + R22 | BAO + Pantheon + CC | BAO + Pantheon + CC + R22 |
|---|---|---|---|---|
| (km s Mpc) | 68.01 ± 4.53 | 72.82 ± 1.01 | 69.76 ± 1.71 | 71.68 ± 1.65 |
| 0.270 ± 0.039 | 0.268 ± 0.037 | 0.275 ± 0.025 | 0.271 ± 0.026 | |
| 0.725 ± 0.022 | 0.726 ± 0.023 | 0.720 ± 0.014 | 0.724 ± 0.015 | |
| (Mpc) | 150.45 ± 9.89 | 140.14 ± 3.16 | 145.88 ± 3.32 | 142.10 ± 2.49 |
| 0.999 ± 0.074 | 0.938 ± 0.023 | 0.971 ± 0.028 | 0.949 ± 0.024 |
Table 5.
Constraints at 95% CL on the cosmological parameters for the wCDM model based on baryon acoustic oscillations (BAOs), cosmic chronometers (CCs), Pantheon, and additional Gaussian prior R22.
Table 5.
Constraints at 95% CL on the cosmological parameters for the wCDM model based on baryon acoustic oscillations (BAOs), cosmic chronometers (CCs), Pantheon, and additional Gaussian prior R22.
| Parameter | BAO | BAO + R22 | BAO + Pantheon + CC | BAO + Pantheon + CC + R22 |
|---|---|---|---|---|
| (km s Mpc) | 65.83 ± 4.73 | 72.56 ± 2.10 | 69.83 ± 1.06 | 71.60 ± 1.02 |
| 0.193 ± 0.077 | 0.201 ± 0.068 | 0.273 ± 0.015 | 0.273 ± 0.016 | |
| 0.786 ± 0.050 | 0.780 ± 0.046 | 0.721 ± 0.013 | 0.721 ± 0.013 | |
| w | −0.753 ± 0.168 | −0.786 ± 0.210 | −1.001 ± 0.040 | −1.014 ± 0.053 |
| (Mpc) | 150.67 ± 10.32 | 136.90 ± 2.48 | 145.73 ± 3.45 | 142.44 ± 2.24 |
| 0.996 ± 0.069 | 0.924 ± 0.018 | 0.970 ± 0.029 | 0.949 ± 0.025 |
Table 6.
Constraints at 95% CL on the cosmological parameters for the CDM model based on baryon acoustic oscillations (BAOs), cosmic chronometers (CCs), Pantheon-QSR-GRB, and additional prior R22.
Table 6.
Constraints at 95% CL on the cosmological parameters for the CDM model based on baryon acoustic oscillations (BAOs), cosmic chronometers (CCs), Pantheon-QSR-GRB, and additional prior R22.
| Parameters | BAO | BAO+R22 | BAO+Pantheon+CC | BAO + Pantheon + CC + R22 |
|---|---|---|---|---|
| (km s Mpc) | 65.82 ± 4.43 | 72.83 ± 1.41 | 69.90 ± 1.06 | 71.71 ± 1.06 |
| 0.159 ± 0.098 | 0.165 ± 0.073 | 0.183 ± 0.056 | 0.178 ± 0.050 | |
| 0.826 ± 0.080 | 0.820 ± 0.065 | 0.810 ± 0.050 | 0.814 ± 0.050 | |
| −1.214 ± 0.130 | −1.149 ± 0.121 | −1.027 ± 0.069 | −1.020 ± 0.072 | |
| −0.344 ± 0.432 | −0.478 ± 0.390 | −0.848 ± 0.180 | −0.878 ± 0.161 | |
| (Mpc) | 152.01 ± 10.18 | 138.26 ± 2.82 | 146.18 ± 2.35 | 142.73 ± 2.36 |
| 1.002 ± 0.066 | 0.930 ± 0.022 | 0.974 ± 0.033 | 0.950 ± 0.035 |
Disclaimer/Publisher’s Note: The statements, opinions and data contained in all publications are solely those of the individual author(s) and contributor(s) and not of MDPI and/or the editor(s). MDPI and/or the editor(s) disclaim responsibility for any injury to people or property resulting from any ideas, methods, instructions or products referred to in the content. |
© 2023 by the author. Licensee MDPI, Basel, Switzerland. This article is an open access article distributed under the terms and conditions of the Creative Commons Attribution (CC BY) license (https://creativecommons.org/licenses/by/4.0/).
Share and Cite
MDPI and ACS Style
Lozano Torres, J.A. Testing Cosmic Acceleration from the Late-Time Universe. Astronomy 2023, 2, 300-314. https://doi.org/10.3390/astronomy2040020
AMA Style
Lozano Torres JA. Testing Cosmic Acceleration from the Late-Time Universe. Astronomy. 2023; 2(4):300-314. https://doi.org/10.3390/astronomy2040020
Chicago/Turabian StyleLozano Torres, Jose Agustin. 2023. "Testing Cosmic Acceleration from the Late-Time Universe" Astronomy 2, no. 4: 300-314. https://doi.org/10.3390/astronomy2040020