New Strong Constraints on the Central Behaviour of Spherical Galactic Models


Abstract
:1. Introduction
2. Formulation of the Statement
3. A Five-Dimensional Class of Spherically Symmetric Galactic Models
4. Mathematical Discussion
- 1.
- 2.
- Dehnen models—They correspond to , , . The integrated mass profile is
- 3.
- 4.
- 5.
- Pseudo-isothermal sphere—It corresponds to , , . The integrated mass profile is
- 6.
- Modified Hubble profile—It corresponds to , , . The integrated mass profile is
- 7.
- Perfect sphere model—It corresponds to , , . The integrated mass profile is
- 8.
- Plummer sphere model—It corresponds to , , . The integrated mass profile is
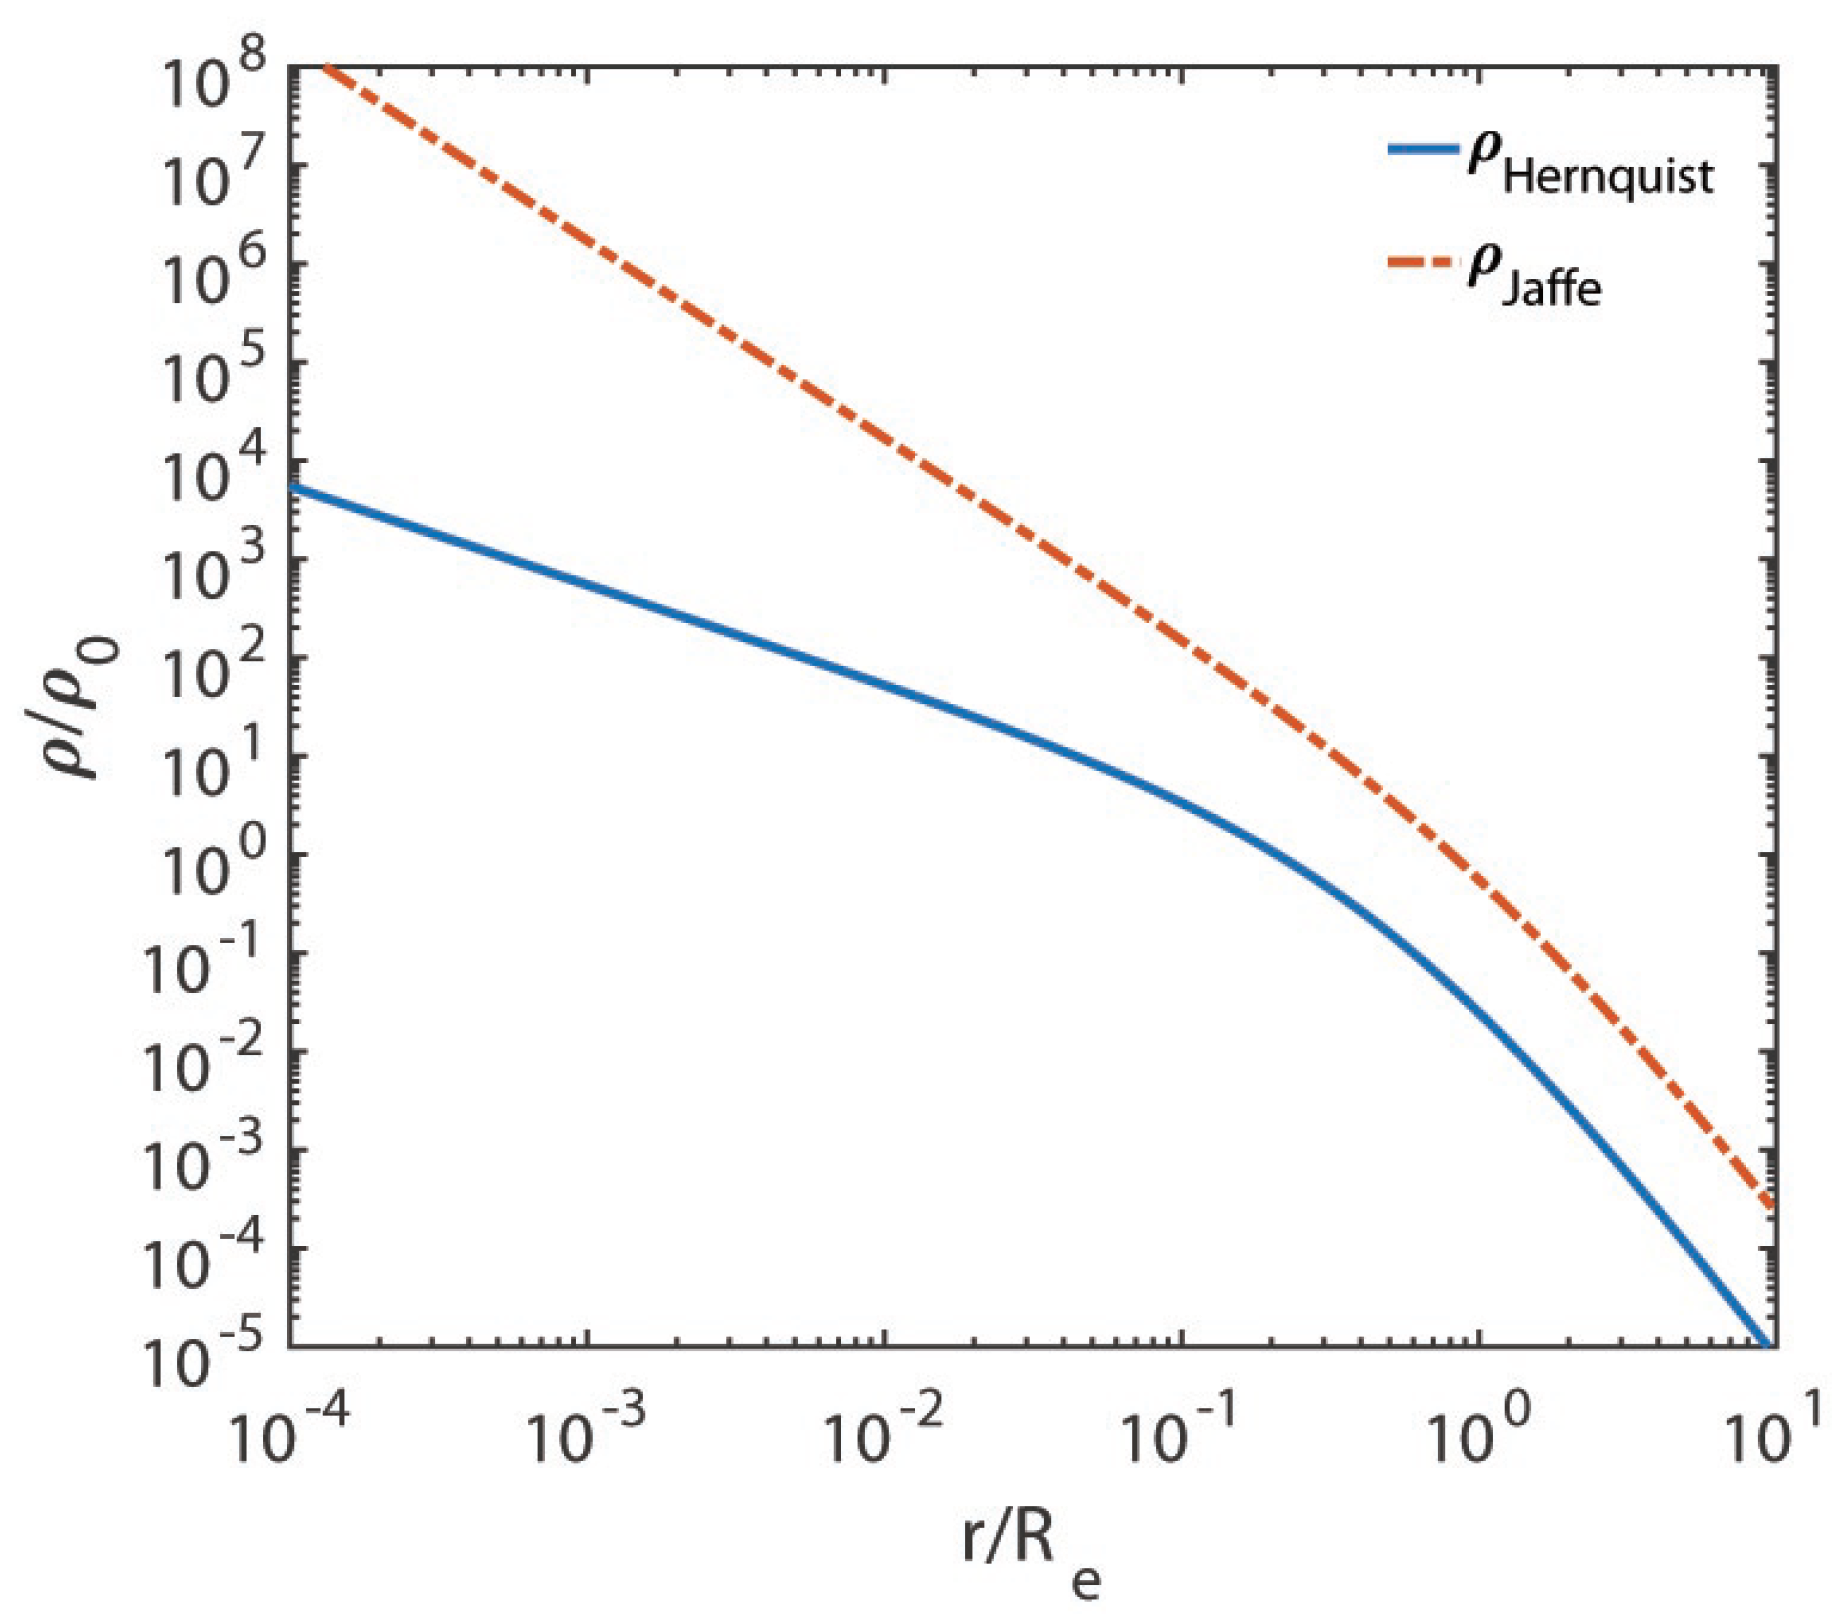
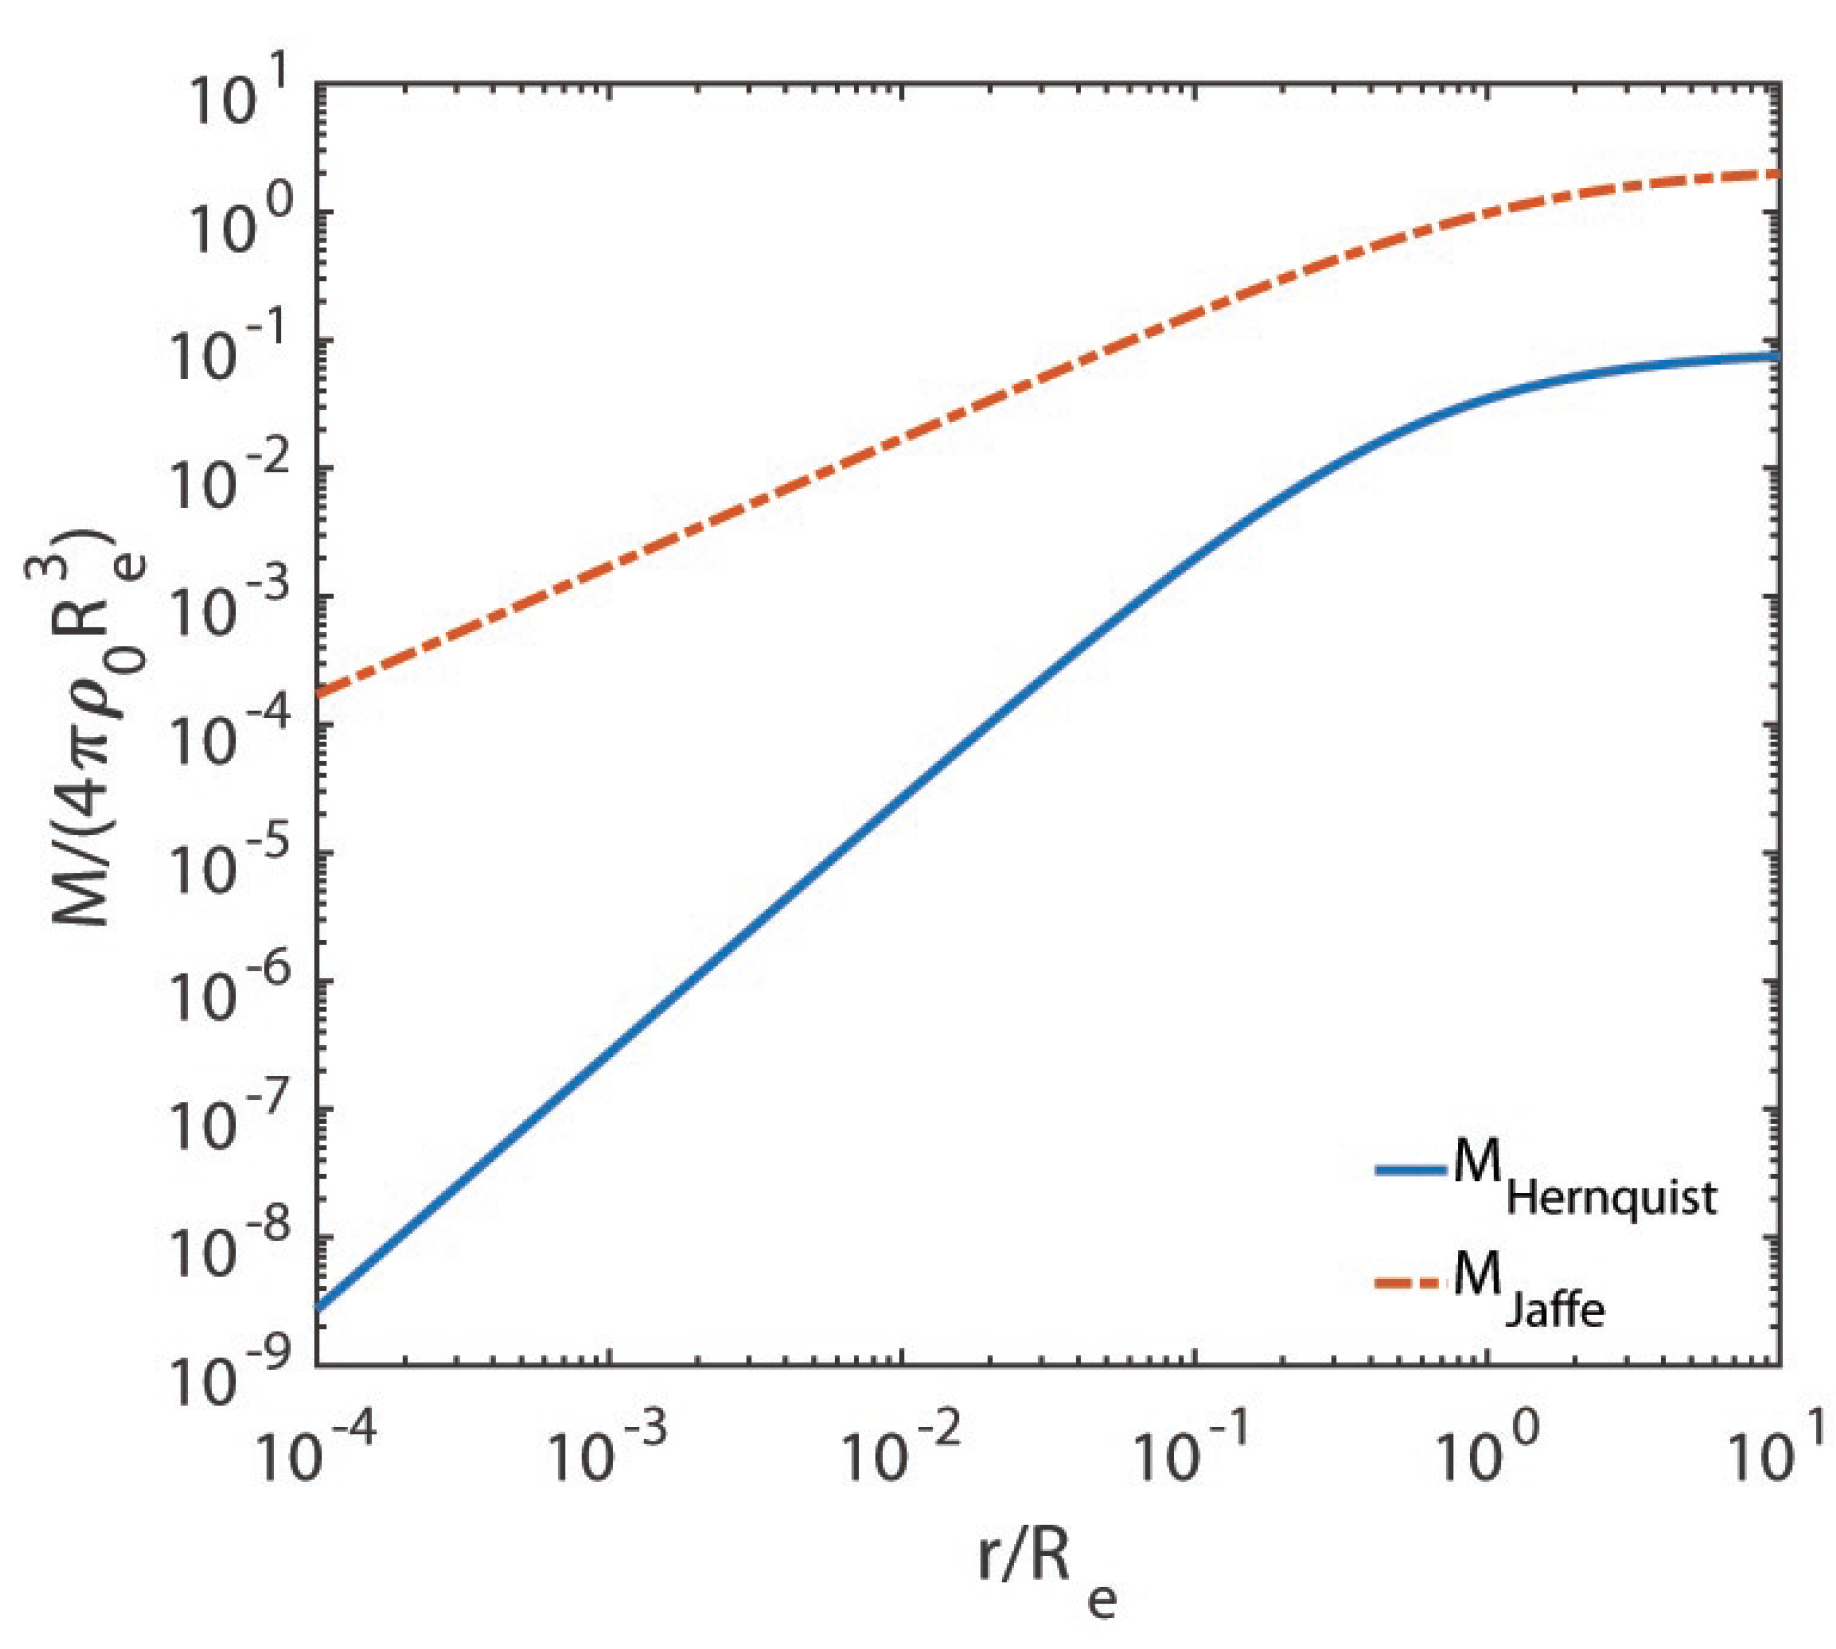
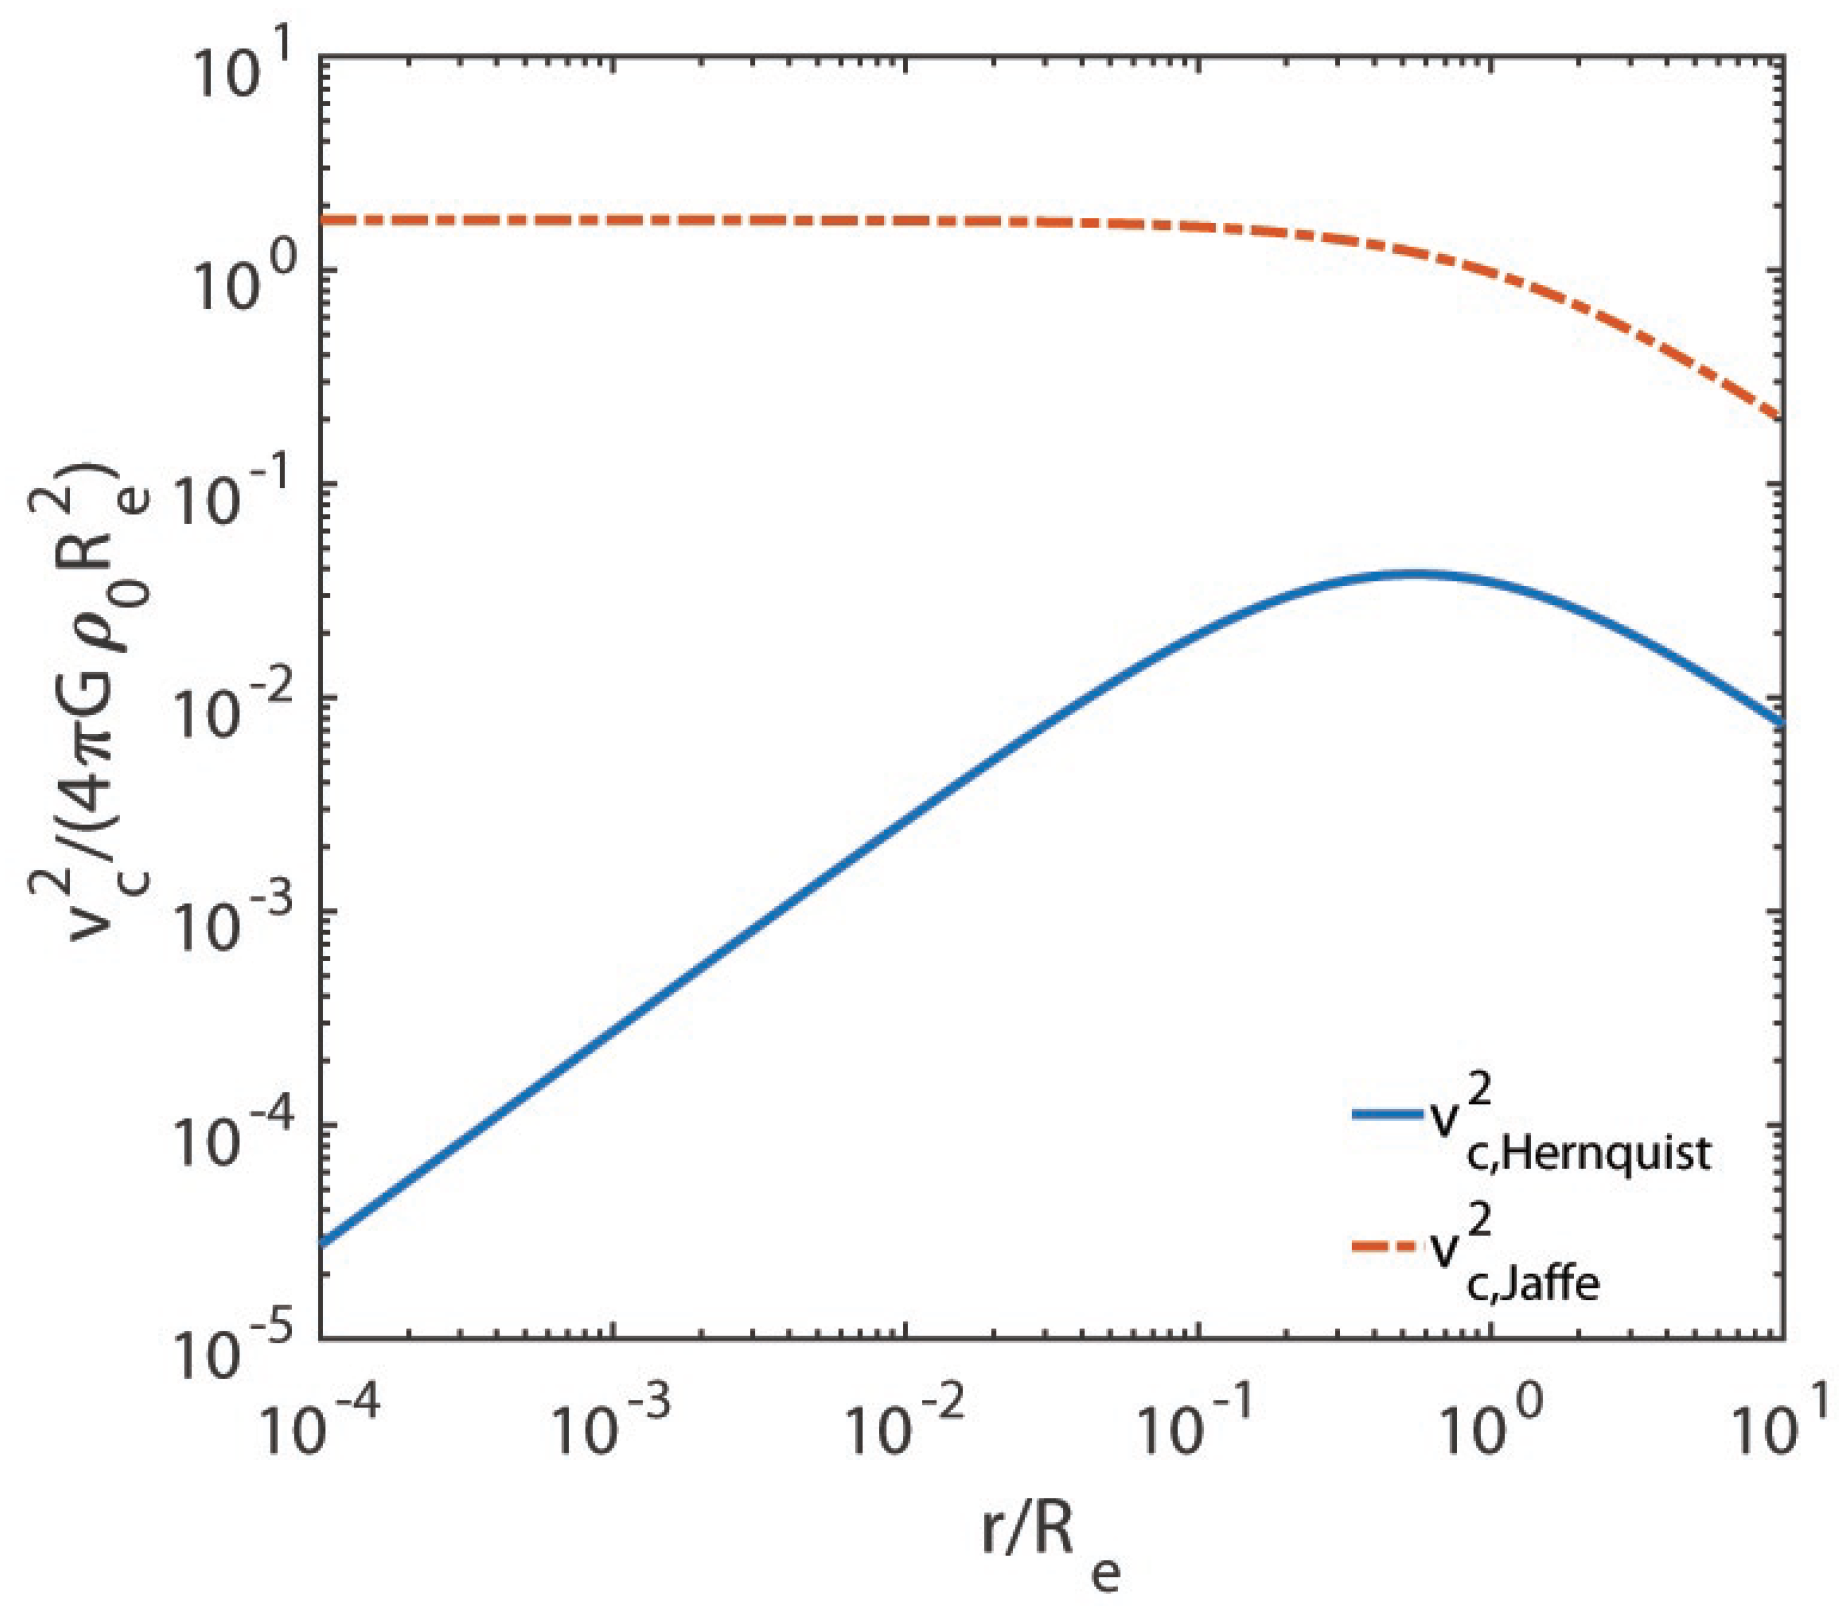
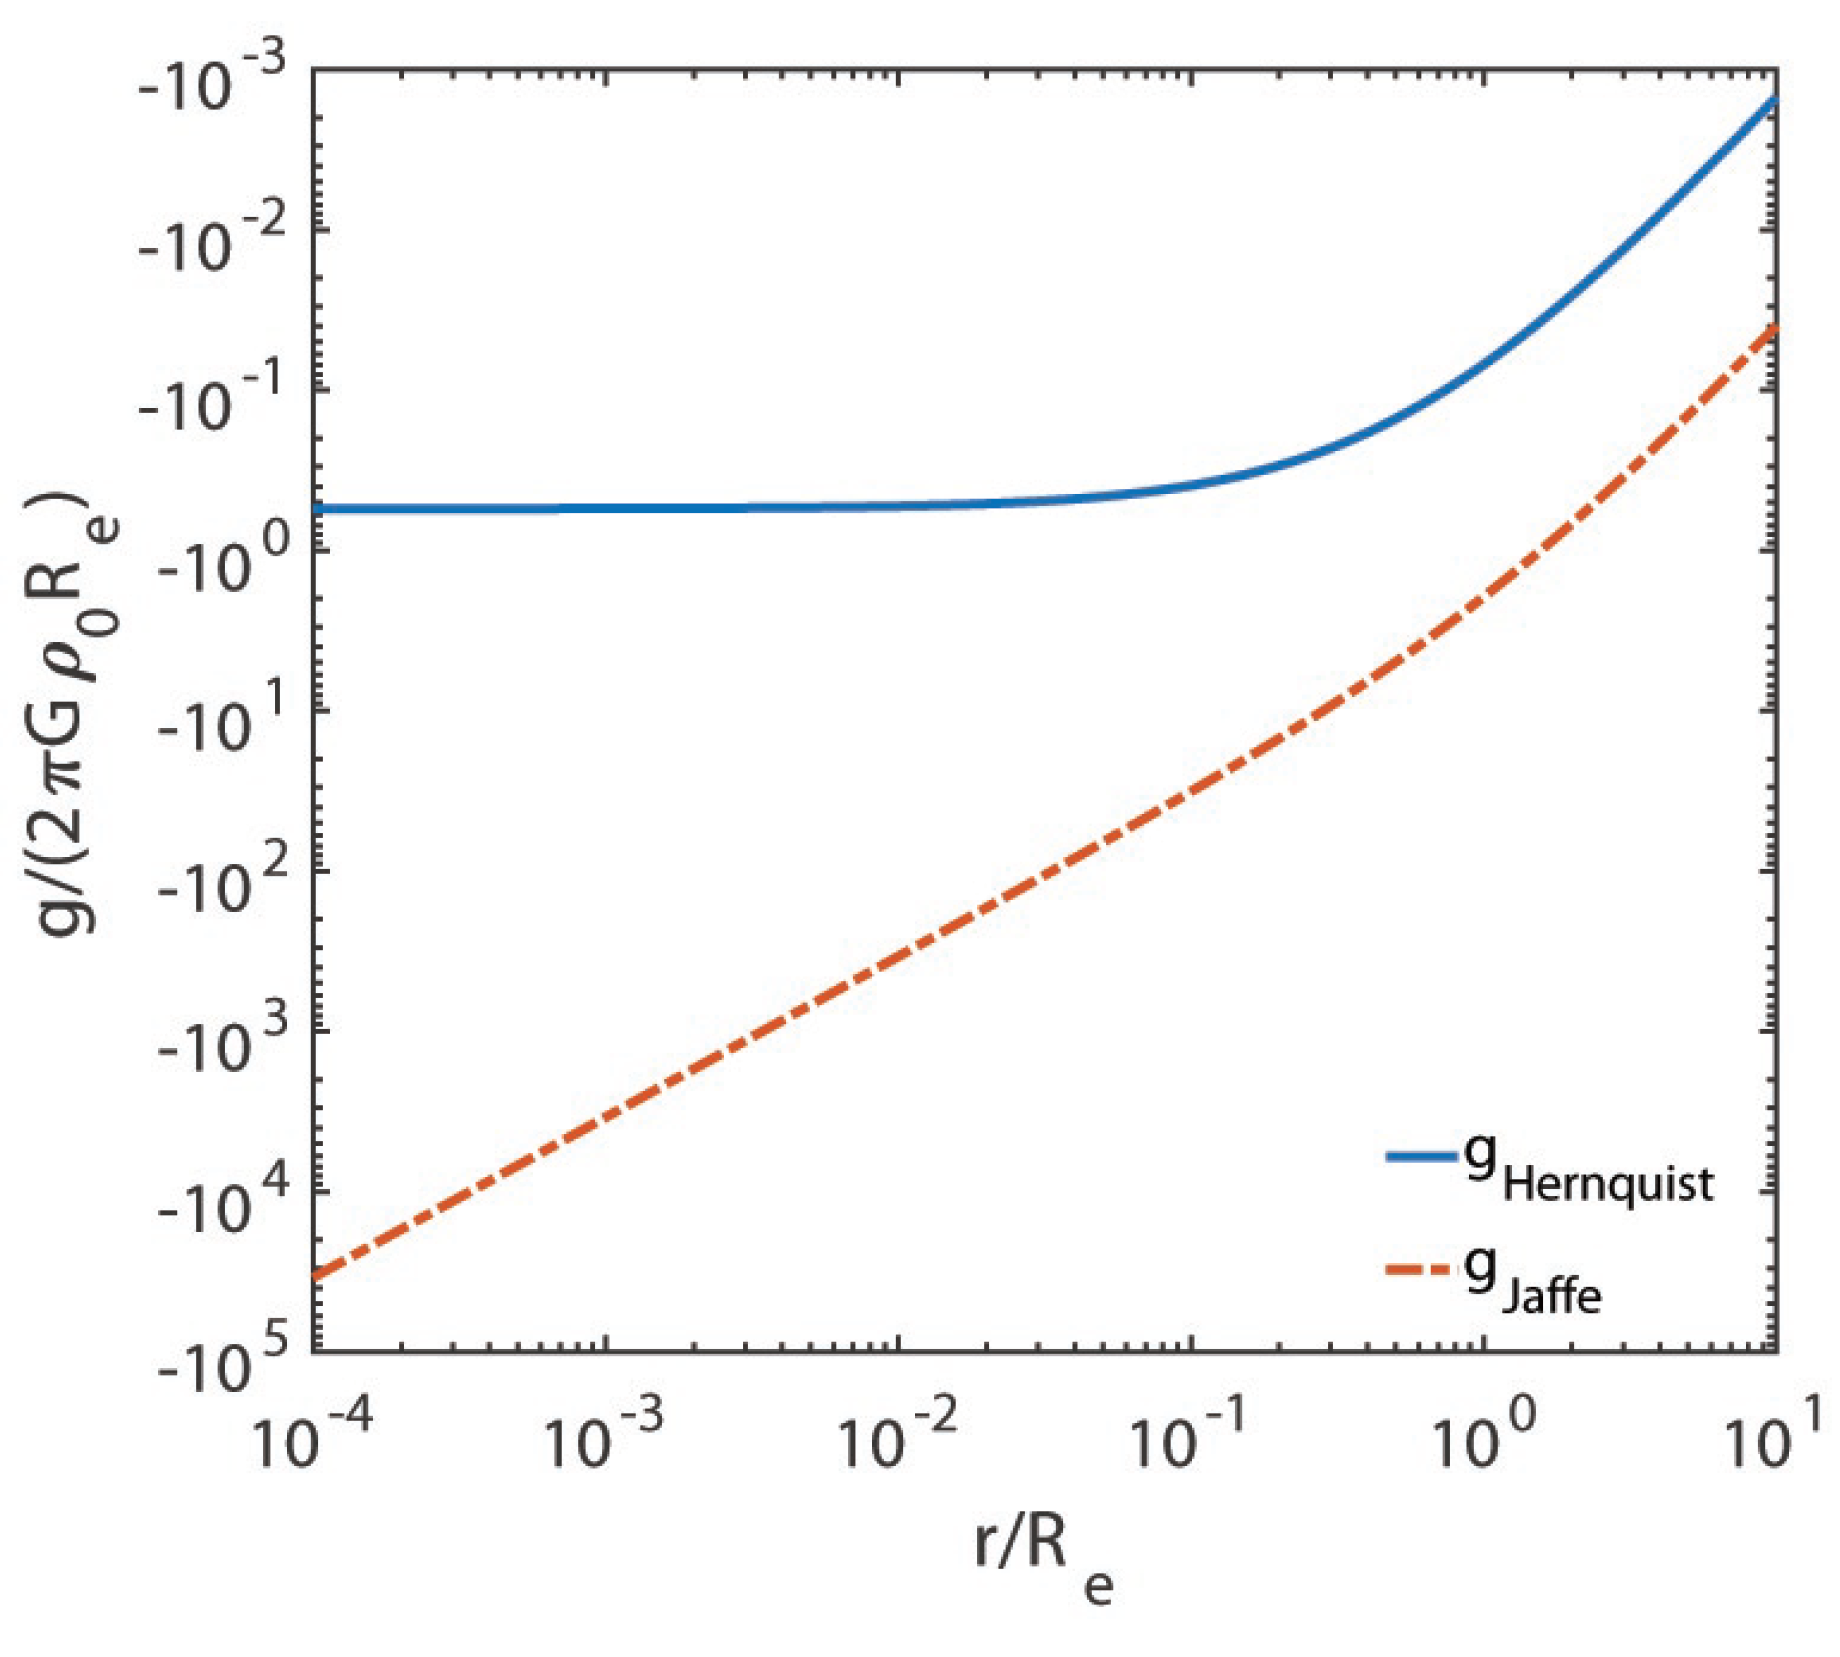
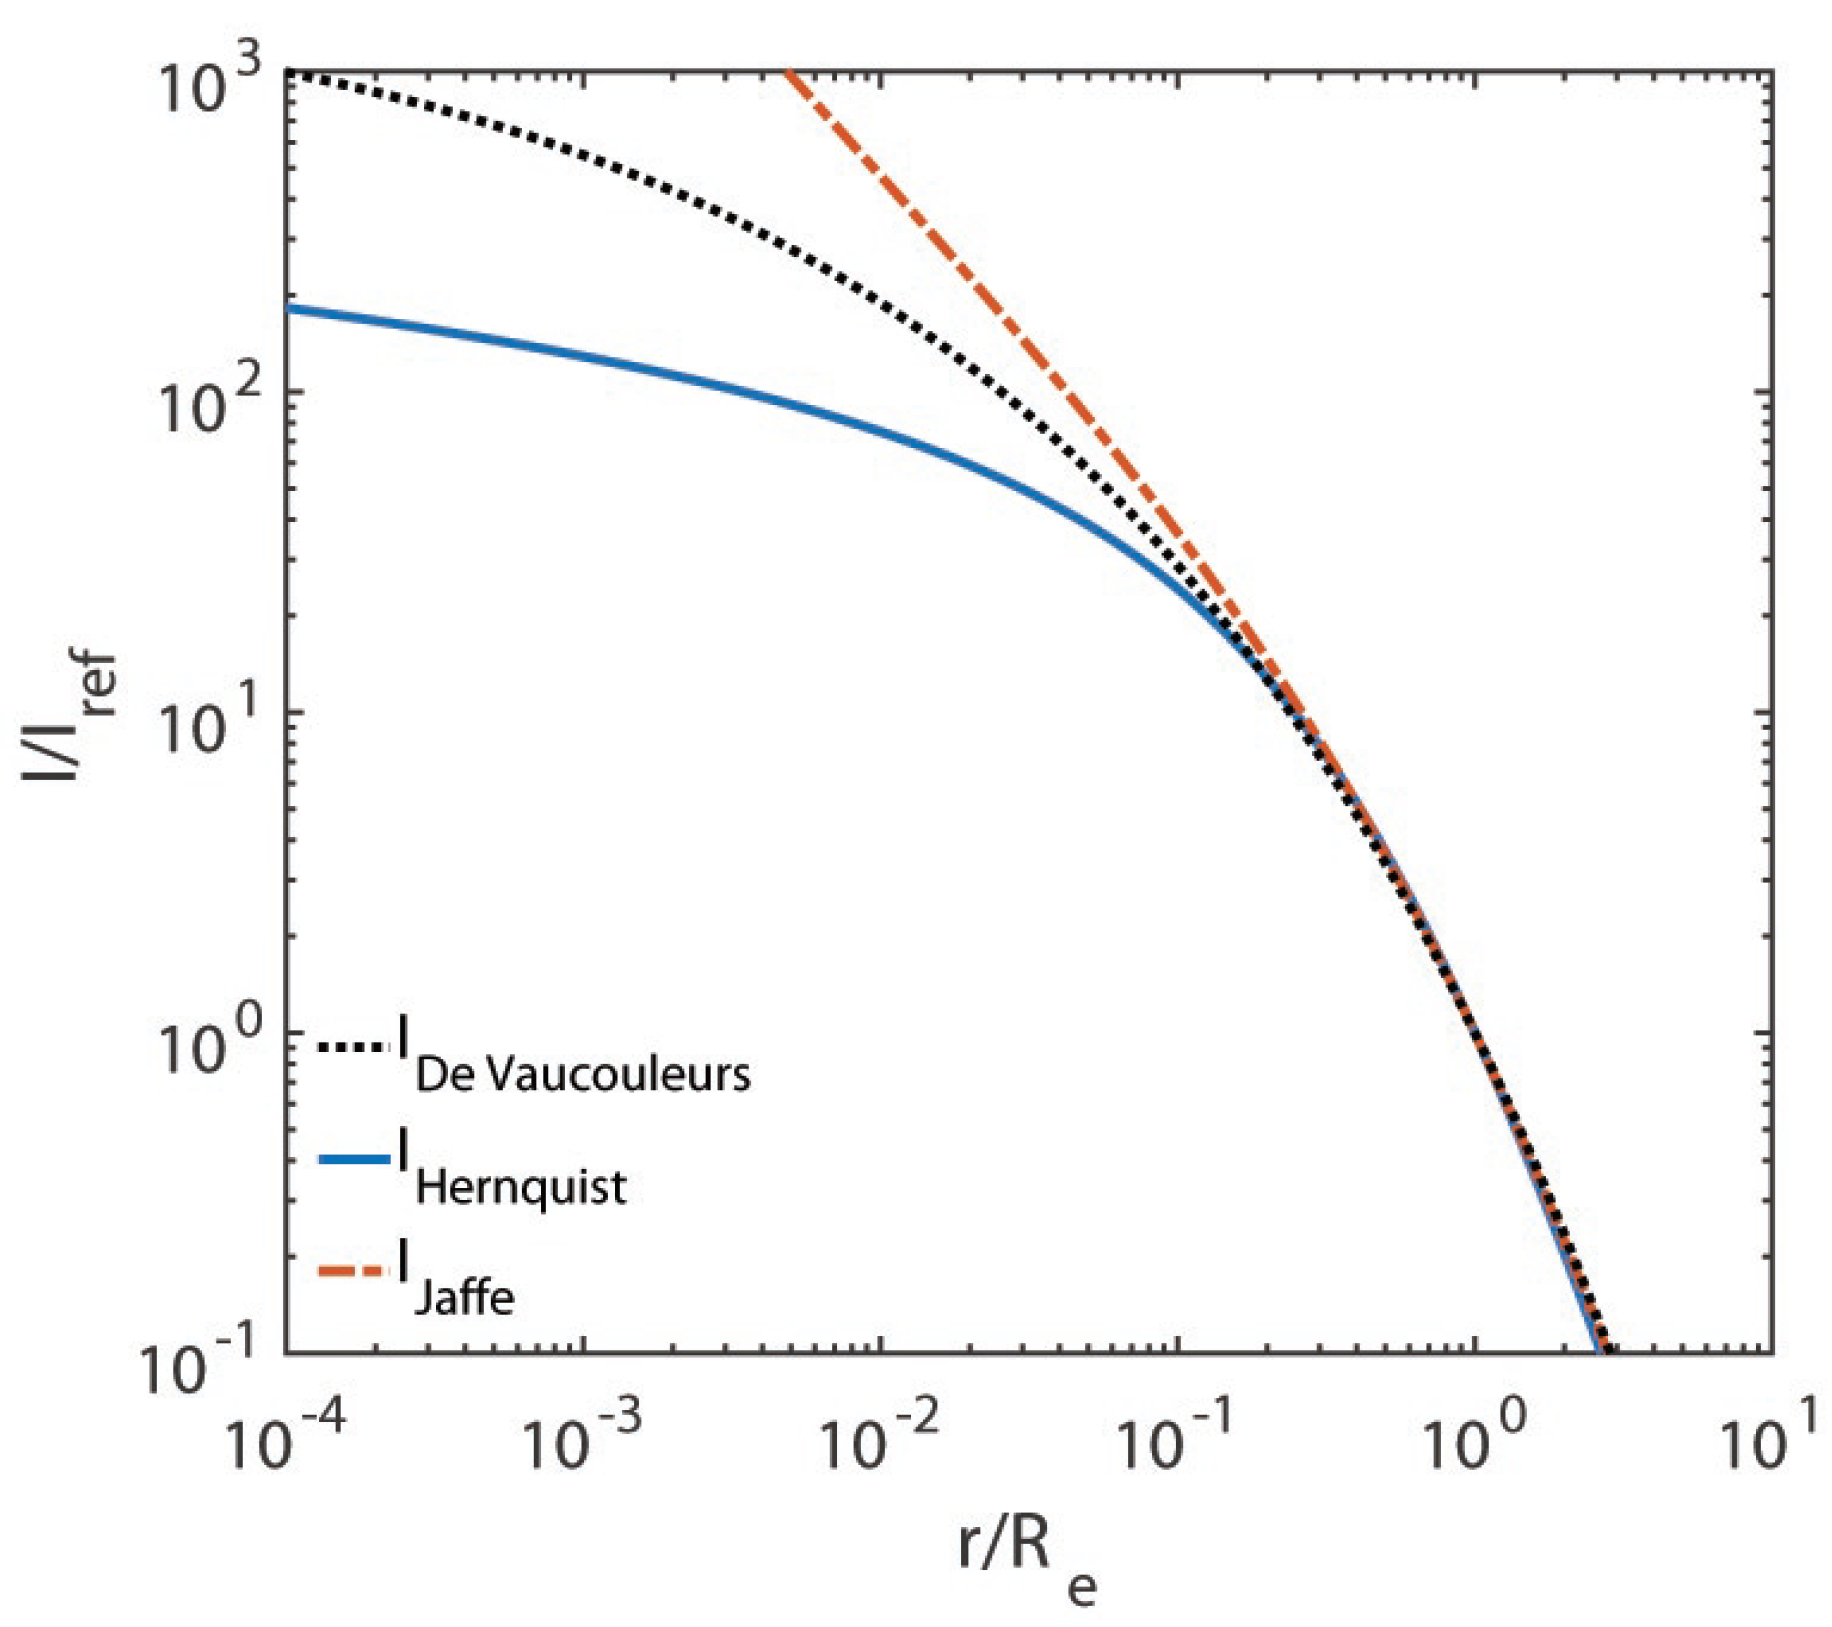
5. Real Spheroidal Ellipticals and Bulges
- Gebhardt et al. (2000) find and [16]. These authors choose the definition of within the slit aperture of length , where is the bulge effective radius.
- Merritt and Ferrarese (2001) obtain and [17]. They use the standard definition to evaluate inside .
- Tremaine et al. (2002) obtain and [15]. They estimate with a variety of techniques.
- (1)
- Radial distance: .
- (2)
- Mass density: .
- (3)
- Integrated mass profile: .
- (4)
- Square circular velocity: .
- (5)
- Gravitational field: .
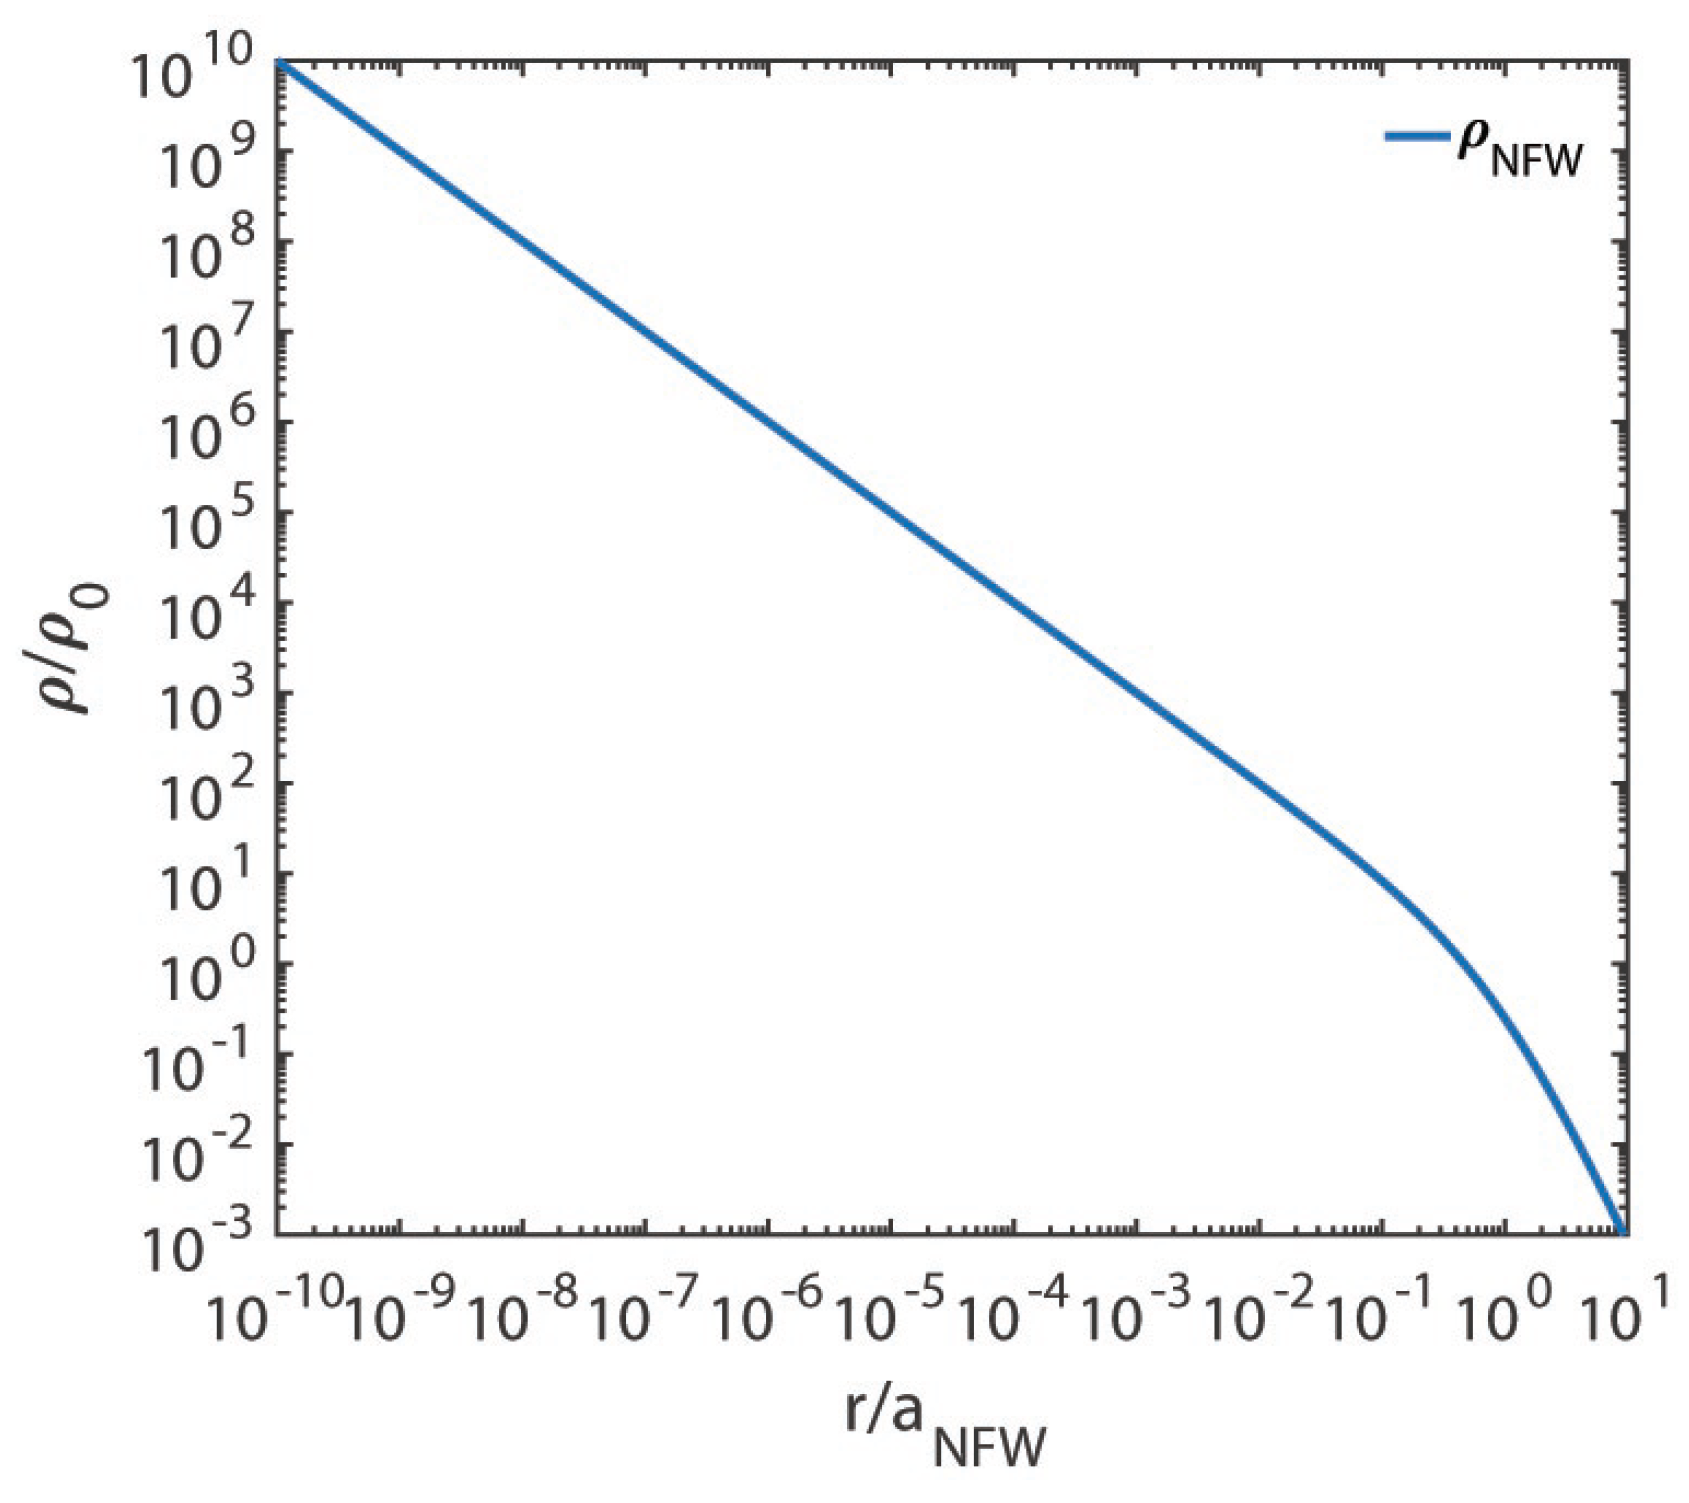
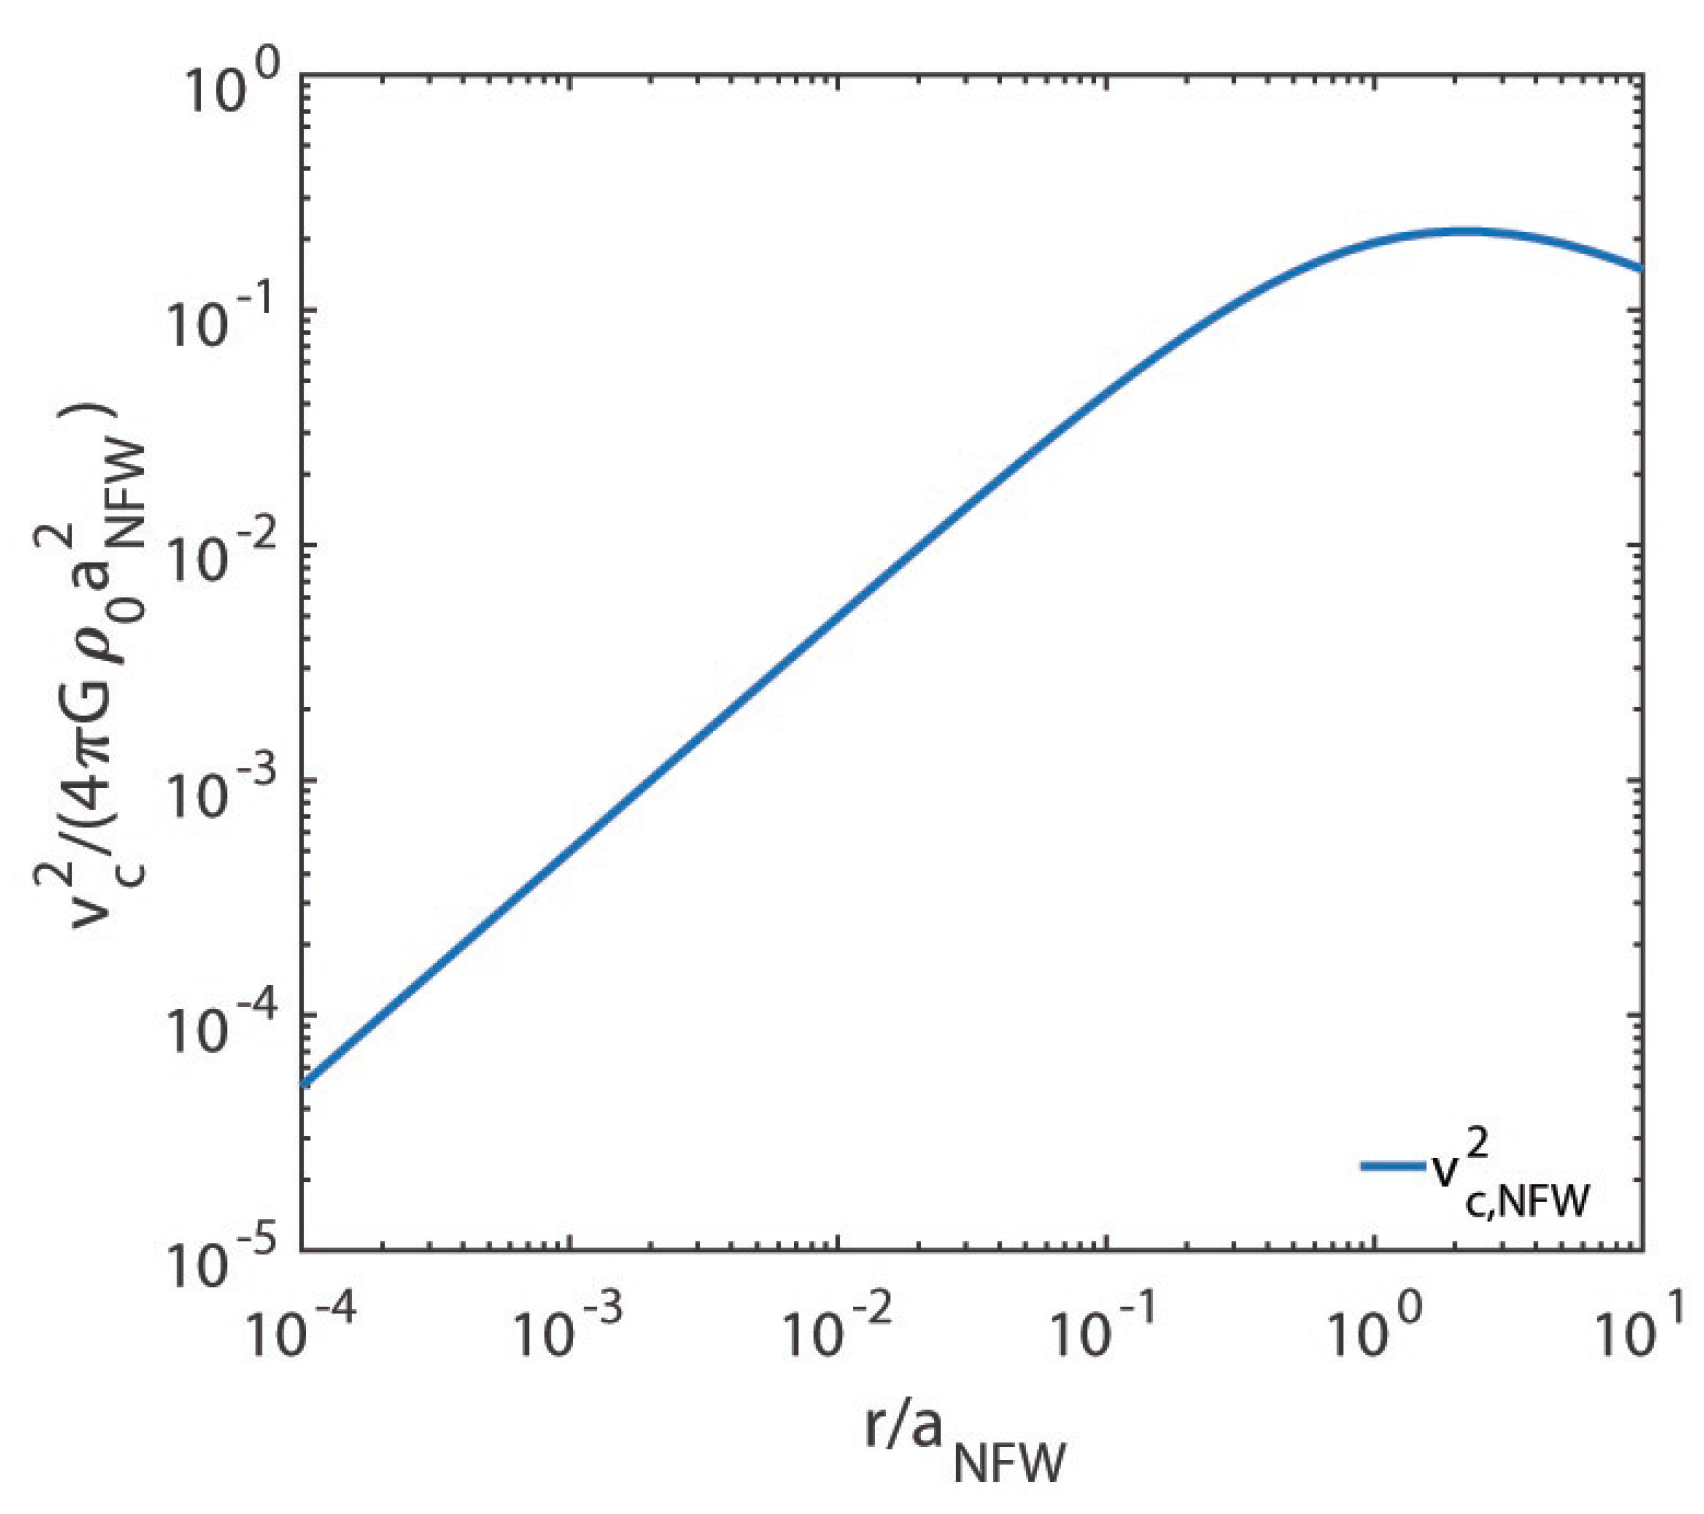
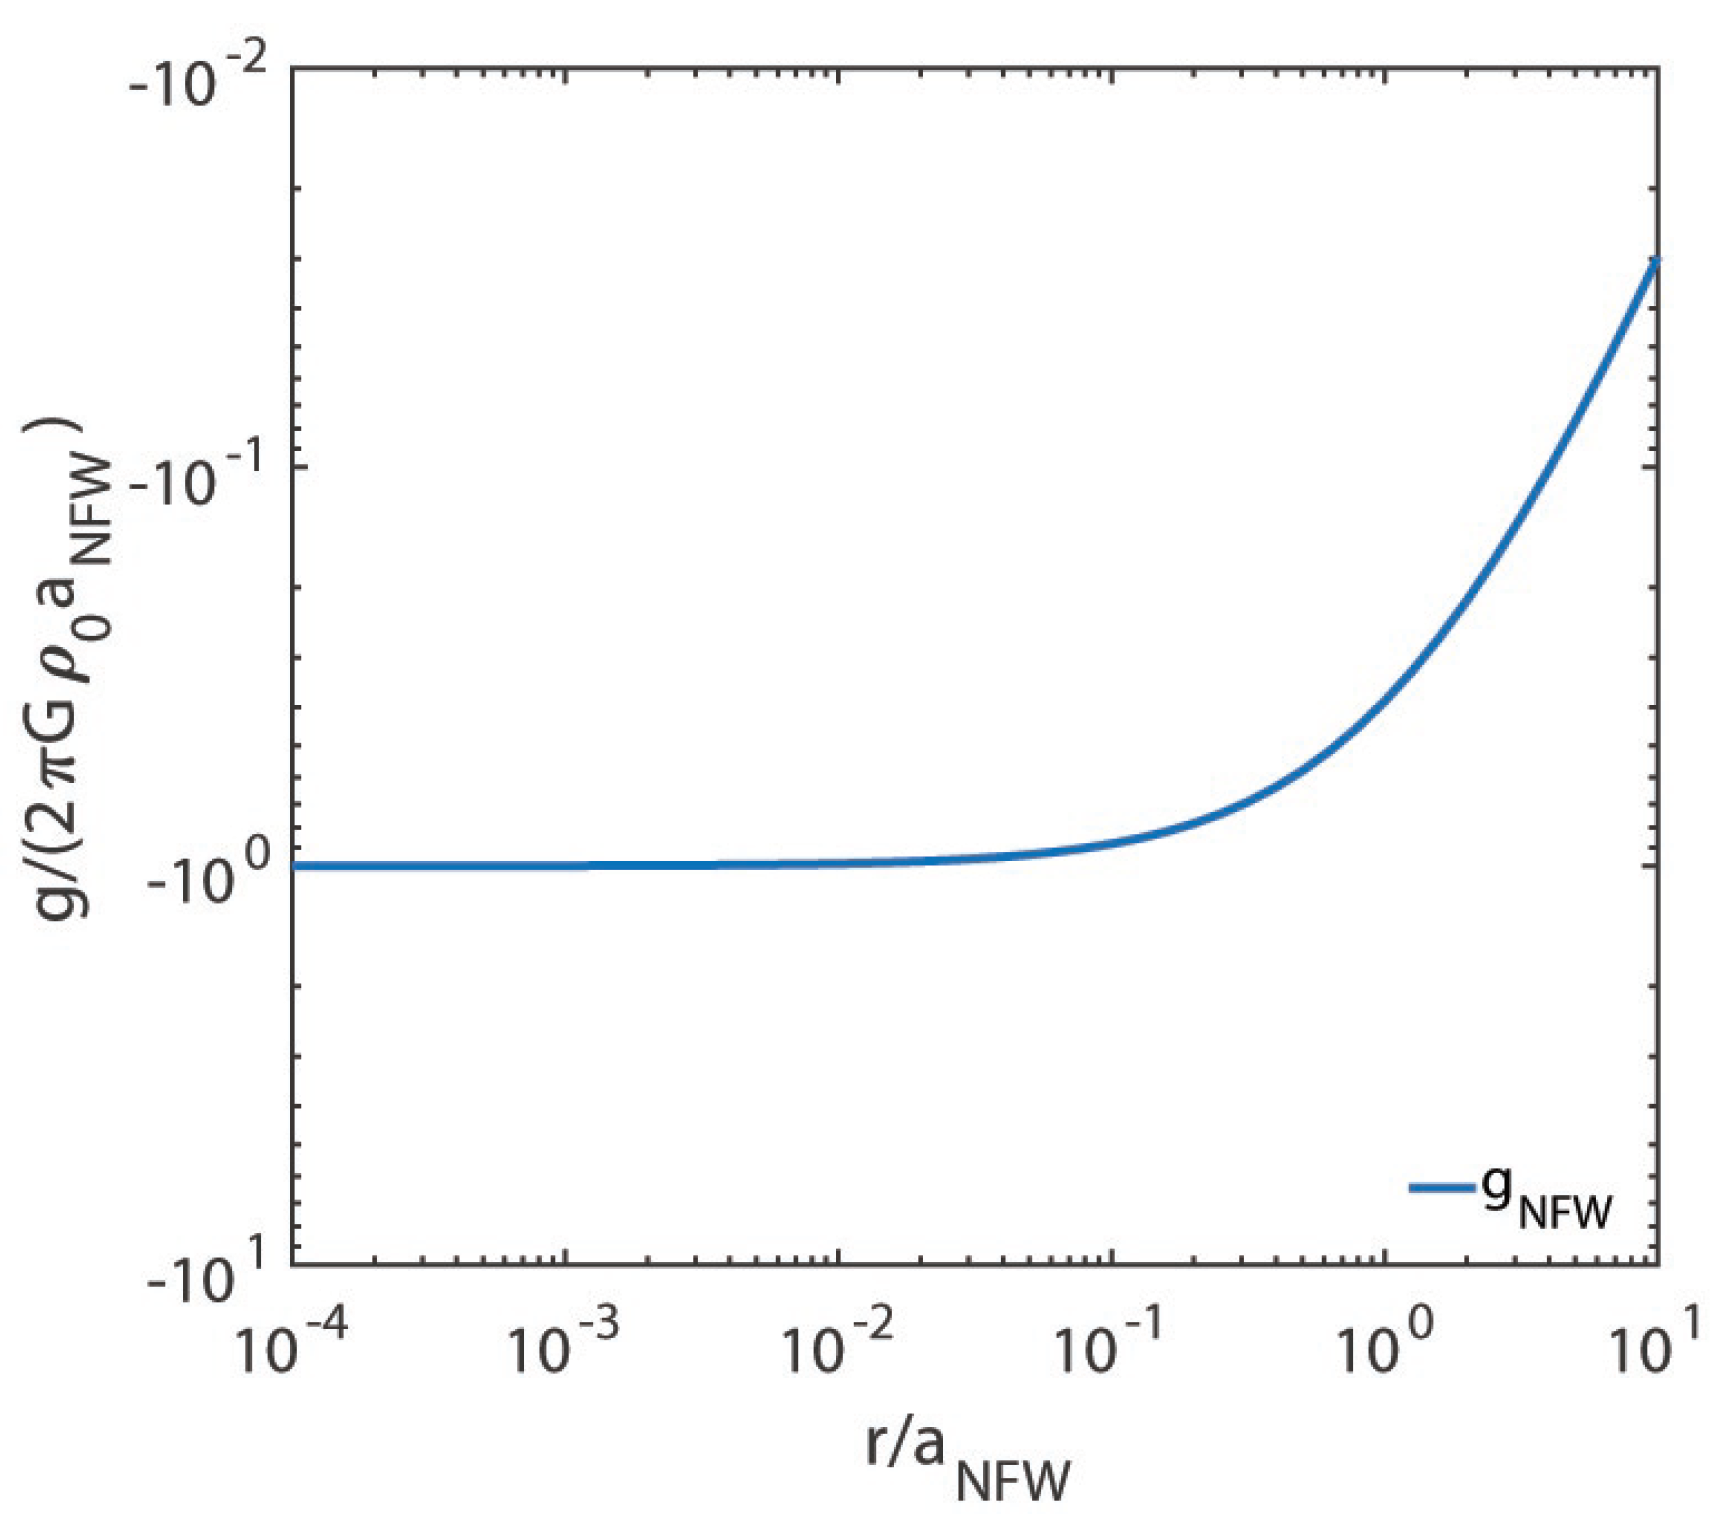
6. NFW Model
6.1. NFW Model and Regular Galaxy Clusters
6.2. NFW Model and Dark Matter Halos
7. Conclusions
Author Contributions
Funding
Informed Consent Statement
Data Availability Statement
Acknowledgments
Conflicts of Interest
References
- Plummer, H.C. On the Problem of Distribution in Globular Star Clusters. Mon. Not. R. Astron. Soc. 1911, 71, 460. [Google Scholar] [CrossRef]
- Jaffe, W.A. Simple model for the distribution of light in spherical galaxies. Mon. Not. R. Astron. Soc. 1983, 202, 995. [Google Scholar] [CrossRef]
- Hernquist, L. An Analytical Model for Spherical Galaxies and Bulges. Astrophys. J. 1990, 356, 359. [Google Scholar] [CrossRef]
- Kent, S.M. Dark matter in spiral galaxies. I. Galaxies with optical rotation curves. Astron. J. 1986, 91, 1301. [Google Scholar] [CrossRef]
- Navarro, J.F.; Frenk, C.S.; White, S.D.M. A Universal Density Profile from Hierarchical Clustering. Astrophys. J. 1997, 490, 493. [Google Scholar] [CrossRef]
- Dehnen, W. A Family of Potential-Density Pairs for Spherical Galaxies and Bulges. Mon. Not. R. Astron. Soc. 1993, 265, 250. [Google Scholar] [CrossRef]
- Dehnen, W.; Gerhard, O.E. Two-integral models for oblate elliptical galaxies with cusps. Mon. Not. R. Astron. Soc. 1994, 268, 1019. [Google Scholar] [CrossRef]
- Tremaine, S.; Richstone, D.O.; Byun, Y.-I.; Dressler, A.; Faber, S.M.; Grillmair, C.; Kormendy, J.; Lauer, T.R. A family of models for spherical stellar systems. Astron. J. 1994, 107, 634. [Google Scholar] [CrossRef]
- Binney, J.; Tremaine, S. Galactic Dynamics; Princeton University Press: Princeton, NJ, USA, 2008. [Google Scholar]
- de Zeeuw, P.T. Elliptical galaxies with separable potentials. Mon. Not. R. Astron. Soc. 1985, 216, 273. [Google Scholar] [CrossRef]
- Mo, H.; van den Bosch, F.; White, S. Galaxy Formation and Evolution; Cambridge University Press: Cambridge, UK, 2010. [Google Scholar]
- Zhao, H.S. Analytical models for galactic nuclei. Mon. Not. R. Astron. Soc. 1996, 278, 488. [Google Scholar] [CrossRef]
- Kormendy, J.; Richstone, D. Inward Bound—The Search For Supermassive Black Holes In Galactic Nuclei. Ann. Rev. Astron. Astrophys. 1995, 33, 581. [Google Scholar] [CrossRef]
- Magorrian, J.; Tremaine, S.; Richstone, D.; Bender, R.; Bower, G.; Dressler, A.; Faber, S.M.; Gebhardt, K.; Green, R.; Grillmair, C.; et al. The Demography of Massive Dark Objects in Galaxy Centers. Astron. J. 1998, 115, 2285. [Google Scholar] [CrossRef]
- Tremaine, S.; Gebhardt, K.; Bender, R.; Bower, G.; Dressler, A.; Faber, S.M.; Filippenko, A.V.; Green, R.; Grillmair, C.; Ho, L.C.; et al. The Slope of the Black Hole Mass versus Velocity Dispersion Correlation. Astrophys. J. 2002, 574, 740. [Google Scholar] [CrossRef]
- Gebhardt, K.; Bender, R.; Bower, G.; Dressler, A.; Faber, S.M.; Filippenko, A.V.; Green, R.; Grillmair, C.; Ho, L.C. A Relationship between Nuclear Black Hole Mass and Galaxy Velocity Dispersion. Astrophys. J. 2000, 539, L13. [Google Scholar] [CrossRef]
- Merritt, D.; Ferrarese, L. The M•-σ Relation for Supermassive Black Holes. Astrophys. J. 2001, 547, 140. [Google Scholar] [CrossRef]
- Rix, H.-W.; de Zeeuw, P.T.; Cretton, N.; van der Marel, R.P.; Carollo, C.M. Dynamical Modeling of Velocity Profiles: The Dark Halo around the Elliptical Galaxy NGC 2434. Astrophys. J. 1997, 488, 702. [Google Scholar] [CrossRef]
- Hernandez, X.; Gilmore, G. Inferring Dark Halo Structure from Observed Scaling Law of Late-Type Galaxies and LSBs. Mon. Not. R. Astron. Soc. 1998, 294, 595. [Google Scholar] [CrossRef]
- Cappellari, M.; Bacon, R.; Bureau, M.; Damen, M.C.; Davies, R.L.; De Zeeuw, P.T.; Emsellem, E.; Falcón-Barroso, J.; Krajnovic, D.; Kuntschner, H.; et al. The SAURON project - IV. The mass-to-light ratio, the virial mass estimator and the Fundamental Plane of elliptical and lenticular galaxies. Mon. Not. R. Astron. Soc. 2006, 366, 1126. [Google Scholar]
- Jiang, G.; Kochanek, C.S. The Baryon Fractions and Mass-to-Light Ratios of Early-Type Galaxies. Astrophys. J. 2007, 671, 1568. [Google Scholar] [CrossRef]
- Ciotti, L.; Morganti, L. Two-Component Galaxy Models: The Effect of Density Profile at Large Radii on the Phase-Space Consistency. Mon. Not. R. Astron. Soc. 2009, 303, 179. [Google Scholar]
- Samurovic, S. Dynamical Constant Mass-to-Light Ratio Models of NGC 5128. Astron. Astrophys. 2010, 514, A95. [Google Scholar] [CrossRef]
- Ragone-Figueroa, C.; Granato, G.L. Puffing up Early-Type Galaxies by Baryonic Mass Loss: Numerical Experiments. Mon. Not. R. Astron. Soc. 2011, 414, 3690. [Google Scholar] [CrossRef]
- Tortora, C.; Napolitano, N.R.; Romanowsky, A.J.; Jetzer, P. Central Dark Matter Trend in Early-Type Galaxies. Mem. Della Soc. Astron. Ital. Suppl. 2012, 9, 302. [Google Scholar]
- Tortora, C.; Napolitano, N.R.; Romanowsky, A.J.; Jetzer, P. Stellar Mass-to-Light Ratio Gradients in Galaxies: Correlations with Mass. Mon. Not. R. Astron. Soc. 2011, 418, 1557–1564. [Google Scholar] [CrossRef]
- Lingam, M.; Nguyen, P.H. The Double-Power Approach to Spherically Symmetric Astrophysical Systems. Mon. Not. R. Astron. Soc. 2014, 440, 2636. [Google Scholar] [CrossRef]
- Eadie, G.M.; Eadie, G.M.; Harris, W.E.; Widrow, L.M. Estimating the Galactic Mass Profile in the Presence of Incomplete Data. Astrophys. J. 2015, 806, 54. [Google Scholar] [CrossRef]
- Ebrova, I.; Lokas, E.L. Galaxies with Prolate Rotation in Illustris. Astrophys. J. 2017, 850, 144. [Google Scholar] [CrossRef]
- Zoldan, A.; Lucia, G.D.; Xie, L.; Fontanot, F.; Hirschmann, M. Structural and Dynamical Properties of Galaxies in a Hierarchical Universe: Sizes and Specific Angular Momenta. Mon. Not. R. Astron. Soc. 2018, 481, 1376. [Google Scholar] [CrossRef]
- de Nicola, S.; Saglia, R.P.; Thomas, J.; Dehnen, W.; Bender, R. Non-parametric Triaxial Deprojection of Elliptical Galaxies. Mon. Not. R. Astron. Soc. 2020, 496, 3076. [Google Scholar] [CrossRef]
- Caravita, C.; Ciotti, L.; Pellegrini, S. Jeans Modeling of Axisymmetric Galaxies with Multiple Stellar Populations. Mon. Not. R. Astron. Soc. 2021, 506, 1480. [Google Scholar] [CrossRef]
- Carlberg, R.G.; Yee, H.K.C.; Ellingson, E.; Morris, S.L.; Abraham, R.; Gravel, P.; Pritchet, C.J.; Smecker-Hane, T.; Hartwick, F.D.A.; Hesser, J.E.; et al. The Average Mass Profile of Galaxy Clusters. Astrophys. J. 1997, 485, L13. [Google Scholar] [CrossRef]
- van der Marel, R.P.; Magorrian, J.; Carlberg, R.G.; Yee, H.K.C.; Ellingson, E. The Velocity and Mass Distribution of Clusters of Galaxies from the CNOC1 Cluster Redshift Survey. Astron. J. 2000, 119, 2038. [Google Scholar] [CrossRef]
- Adami, C.; Mazure, A.; Ulmer, M.P.; Savine, C. Central matter distributions in rich clusters of galaxies from z∼0 to z∼0.5. Astron. Astrophys. 2001, 371, 11. [Google Scholar] [CrossRef]
- Lin, Y.T.; Mohr, J.J.; Stanford, S.A. K-Band Properties of Galaxy Clusters and Groups: Luminosity Function, Radial Distribution, and Halo Occupation Number. Astrophys. J. 2004, 610, 745. [Google Scholar] [CrossRef]
- Adams, J.J.; Simon, J.D.; Fabricius, M.H.; van den Bosch, R.C.E.; Barentine, J.C.; Bender, R.; Gebhardt, K.; Hill, G.J.; Murphy, J.D.; Swaters, R.A.; et al. Dwarf galaxy dark matter density profiles inferred from stellar and gas kinematics. Astrophys. J. 2014, 789, 63. [Google Scholar] [CrossRef]
- Oh, S.-H.; Hunter, D.A.; Brinks, E.; Elmegreen, B.G.; Schruba, A.; Walter, F.; Rupen, M.P.; Young, L.M.; Simpson, C.E.; Johnson, M.C.; et al. High-resolution mass models of dwarf galaxies from little things. Astron J. 2015, 149, 180. [Google Scholar] [CrossRef]
- Blumenthal, G.R.; Faber, S.M.; Flores, R.; Primack, J.R. Contraction of Dark Matter Galactic Halos due to Baryonic Infall. Astrophys. J. 1986, 301, 27. [Google Scholar] [CrossRef]
- Tollet, E.; Macció, A.V.; Dutton, A.A.; Stinson, G.S.; Wang, L.; Penzo, C.; Gutcke, T.A.; Buck, T.; Kang, X.; Brook, C.; et al. NIHAO—IV: Core Creation and Destruction in Dark Matter Density Profiles across Cosmic Time. Mon. Not. R. Astron. Soc. 2016, 456, 3542. [Google Scholar] [CrossRef]
- Macció, A.V.; Crespi, S.; Blank, M.; Kang, X. NIHAO— XXIII. Dark Matter Density Shaped by Black Hole Feedback. Mon. Not. R. Astron. Soc. 2020, 495, L46. [Google Scholar] [CrossRef]
- Pontzen, A.; Governato, F. Cold Dark Matter Heats Up. Nature 2014, 506, 171. [Google Scholar] [CrossRef]
- Dekel, A.; Ishai, G.; Dutton, A.A.; Macciò, A.V. Dark-Matter Halo Profiles of a General Cusp/Core with Analytic Velocity and Potential. Mon. Not. R. Astron. Soc. 2017, 468, 1005. [Google Scholar] [CrossRef]
- Freundlich, J.; Jiang, F.; Dekel, A.; Cornuault, N.; Ginzburg, O.; Koskas, R.; Lapiner, S.; Dutton, A.; Macciò, A.V. The Dekel-Zhao profile: A mass-dependent dark-matter density profile with flexible inner slope and analytic potential, velocity dispersion, and lensing properties. Mon. Not. R. Astron. Soc. 2020, 499, 2912. [Google Scholar] [CrossRef]


Disclaimer/Publisher’s Note: The statements, opinions and data contained in all publications are solely those of the individual author(s) and contributor(s) and not of MDPI and/or the editor(s). MDPI and/or the editor(s) disclaim responsibility for any injury to people or property resulting from any ideas, methods, instructions or products referred to in the content. |
© 2023 by the authors. Licensee MDPI, Basel, Switzerland. This article is an open access article distributed under the terms and conditions of the Creative Commons Attribution (CC BY) license (https://creativecommons.org/licenses/by/4.0/).
Share and Cite
Roncadelli, M.; Galanti, G. New Strong Constraints on the Central Behaviour of Spherical Galactic Models. Astronomy 2023, 2, 193-205. https://doi.org/10.3390/astronomy2030014
Roncadelli M, Galanti G. New Strong Constraints on the Central Behaviour of Spherical Galactic Models. Astronomy. 2023; 2(3):193-205. https://doi.org/10.3390/astronomy2030014
Chicago/Turabian StyleRoncadelli, Marco, and Giorgio Galanti. 2023. "New Strong Constraints on the Central Behaviour of Spherical Galactic Models" Astronomy 2, no. 3: 193-205. https://doi.org/10.3390/astronomy2030014