1. Introduction
The use of wind energy has been growing rapidly and consistently in Brazil. There are many onshore wind farms in the country and a large quantity is under construction. However, following international trends, the production of offshore wind energy is increasingly studied and desired thanks to its positive aspects, such as reducing impacts on communities and the environment, since they are located far from human populations. However, this segment is still new in the Brazilian coast, and studies are required to improve the quality, reliability, and safety of new projects, in addition to reducing their costs.
When we think of environmental damage caused by energy sources, the pollution caused by gas emissions and the impacts of construction on the environment around it are the most notable ones. The levels of greenhouse gas emissions during the oil and gas extraction and use for energy generation are very high, so from an environmental point of view it is always interesting to replace these fossil fuels by renewable energy sources whenever possible. However, the world is very dependent on this type of energy, and making its complete replacement with other sources will take many years; despite pollutants, oil and gas are widely used as raw materials in the chemical industry, given their importance for the global economy. It is important to reinforce that the oil and gas industry is progressively studying and caring for sustainable development, and there are several efforts to reduce the carbon footprint in energy production at the moment. The most important corporation of the gas industry in Brazil, Petrobras, has a goal of reducing 32% of the carbon intensity in the exploration and production segment until 2025, and they have been adopting new methods in their activities to guarantee that, incorporating researches and studies to improve the use of renewable energies in Brazil [
1]. Other corporations such as Shell also invest in these improvements and aim to reduce the Carbon Footprint over the next 10 years by making regular analysis on the emissions and changing their methodologies [
2].
Over the last years, wind energy has proven to be a less impacting energy source, because it is renewable and uses only natural wind flow, having few effects on the environment around it, and not emitting gases during its operation. So, it is in principle a good alternative of energy source in oil and gas exploration and production units. However, there are related environmental and social impacts during the installation and operation of wind farms. Moreover, there are also impacts behind these wind farms, considering the steel and concrete production which are necessary to produce and install wind turbines. So, from a sustainability point of view, when we consider the entire life cycle of a wind turbine, impacts and emissions do exist and must be defined and calculated.
Therefore, in this study, we focus on the assessment of the environmental impacts of a floating offshore wind turbine in Brazil, which would be used to power a floating oil and gas extraction platform, reducing the percentage of energy used by it that is supplied originally by gas turbines. It is important to know that the oil and gas industry is a very important part of the Brazilian economy and this project is relevant to that industry, considering it would help to decrease the use of fossil fuels’ energy on this important activity. According to ANP (the Brazilian National Petroleum Agency), there are currently 50 oil and gas extraction platforms of semi-submersible and FPSO (Floating Production Storage and Offloading) types [
3]. In this study, we consider a turbine in a region located in the Campos Basin or in the Santos Basin, which are the main areas of offshore oil and gas production in Brazil. In January 2021, ANP recorded an average total production in the two basins together of around 3.4 million barrels per day [
4]. We admit those as high depth locations, considering water depths ranging from 650 m to 1050 m. For this reason, the object of study here is a deep water floating offshore wind turbine, with a proper mooring system considered. This application is growing consistently in the world and higher values of depth are aimed for future wind turbine constructions, considering that those are sites with lower impact on human life and with higher wind speeds [
5].
In this paper, we present an estimate of the environmental impacts caused by the turbine through Environmental Impact Assessment and Life Cycle Assessment. Thus, it is important to make a quick introduction about the importance and applications of these techniques. The Environmental Impacts Assessment (EIA) is part of the National Environmental Policy of Brazil, through article 9 of Law 6.938/81 [
6]. The objective of this policy is to guarantee the preservation, improvement, and recovery of environmental quality favorable to life, in order to guarantee socioeconomic development, national security interests and the dignity of human life. Life Cycle Assessment (LCA) is a structured, comprehensive, and international method that quantifies environmental and health impacts, resources consumed, and resource depletion associated with any goods or services in all their life cycles. In Brazil, LCA has been standardized since 2001 through the ABNT NBR ISO 14040 standard. EIA and LCA are extremely important in any work or project that minimally affects the natural order of the environment and must be carried out following laws and regulations with the intention of minimize negative environmental impacts and highlight positive ones.
Although there is no floating offshore wind turbine operating in Brazil, the country’s offshore wind potential has been proven in several studies, and all coastal areas in Brazil have sites with high potential, based on wind distributions, weather and environmental conditions [
7]. In addition, Brazil is a reference in the offshore exploration of oil and natural gas worldwide, having great relevance in the technology of offshore platforms and mooring systems. These are evidence of the great importance of carrying out studies such as this one in the present time, and how it will help fostering the application of this technology in the country. Furthermore, the analyzes presented in this study fit with other models in very important countries with different characteristics from Brazil that will be mentioned, such as Germany [
8], China [
9], the United States [
10], and others.
Thus, we will employ the tools described above, using them together and aggregating information on similar models produced internationally, and consider Brazilian biodiversity and socioeconomic conditions to assemble a model for assessing the impacts of a floating offshore wind turbine in this country. In addition to presenting the qualitative and quantitative environmental impacts, as done in the international articles mentioned above, our study stands out for carrying out a sensitivity analysis that allows one to predict how these impacts would be increased or decreased through changes in the system. In addition, we also consider the impact of failure events. In the course of this work, we also verified the licensing processes for this infrastructure, through consultations and contacts with the licensing agency of this type of facility in Brazil (IBAMA—Brazilian Institute of the Environment and Renewable Natural Resources), aiming at the conduction of this research in the most allied way possible with the economic and environmental interests of the country.
2. Material and Methods
To carry out an Environmental Impacts Assessment of an offshore wind turbine, it is necessary to know its characteristics and dimensions, materials used, place of installation and depth, mode of operation, as well as the biological characteristics of the analyzed sites, in order to analyze which problems the turbine may present to local biodiversity. In this study, we will carry out this assessment based on a literature review.
As for the Life Cycle Assessment (LCA), it is necessary, mainly, to know all the stages of its life cycle, ranging from its construction and quantities of materials used, installation and maintenance to decommissioning. It is important to highlight that LCAs usually focus on providing information from the emission of pollutant gases, mainly the greenhouse gases. However, here we will analyze only carbon dioxide (CO2) emissions, since this is the most present greenhouse gas in the atmosphere, and most emitted in the construction and operation phases that we will be mentioned. We also analyze energy consumption values throughout the life cycle in order to compare the energy efficiency of this project.
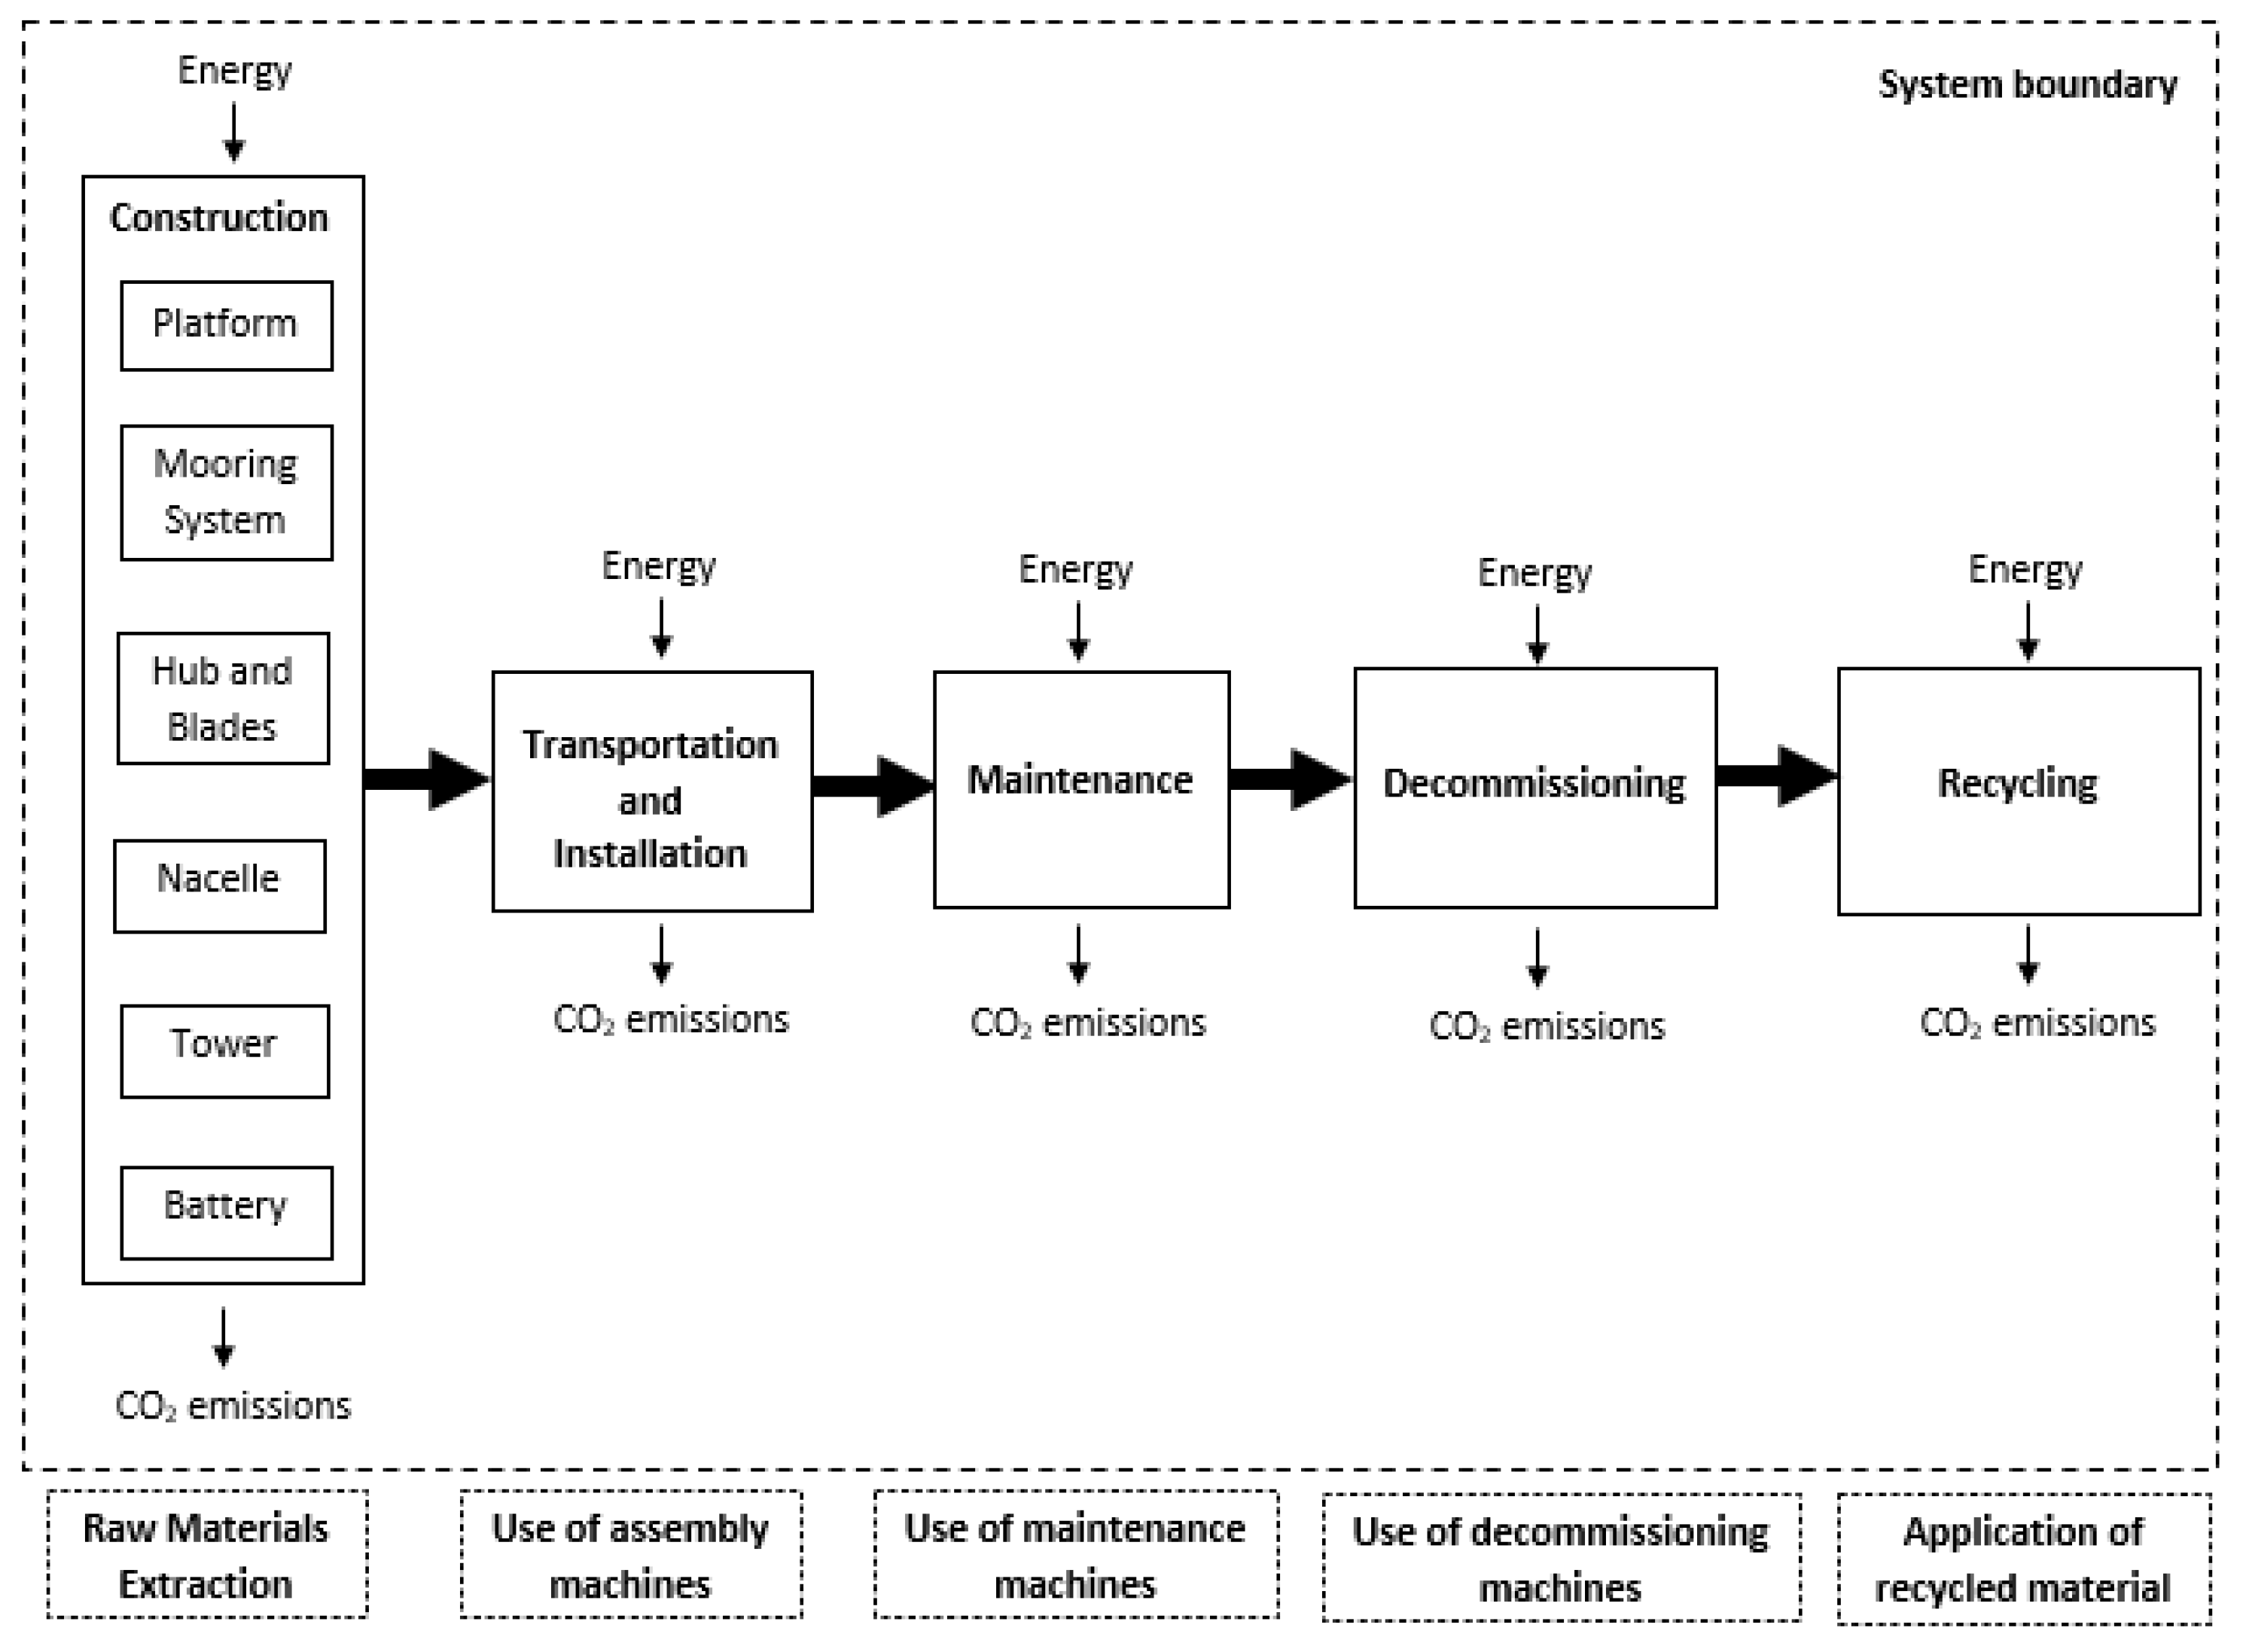
Therefore, we performed a Life Cycle Analysis that addresses different stages of the process analyzed in this study. The objective was to show the environmental impacts generated on a large scale through a balance of energy consumption and CO
2 emissions. This analysis was made through accounting the CO
2 emissions generated from the turbine components (data obtained from manufacturers catalogs), its location and processes involved, and databases with information from used materials and sources on how the processes involved take place, which will be better explored in the following sections. The system with its boundaries, inputs and outputs, are represented in
Figure 1.
Considering those 2 analyses in the same study is relevant because it affords two different points of view: in a global scale for LCA, assessing the impacts in the world’s carbon footprint and energy demands, and in a local scale for EIA, interpreting the impacts occurring in the local ecosystems of this type of development.
2.1. General Characteristics of the Floating Offshore Wind Turbine System Design
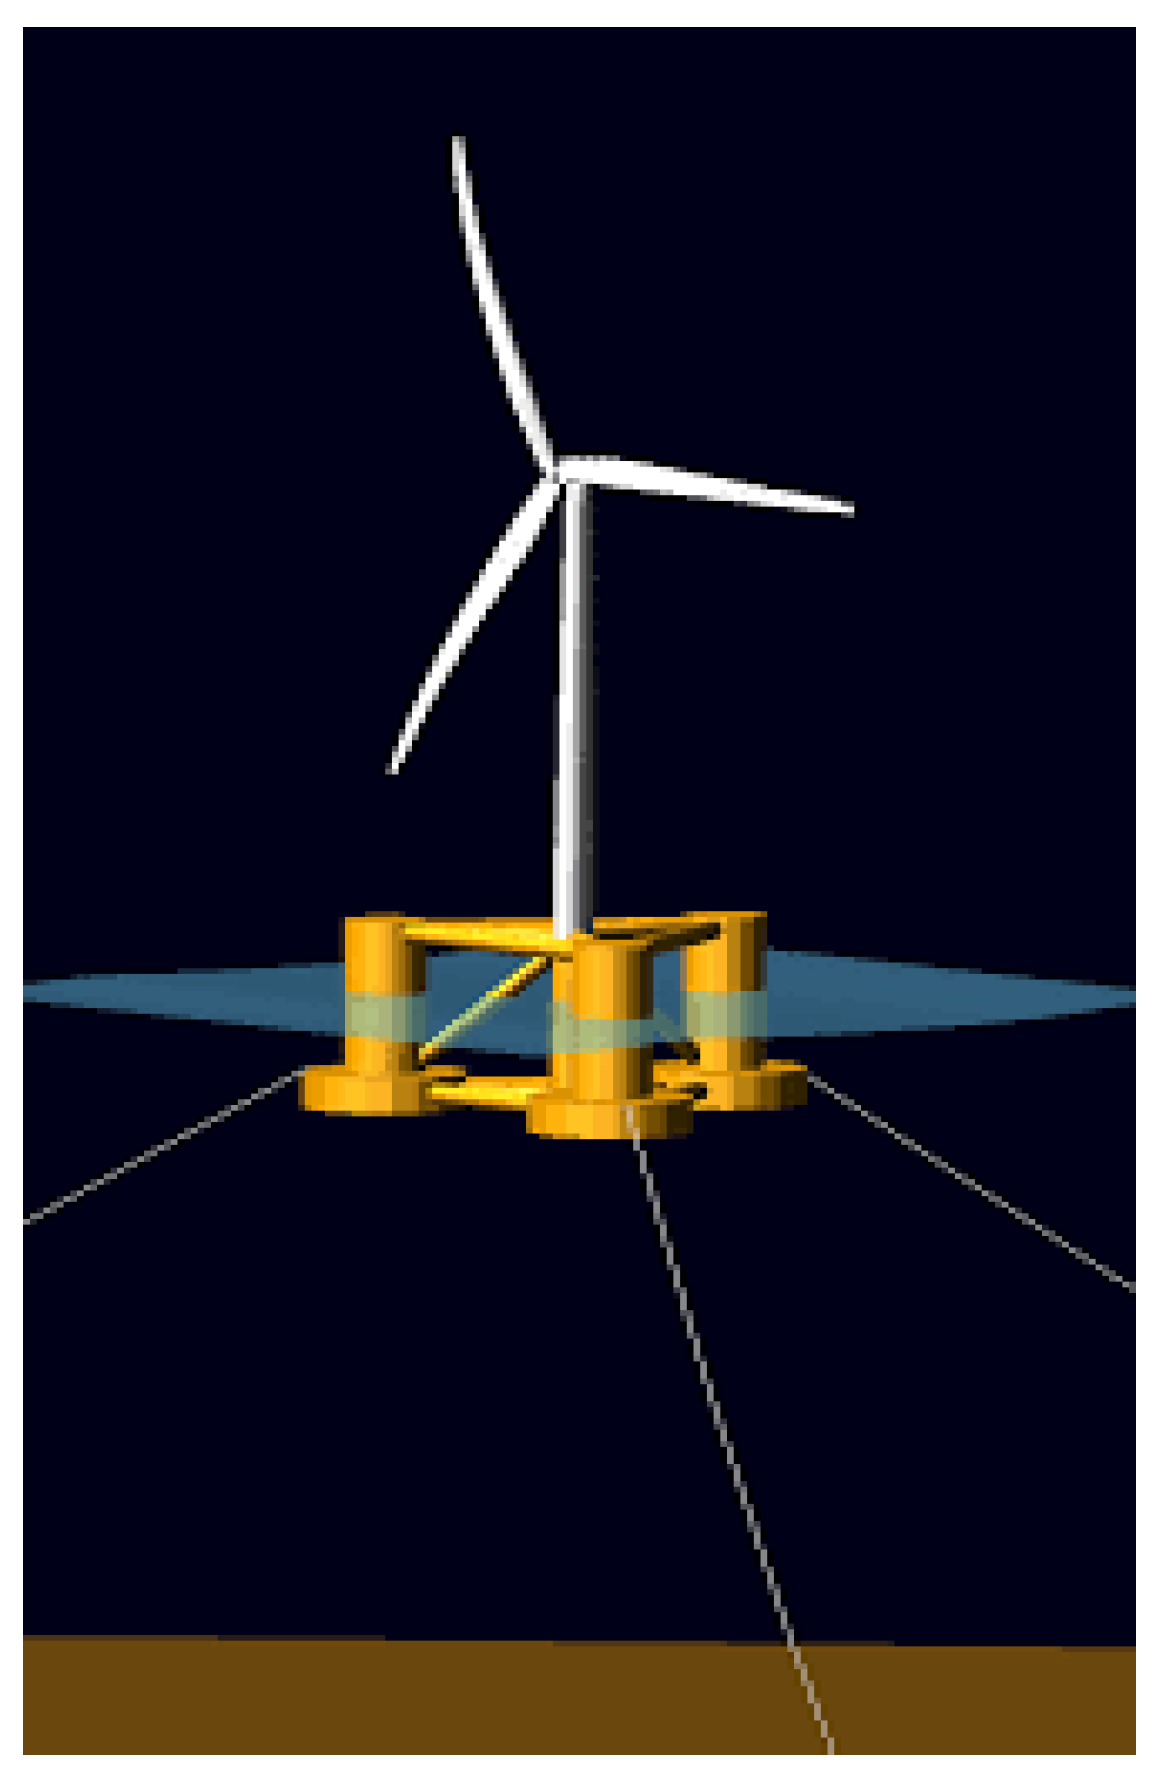
In our analyses, we considered a floating offshore wind turbine on a semi-submersible platform, with the tower in a central column and three other larger side columns connected by thin pontoons, secured by a catenary mooring system. The mooring system will rely on 3 steel cables of approximately 1321 m to 2600 m, depending on the local water depth of 500 m to 1000 m. The turbine is the NREL 5 MW model, defined in Jonkman et al. [
11]. We made the choice to analyze this model because it is relevant enough for our goal, which is the local energy supply of a platform, besides this power value is in the same magnitude that those in other studies used as references for this one. In addition, the model defined in Jonkman et al. [
11]. provides all the information about the turbine that is relevant to carry out the analyses.
For the baseline calculations, we assumed a capacity factor of 0.46, which is within the typical range of values for offshore wind farms, a lifetime of 20 years and that the turbine is to be installed at location with water depth of 1000 m. All features of the platform and turbine assembly are based on the UMaine Semi-Sub, a generic study of a NREL 5 MW turbine on a semi-submersible platform carried out at the University of Maine [
10], see
Figure 2.
2.2. Installation Sites
The Campos Basin (
Figure 3) has a remarkable abundance of animal species. Speaking of the benthic species, we find in this region banks of calcareous algae and coral reefs, in addition to corals such as star coral (
Siderastrea stellata) and brain coral (
Mussismillia hispida) and other cnidarians, such as jellyfish and sea anemones [
13]. There is also a strong presence of mollusks as banks of scallops (
Chione pubera, Euvola ziczac and
Nodipecten nodosus).
We also find in the Campos Basin the presence of mammals such as the humpback whale (
Megaptera novaeangliae), which migrates between areas to reproduce and can occupy regions from 200 to 3000 m in depth. Other species of whales and dolphins can be found. In this region, the presence of sea turtles also stands out, with the most registered specie being the green turtle (
Chelonia mydas) [
14]. For fish in the region, there are about 875 species found including catfish, tuna, sardines, triggerfish, among others.
Seabirds are also present in the Campos Basin region, with around 85 species in total. Some species usually nest on coastal islands close to Campos Basin’s support bases and a good part of the birds found are migratory. Species such as the magellanic penguin (Spheniscus magellanicus) and the yellow-nosed albatross (Thalassarche chlororhynchos) stand out.
Fishing is a well-established socioeconomic activity in the Campos Basin and a source of income for many groups and cities in the states of Rio de Janeiro and Espírito Santo. Several species of seafood such as shrimp and sardines are part of the livelihood of this activity and ensuring that these species are protected is essential for these states’ economy.
The Santos Basin, another important study site in terms of oil production in the country, also has many species at risk [
15]. Regarding benthos, like in the Campos Basin, there are several coral reef communities with high biodiversity, seaweed and mollusk banks, highlighting mussels. We also find many species of turtles (loggerhead turtle, green turtle, olive turtle, hawksbill turtle, leatherback turtle), which use the location only as a feeding region, refuge, and migratory route.
In addition, in this basin there is the presence of several species of fish with a certain level of danger of extinction, such as stingrays, angelfish, lemon shark, hammerhead shark, white shark, bluefin tuna, and several others. Among the mammals that encountered this same risk, we found fin whale, saber-toothed whale, right whale, humpback whale, sperm whale and porpoises.
Seabirds also occupy a great prominence in this space, being the most frequent in the place of study albatrosses (which faces danger of extinction), petrels and shearwaters. In addition, the region is also a migratory route for species from the northern hemisphere (manx shearwater, common tern, arctic tern) and the southern hemisphere (cape petrel, Indian yellow-nosed albatross, black-browed albatross and Wilson’s storm petrel).
2.3. Construction
For the construction stage of this turbine and platform, we consider the CO2 emissions and energy consumption in the production of all materials used. The components of this system are made mostly of steel and concrete, and the amount of steel is very relevant. Other materials such as aluminum, fiberglass, copper and lubricants are also included.
The semi-submersible platform is responsible for the most of the mass of the system. In
Table 1 we have the materials used for each component of the system and their respective masses, based on data provided by the paper that presents information on the UMaine Semi-Sub [
10].
Table 2 shows the ratios of CO
2 emission and energy consumption to produce each material.
2.4. Transportation and Installation
In this section, we consider all the transportation needed at the stage of installing the system and that the components would be produced in different locations. These components would be transported to a shipyard for the assembly of the turbine and platform, and then the complete assembled system would be towed to the installation site by a sea vessel.
For this analysis exclusively, we consider that the installation takes place in the Campos Basin (which has a better wind resource than the Santos Basin), leaving from a shipyard on the coast of the city of Rio de Janeiro. Distances covered in each stage are shown in
Table 3, assuming that each component will be manufactured in some specialized factory in the country.
Table 4 gives the CO
2 emission factors and energy density for diesel fuel, used by trucks, and for fuel oil, used by ships. The
EF variable represents the emission factor for each fuel and CO is the fuel consumption factor for each vehicle.
2.5. Maintenance
This stage of the wind turbine’s operation includes cleaning, repairing, and replacing the components. The lubricating oil used in the gearboxes and tower must be replaced every 3 years. As described in Yang et al. [
9], an offshore wind turbine requires one or two scheduled maintenance events and one to four aperiodic maintenance events per year. For this calculation, we assume two maintenance events per year.
For measuring CO
2 emissions and energy consumption at this stage of the project, we calculate the impacts involved in the production of lubricating oil and transportation to maintenance events each year. The CO
2 emission factor to produce the lubricating oil was equal to 3.29 tCO
2/m
3 according to da Costa [
19] and the energy involved in its production is 3.85 GJ/ton according to the Ecoinvent Database [
21].
2.6. Decommissioning
The environmental impacts caused in the decommissioning phase come basically from the fuel used to transport the turbine materials from the installation site back to shore.
2.7. Recycling
In this study, we are considering the positive and negative impacts caused by the recycling processes from each component of the turbine. We admit that all steel, concrete, aluminum, and fiberglass can be recycled, and data of consumed energy by recycling each material is shown in
Table 5. To estimate the CO
2 emission, we consider that all recycling was performed using coal as a fuel source for thermal energy, which is a conservative estimate. The emission factor for coal is assumed to be 94.6 tCO
2/TJ according to da Costa [
19].
2.8. Energy Payback Ratio and Energy Payback Time
The EPR (Energy Payback Ratio) and EPT (Energy Payback Time) energy indicators are very important in assessing the life cycle of wind farms. They are responsible for measuring how much of the energy invested in the lifecycle of the project will be returned.
The EPR expresses the ratio of energy returned over the life of the turbine per unit of energy invested in its construction and operating phases. In other words, the EPR indicator refers to the amount of energy returned from an energy unit invested in an energy producing activity. EPT expresses the time in months or years the project takes to produce the same amount of energy that was spent in all processes up to that point. The EPT is equal to the lifetime of the project divided by its EPR.
2.9. Battery
For this project, in addition to the wind turbine with the platform and the mooring system, we will consider the existence of a battery system to store surplus energy in moments when the energy production of the turbine exceeds what is demanded by the oil and gas production unit. The batteries considered for this study will be of the LFP type (LiFePO4—Lithium Iron Phosphate) in a rack with an energy capacity of 215 kWh. We assumed that this rack would be stored in a 20-foot container made entirely of steel, weighing 24 ton. Thus, the impacts of CO
2 emissions and energy consumption will be the result of the manufacture of the rack and container. The CO
2 emission data and energy consumed by the battery’s energy capacity are, respectively, 0.16 kgCO
2/Wh and 0.97 MJ/Wh according to Peters et al. [
25].
3. Results
3.1. Environmental Impact Assessment
Considering all the species that live in the regions previously described, we can make some analyses about how they can be affected by the components of the system. We will describe these impacts by dividing them into different classes and groups, according to a WWF report [
26] that analyzes the impacts of offshore wind turbines. In this report the impacts are proved to be caused by different categories such as noise, electromagnetic fields, habitat alterations, structural impediments and others, and we can see the same category division in a more recent study [
27].
In benthic species, construction and decommissioning can cause the suspension and dispersion of particles, and consequently sedimentation, which can decrease biological diversity. It is known that high levels of sedimentation can be responsible for decreasing fertilization in corals, as well as causing death of larvae [
26]. The effects caused by sedimentation can vary depending on the grain size of the components. In addition, submerged structures of a floating system of offshore wind turbines, such as the mooring system and the platform itself, can create a biological hotspot, working as artificial reefs, representing a positive impact. Benthic species such as mussels are found attached to these structures, increasing marine biodiversity, providing food and protection for crustaceans and mollusks, which provide food for fish, etc. [
27]. They can have a restorative effect on degraded natural habitats, representing a new place for many species. The existence of reefs in wind turbine structures can also indicate a significant operational risk, as the mass added by marine organisms increases the load on the structure and facilitates corrosion. About the electromagnetic fields created by the electricity cables, these can cause some negative impacts on the geomagnetic navigation of vertebrate species and on the sensitivity of crustaceans to electromagnetic fields, influencing their ability to locate food and causing evasion or attraction responses.
For fish, the most dangerous impact is sedimentation, which can cause these animals to have their gills clogged, leading to respiratory problems and inhibited feeding, in addition to also being responsible for the avoidance behavior of some species of fish due to turbidity in the ocean and reduced predation. In relation to artificial reefs, the impacts are the same as previously mentioned: they can increase marine biodiversity and the diversity of species that can be useful for fish feeding. Electromagnetic fields can affect some species of fish with magnetic sensitivity. Sharks and stingrays can show attraction to cables. Some fish species can also aggregate in the mooring lines and platforms, altering their habitat [
27].
Considering marine mammals, the most important issue is construction noise, which can cause behavioral changes in seals, porpoises and dolphins. Most times it causes these animals to avoid the construction area, changing their habitats. Artificial reefs can attract some species of mammals to the area of wind farms in search of food. This can change their habitats as well. Sedimentation and electromagnetic fields do not directly affect mammals [
27].
With regard to birds, turbines can affect them in several ways. One of them is the fact that these structures offer enormous barriers to migration routes, due to magnetic influences, high levels of noise and height of the towers. Another impact is the high mortality rate of some species due to collisions, which is higher on night flights, due to limited vision [
28]. In a study done on the FINO 1 research platform, which monitored a wind farm located 45 km from Borkum (a German island) on a water depth of about 30 m, Hüppop et al. [
8] quantified a total of 442 birds of 21 species found dead between October 2003 and December 2004. Almost all were in good physical condition, which excludes hunger as the cause of death. Annually, the Brazilian institute “Chico Mendes Institute for Biodiversity Conservation” (ICMBio) carries out a report on the migratory routes of birds. In its 2019 report [
29]. these environmental problems were highlighted, and some affected species were shown. All of these were due to onshore turbines, considering that Brazil did not have any offshore wind farm at the time the study was published, but we can use this example for a comparison. This report also reveals all Brazilian migratory routes, emphasizing the Atlantic Route, which covers the entire coast of the country and can be affected by the wind turbine we are analyzing in this study. Another type of impact shown in the literature says that we could affect the environment conditions in large wind farm facilities through alterations in the atmospheric dynamic [
27]. It is known that the wake generated downstream of the wind turbines, which is a consequence of the wind speed reduction right after passing the rotor and causing a turbulent flow, can change the micro-climate conditions in the location. However, this problem is not considerable in this study, since we are analyzing one single turbine.
In addition to these impacts caused to local biodiversity thanks to the natural operation of the system, it is also necessary to assess the possibility of extreme events. Considering the battery system described above, it is important to highlight that LFP batteries have a high risk of toxicological and thermal impact in cases of explosion as described in Peng et al. [
30]. The toxicological risks associated with this problem are related to the emission of CO, HF, SO
2, NO
2, NO and HCl gases thanks to the chemical components of the system. Generally, when these events occur, the batteries can experience a peaceful initial burning stage, which is in some sense positive because it can be seen and treated with emergency actions before further damage. Thus, we must always be attentive to this system to avoid thermal damage that affects both the turbine and its operation and the local marine ecosystem, which can have several adverse effects resulting from exposure to contaminants and their toxicological effects.
Table 6 summarizes which reasons for environmental impact affect each animal class.
3.2. Life Cycle Assessment
LCA results for each stage of the life cycle and system components are shown in
Table 7 and
Figure 4.
With regard to energy analysis, the Energy Payback Ratio and Energy Payback Time were calculated according to the scenario reported in
Section 2.8. The EPR found was 16.28 and the EPT was approximately 1.23 years. We can admit that these values are satisfactory and within the expected range if compared with other studies published in the literature, bearing in mind some important differences between those studies and ours. Raadal et al. [
10], obtained an EPR value of 7.5, but in that study the impacts caused by the recycling of the materials were not included, and emissions and energy costs were considered in the installation and decommissioning processes with issues beyond the transport of the materials, something that we did not consider in our project. Yang et al. [
9] obtained an EPR of 9.32. In their investigation, in addition to the same exceptions that have already been mentioned in Raadal et al. [
10], a wind farm with 28 turbines of nominal power of 5 MW and 3.6 MW was analyzed, in addition to the fact that the turbines were considered to be fixed, so they did not have a platform with extensive mass of steel as in our case.
If we consider a lifetime of 20 years, then the value of EPT achieved in our study is very positive, giving a quick energy return to the project, leaving about 18 years and 9 months of energy left in use.
4. Discussion
Regarding the Environmental Impact Assessment, we can assume that most species that live in the waters would be little affected by the operation of a turbine, except for the case in which there is toxicity emission by an explosion in the battery, or another extreme failure that would result in the total sinking of the system. In the operation of a flawless unit mammals, fish, crustaceans and benthos are affected in things that alter their lifestyle, impairing the search for food, migratory routes or reproduction, however these impacts do not represent a serious risk of mortality for any of the species. Birds are the ones that can have the most negative effects and may encounter risks already attested to mortality by collisions, as already indicated, as the regions of the two basins are environments for migratory routes of different species.
We realized that the risk of impacts to all the local ecosystems would only be significant if there were a greater number of turbines installed, as the probability of extreme events would be greater and the impacts of construction, sedimentation, noise and electromagnetic radiation would be more intense, presenting a non-neglegible risk. With respect to birds, the risk of collisions would be much greater if there were a wind farm, as this would present many obstacles. Considering that we analyzed only one turbine, we can consider the impacts in general as negligible. Some ways to mitigate the problem of bird mortality are using simple activities in the operation of the system, such as turning off turbines on nights when there is forecast of adverse weather and high intensity of migration and aligning the wind turbines parallel to the direction of the main migratory route at the exact place of installation [
31].
Considering the Life Cycle Assessment, the analysis of the results indicated that the construction of the platform is responsible for about 67% of the total CO2 emission of the system. The construction of mooring system and tower are the next with higher values. This is due to the masses of steel that these components have, since the steel production process is responsible for emitting the largest amount of CO2 and highest energy consumption. The nacelle, hub and blades have lower impacts on their construction.
The system attached to the turbine, consisting of the battery and container, has a low impact, of around 1%. The life cycle stages of the installation, maintenance and decommissioning cause very low impacts when compared to the construction of the components. The recycling stage after the end of the turbine lifetime constitutes about 11% of all contributions, and this value is significant when compared to other stages, being the second largest followed by the production of the platform, as it represents the reuse of all the materials that make up the turbine (with the exception of copper) and the entire platform.
The production of the entire turbine and platform system from raw materials is responsible for about 86% of energy costs and we realize that the incentive to recycle these materials is very important because it implies in lower impacts on the production of components. From an energy point of view, it does not represent a negative consequence as it may cause new turbines on semi-submersible platforms in the future to be made with recycled materials, which would greatly reduce the negative results of this activity. Some sensitivity analyses in relation to the use of materials that have been recycled in the construction of the project components are carried out in
Section 4.1.1.
As we could see in the results section, the values of EPR and EPT are similar when compared to other studies, which shows that our analyses were correct. Furthermore, it is also possible to compare the CO
2 emissions with those same studies, for example in Raadal et al. [
10], and see that the results are favorable, the differences are small and probably consequences from different sources of information about the gas emission for the construction materials, which can vary between different countries. We can consider other example of life cycle assessment of a 5 MW offshore wind turbine, provided in J. Weinzettel et al. [
32]. In this case, the turbine is not being supported by a platform, so we can compare only the results for the turbine itself. This study showed an emission result of 1.08 gCO
2/kWh, which is in the same magnitude as the one we present here.
4.1. Sensitivity Analyses
From the calculated Life Cycle Analysis data, we can perform some sensitivity analyses in order to understand what effects may arise from certain changes in the usual conditions of the system. These analyses are important to understand situations in which we can reduce negative environmental impacts and situations in which they can be increased, representing some risk that must be born in mind.
4.1.1. Recycling
As we have seen, the high amounts of steel used in the construction of the platform are responsible for the greatest impacts of the entire project. In this regard, considering the use of recycled materials to build the system can be a very interesting option to make this project more sustainable, assuming that much less CO2 is emitted and much less energy is spent to produce certain masses of recycled material than the raw material.
Table 8 shows how much CO
2 emissions and energy consumption (consequently changing EPT and EPR) are reduced if we use a certain percentage of recycled steel to build the system. The use of recycled materials other than steel can also bring environmental benefits, although their effects are much less significant due to the lower masses used.
Table 9,
Table 10 and
Table 11 show these results.
4.1.2. Maintenance and Failures
In order to carry out the Life Cycle Analysis calculations in the maintenance stage, we adopted only 2 visits per year and the manufacture of lubricating oil every 3 years. However, considering a large project like this and with a lifetime of 20 years, located in the deep ocean, a region that can in some circumstances damage components of the turbine and platform, we cannot avoid considering the replacement of some components.
In this way, we made sensitivity analyses to assess what effects the LCA suffers in the event of the replacement of certain components of the system once or twice during the entire lifetime.
Table 12,
Table 13 and
Table 14 show these analyses.
In this same context, we can also assess the possibility of a catastrophic failure in the whole system, causing energy production to be compromised and the undertaking to no longer be rewarded.
Table 15 shows the impacts on energy production if this failure occurs in 1, 2, 5, 10 or 15 years, directly affecting the EPR and EPT.
As the EPT of our project is 1.23 years, we noticed that the only case in which the project would be unviable energetically would be in a catastrophic failure occurring in 1 year, as it would not be possible to return all the energy consumed, which is proven by the EPR in this case is less than one. Thus, we note that the project is already valid from the point of view of energy compensation for a useful life of more than 2 years.
4.1.3. Capacity Factor
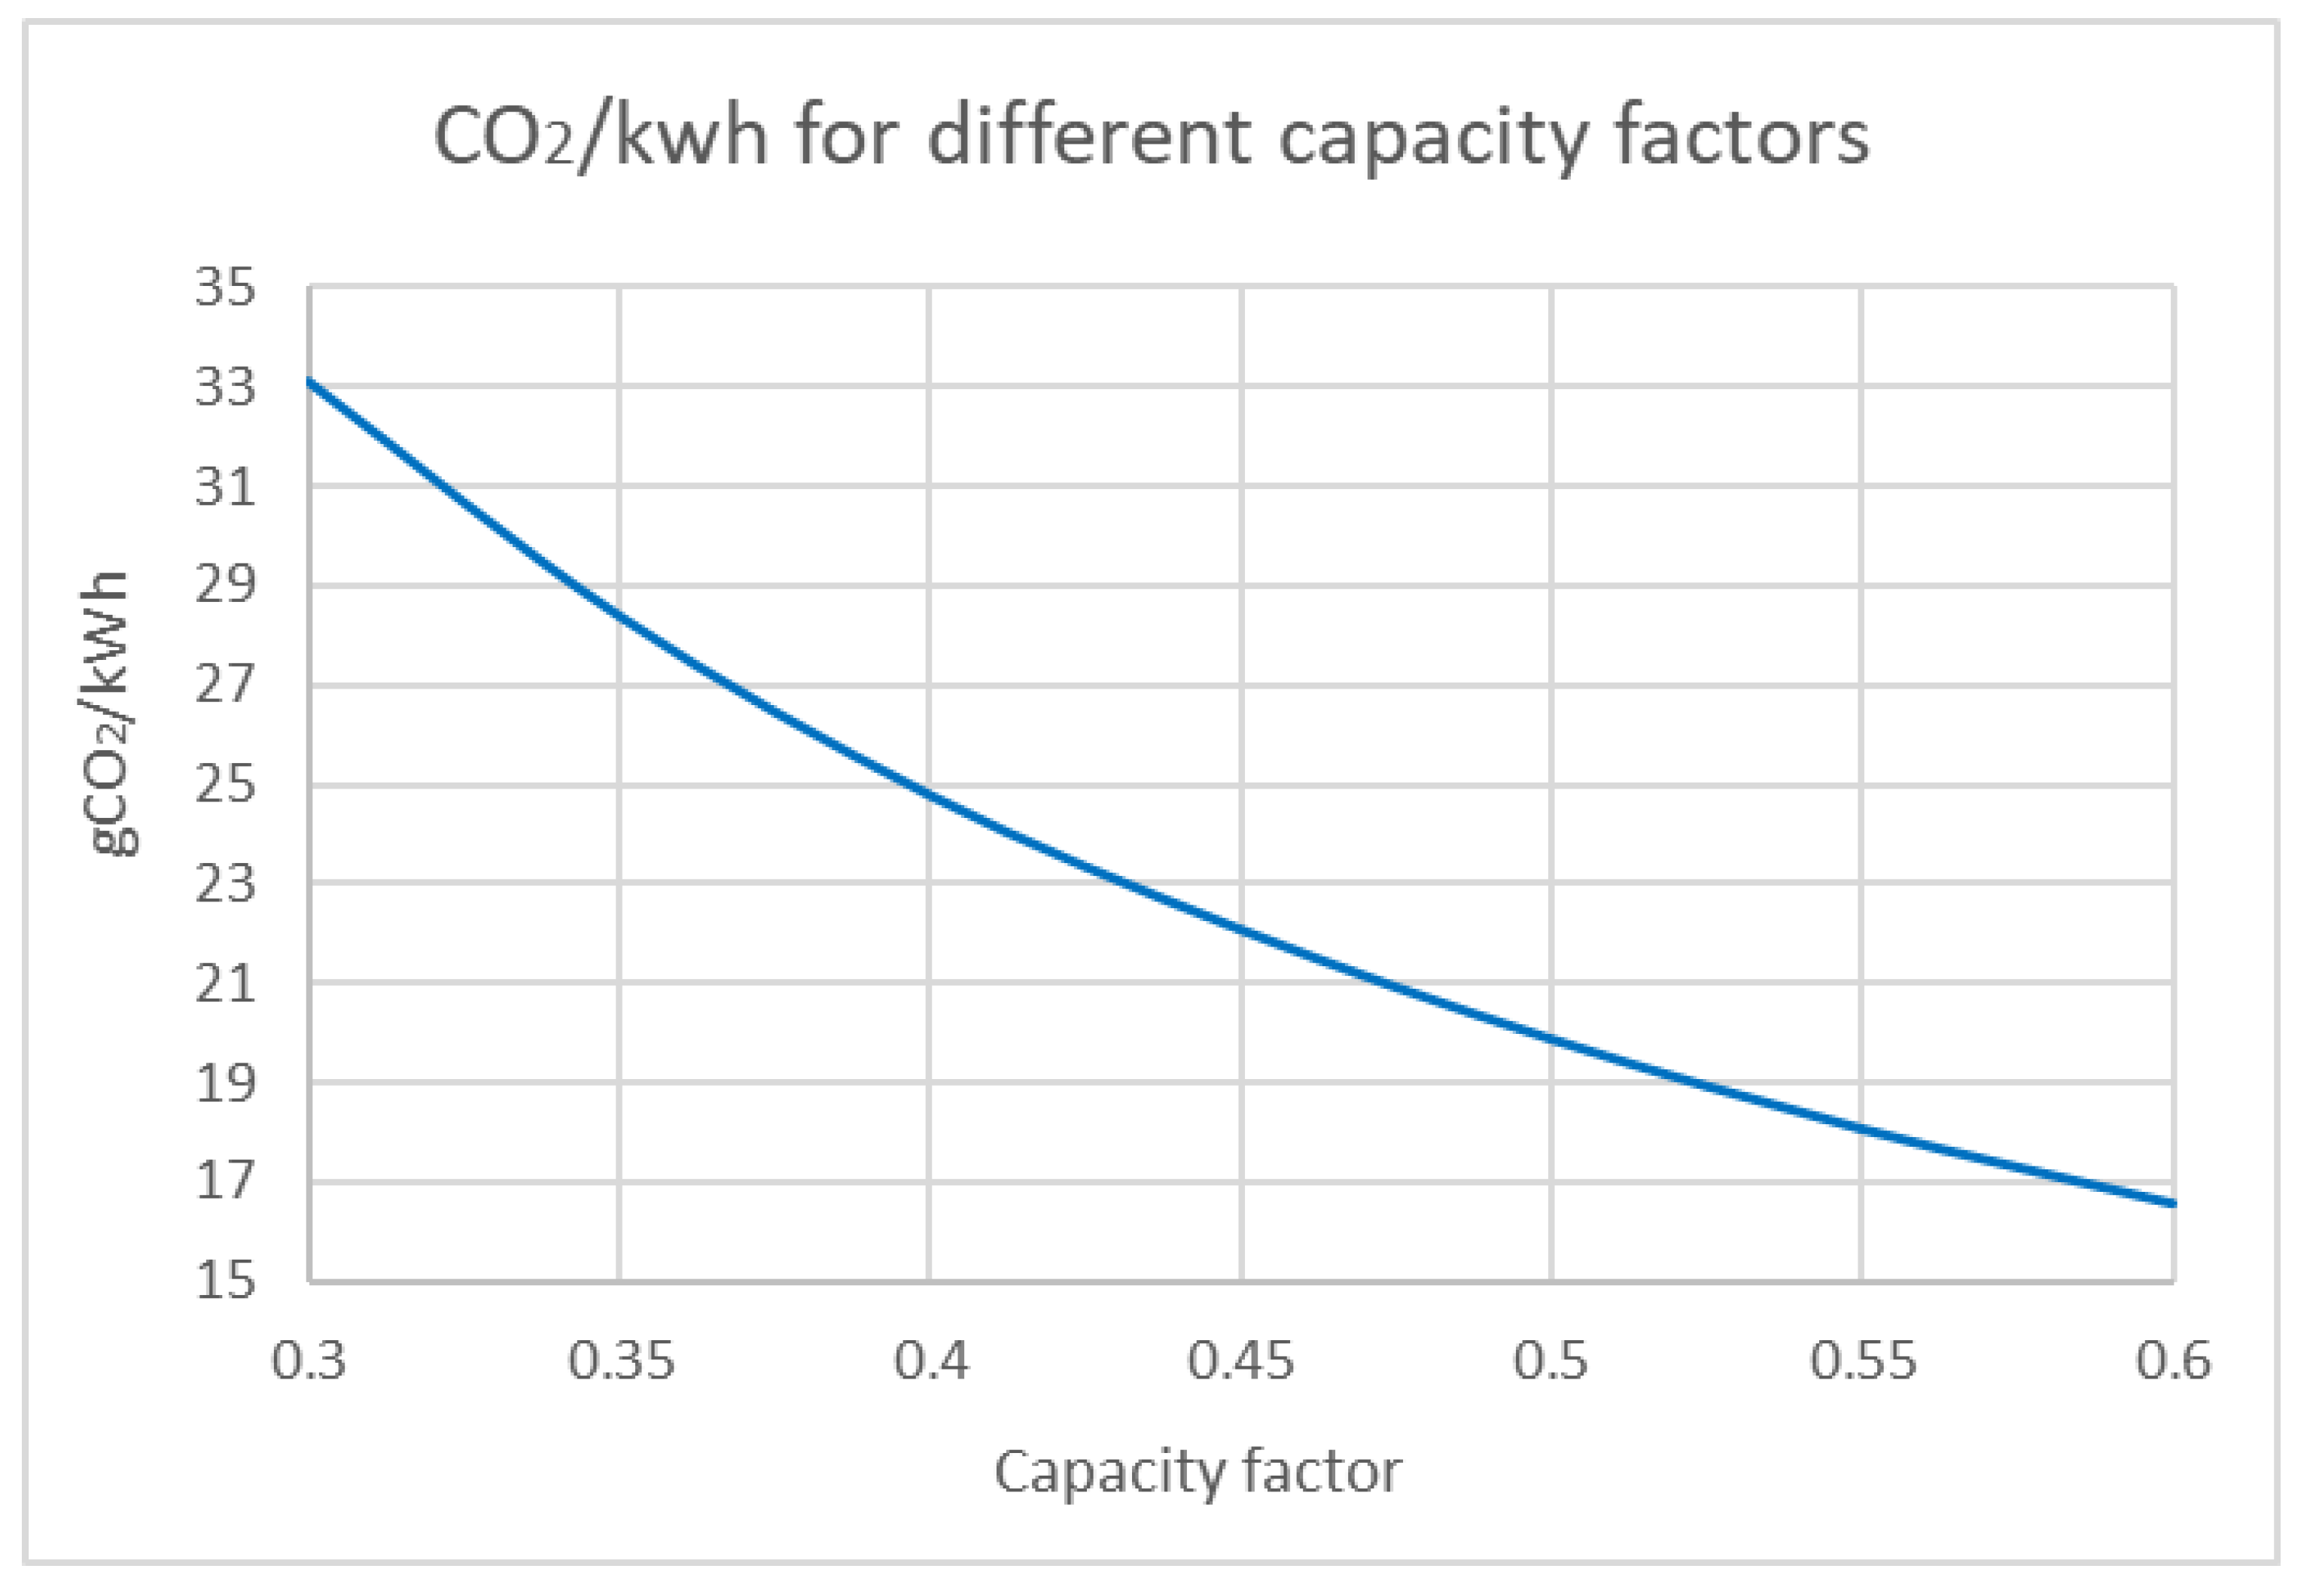
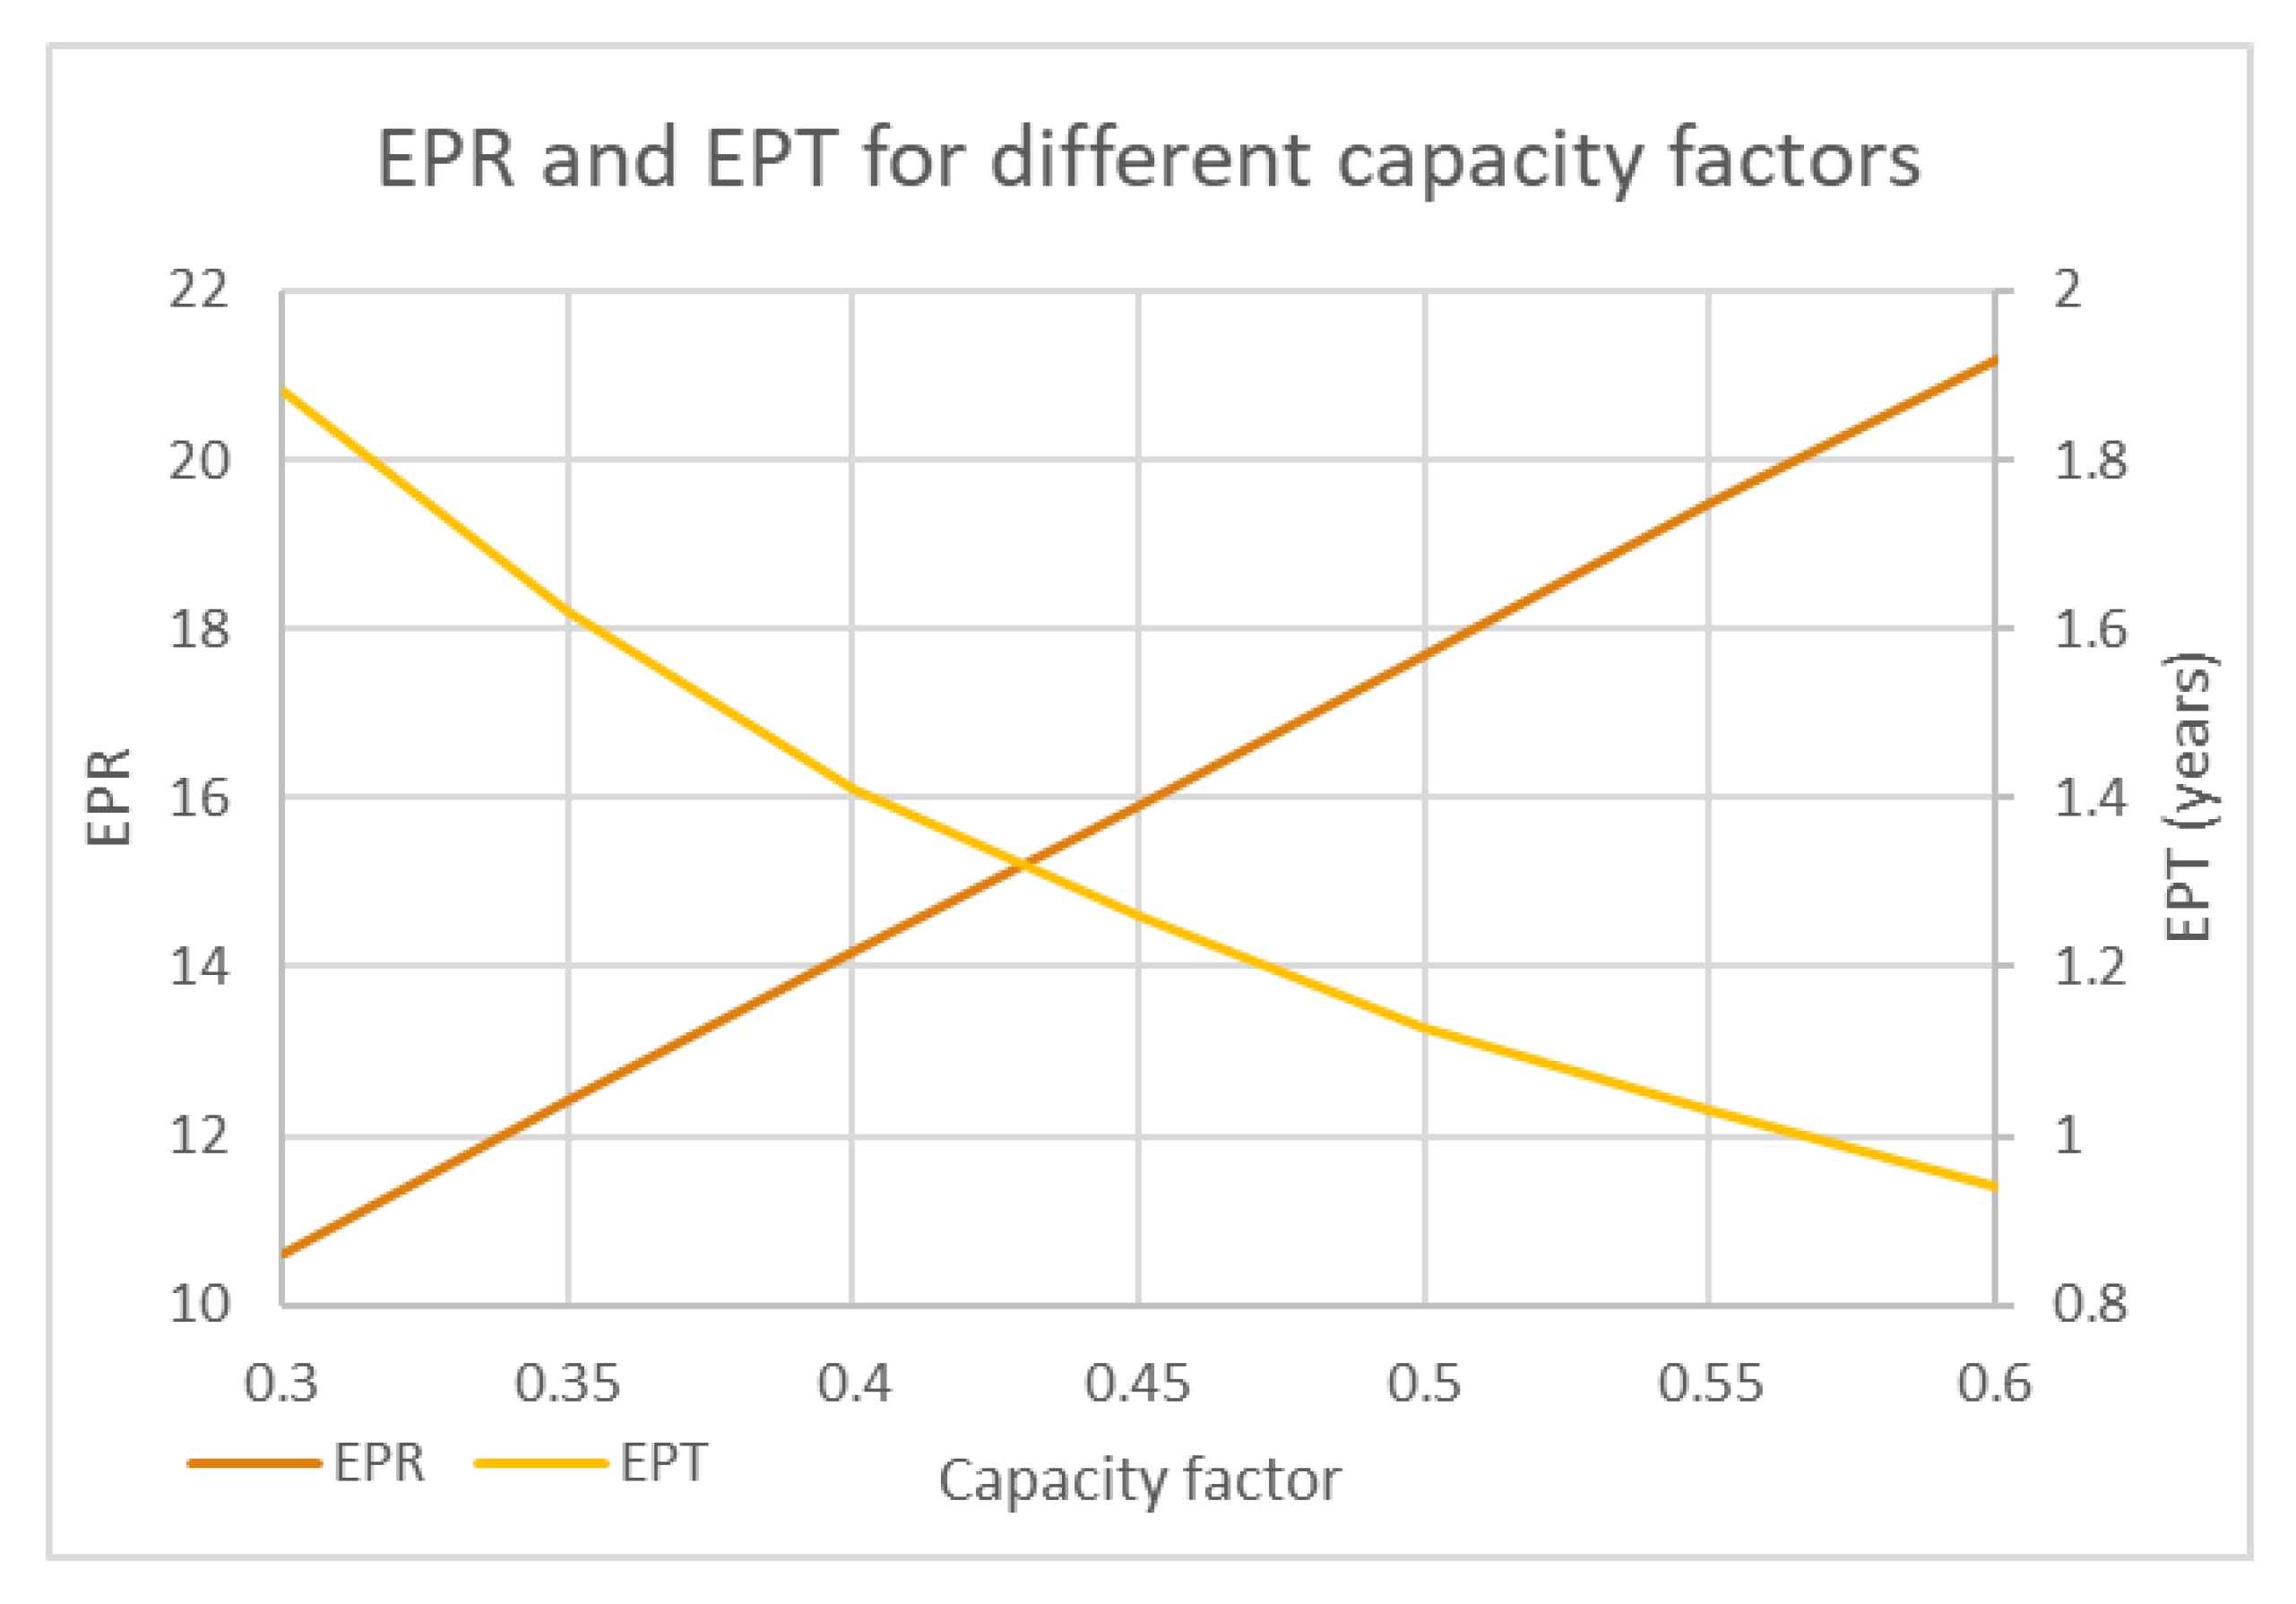
We can perform other sensitivity analysis to try to predict what changes we would have in the LCA of the project if we had different values of capacity factor below or above the assumed value, causing the results of energy produced by the turbine to be changed. In
Figure 5 and
Figure 6 we can see the changes caused in CO
2 emissions and in the values of EPR and EPT, for different changes in the capacity factor.
We can see that the behavior of CO2 emissions per kWh and EPT values follow a decreasing relationship, and the behavior of EPR follows an increasing relationship exactly linear. It is notable that even for the minimum value of capacity factor analyzed, the project is advantageous from an energy point of view, and emissions would still be much lower than the commonly used alternative, which uses fossil fuel, which is analyzed in the next subsection.
4.2. Comparison the Project with the Source of Energy Currently Used
Considering that we are carrying out this study to enable the implantation of an offshore wind turbine to supply power to an FPSO, it is necessary to assess how much the energy obtained from the wind is more sustainable and of less impact when compared to the current energy sources that supply oil platforms. Currently, FPSOs have aeroderivative gas turbines as their power generators, and they use fossil fuels, emitting CO
2 and other polluting gases in their operation. In this work, we will consider two gas turbine models that can be found on these platforms: GE LM2500+, with 16.8 MW of nominal power, and GE LM6000PG, with 41.2 MW of nominal power. Considering that these turbines operate at 60% of their capacities, which is already being adopted in the power values provided, we have that the first one emits 3 kgCO
2/s and the second 5 kgCO
2/s during their operations [
33].
If we assume that these turbines operate continuously for 20 years and consider only the emissions in operation (not in the whole life cycle), we have that the LM2500+ model has an emission ratio of 642.86 gCO
2/kWh and the LM6000PG model has a ratio of 436.89 gCO
2/kWh. Throughout the common life cycle of our project, as we saw in
Section 3.2, we have that the emission ratio is only 21.61 gCO
2/kWh. In other words, the CO
2 emissions ratio of a floating wind turbine represents only 5% of that of the cleaner gas turbine model used in FPSOs. It is important to emphasize that we only consider emissions during the operation of the gas turbine. If we considered emissions during the construction and decommissioning of the equipment, the value of the emissions ratio would increase even more, as these are stages where there is emission without energy production.
5. Conclusions
The analyses carried out in this work aimed at the quantitative and qualitative assessment of the environmental impacts generated during the entire life cycle of an offshore wind turbine operating on a semi-submersible platform in the Brazilian continental shelf. We highlight how much this energy source, despite some negative effects in the environment, it is still considerably more sustainable and less impactful when compared to traditional energy sources that use fossil fuels.
Regarding the impacts on marine fauna, we realized with this study that they vary between different animal classes and stages of the entire enterprise. We concluded that the operation of the system without extreme failures (such as the explosion of the battery) presents impacts that are not very significant for the case of just one turbine, representing mortality risk only for birds, which can be solved with some simple mitigating actions.
Regarding CO2 emissions and energy costs, we observed that the construction of the platform that makes the turbine float is the stage that generates the most negative effects in the entire project, as it has a very high mass of steel in its composition. However, it is important to note that the use of semi-submersible platforms is an option frequently considered for the operation of the turbine in deep waters, as we are aiming for. Other platform models could be more sustainable alternatives for the implantation of a floating turbine because they have smaller dimensions, such as the Spar-buoy or tension leg platform (TLP) models. We believe that the overall results would be close to that obtained with the current platform, but would probably present lower environmental damage.
Sensitivity analyses were performed to understand the effect of the variation of several parameters related to recycling, maintenance and failures, and capacity factor, on the values of CO2 emission and energy consumption. These analyses showed that variations in the amount of steel recycled and in the capacity factor of the system cause the most significant changes in EPR and EPT. Therefore, special attention should be given to site location, turbine selection or design, and decommissioning plan to maximize the environmental benefit of the enterprise.
It is important to note that offshore wind turbines are still being studied in Brazil and there are none currently operating in the country, which means that a lot of data had to be obtained from international sources. In addition, there are some limitations and lack of information which can in some cases bring incongruities. However, in order to investigate the feasibility of this undertaking at the national level, the relation of these comparisons with projects from other countries is essential so that, in the near future, this technology can be applied in this important oil and gas production center and decrease the carbon intensity of this economic activity. We also believe that the results are positive as they are within international standards, in addition to the qualitative analysis showing that the damage would not impede the success of this project. Ultimately, this work shows that, from an environmental point of view, the application of offshore floating wind turbines at high water depths is viable in Brazil and can play an important role in the decarbonization of the Brazilian oil and gas sector. Nonetheless, there are certainly economic, technological, and regulatory challenges that still need to be overcome, but those are not part of the scope of this study.


