
Three-Dimensional Visualization of Astronomy Data Using Virtual Reality †


1
Astrophysical Big Bang Laboratory (ABBL), Cluster for Pioneering Research, RIKEN, Wakō-shi, Saitama 351-0198, Japan
2
Interdisciplinary Theoretical and Mathematical Sciences Program (iTHEMS), RIKEN, Wakō-shi, Saitama 351-0198, Japan
†
Presented at the 23rd International Workshop on Neutrinos from Accelerators, Salt Lake City, UT, USA, 30–31 July 2022.
‡
Current address: Department of Physics and Astronomy, University of Manitoba, Winnipeg, MB R3T 2N2, Canada.
Phys. Sci. Forum 2023, 8(1), 71; https://doi.org/10.3390/psf2023008071
Published: 5 December 2023
Abstract
:Visualization is an essential part of research, both to explore one’s data and to communicate one’s findings with others. Many data products in astronomy come in the form of multi-dimensional cubes, and since our brains are tuned for recognition in a 3D world, we ought to display and manipulate these in 3D space. This is possible with virtual reality (VR) devices. Drawing from our experiments developing immersive and interactive 3D experiences from actual science data at the Astrophysical Big Bang Laboratory (ABBL), this paper gives an overview of the opportunities and challenges that are awaiting astrophysicists in the burgeoning VR space. It covers both software and hardware matters, as well as practical aspects for successful delivery to the public.
1. Introduction
Astronomy data, whether they come from observations or from simulations, are often multi-dimensional. Since humans experience the physical world in three dimensions (3D), it is rather natural to request, although not trivial to implement, having such data represented in 3D. On a flat surface, one can mimic 3D with perspective and shading; a perception of depth can be achieved using a stereoscopic display; it is highly enhanced by motion parallax, which further requires a tracking system. In a virtual reality (VR) environment [1], the user has the ability to freely explore the computer-rendered scene in a way that makes them feel immersed in the virtual world. In a scientific context, it is hoped that this will make it easier for researchers to comprehend and manipulate complex data sets [2].
2. An Overview of the VR Landscape
VR has come a long way since the first experiments in the 1960s, and the landscape is still rapidly evolving. One can make the distinction between setups where the user is stepping into the display (a CAVE), and head-mounted displays that are worn by the user [3]. In 2016, two VR headsets were available on the customer market: the Rift by Oculus (bought by Facebook, now Meta) and the Vive by HTC (in collaboration with Valve). As of 2022, there are dozens of offerings; we are not going to review them all here, but give some points to consider when acquiring equipment. One is where the computing power is coming from, another is how the tracking is being carried out. The most powerful headsets are tethered to a PC and leverage its graphics card. The first versions (like the Rift and the Vive) relied on external tracking, which is precise but requires further setup in the room. Newer models (like the Rift S, the Vive Cosmos, or the various Windows Reality headsets) have adopted internal (or “inside-out”) tracking, which requires active sensors on the headset. Some headsets offer an “all in one” experience with both embedded computing power and tracking (the most popular model currently being the Oculus Quest). This was first made possible by using the smartphone of the user for display and tracking, also known as mobile VR (pioneered by experiments such as the Google Cardboard). One point to check is the number of degrees of freedom (d.o.f.s): low-end systems may have only three d.o.f.s; one should aim for six d.o.f.s for both the headset and the controller(s) that enable interaction.
3. Scientific Visualization in VR
In our team of astrophysicists, we have experience using the HTC Vive Pro headset. This work started in 2016 as a pilot project at the University of Manitoba, a collaboration between the departments of Physics and Astronomy and of Computer Science, aimed at exploring the immersive visualization of astronomy data [4]. It was pursued at the RIKEN institute in the Astrophysical Big Bang Laboratory (ABBL), with participation of the Interdisciplinary Theoretical and Mathematical Sciences Program (iTHEMs) [5].
When developing a custom VR experience, some coding will be necessary. For development, we have been using the Unity 3D engine, which is widely used in the gaming industry, and has already been used for applications in the natural sciences. Unity software is cross-platform, it supports all kinds of advanced displays (which niche academic software typically do not), and offers a visual way of designing the scene and a high-level way of programming the interactions. It may, however, not be tailored for our needs as scientists, and may come with some performance bottlenecks. For other options, and a general introduction to the visualization of 3D astronomy data, see [6].
There are generically two ways to render scalar data cubes in a 3D manner (we are here assuming scalar data, which are a common case, but there are more techniques for the visualization of vector/tensor fields or other kinds of data). One is to extract a surface in the volume, typically through iso-contouring, in the form of a “mesh”, and rendering it using standard computer graphics techniques—this requires external lighting. Another is to assign a color and opacity to each grid cell (voxel), cast rays inside the cube, and integrate a basic radiative transfer equation along the line of sight—the data are then shining on their own. The latter option is more demanding in terms of computing power.
4. Using VR for Communication and Public Outreach
The data we have been exploring in VR come from our own research in progress, which makes them even more appreciated when shown to the public. Since 2016, our main research project has been to make the connection from a 3D supernova to a 3D supernova remnant. We have been using the results of 3D simulations of thermonuclear supernovae as inputs for 3D simulations of the remnant over hundreds or thousands of years, looking for long-lasting specific signatures of the different explosion models [7,8,9].
Specifically, we have two functional VR demos. One, dubbed SN2SNR, shows various visualizations of synthetic SNRs from our research project. It offers pre-defined renderings, but also advanced interactions such as playing the time evolution or selecting the set of iso-countours. The other, dubbed Cube2, showcases various data gathered in our group or from visitors. It offers more complete control over the rendering, which in general requires careful adjustments to be both visually satisfying and scientifically useful.
Since 2017, we have been routinely using VR to communicate our work, first to our colleagues, in particular during the ABBL international workshop “Theories of Astrophysical Big Bangs”, as well as to non-scientists, during the RIKEN Centennial Meeting and then RIKEN Open Day (Figure 1). We quickly realized that VR is a great tool for public engagement. Our public demos were so successful that we had to consider crowd management. The VR experience is a one-person-at-a-time experience; therefore, time has to be monitored and a limited number of people can try it in good conditions. Since most people are new to VR headsets (let alone the science on display), they have to be properly accompanied. For maximal efficiency, on-boarding starts before even wearing the headset and debriefing extends after returning it. Of note is the use of souvenir photos, taken and printed on site and handed off to the participants in order to leave a tangible trace of the virtual experience. More implementation details and lessons learned can be found in [5] from our group at RIKEN (http://ithems-members.riken.jp/warren/vrav), as well as in [10] from the NASA Chandra group (https://chandra.harvard.edu/vr/vr.html).
5. Conclusions
VR technology is now sufficiently mature and affordable that we can make use of it to better understand our science data (from observations or simulations alike) and hopefully accelerate our research [2,11,12]. And we can certainly use it for public outreach, to engage the public more actively with our research [5,13,14,15,16]. Another approach is Augmented Reality (AR), where computer renderings are overlaid on the physical world. There actually is a continuum between VR and AR, called Mixed Reality. For an application of AR to neutrino physics, see https://github.com/MissMuon/ICEcuBEAR_HoloLens (accessed on 30 November 2023).
Funding
This research received no external funding.
Data Availability Statement
Our VR demos are available upon request to people with the appropriate equipment.
Acknowledgments
The author thanks all the colleagues at RIKEN who made it possible to keep this VR project alive.
Conflicts of Interest
The author declares no conflict of interest.
Abbreviations
The following abbreviations are used in this manuscript:
| VR | virtual reality |
| AR | augmented reality |
| 3D | three dimensional |
| d.o.f. | degree of freedom |
References
- Greengard, S. Virtual Reality; MIT Press: Cambridge MA, USA, 2019. [Google Scholar]
- Jarrett, T.H. Exploring and Interrogating Astrophysical Data in Virtual Reality. Astron. Comput. 2021, 37, 100502. [Google Scholar] [CrossRef]
- Fluke, C.J.; Barnes, D.G. The Ultimate Display. In Proceedings of the Astronomical Data Analysis Software and Systems XXV, Sydney, Australia, 25–29 October 2015; Volume 512, p. 473. [Google Scholar] [CrossRef]
- Ferrand, G.; English, J.; Irani, P. 3D visualization of astronomy data using immersive displays. arXiv 2016, arXiv:1607.08874. [Google Scholar] [CrossRef]
- Ferrand, G.; Warren, D. Engaging the Public with Supernova and Supernova Remnant Research Using Virtual Reality. CAPjournal 2018, 24, 25–31. [Google Scholar] [CrossRef]
- Kent, B.R. 3D Data Visualization in Astrophysics. In Proceedings of the Astronomical Data Analysis Software and Systems XXVIII, College Park, ML, USA, 11–15 October 2018; Volume 523, p. 3. [Google Scholar]
- Ferrand, G.; Warren, D.C.; Ono, M.; Röpke, S.N.F.K.; Seitenzahl, I.R. From Supernova to Supernova Remnant: The Three-dimensional Imprint of a Thermonuclear Explosion. Astrophys. J. 2019, 877, 136. [Google Scholar] [CrossRef]
- Ferrand, G.; Warren, D.C.; Ono, M.; Nagataki, S.; Röpke, F.K.; Seitenzahl, I.R.; Lach, F.; Iwasaki, H.; Sato, T. From Supernova to Supernova Remnant: Comparison of thermonuclear explosion models. Astrophys. J. 2019, 906, 93. [Google Scholar] [CrossRef]
- Ferrand, G.; Tanikawa, A.; Warren, D.C.; Nagataki, S.; Safi-Harb, S.; Decourchelle, A. The double detonation of a double degenerate system, from Type Ia supernova explosion to its supernova remnant. Astrophys. J. 2022, 930, 92. [Google Scholar] [CrossRef]
- Arcand, K.K.; Jiang, E.; Price, S.; Watzke, M.; Sgouros, T.; Edmonds, P. Walking Through an Exploded Star: Rendering Supernova Remnant Cassiopeia A into Virtual Reality. CAPjournal 2018, 24, 17–24. [Google Scholar] [CrossRef]
- Baracaglia, E.; Vogt, F.P.A. E0102-VR: Exploring the scientific potential of Virtual Reality for observational astrophysics. Astron. Comput. 2008, 30, 100352. [Google Scholar] [CrossRef]
- Milisavljevic, D. Visualization and Collaborative Exploration of Complex Multi-dimensional Data Among Distant Individuals using Virtual Reality. Bull. Am. Astron. Soc. 2021, 53, 2021n1i541p11. Available online: https://ui.adsabs.harvard.edu/abs/2021AAS...23754111M/abstract (accessed on 30 November 2023).
- Russell, C. Dynamic modeling and virtual-reality exploration of the X-ray emission and accretion flow in the Galactic center from colliding stellar winds. Bull. Am. Astron. Soc. 2022, 54, 2022n3i110p87. [Google Scholar]
- Orlando, S.; Pillitteri, I.; Bocchino, F.; Daricello, L.; Leonardi, L. 3DMAP-VR, A Project to Visualize Three-dimensional Models of Astrophysical Phenomena in Virtual Reality. Res. Notes Am. Astron. Soc. 2019, 3, 176. [Google Scholar] [CrossRef]
- Hiramatsu, M.; Takanashi, N.; Asagiri, S.; Kawagoe, S.K.; Amano, S.G.; Kamegai, K. Virtual ALMA Tour in VRChat: A Whole New Experience. CAPjournal 2021, 30, 18. [Google Scholar] [CrossRef]
- Impey, C.; Danehy, A.T. Exploring the Frontiers of Space in 3D: Immersive Virtual Reality for Astronomy Outreach. CAPjournal 2008, 31, 18. [Google Scholar]
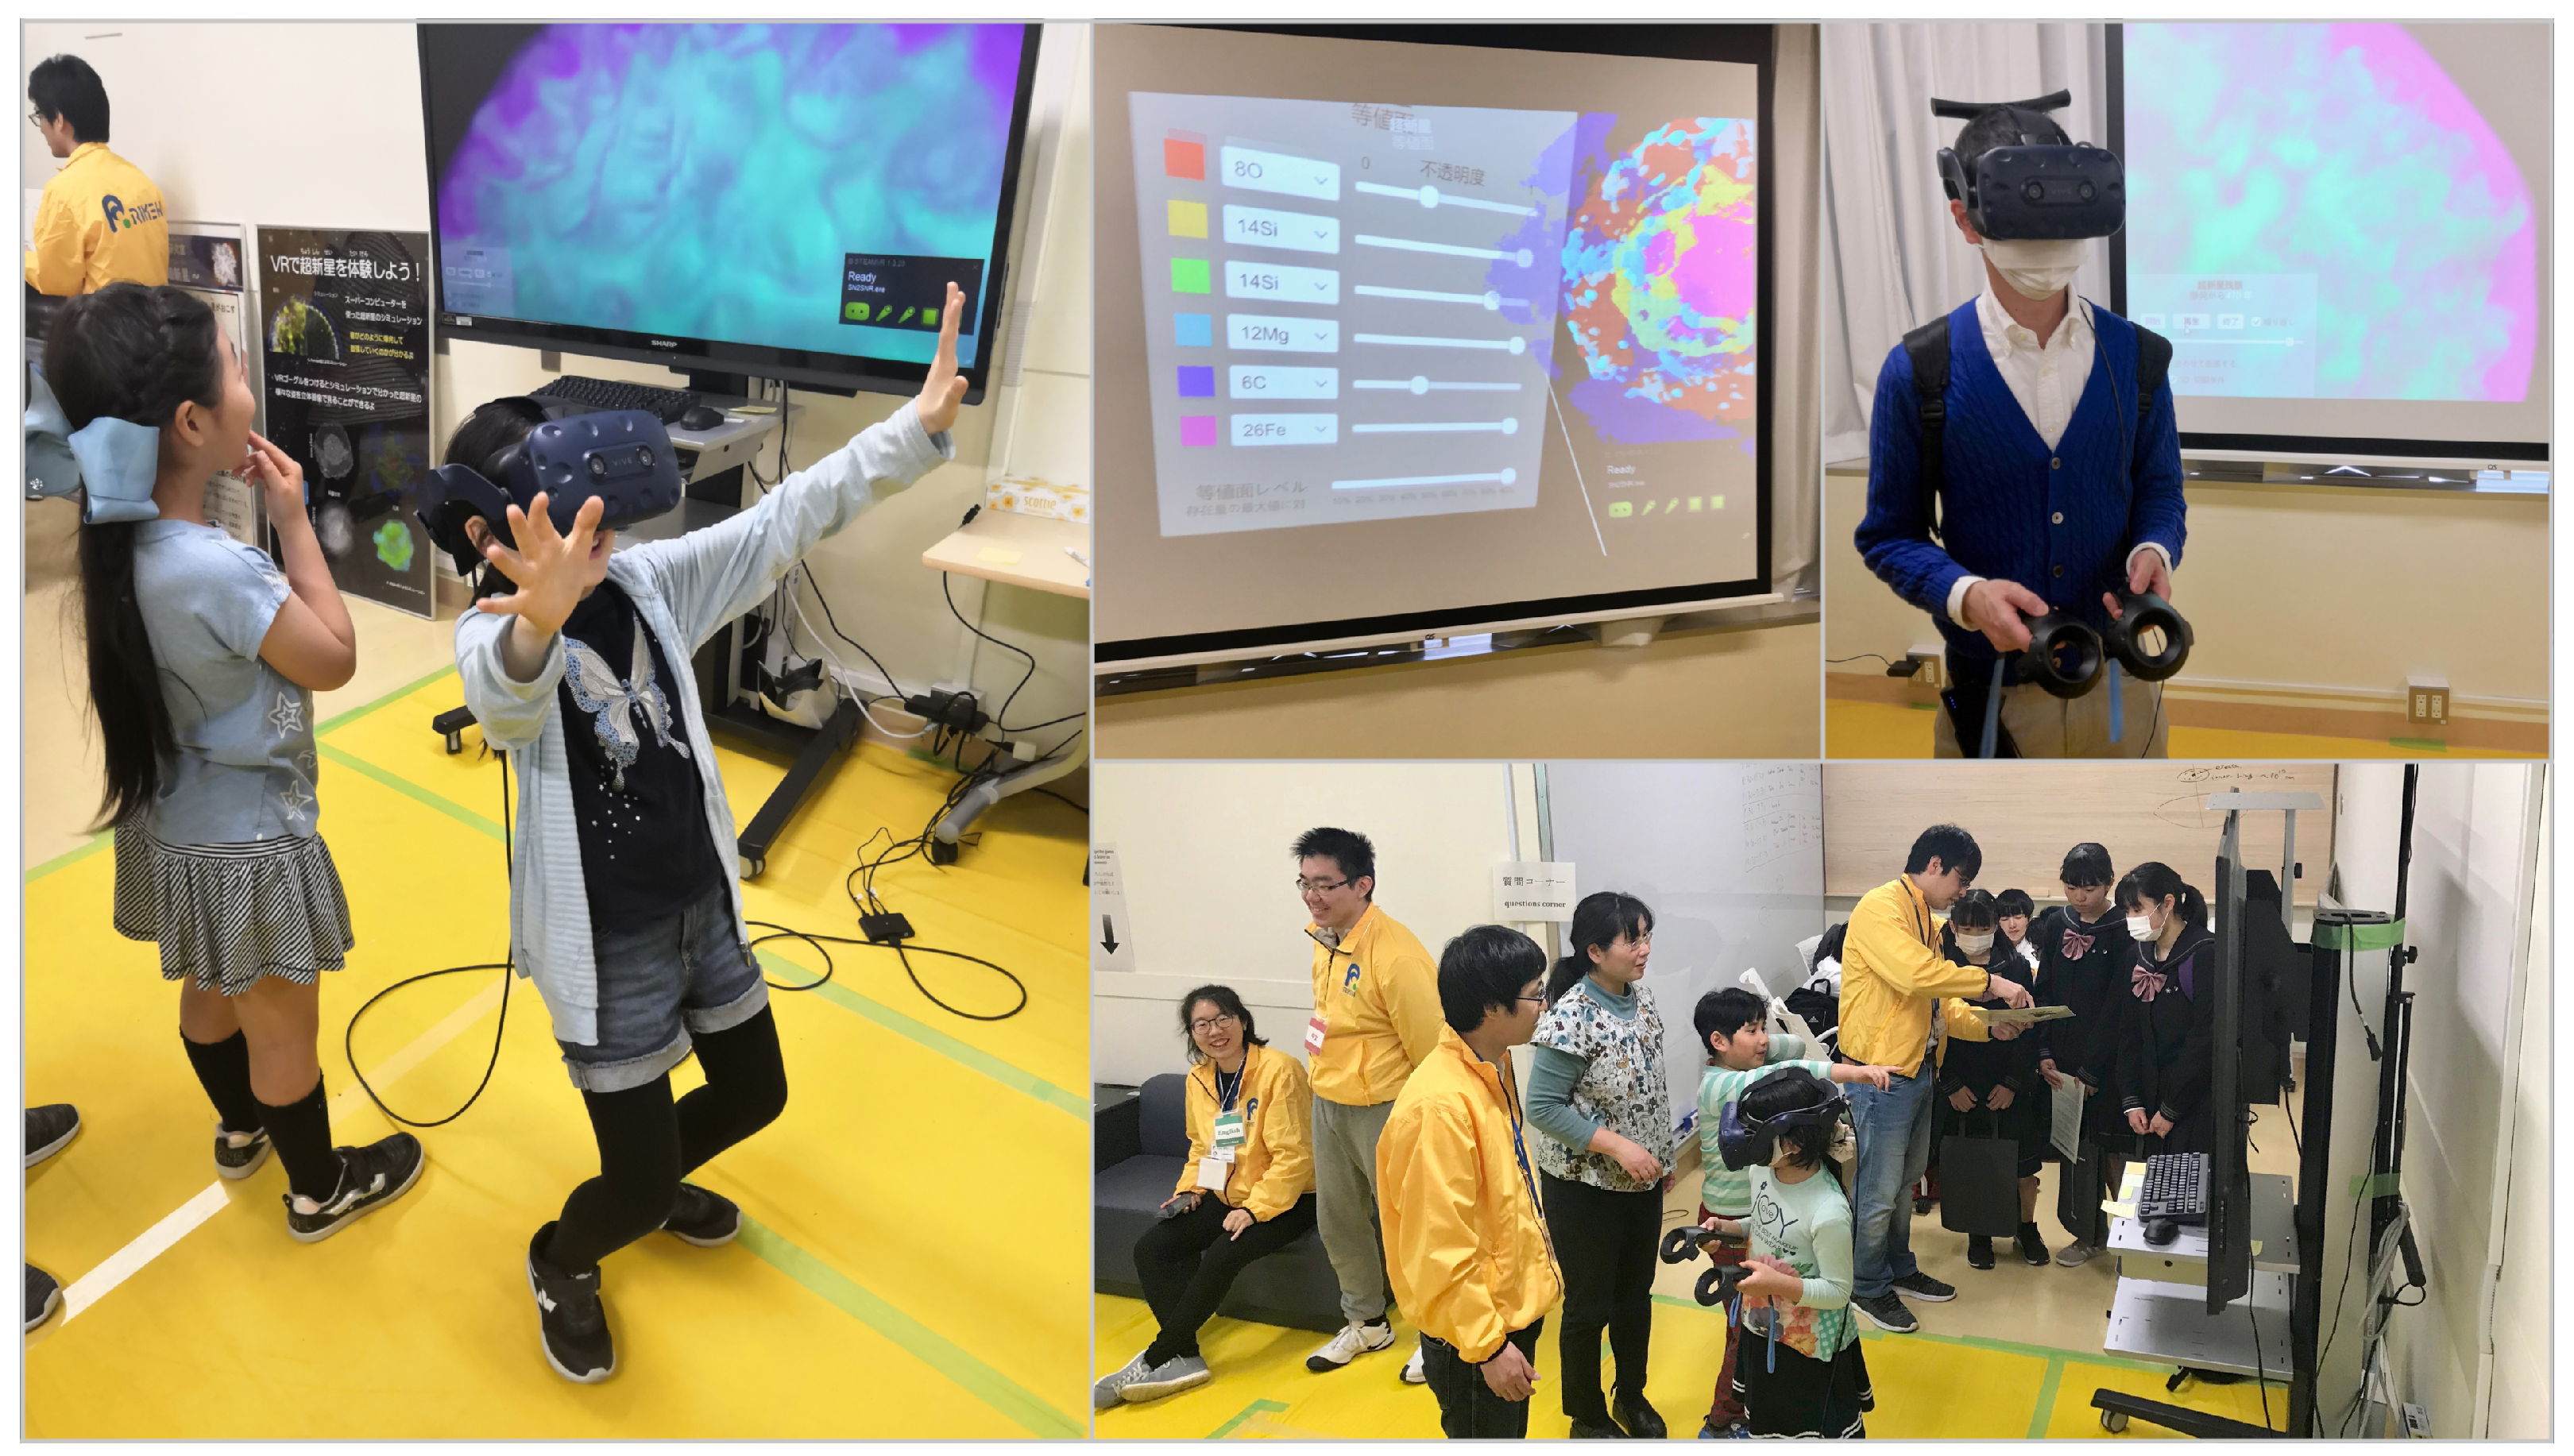
Figure 1.
Collage of photos taken at the ABBL booth during RIKEN Open Day 2019. At the top left and top right one can see a snapshot of the evolution of the supernova remnant (volume-rendered); the top center panel shows the user interface to select iso-contours of elemental abundances in the supernova (meshes). Even though a flat display cannot convey the VR experience, having a monitor in the room is important so that everyone can have an idea of what is going on inside the headset. The bottom right photo illustrates the flow of the demo: on-boarding using info sheet, the VR navigation per se, and the questions/feedback corner.

Disclaimer/Publisher’s Note: The statements, opinions and data contained in all publications are solely those of the individual author(s) and contributor(s) and not of MDPI and/or the editor(s). MDPI and/or the editor(s) disclaim responsibility for any injury to people or property resulting from any ideas, methods, instructions or products referred to in the content. |
© 2023 by the author. Licensee MDPI, Basel, Switzerland. This article is an open access article distributed under the terms and conditions of the Creative Commons Attribution (CC BY) license (https://creativecommons.org/licenses/by/4.0/).
Share and Cite
MDPI and ACS Style
Ferrand, G. Three-Dimensional Visualization of Astronomy Data Using Virtual Reality. Phys. Sci. Forum 2023, 8, 71. https://doi.org/10.3390/psf2023008071
AMA Style
Ferrand G. Three-Dimensional Visualization of Astronomy Data Using Virtual Reality. Physical Sciences Forum. 2023; 8(1):71. https://doi.org/10.3390/psf2023008071
Chicago/Turabian StyleFerrand, Gilles. 2023. "Three-Dimensional Visualization of Astronomy Data Using Virtual Reality" Physical Sciences Forum 8, no. 1: 71. https://doi.org/10.3390/psf2023008071