1. Introduction
The MEG II experiment [
1] is an ongoing search for the decay of an anti-muon (
) to a positron (
) and a photon (
):
. It is an example of a charged lepton flavor violating (CLFV) decay; no instance of CLFV has been observed. The
decay is allowed in the Standard Model (SM) due to the existence of three neutrinos with non-degenerate masses that mix to form flavor eigenstates. However, the SM
rate is highly suppressed (branching fraction ∼
) due to the small mass splittings between the neutrinos with respect to the mass of the W boson.
The small SM
branching fraction implies that its observation would be evidence of new physics. Many SM extensions (e.g., super-symmetric models) allow for
intermediate decay states that yield a branching fraction as large as
[
2]. The estimate is limited by experimental constraints (upper limit of
at the 90% confidence level, set by MEG [
3]). In addition, the estimate depends on the specific theoretical model and its parameters [
4]. The goal of MEG II is to improve on the sensitivity of the
decay by an order of magnitude.
True signal pairs are time-coincident at the stopping target with equal and opposite momenta. Due to the high decay rate and the decay kinematics, the primary background is due to a high-energy, time-coincident with a high-energy Michel (), from separate decays. The high energy photons come from radiative muon decays (RMD, ) or annihilation in flight (AIF, ). The background events are rejected by precise and measurements.
The requirement for background rejection motivates the design of the experiment. The experiment stops an anti-muon beam in a scintillator film (the stopping target) inside a superconducting solenoid with a maximum field of 1.3 T. The positrons are detected in a cylindrical open cell drift chamber (CDCH) and a set of pixelated scintillation counters (SPX). The positron tracks are propagated from the drift chamber to the target vertex using a Kalman filter [
5,
6]. This yields the positron position (
), momentum (
), and direction (
) at the target. The positron time at the target (
) is calculated at the timing counter and then corrected by the Kalman-estimated propagation delay. A fully absorbing liquid xenon calorimeter (LXe) measures
at the calorimeter. The photon is then assumed to originate at the positron vertex (
). The analysis then uses
to discriminate signal from background.
MEG II uses a new lightweight cylindrical stereo drift chamber with full coverage. The design allows for improved positron kinematic resolution and efficiency with respect to MEG. In addition, the new chamber has significantly more track space points that allow for better kinematic resolution (9 sense wire layers, each with 192 wires). In the 2021 physics run, the drift chamber was filled with ::: (88.2:9.8:1.5:0.5); the isopropanol and oxygen were added to mitigate high current issues the chamber experienced in previous engineering runs.
Due to the graded magnetic solenoid, the positrons eventually reach a large enough radius to intersect the pixelated timing counter (starting at larger radius than the drift chamber outer radius). The counter consists of two semi-cylindrical modules, each with 256 timing counter tiles. Each tile consists of a plastic scintillator with SiPM (silicon photo-multiplier) readouts on both ends. Each tile has an expected resolution of ∼90 ps based on pilot runs [
1]; on average, a signal positron intersects ∼9 tiles, thus achieving a goal timing resolution of ∼30 ps.
The MEG II collaboration has upgraded the MEG liquid xenon calorimeter by increasing the granularity and spatial uniformity of the photon counters. The inner-face is now covered by 4092 multi-pixel photon counters (MPPCs). The five other sides remain covered by photo-multiplier tubes (PMTs). The inner-face upgrade allows for improved energy and spatial resolution with respect to MEG. In addition, the increased spatial resolution allows for improved pileup discrimination when two time-coincident photons enter the calorimeter.
2. Results: 2021 Physics Run
The first MEG II physics run was completed in 2021. The dataset consists of ∼24 M physics triggers with a beam rate varying from 2–5
Hz. The MEG trigger requires a “hit” in both the LXe and SPX detectors with a time match (+/− 12.5 ns), and a spatial match based on
decays simulated in Geant4 [
7]. The trigger also has an online energy threshold in the liquid xenon detector of ∼40–45 MeV.
In the next subsections, we summarize the status of the positron and photon analyses. In addition, we describe data-driven approaches to estimating the kinematic resolution. The collaboration has a significant ongoing effort to improve upon the analysis, and therefore, all numbers listed are preliminary.
2.1. Positron Analysis
For the drift chamber, the optimization results in an increased tracking efficiency and number of hits per track, while minimizing the hit-by-hit residuals (distance of closest approach). This is achieved through a variety of improvements: a more accurate data-driven drift cell time-distance relationship, waveform analysis improvements, improved wire alignment including a wire sagitta, etc.
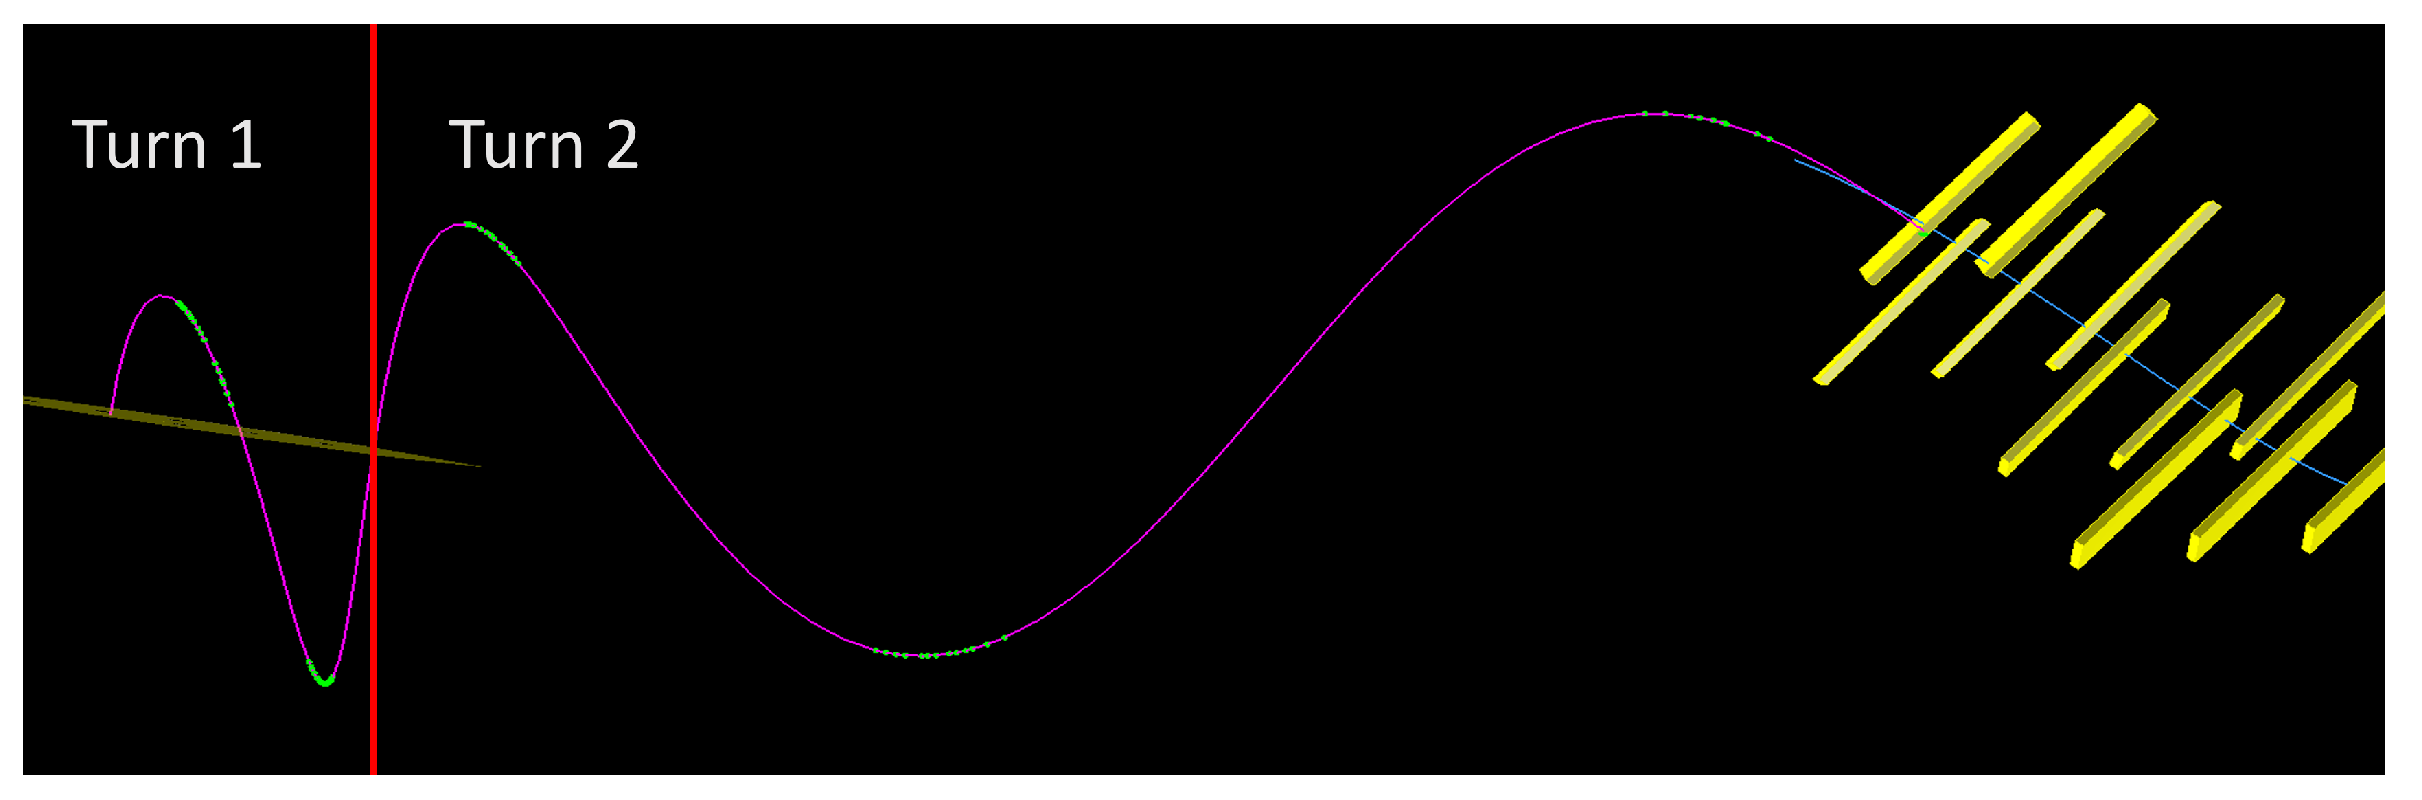
Next, we discuss a data-driven approach to estimating the kinematic resolution of the positrons (
). The technique uses positron tracks that intersect the chamber on two “turns”. An example of a two turn track is shown in
Figure 1. The first turn (two chamber intersections) and the second turn (three chamber intersections) are independently measured and fit. The two turns are then propagated to a common plane that is parallel to the target surface. Comparing the kinematics at this common plane (e.g., momentum comparison:
) yields a resolution estimate of the positron tracks: the better the comparison, the better the resolution. The technique was originally developed by the MEG collaboration.
The width of the double turn distributions, i.e., all
distributions, does not immediately yield the signal resolution for a couple of reasons. The width contains the error in both
and
, which are not equal. For simplicity, the numbers quoted here assume the resolution of both turns are equivalent except for the momentum. Second, the analysis uses Michel tracks; the MEG II Geant4 simulation is used to convert this into a signal positron resolution. Preliminary signal kinematic resolution estimates are tabulated in
Table 1.
Next, we describe a measurement of the internal SPX positron timing resolution. The resolution is estimated by comparing the time of even/odd intersected tiles (hits) in the same “cluster” of SPX hits. That is, for a given cluster, the positron time at a reference point is compared only using the even/odd-ordered tile measurements (hits). The more tiles, the narrower the distribution.
Preliminary estimates indicate an internal SPX timing resolution of ∼35 ps for signal positrons (∼9 tiles); this is comparable to the design of the MEG II experiment. However, this estimate does not include other errors that can affect the target-SPX propagation delay, and therefore, the resolution. For example, the propagation delay could be sensitive to magnetic field errors, relative CDCH-SPX alignment, or relative alignment of the individual SPX tiles. As the mentioned alignments improve, the resolution can be improved.
2.2. Photon Analysis
This analysis effort includes improving the relative gain and timing of the individual MPPCs/PMTs, performing calibrations, and improving the pileup detection algorithm in the cases where two time-coincident photons intersect the LXe detector.
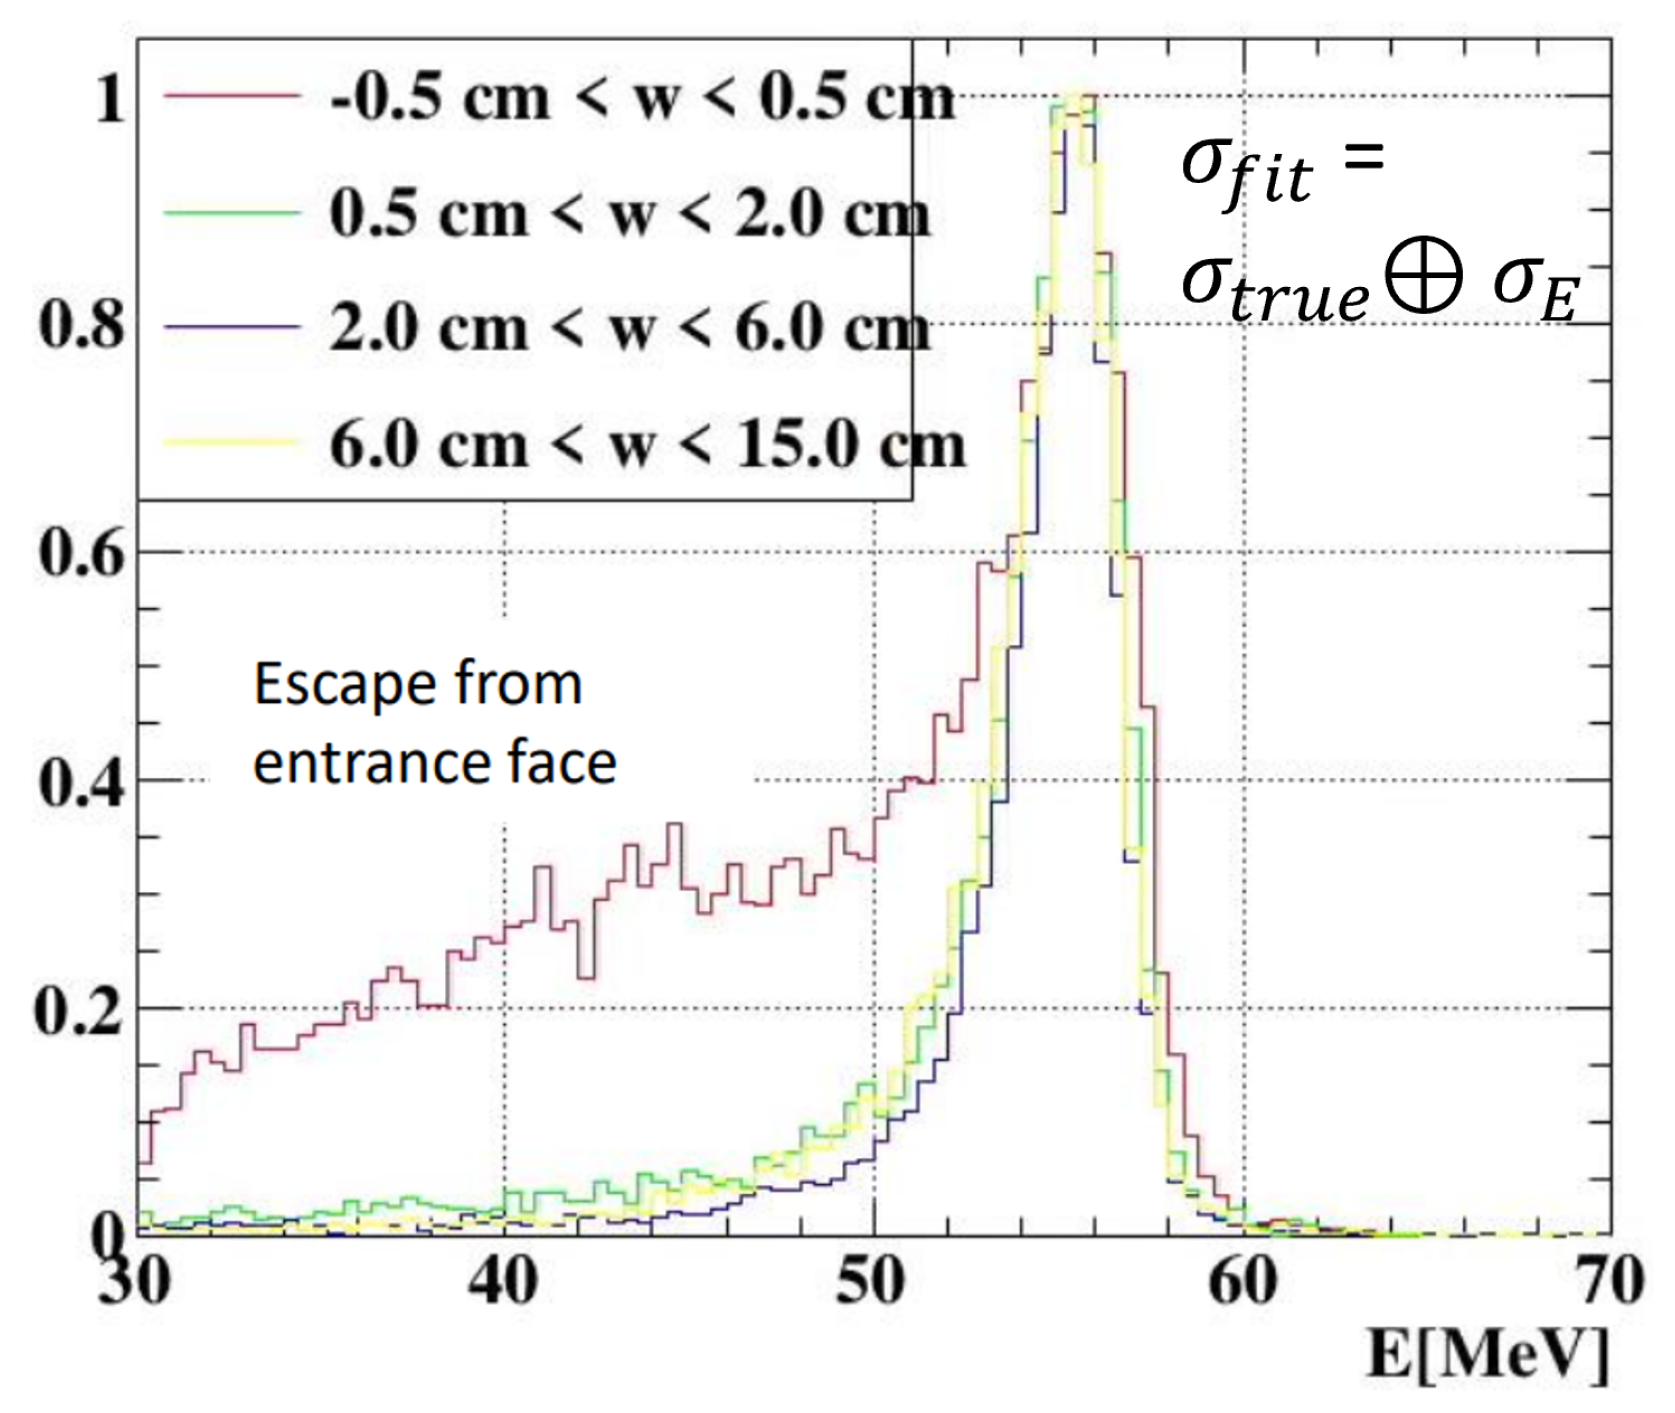
The LXe detector requires calibrations to achieve the optimal performance. The primary calibration technique uses a beam with a liquid hydrogen target; some interact via the ; mode. The has kinetic energy () due to the / energy difference. By selecting back-to-back pairs with a small opening angle, a quasi-monochromatic beam enters the LXe detector: ; , MeV. Generally, the MeV is selected to enter the LXe detector in order to be closer to the signal energy (52.83 MeV).
The other outgoing enters a separate detector, which consists of a 4 × 4 array of bismuth germanium oxide (BGO) crystals and a pre-shower counter for the photon timing (). By moving the separate detector to be back-to-back with varying positions in the LXe detector, we calibrate and as a function of position in the LXe detector. This calibration technique was also used in MEG and is known as the charge exchange (CEX).
As an example, the 55 MeV peak as a function of LXe depth is shown in
Figure 2. The width of the 55 MeV peak and
distributions yield preliminary
and
estimates, respectively. The distributions also contain other resolution components such as that due to the non-zero opening angle between the photons and the uncertainty in the decay vertex position. These uncertainties have been estimated and then deconvolved with the distributions to estimate the true LXe resolutions. The photon energy resolution is listed in
Table 1.
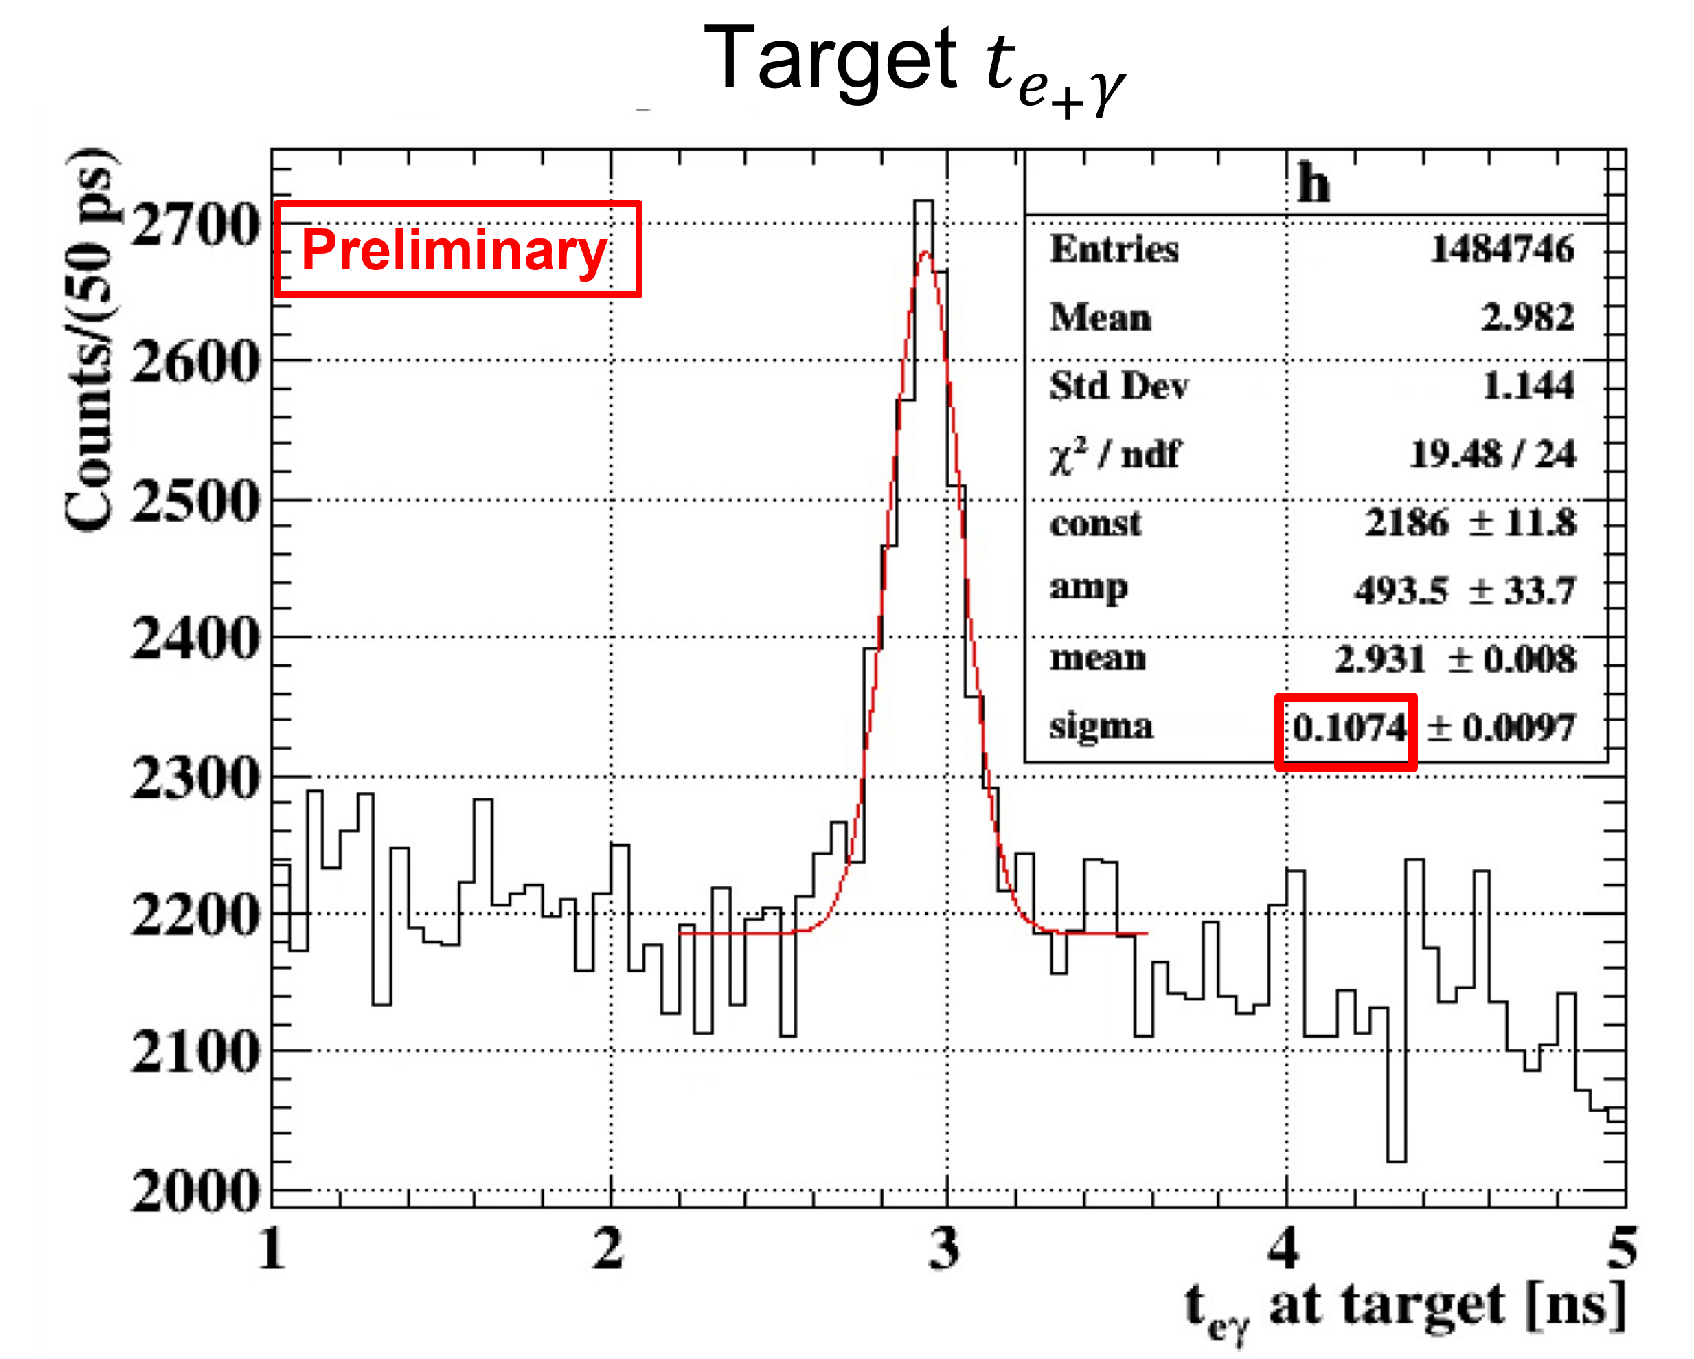
2.3. Radiative Muon Decay Timing
Finally, we present a data-driven
resolution estimate using non-accidental RMD decays. This is the ultimate timing resolution check that only requires a small correction to estimate the signal
resolution due to the difference in the number of SPX hits and the
energy.
Figure 3 shows the RMD peak with a single Gaussian resolution of ∼107 ps. This is already improved with respect to the MEG RMD resolution (double Gaussian with a core of 130 ps or a signal resolution of 122 ps), but is not yet at the level of the MEG II design (signal resolution of 85 ps). The collaboration aims to improve this through alignments, calibrations, and algorithm improvements.


