1. The T2K Experiment
The T2K (Tokai to Kamioka) experiment is one of the long baseline neutrino programs using accelerator neutrinos produced by a proton accelerator at the J-PARC (Japan Particle Accelerator Research Centre) facility in the Tokai district in Japan, which is oriented to the far detector called Super-Kamiokande (SK) located 295 km away from Tokai. The high intensity of the proton beam provided by J-PARC produces charged pions which are focused by three electromagnetic horns in either neutrino or anti-neutrino mode, which in turn makes both measurements of neutrinos and anti-neutrinos possible. The dominant neutrino flavor is or , with less than 1% contamination from other flavors. T2K has adopted an off-axis method which enables it to tune the neutrino flux peak at the maximum oscillation probability (around 0.6 GeV) as well as to make the neutrino energy spectrum narrower. These experimental features enable T2K to explore CP violation in the lepton sector via the measurement of neutrino oscillations for both and . T2K is also leading the measurements of and .
The experimental facilities other than the neutrino beamlines are divided into near detectors [
1] and the far detector, the latter of which is focused on in this article. SK is a water Cherenkov detector holding approximately 50 kilo-tons of water surrounded by about 13,000 Photo-Multiplier Tubes (PMTs) in total. The most significant ability of SK is the separation power between
and
, which is estimated to achieve less than 1% misidentification at 1 GeV for single-ring events. Although SK was updated in 2020 by contaminating pure water with gadolinium (Gd) in order to obtain more information about neutrons via neutron capture by Gd, the latest analysis shown in this article did not utilize this update. This improvement will be discussed in the chapter on future prospects.
2. New Analysis Sample at the Far Detector
The analysis samples were conventionally divided into five samples ( 1Ring (1R), 1R, 1R, 1R, 1R + decay electrons). All of them were categorized as one-reconstructed-ring events. A new sample added to this analysis, called CC1, includes multi-ring events. The dominant interaction composing this sample is neutrino charged current pion production. The peak energy of the parent neutrino is around 1.0 GeV, which allows us to control the oscillation spectrum in a larger neutrino energy range. Although we have not fed additional physics data in this analysis, adding this sample contributes to about a 30% increase in muon neutrino statistics.
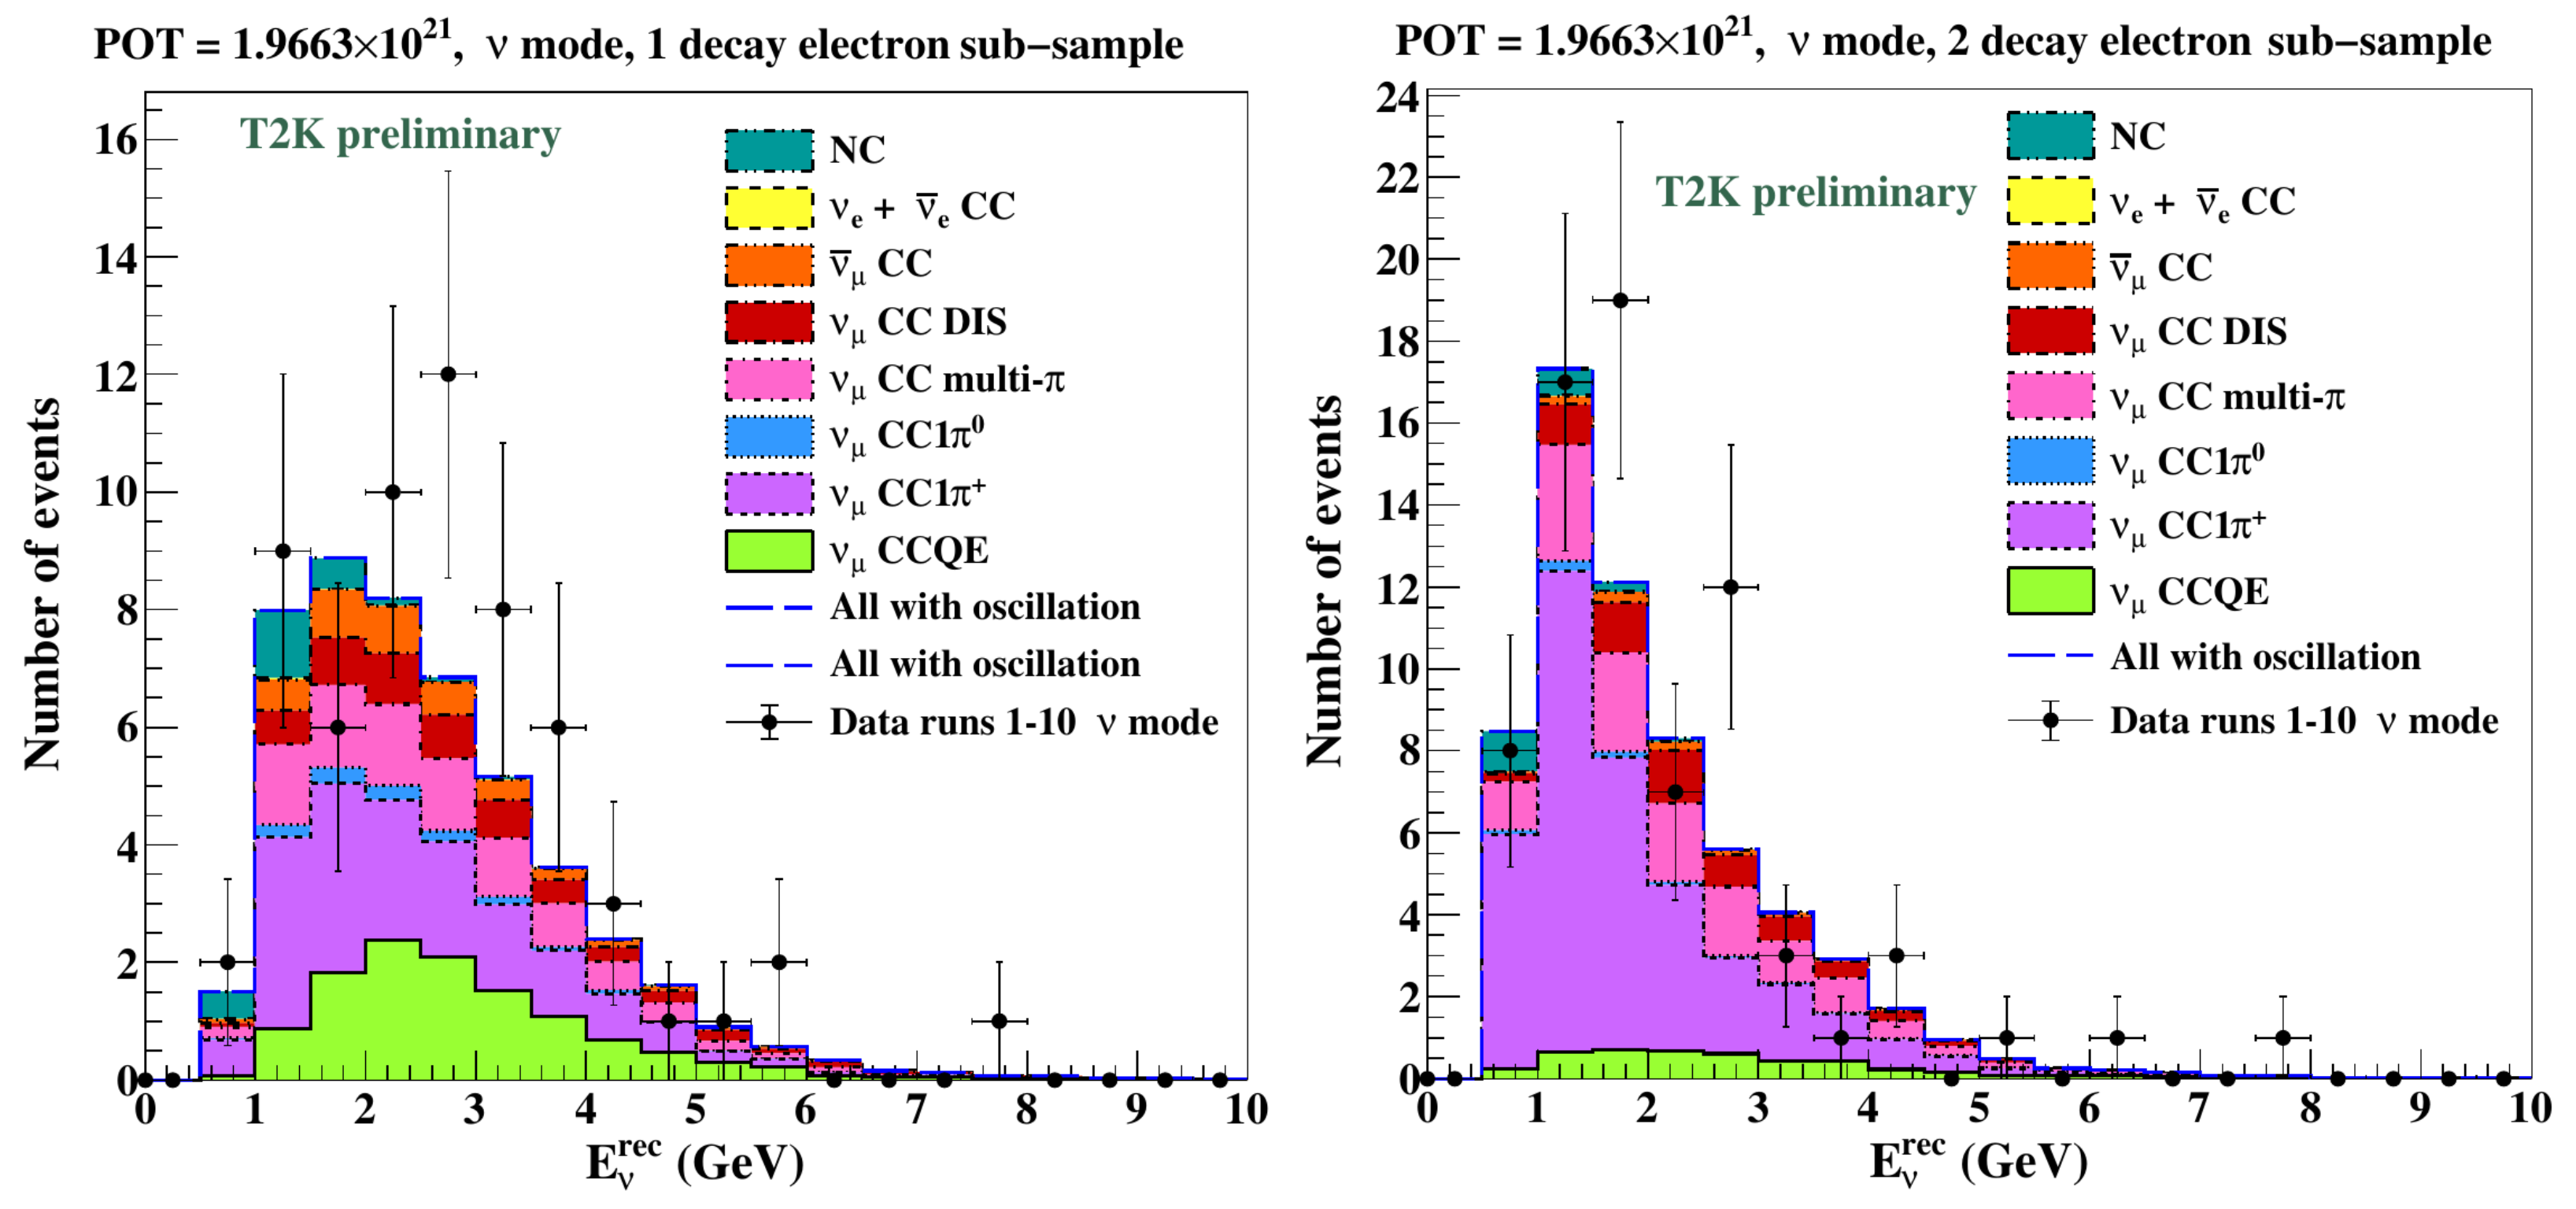
Event selection criteria guarantee this sample is statistically independent from the other 1R samples. One of the largest features of this sample is to allow two or more ring events from charged particles with one or two decay electrons, but it also includes 1R events with two decay electron events. The reason why one decay electron sample is allowed in multi-ring events is that the pion final state interaction causes the loss of a decay electron. The possible main backgrounds come from multi-pion production and deep inelastic scattering interactions. In order to suppress these backgrounds, the log-likelihood ratio of multi-pion discriminators was applied, which has a distinct ability to separate the signal from these backgrounds. As a summary of the set of event selections, it achieves 32% purity at 56% efficiency for the one decay electron sub-samples and 55.9% purity at 89% efficiency for the two decay electron sub-samples. Those two sub-samples ended up being combined in the latter oscillation analysis.
Figure 1 shows the data-MC comparisons of the neutrino-reconstructed energy distributions of this new sample. The calculation formula to reconstruct neutrino energy for this sample is modified from the usual calculation formula assuming charged current quasi-elastic (CCQE) like events to take into account the delta resonance producing a pion.
3. The Highlight of the Latest Oscillation Analysis Results
T2K deployed both Markov Chain Monte Carlo (MCMC) and grid-scan with MC marginalization fitting frameworks to extract the best fit oscillation parameters and their constraints, which roughly correspond to the Bayesian and frequentist approaches, respectively. In this article, results from grid scans with MC marginalization will be introduced. The six samples were fitted, three of which (
1R,
1R, and
1R + decay electrons) are e-like samples being sensitive to chiefly
,
, and
, whereas the other samples (
1R,
1R, and
CC1
) are
-like samples sensitive to
and
. The parameter
was fixed to 0.307 in the fit as this parameter is well understood in solar and reactor neutrino measurements [
2]. The parameter
was also constrained by reactor experiments (
[
3]). Thus, we are going to provide both the T2K stand-alone results and results of T2K with
constrained by the reactor experiments.
The binning schemes in the grid scan approach are divided into three:
–
for
-like one ring samples,
–
for e-like one ring samples, and
for the
CC1
sample. The fitter calculates the likelihood with marginalization over nuisance parameters such as systematic parameters or oscillation parameters not to be fitted to create contours of certain oscillation parameters provided by either the fixed chi-squared method or the Feldman and Cousins (FC) critical chi-squared method [
4].
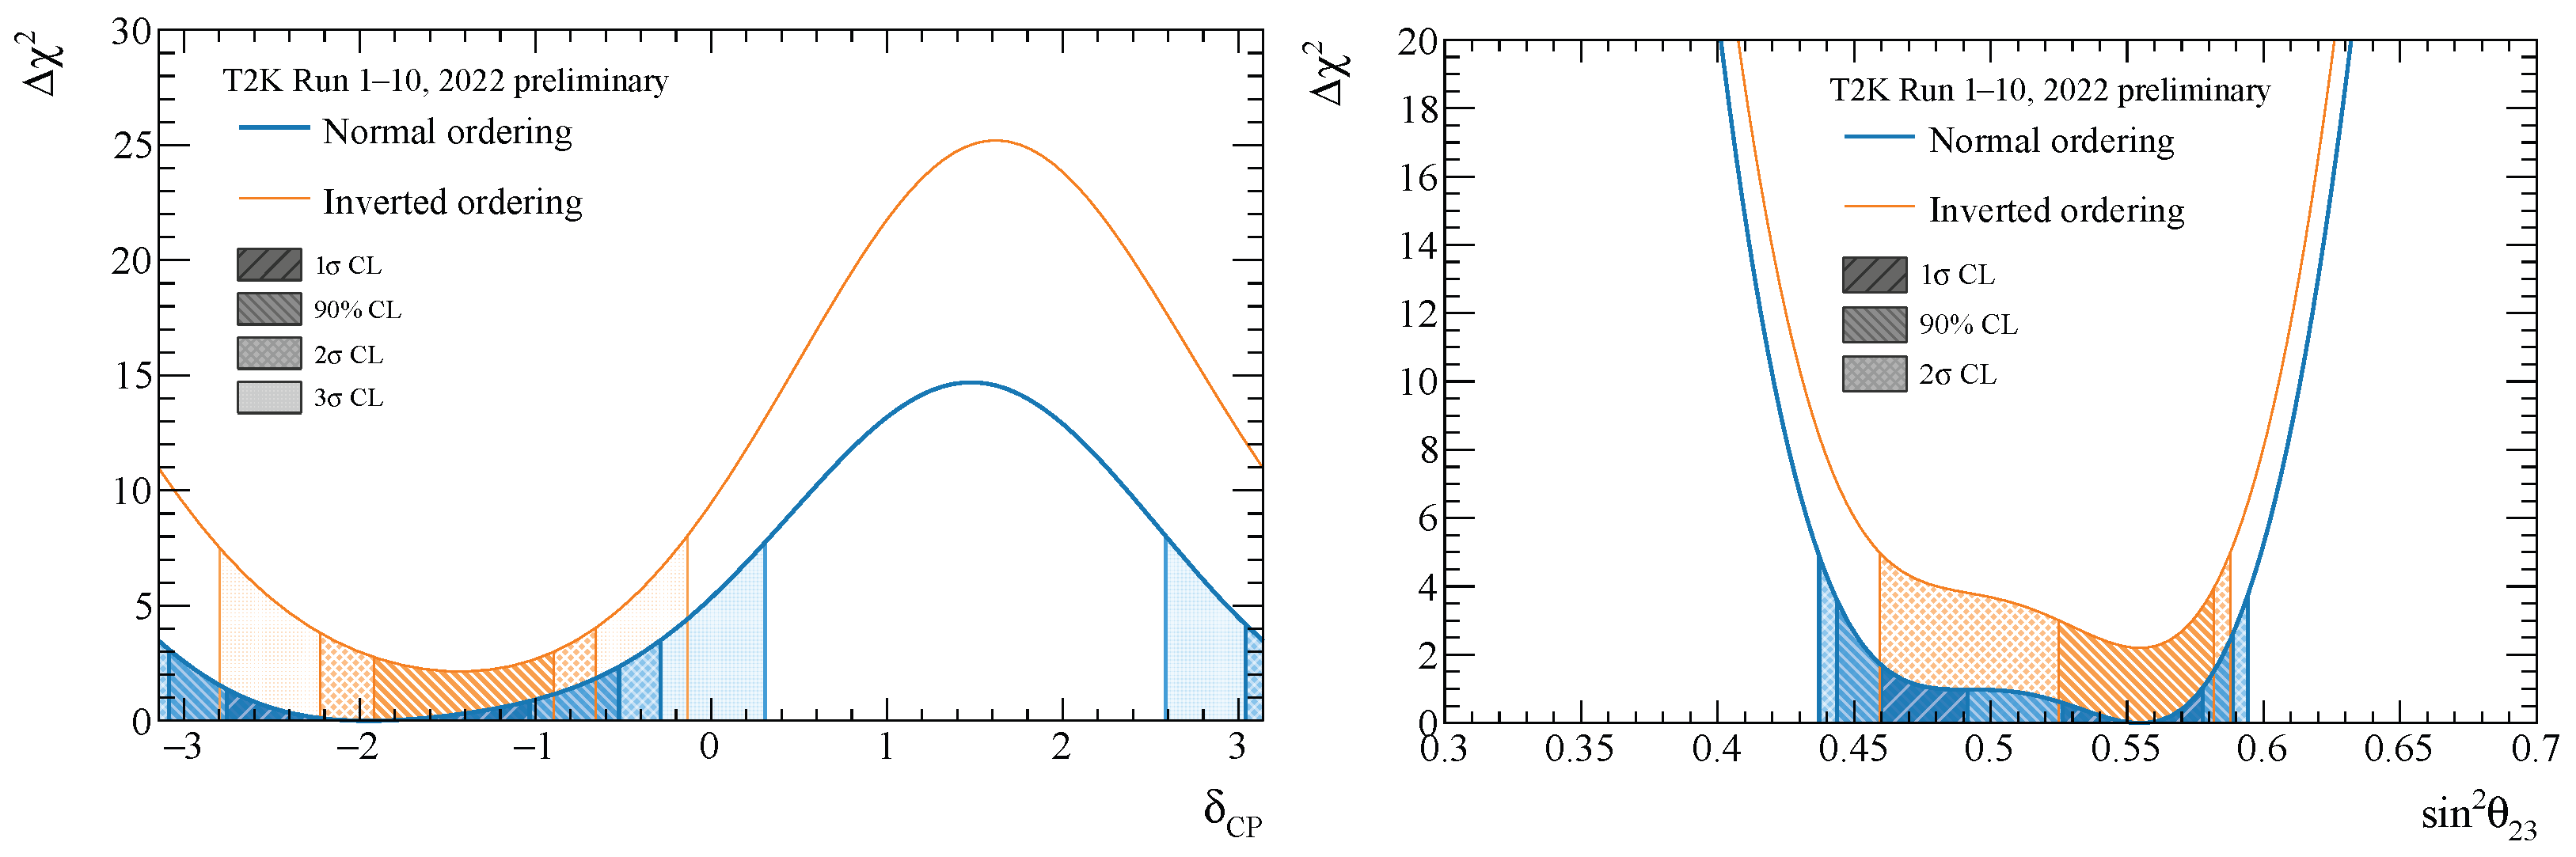
Figure 2 shows one-dimensional contours of the FC method for
and
. The CP conserving values (0,
) are excluded at 90% confidence level and
is still within 2
confidence level. T2K slightly prefers the upper octant in
(3.0 for the Bayes factor), but both octants are allowed in the 1
confidence level. Both figures also suggest normal ordering is preferred (2.8 for the Bayes factor).
4. Impact of Analysis Improvements
The latest oscillation analysis contains many improvements, including the new sample added to the far detector samples. They are briefly summarized as the following items.
- 1.
Updates of the neutrino flux tuning using 2010 Replica target data along with various fixes to the flux generator (JNUBEAM [
5]);
- 2.
Expansion of the neutrino interaction models in cross-section systematic parameters;
- 3.
Adding new samples in the near detector fit;
- 4.
Updating the value on the constraints based on 2021 data;
- 5.
Adding the new sample in the far detector fit.
The first three items (1 to 3) refer to the updates of the near detector parts and the latter two items refer to the far detector parts.
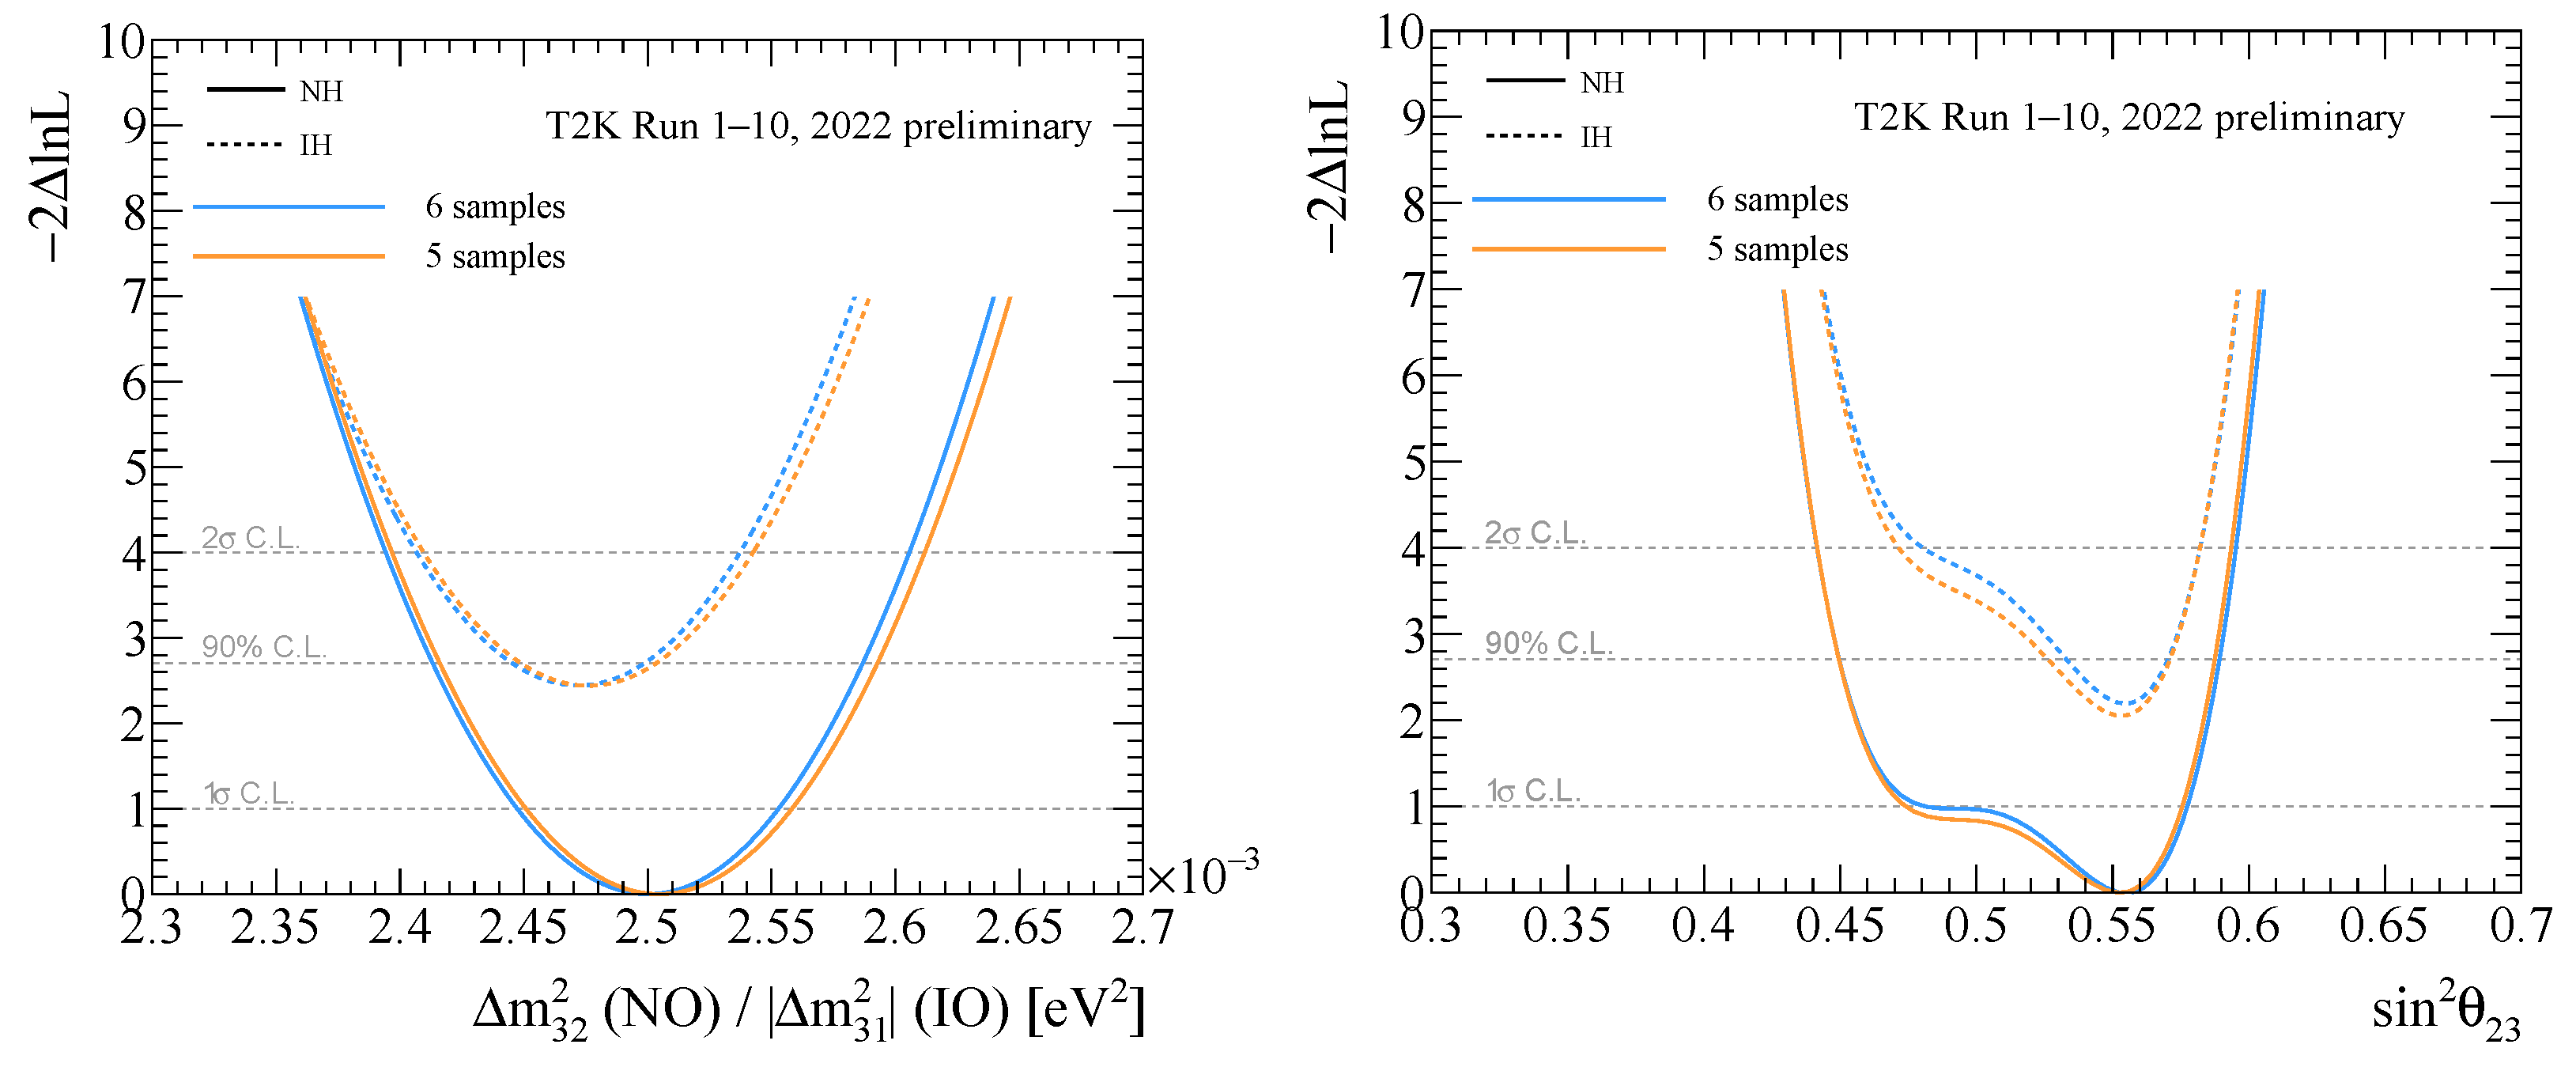
Figure 3 shows comparisons between fit results with six samples and five conventional samples without the new sample. Additional Gaussian smearing (
) was applied from results of potential bias studies using alternative neutrino interaction models for
contours. The improvement in constraints of each oscillation parameter is visible but small; in particular, there is an approximately 5% improvement in
with respect to its 1
error. This small effect is due in part to the peak energy of the parent neutrino for this sample lying at about 1.0 GeV, which is quite away from the maximum oscillation probability region (0.6 GeV).
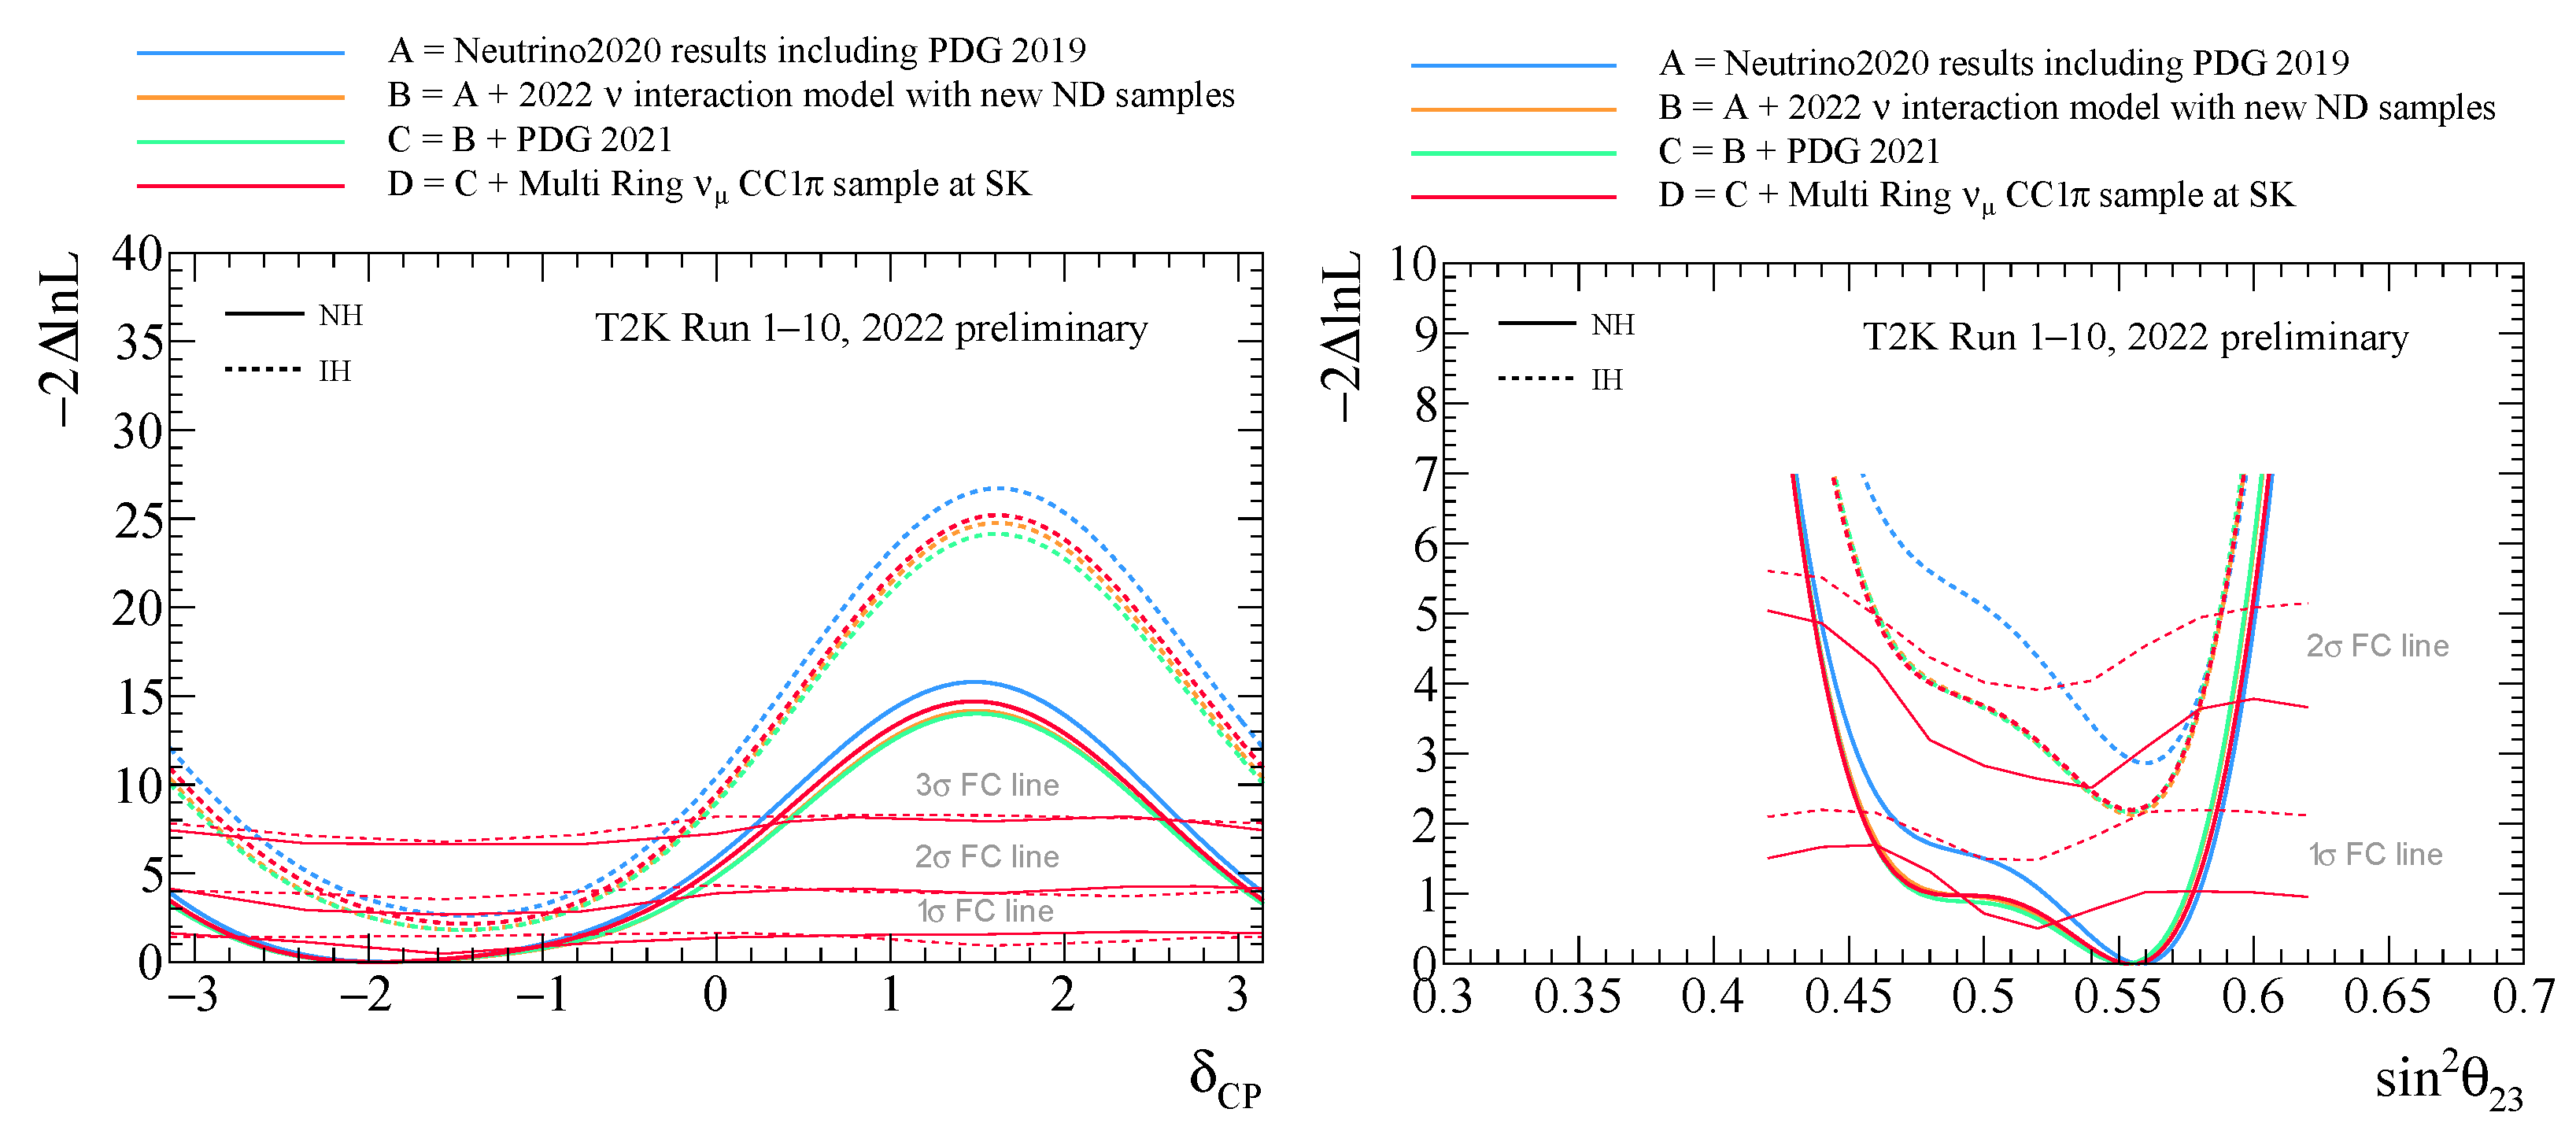
In order to check the most significant analysis update compared to the previous analysis in 2020, evolution plots are shown in
Figure 4. Each color refers to the step-by-step evolution of analysis improvements. Both evolution plots indicate that the largest effect on the contours comes from the updates to the neutrino interaction models and the near detector analysis samples.
5. Future Prospects
We are going to discuss three major prospects in progress.
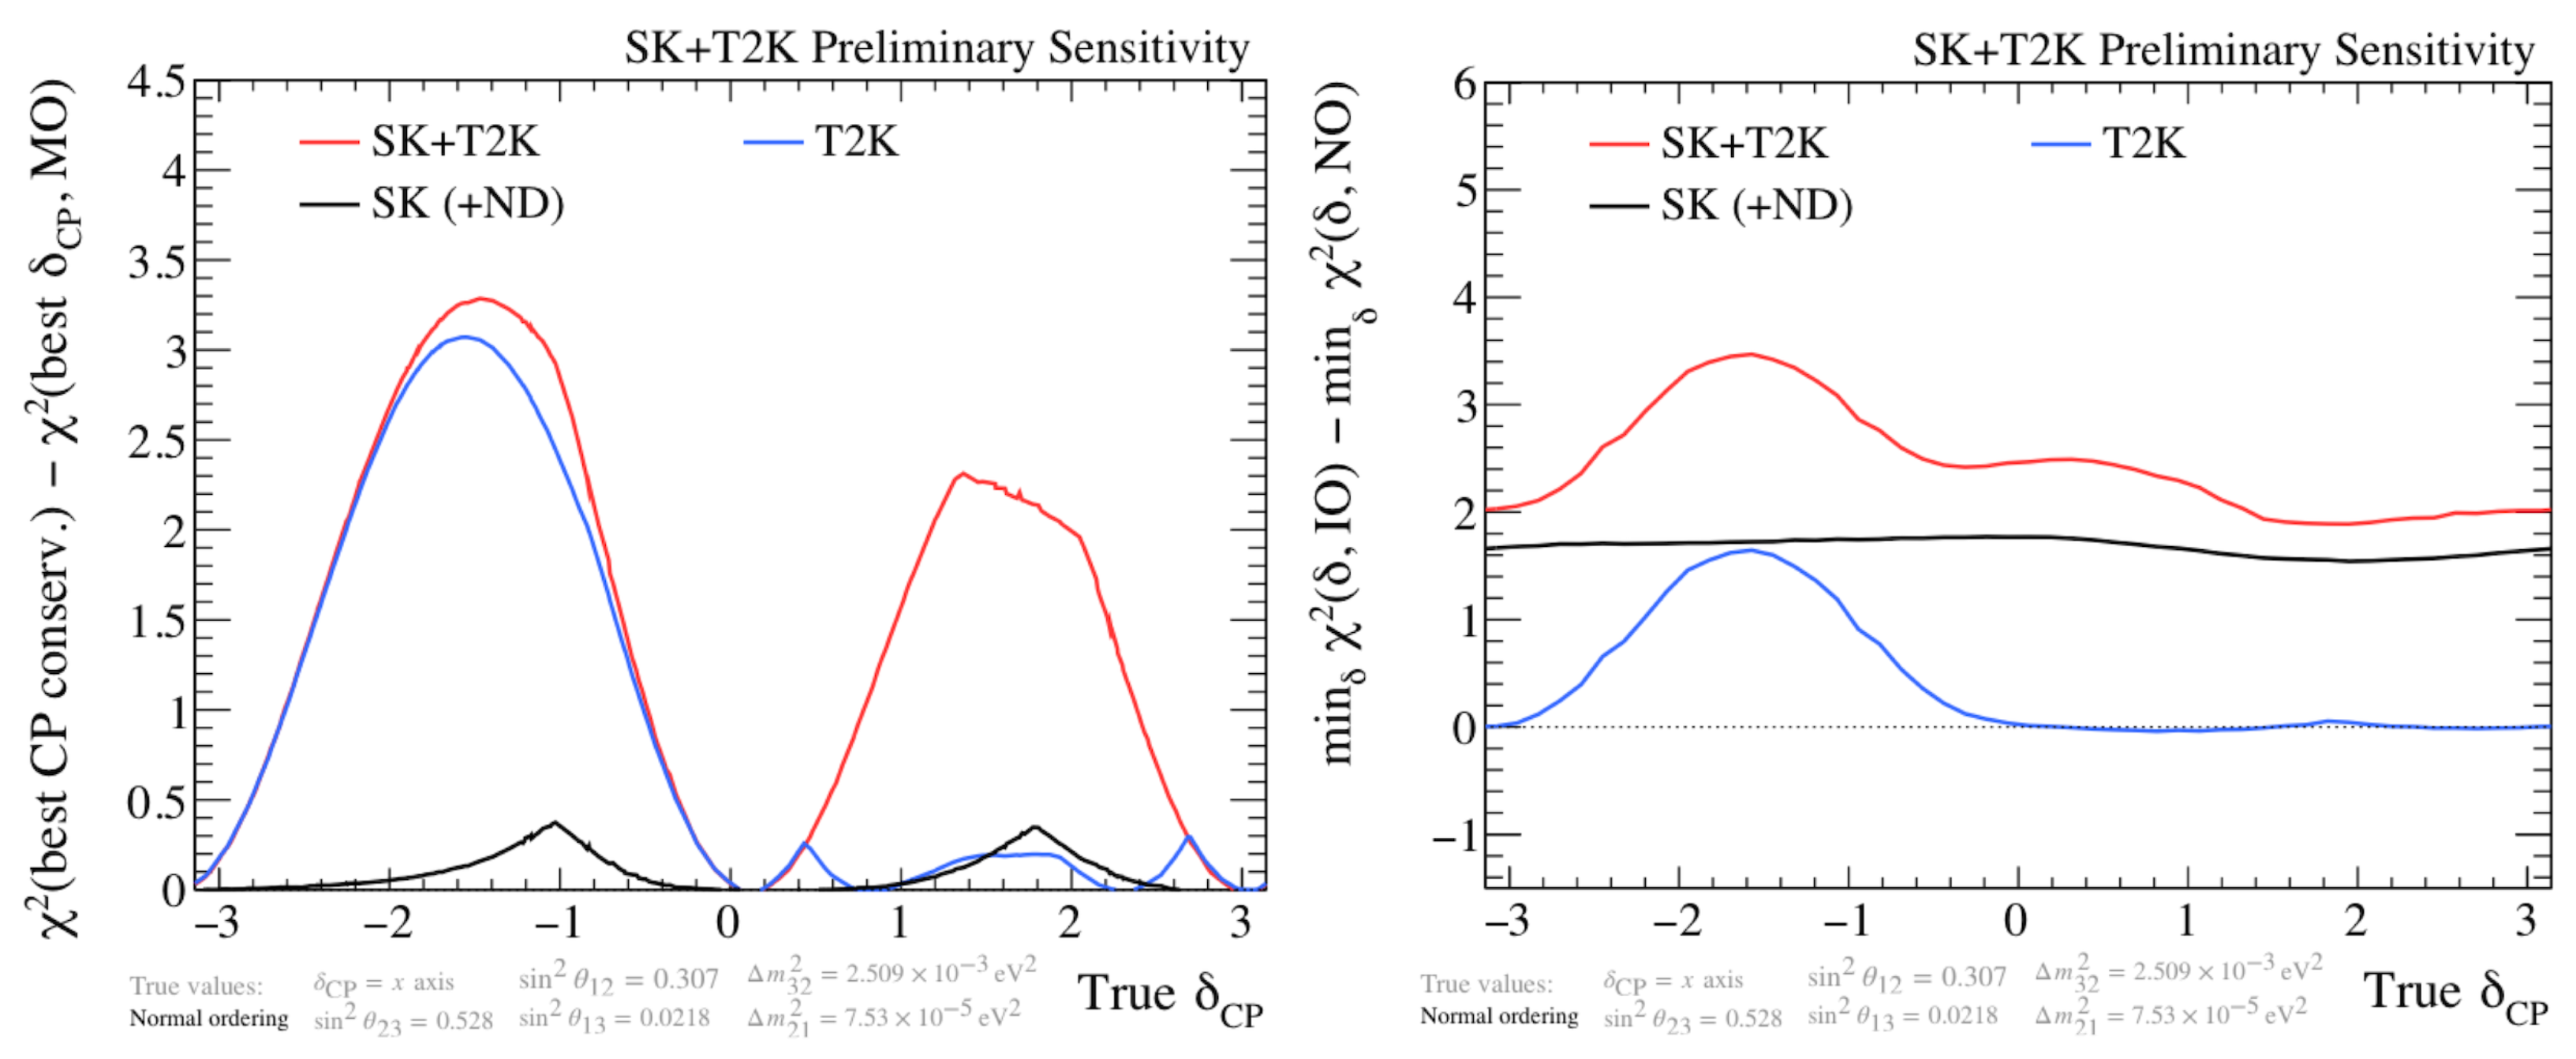
5.1. Joint Fit Analysis of T2K and Atmospheric Neutrinos at SK
One of the physics motivations of this joint fit program is synergy giving additional constraints. The sensitivity of SK to the mass ordering is limited by the uncertainty in
and
, both of which can be constrained by T2K measurements. In addition, this joint fit will break degeneracy, in particular
, mass ordering, and the
octant. These prospects have been confirmed by the sensitivity studies shown in
Figure 5.
5.2. Joint Fit Analysis of T2K and NOA Experiments
T2K and NOA experiments have different impacts on and matter effects. The CP effect is high in T2K, the matter effect is high in NOA. The difference will provide a synergy to break the degeneracy between mass ordering and as well as increase the sensitivity with a unified statistical treatment of T2K and NOA data. This program is also a work in progress and well on its way to performing a combined analysis with data.
5.3. SK+Gd Analysis
The Gd loading started in 2020. The Gd concentration reached 0.03% in July 2022, which increases the fraction of neutron capture to 75%. Neutron tagging with Gd has a variety of potentials such as reducing the background to Diffuse Supernova Neutrino Background (DSNB) search and proton decay. Furthermore, it also will open a road for separation for the T2K beam.
6. Conclusions
The latest results from the T2K oscillation analyses exhibit a variety of improvements this year. Adding the CC1 sample is a major analysis update. This new sample is sensitive to the and parameters and the effects on oscillation contours are visible. The T2K joint fit program of atmospheric neutrinos and beam neutrinos is underway. Sensitivity studies show that it will have a significant impact on breaking the -mass ordering degeneracy, rejecting a wrong mass ordering, and breaking the octant degeneracy. The T2K-NOA joint fit analysis, which will have the power to break the degeneracy between and mass ordering, is also underway. Neutron tagging with Gd will pave the way to reducing the backgrounds in DSNB search and proton decay.


