1. Introduction
The T2K Experiment [
1] is a long baseline neutrino experiment located in Japan. A beam of muon neutrinos is produced in the Japan Proton Accelerator Research Center (J-PARC), in which protons are accelerated up to 30 GeV and directed against a graphite target. A complex of two detectors is placed 280 m away from the target, an on-axis detector (INGRID) and an off-axis detector (ND280). A far detector (Super-Kamiokande) is located in Kamioka, 295 km away from the J-PARC site. Thanks to the joint work of the mentioned detectors, neutrino oscillation parameters are investigated by looking at muon (anti-)neutrinos survival and disappearance rates.
In the last decade, the T2K Experiment has been focused on the estimation of the
parameter of the PMNS matrix, which may introduce a Charge-Parity violation component in the Leptonic Sector of the Standard Model. CP symmetry violation corresponds to a difference in behavior between neutrinos and antineutrinos, which is expected to be observed in the T2K Experiment by comparing interactions obtained with neutrino or antineutrino beams. Therefore, the presence and the performances of a magnetized Near Detector (ND280) are a fundamental tool in T2K design to distinguish between negatively charged leptons produced by neutrino interactions and positively charged leptons produced by anti-neutrinos. This plays an important role in particular in anti-neutrino mode, in which about 30% of total interactions at ND280 are caused by neutrinos [
2].
Starting from Fall 2022, T2K is entering its Phase II, which consists in a series of upgrades aimed to increase the luminosity of the proton beam [
3] and to decrease the overall systematic uncertainties of ND280 up to 4–5% [
2].
The new ND280 configuration will include a new tracker, in which the actual Pi-zero Detector (P0D) is replaced with a segmented detector made of 2 million cubes of plastic scintillators with a 1 cm side, two High Angle Time Projection Chambers (HA-TPC) and a Time of Flight detector (ToF). The new sub-detectors will increase the angular acceptance of ND280 and will enhance the reconstruction of the hadronic products of neutrino interactions.
The presence of a Magnetic Field is also crucial for the momentum estimation of the charged tracks produced in neutrino interactions, with a relative uncertainty better than 10% at 1 GeV/c, which corresponds to a spatial resolution of O (800 µm) in HA-TPCs.
High Angle TPCs
HA-TPCs detectors introduce innovative structural design and readout technology. HA-TPCs are composed by two light-weight wall Field Cages with a common cathode. Field Cages significantly reduce the dead volume around the detector and present a reduced radiation length, both fundamental requirements to study particles at low momenta. HA-TPCs are read out by 8 Encapsulated Resistive Anode Micromegas (ERAM) sensors per each one of the two anodes. The new resistive Micromegas exploit a different technology with respect to the bulk Micromegas adopted for vertical TPCs, with the introduction of a new resistive layer to spread the charge carried by drifting electrons on a wider area, achieving a better spatial resolution.
This paper highlights the efforts made in order to introduce a procedure to validate the sensor performances and a new modeling of ERAM response.
In particular, a test bench has been set up in order to characterize ERAM properties, such as the gain uniformity and RC values of the readout plane. Furthermore, several prototypes of HA-TPCs have been tested at test beams since 2018 [
4,
5].
2. Materials and Methods
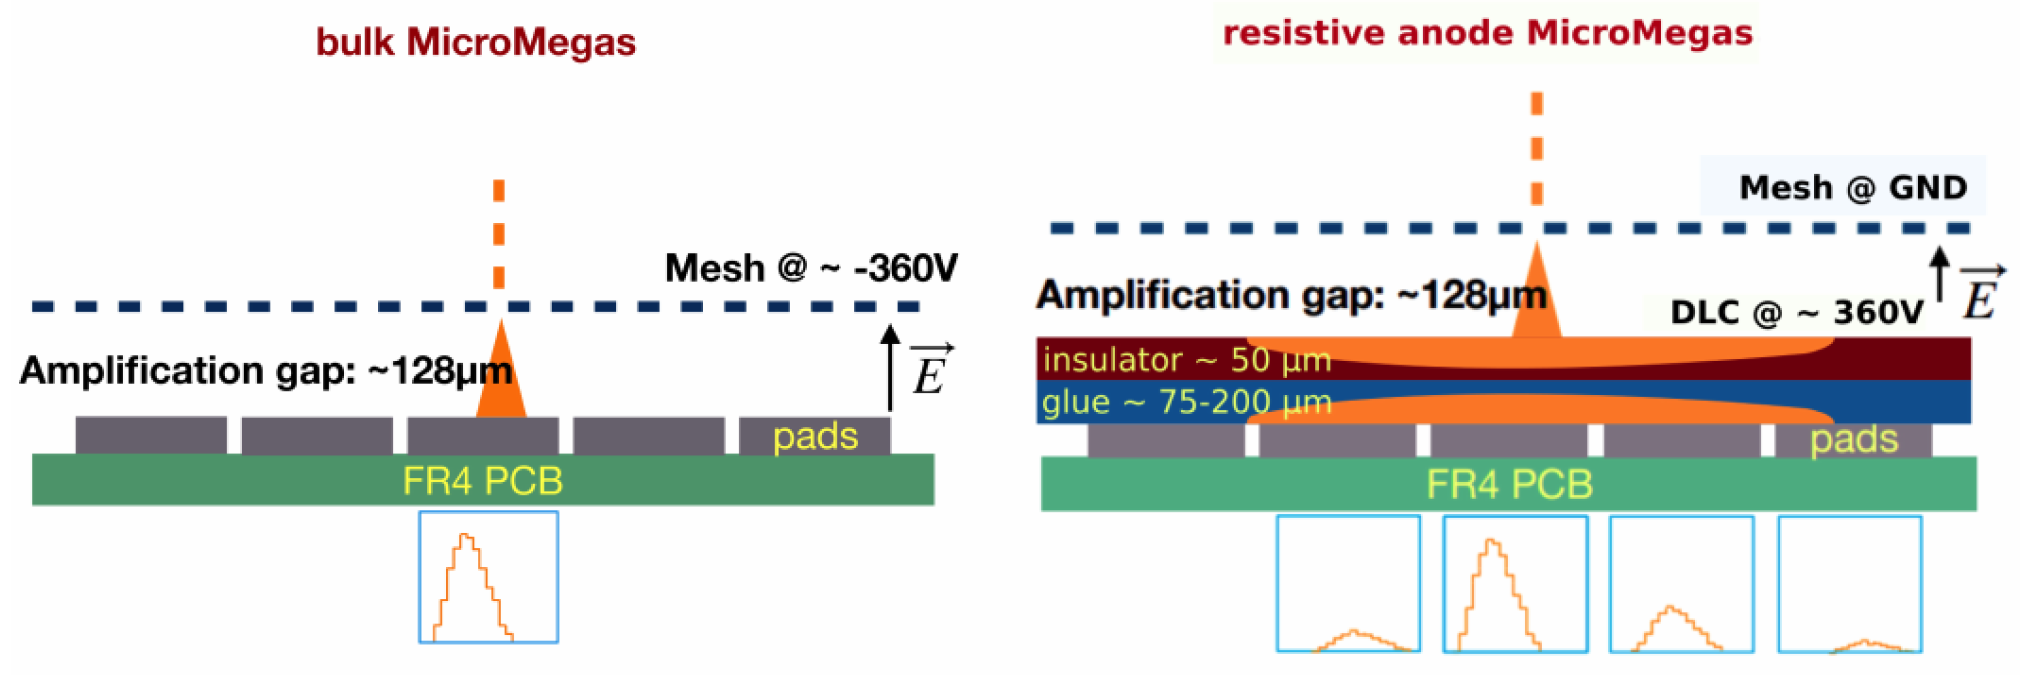
ERAM sensor is a 128 µm amplification gap bulk-Micromegas using the standard SD45/18 304L woven micromesh built on top of a resistive anode PCB. A schematic view of ERAM sensors is displayed in
Figure 1. The amplification gap is delimited by the woven micromesh and a thin layer of resistive material called Diamond-Like Carbon (DLC), with a nominal value of surface resistivity equal to 400 k
/□. In this region, electrons ionized in the TPC active volume by traversing particles are multiplied due to the formation of avalanche for the intense electric field. After the multiplication, electrons spread on the DLC. The layer is glued on top of an insulating material 50 µm thick. The charge collection is performed thanks to a grid of 36 × 32 rectangular pads of size 11.18 × 10.09 mm
each. They collect the charge induced by the spreading on the DLC of electrons from ionization.
A 3D track reconstruction is achieved by combining the timing information with respect to the trigger signal and the position information given by the segmented anode plane.
The characterization of ERAM sensors aims to investigate the uniformity of gain and RC properties on the whole anode plane, thanks to two main procedures: mesh pulsing and X-ray scan. Both tests are performed at CERN.
Mesh pulsing is used to spot defects affecting electrical signals. The ERAM sensor is put into a Faraday cage and grounded to reduce electrical noise and a 10 mV step function signal is injected on the resistive plane in which no high voltage is applied. After this procedure, the sensor is glued to its mechanical support.
The X-ray test bench setup consists of a chamber with a drift length of 3 cm readout by one ERAM sensor. The other end of the chamber is closed by a thin aluminum foil, in order to allow the entrance of X-rays from a Fe source. The source has an activity of 250 MBq and it is collimated thanks to an optical breadboard held by a robotic arm in which a 1.5 mm circular hole is opened. The arm can move the source in order to irradiate one pad each time in the ERAM sensor at a fixed distance. Each channel is scanned for 3 min at a rate of 100 Hz.
X-ray data allow us to build a channel-wise gain map, which comprises both the amplification and the readout contributions. Additionally, an investigation on RC uniformity has been performed, in order to detect local inhomogeneities on RC values.
3. Characterization with Test Beam at DESY Facility
ERAM sensors for HA-TPC have been tested during five test beams campaigns since 2018 [
4,
5]. In the 2019 DESY test beam, the version with final dimensions and number of pads was tested, while in 2021 (at DESY in July and at CERN in November), the final Front End Electronics (FEE) were introduced and tested. Additionally, the final value of DLC resistivity and the thickness of the insulating layer shown in
Figure 1 were fixed.
In the 2019 test beam at DESY, a short chamber with a 15 cm drift distance has been used. For the 2021 test beam at DESY, a 1 m long field cage with the same design of the final one was used to provide structural support and a uniform electric field along drift direction.
Test Beam Data Analysis
The estimation of the spatial resolution in the track reconstruction and of the energy loss per unit of length (dE/dx) is a crucial task for the HA-TPC. An analysis method for both of them has been developed since the DESY 2019 test beam. A scanning algorithm (DBSCAN) is used to find different tracks in the same event. Then, pads that collect a charge deriving from the same track are grouped in clusters, with a pattern depending on the angle of the track projection on the anode plane.
In the spatial resolution analysis, the maximum of the waveform is taken as an estimator for the charge Q collected by a pad. Then, the track position estimation is performed thanks to a “Pad Response Function” (PRF). The estimated parameters of the PRF analytical function are used further in the
minimization procedure to estimate the track position in each cluster. The detailed description of the procedure is reported in [
5].
In the deposited energy estimation analysis, for each cluster the sum of the waveforms for every pad is performed at each time WF(t). The maximum of WF(t) is taken as an estimator for charge collected in a single cluster. Charge maxima are sorted and a truncated mean is performed, in order to discard highly energetic -ray deposits and fluctuations on energy loss.
4. ERAM Sensor Simulation
A simulation of an ERAM sensor has been developed and a first comparison with data from the DESY 2019 and 2021 test beams has been performed.
Tracks’ interaction in the active volume is simulated with GEANT4. Electrons from ionization will drift towards the anode plane taking into account longitudinal and transverse diffusion. The spreading of charge in resistive DLC is described by solving the 2D Telegrapher’s equation, which gives the density of charge as a function of time:
in which
is the distance with respect to the spreading starting point
on the anode plane
. The spreading is given by a 2D Gaussian with a sigma
.
The signal waveform for a single electron in a shower for the i-th pad is given by the convolution of the charge collected by a single pad Q and the derivative of the electronics model response . Since the computation of ERAM response for each single electron is very demanding, approximations are introduced. (1) Each pad is divided into a grid of 10 × 10 (granularity can be tuned) and showers inside a subregion are considered as one and the response for the total charge is computed. (2) Charge Q(t) is pre-computed and tabulated for a single electron, with a given RC and for each center of the subpads. (3) At the moment, RC value is considered to be uniform on the whole anode plane.
5. Results
5.1. Mesh Pulsing ERAM Characterization
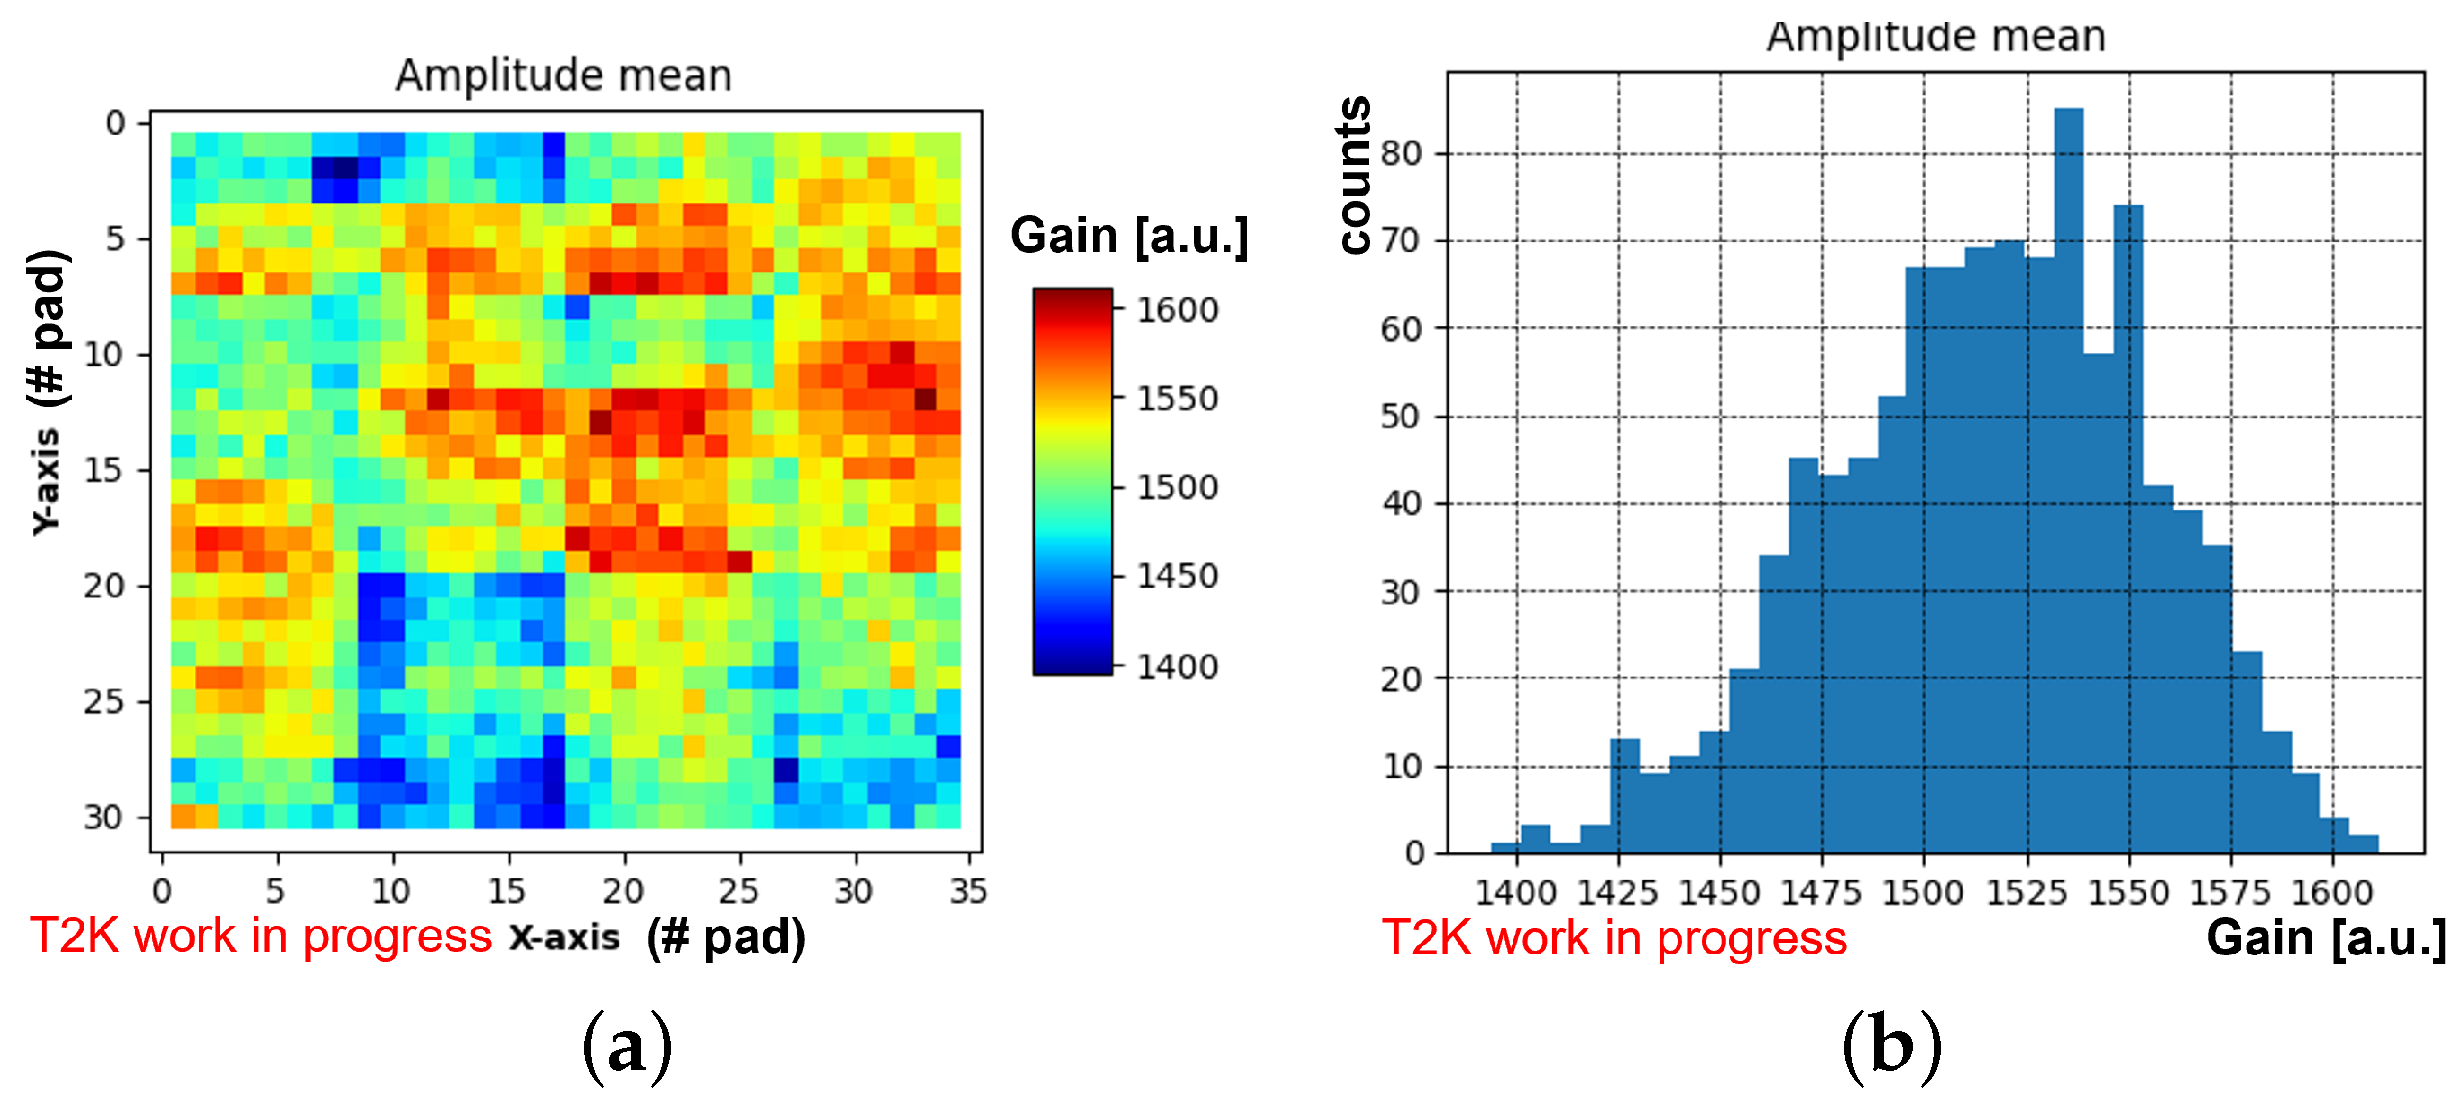
A histogram of the mean amplitude of the signal detected by all pads when pulsing the ERAM mesh is used to spot unexpected gain trends in the detector.
In
Figure 2, the results from ERAM 11 are shown. The relative deviation from the mean ERAM response in
Figure 2a is better than 15% for each pad. Local changes in response are visible and these inhomogeneities are dominated by the electronics response. Thanks to this procedure, a structural defect in ERAM 20 has been individuated and solved.
5.2. X-ray Test Bench
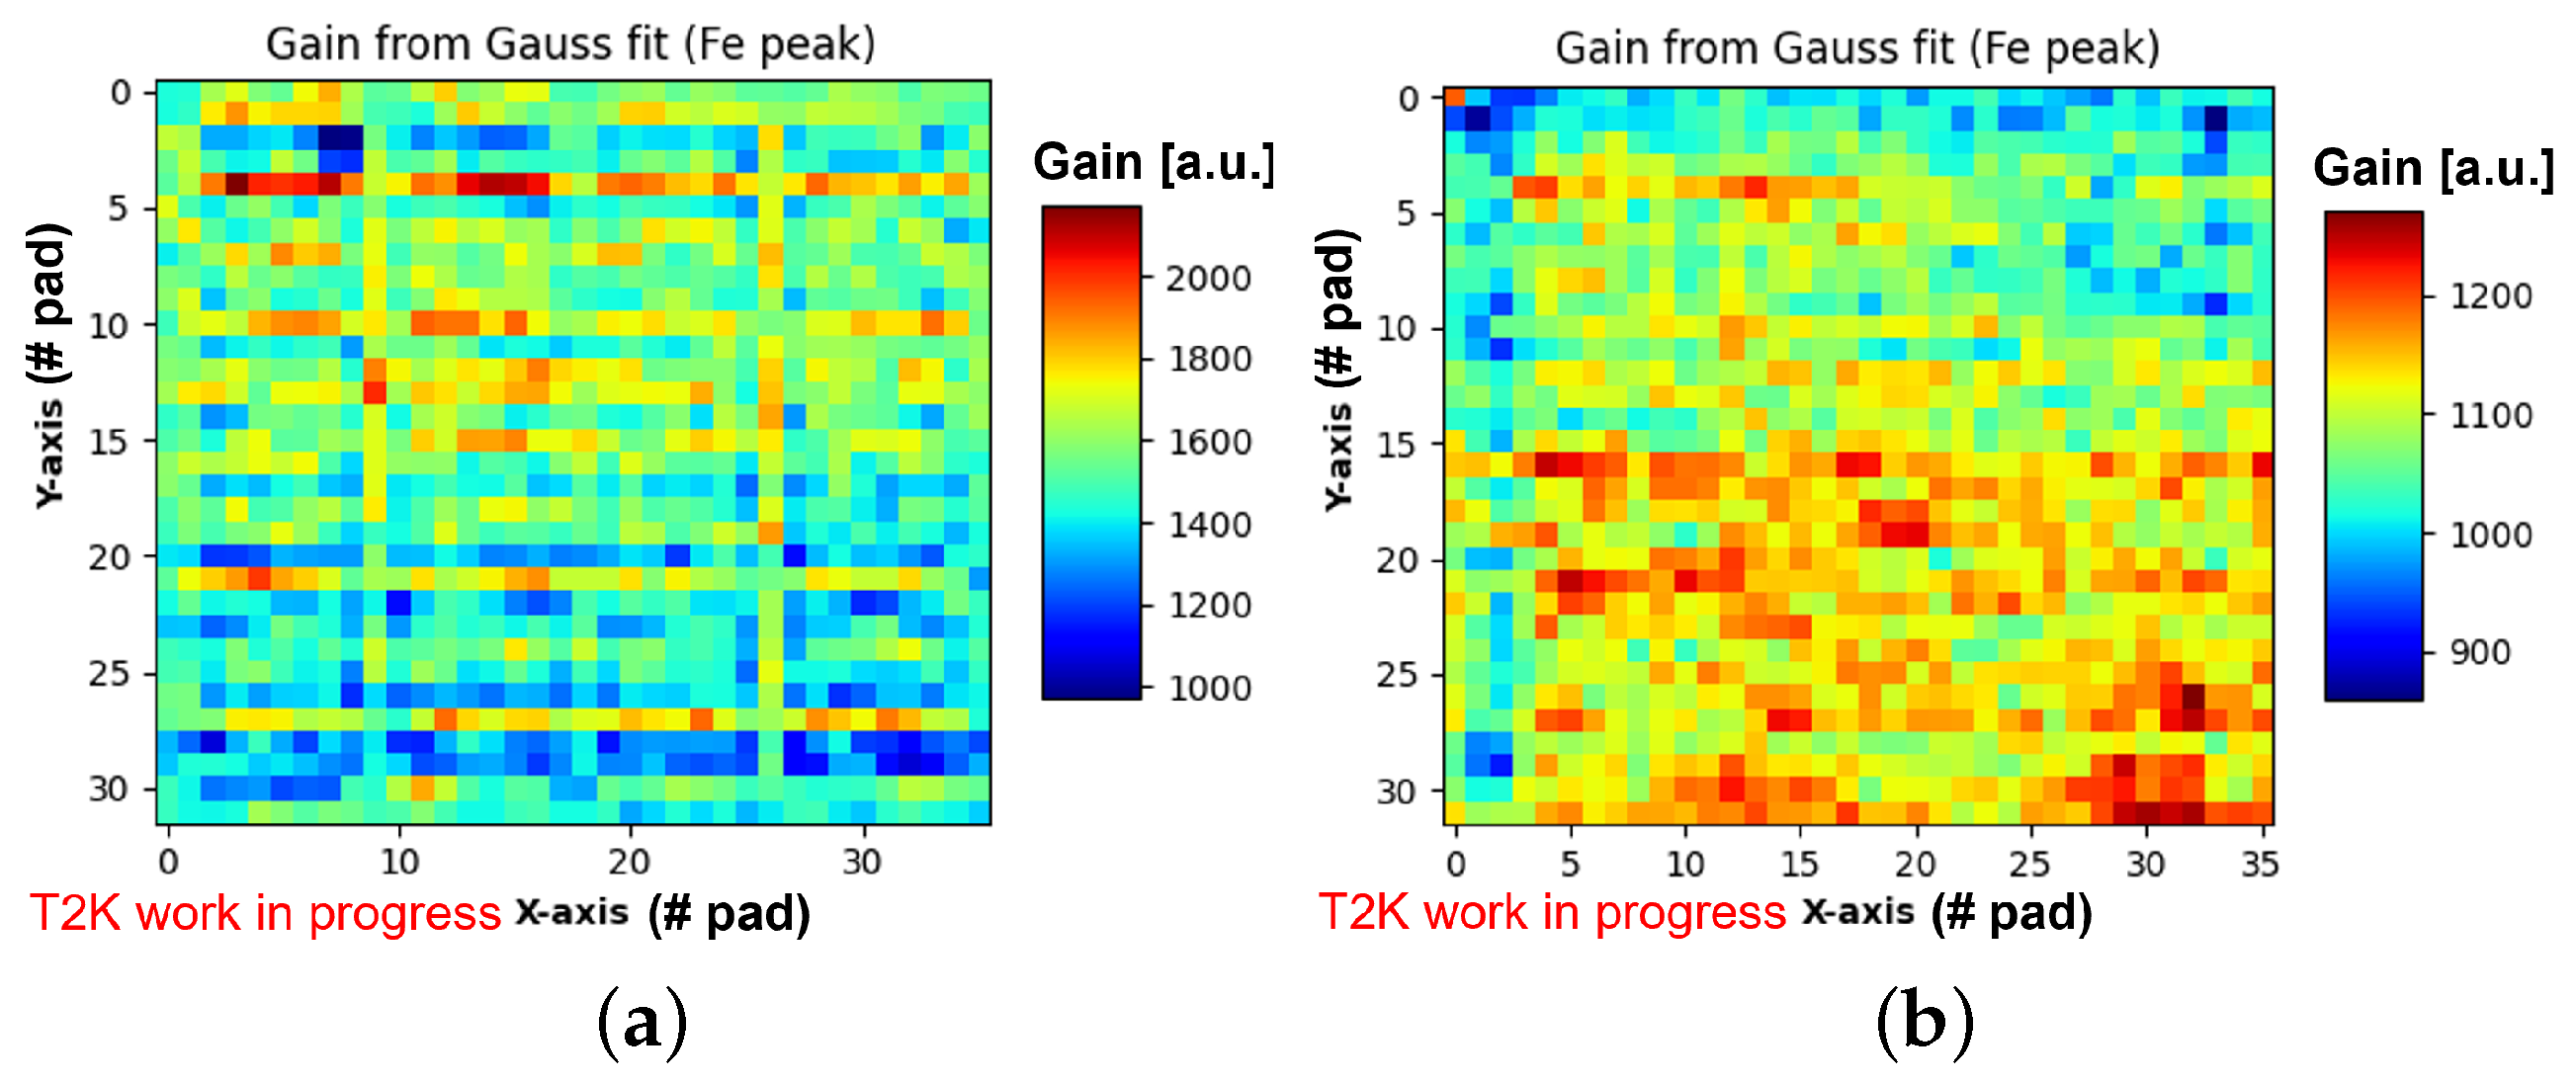
A full characterization has already been completed for 14 ERAM sensors. Up to ERAM 16, pads below mechanic ribs of the aluminum stiffener show an increased gain, due to either gluing process or PCB not uniformity. A local modification of the amplification gap width may introduce a large change in gain as shown in
Figure 3.
Therefore, PCB design has been modified and soldermasks on the back were removed. X-ray scans on the following ERAM sensors show a more uniform gain thanks to a more uniform PCB. In particular, ERAM 23 shows a clear improvement with respect to previous detectors, hinting that the modification of the PCB design and gluing procedure introduced have been successful.
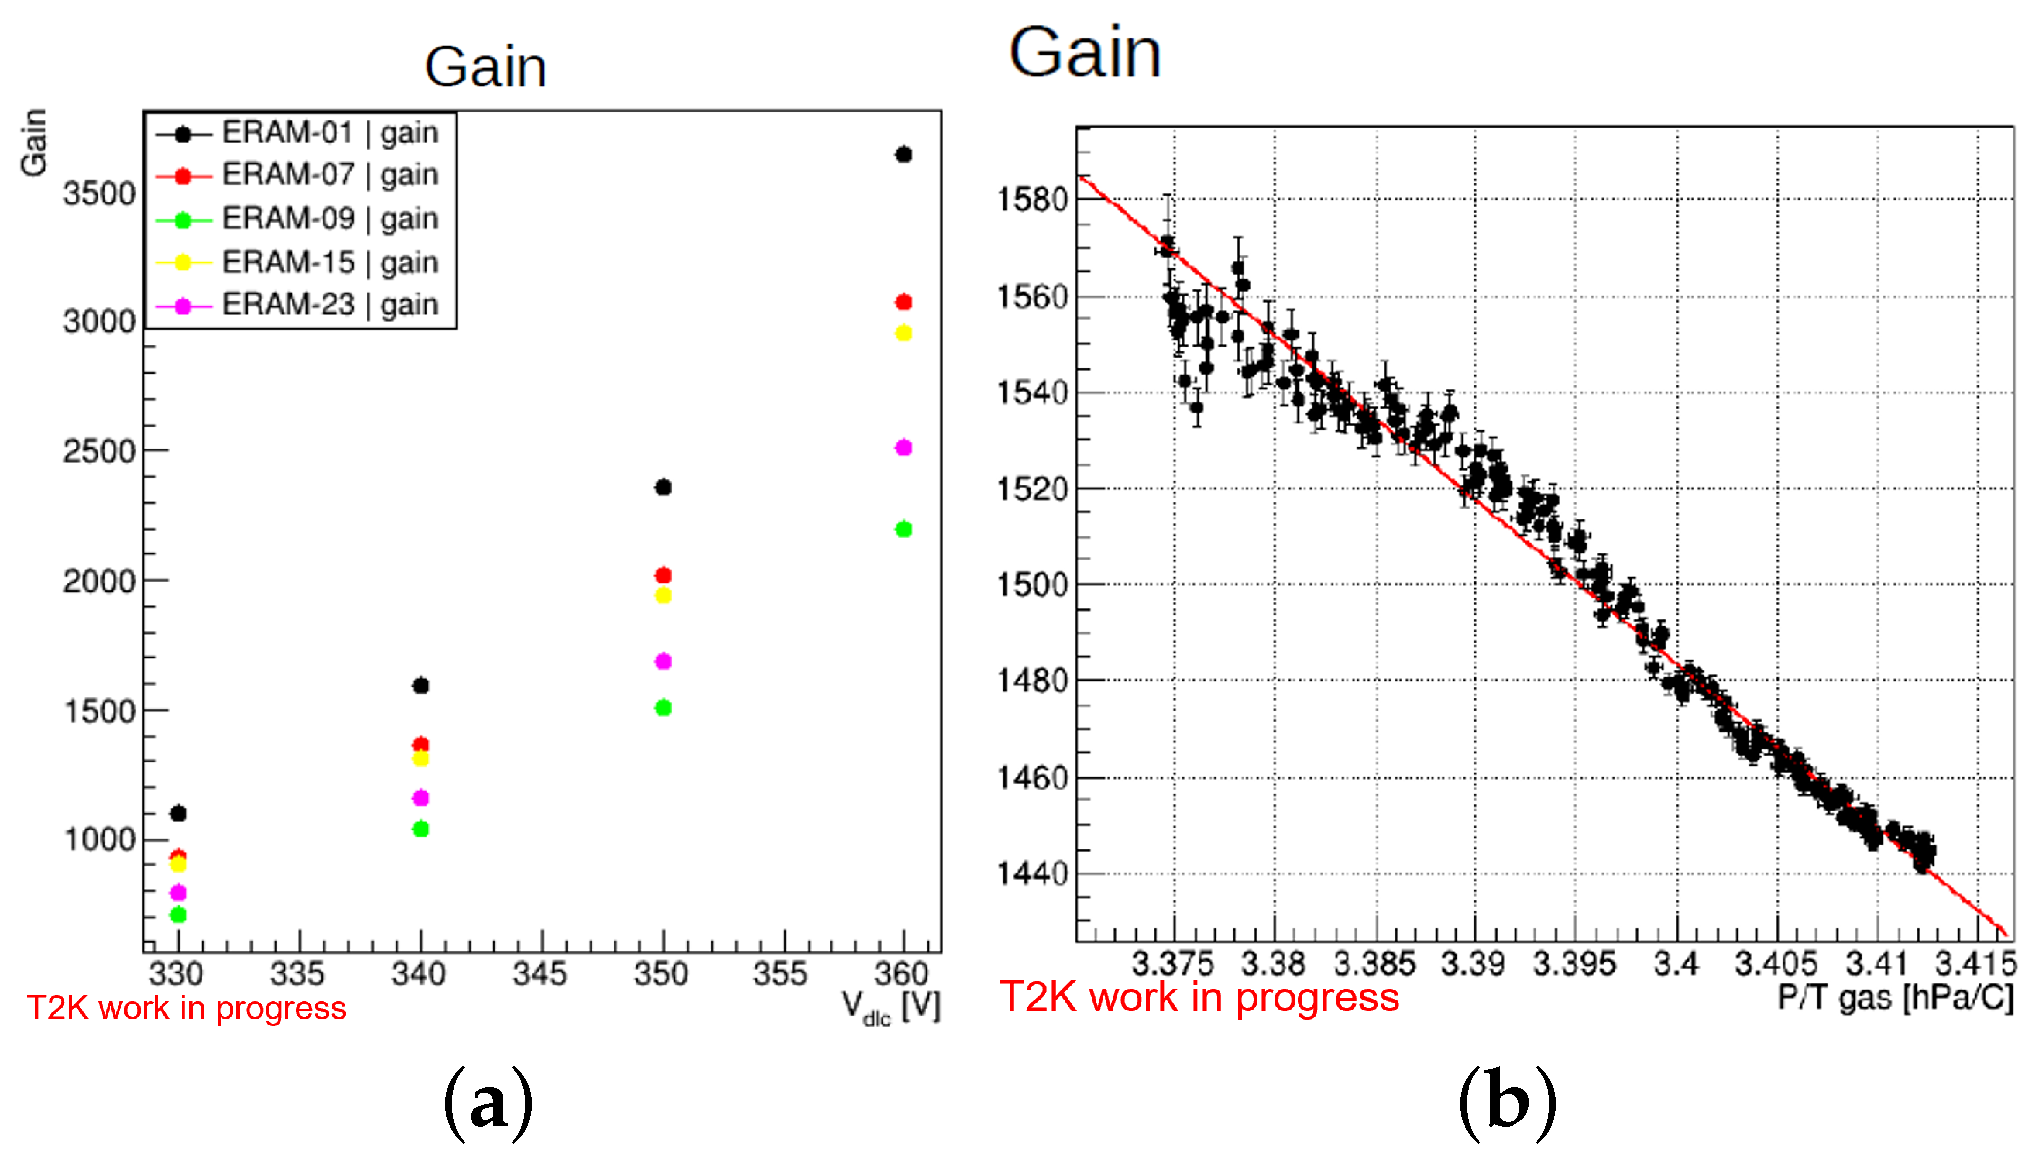
The gain estimated for each ERAM sensor might depend both on the detector setup and on gas pressure and temperature. A study on gain dependence on electric field intensity in the amplification gap is reported. Direct comparison between ERAM response should take into account the variation of gas pressure and temperature.
Voltage applied to DLC V
reported in
Figure 4a changes the gain accordingly for each ERAM, showing that a more intense electric field may enhance the gain. The working value is chosen as a trade off between gain and stability. In the case of
Figure 4b, the ratio of pressure and temperature (p/T) is shown for the “T2K gas”. Under the approximation of constant volume of the setup, this may suggest that a higher number density of the gas decreases the gain of the detector according to a linear trend. Since a full X-ray scan for a single ERAM is performed in a span of few days, the effect of gas conditions on gain is being investigated further in order to take into account this effect when comparing the pads response.
5.3. Simulation Results
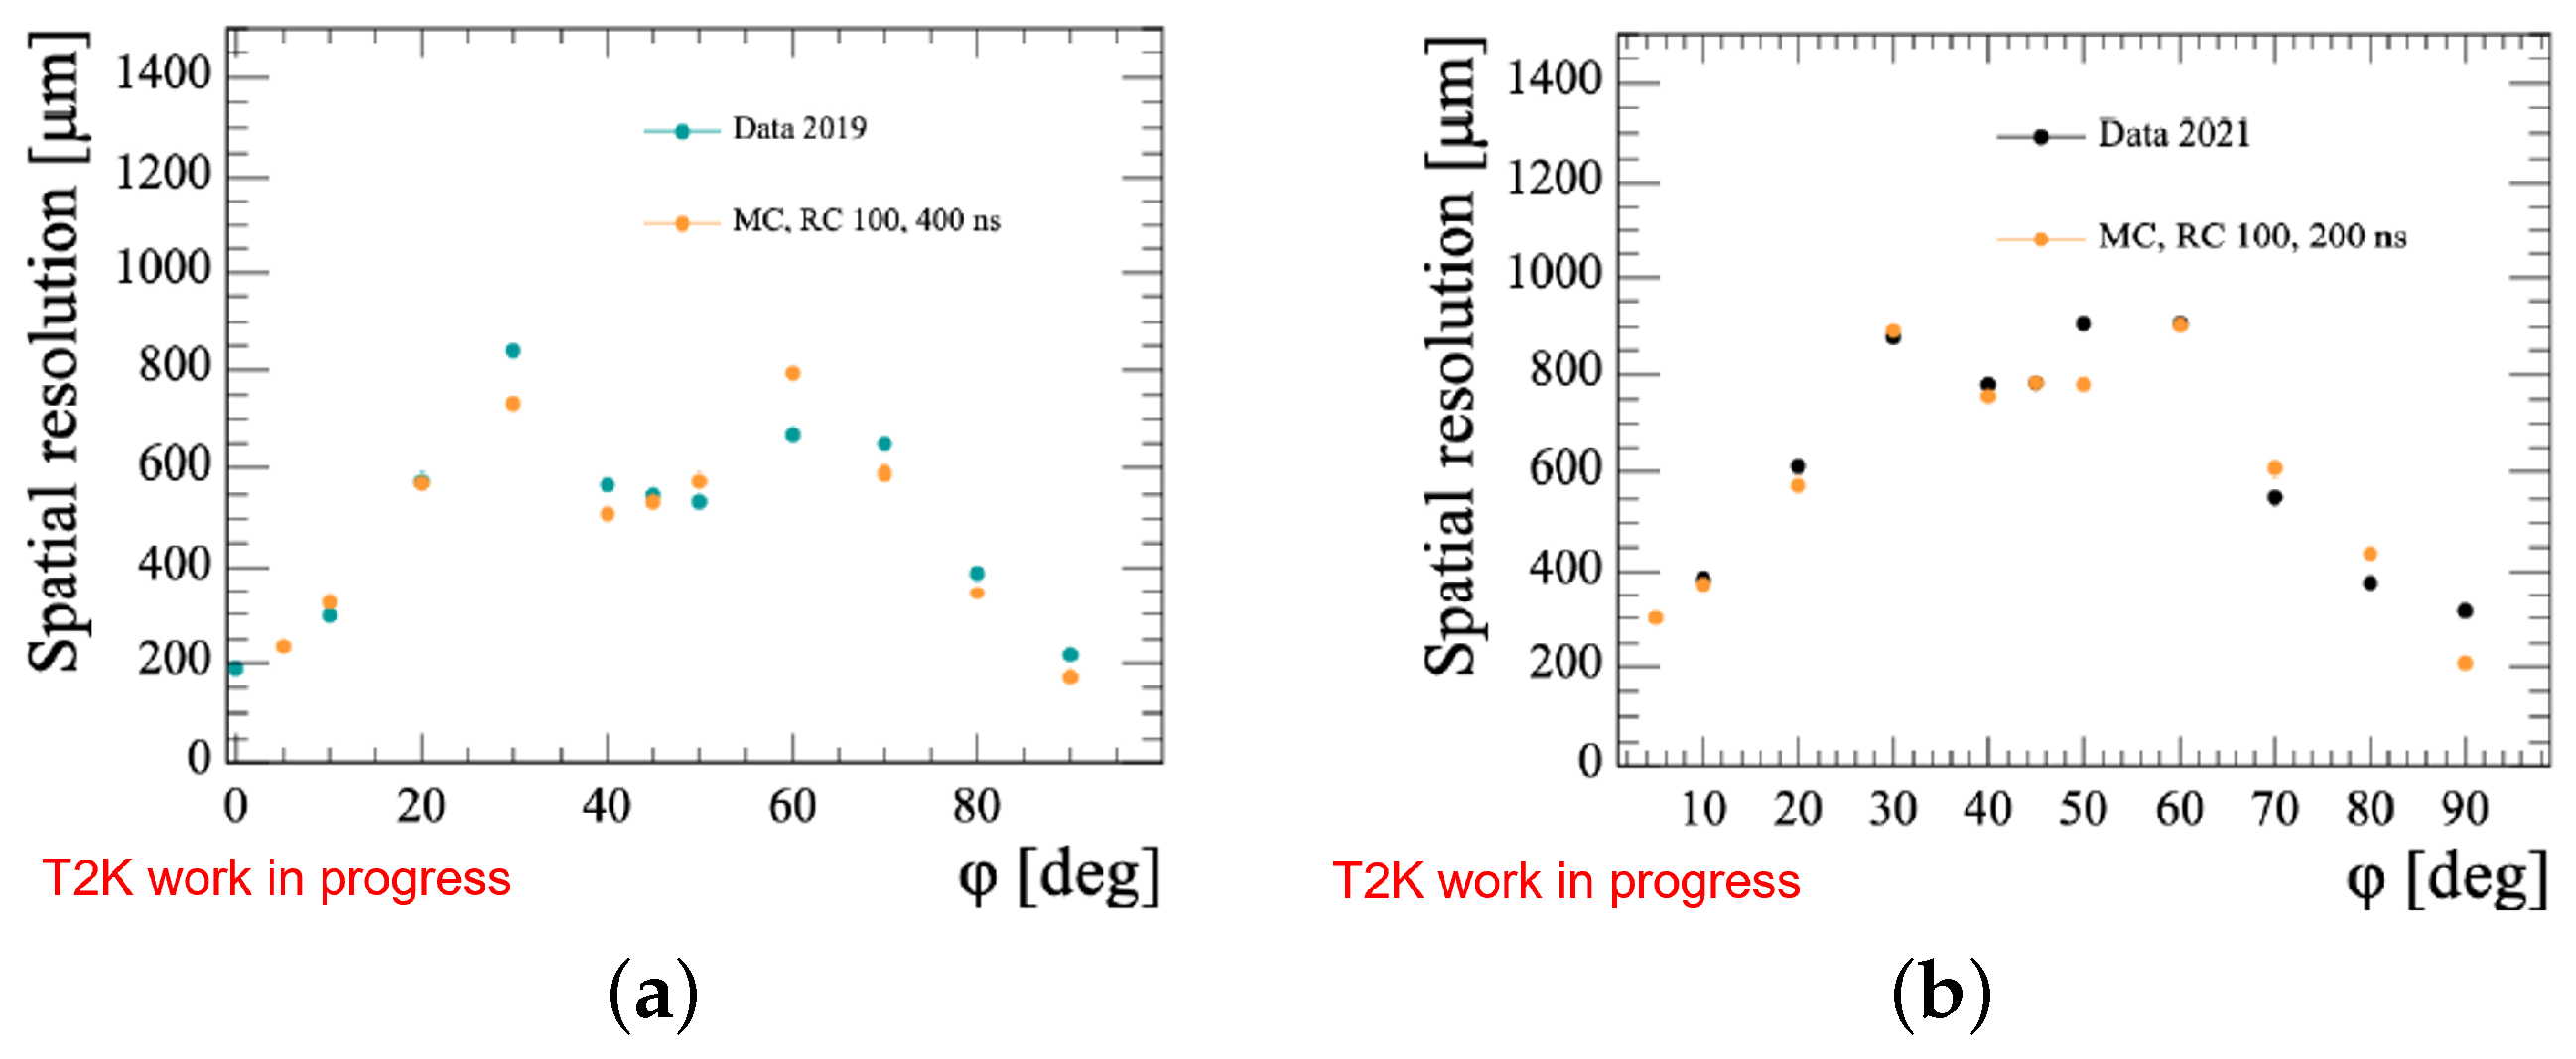
The detector performances have been studied for tracks traversing the active volume in different position, inclination and energy. Results from DESY 2019 and preliminary results from DESY 2021 test beams show that the detector prototypes are satisfying the required performances.
The spatial resolution is well below 800 µm for most of the track inclination and drift distance, which corresponds to a
at 1 GeV/c. However, the angle
of the track projection onto the anode plane plays an important role in spatial resolution estimation. The clusters shape changes if the angle is close to
= 0°, 30°, 45°, 90° in order to group the rectangular pads in an optimal way if the track is not perpendicular to the pads side. The critical configuration is reached at around 45°, in which the detector response is comparable with required resolution as shown in
Figure 5.
ERAM response simulation has been compared with data from DESY 2019 and 2021 for tracks at several drift length and
angle. Preliminary results from Monte Carlo simulations show a similar trend with respect to data in
Figure 5. Furthermore, a comparison of resolution obtained with different RC values indicates that a change in this parameter may not affect in a critical way the ERAM response resolution.
The analysis presented covers only a small part of the whole study performed, which will be reported in a future paper.


