1. Introduction
KM3NeT (Cubic Kilometre Neutrino Telescope) [
1] is a piece of research infrastructure currently under construction at two sites on the Mediterranean seabed. It is composed of two neutrino telescopes: ARCA (Astroparticle Research with Cosmics in the Abyss) [
2], situated 100 km offshore from Capo Passero, Sicily, Italy at a depth of about 3500 m; and ORCA (Oscillations Research with Cosmics in the Abyss) [
3], 40 km offshore from Toulon, France at a depth of about 2450 m. The two detectors share the same technology, being based on so-called Digital Optical Modules (DOMs) [
4], and are each arranged in a 3D array. However, the geometry and aims of the two detectors are different. In its completed form, ARCA will cover approximately one cubic kilometre of instrumented volume, and is mainly devoted to neutrino astronomy and search of neutrino astrophysical sources; on the other hand, ORCA will have a final volume of
m
, and is optimized for studying atmospheric neutrinos at the GeV scale.
Upon completion of the construction phase, the KM3NeT/ORCA detector will consist of 115 strings, called Detection Units (DUs), separated from each other by a distance of 20 m. Each of them is equipped with 18 DOMs, each of which in turn hosts 31 PMTs, separated from each other by a distance of 9 m. The detector started receiving data in June 2019 with four DUs, and at the moment comprises eleven lines. As for ARCA, its detection principle consists of exploiting the production of Cherenkov light induced by charged particles produced by the interaction of neutrinos with matter inside of or in the vicinity of the instrumented volume. Cherenkov photons collected by the PMTs allow both the energy and direction of incoming particles to be estimated. In order to ensure that the measurement of these two quantities is reliable, time calibration procedures must be carried out on the channels of each DOM in order to guarantee a level of accuracy in time of about 10 ns. In addition, as sea currents act on the DUs by moving them from their vertical position, calibration procedures on positioning must be performed to provide positional accuracy on the order of 10 cm.
Below,
Section 2 presents the procedures required for the time calibration of the detector and consequent estimation of the efficiency and gain of the PMTs in detail. Next,
Section 3 illustrates the calibration procedures for estimating the dynamic position of the DOMs and the effects that these procedures have on the analysis of the collected data, such as the detection of the so-called
Moon/Sun shadow.
2. Time Calibration
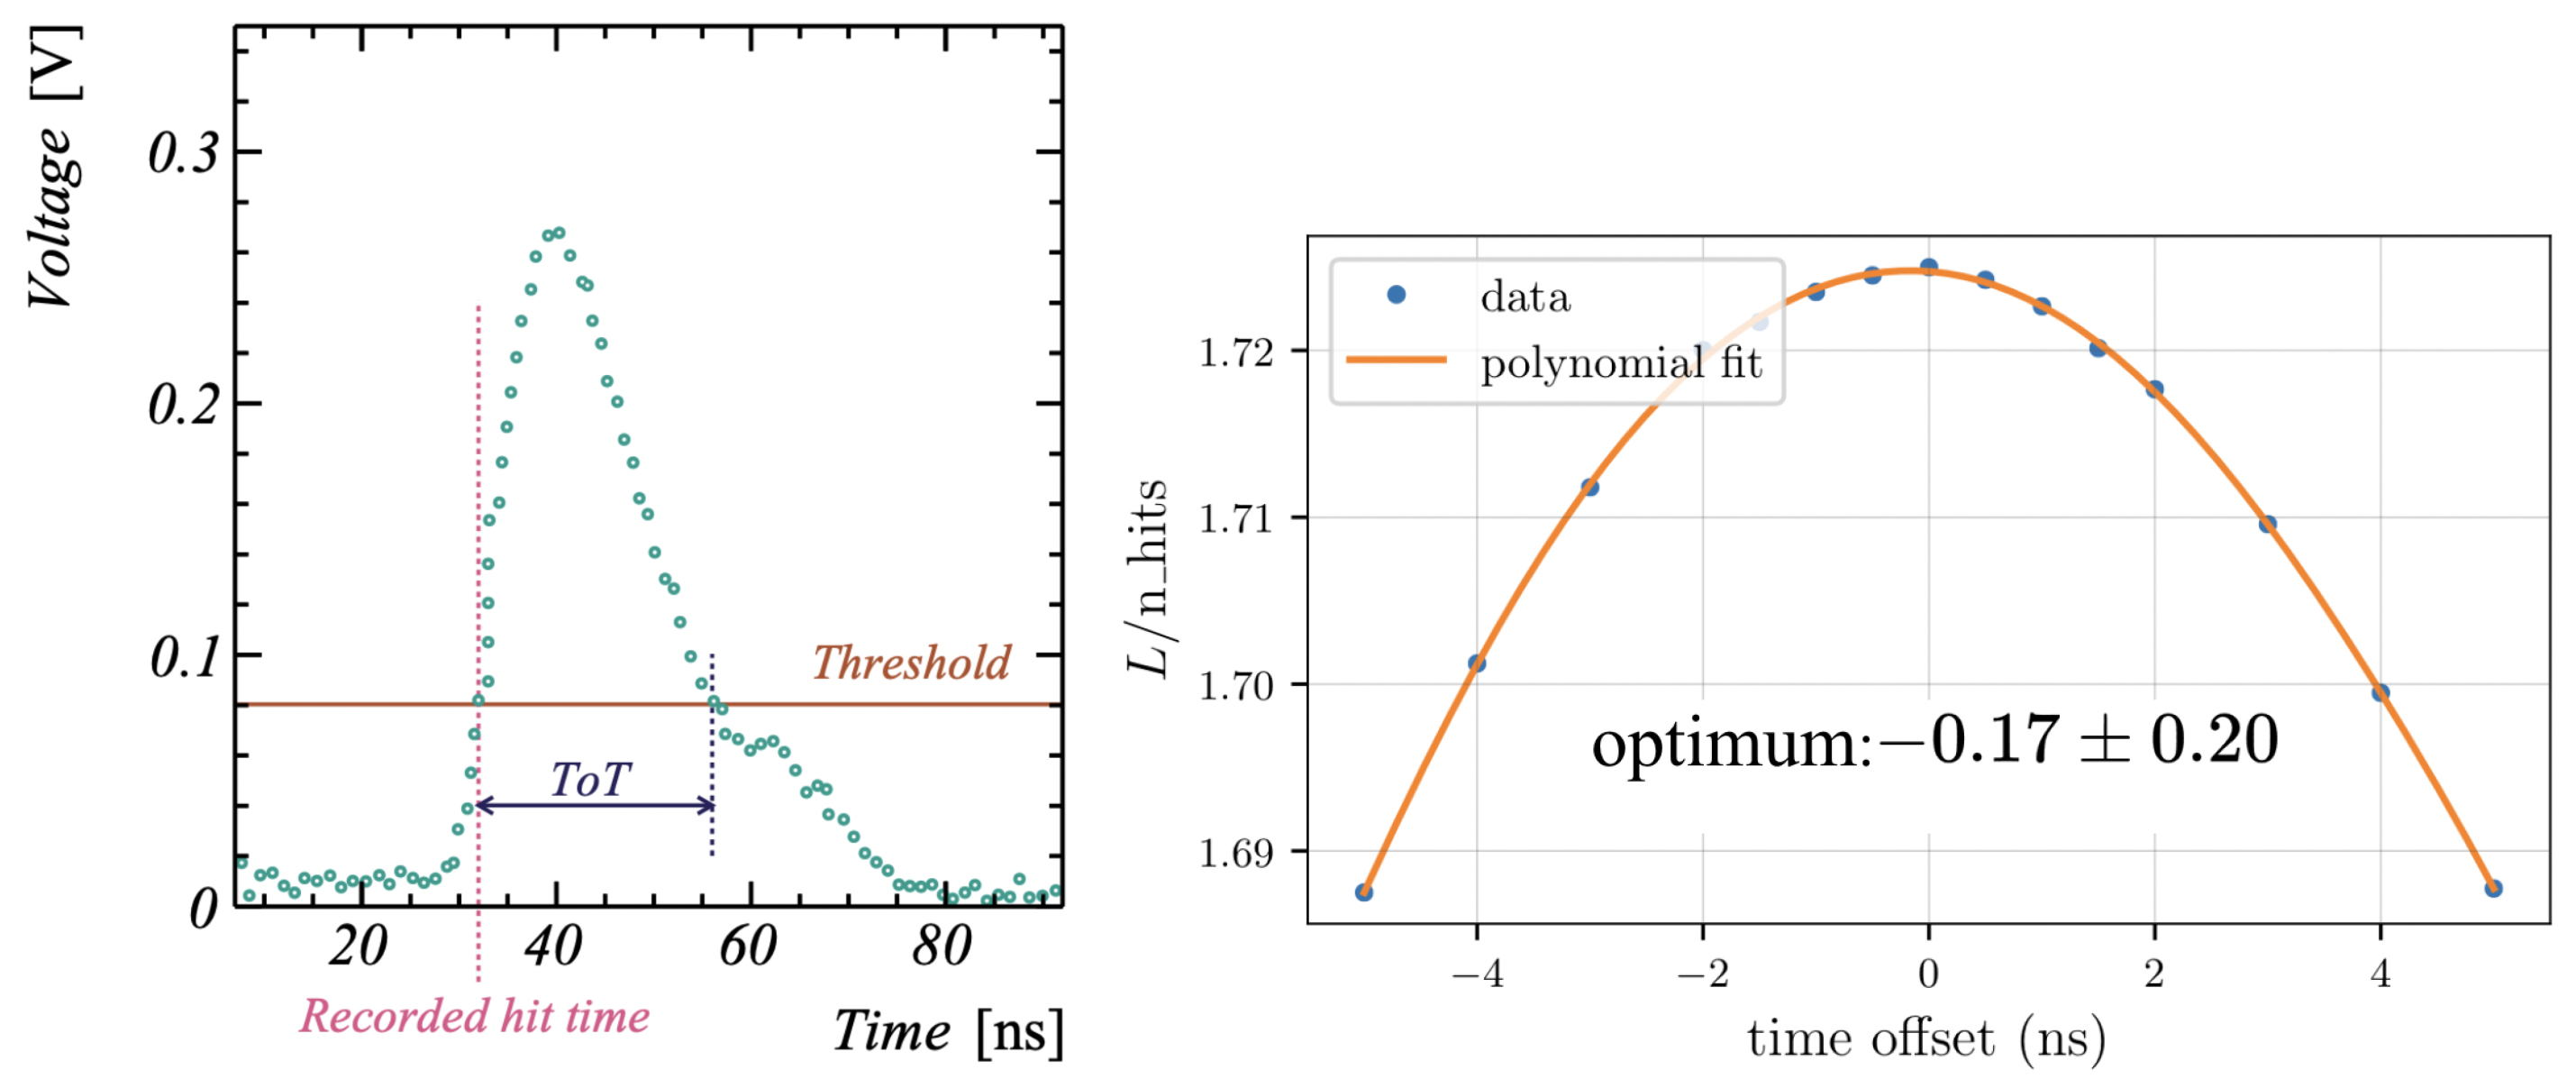
Cherenkov signals recorded by PMTs are characterized by two quantities: the
hit time, i.e., the time at which the PMT waveform passes the threshold (which corresponds to 0.3 photo-electron equivalent); and the
Time-over-Threshold (ToT), i.e., the period during which the recorded signal stays above the threshold (see the left plot of
Figure 1). These are are timestamped on the Central Logic Board (CLB) inside the DOM, then digitized and sent to the shore via electro-optical cable, where the physical events are recorded on disk. For accurate reconstruction of the direction of the detected particles, precise measurements of the time and amplitude of the PMT signals and accurate real-time knowledge of the positions and orientations of the PMTs are required. For distribution of the absolute time from GPS on shore to the nodes, i.e., the DOMs and the electronics modules at the bases of the DUs, a fiber-optic broadcast system is implemented using White Rabbit (WR) technology [
5].
The hit time distributions need to be calibrated in order to achieve the required synchronicity of the optical modules with nanosecond accuracy; therefore, it is necessary to correct the relative time delay due to the PMT transit time and propagation delays between PMTs of the same DOM and to perform an absolute calibration of the DOM’s CLB (the CLB clocks are syntonized, i.e., they change their counters at the same time, but not necessarily synchronized, i.e., the values of the counters do not always coincide). The time calibration consists of three steps, starting from the smallest scale to the largest:
Intra-DOM calibration (synchronisation of PMTs in the same DOM): time delays between pairs of PMTs are calculated by exploiting the Cherenkov radiation from the electrons produced by the K decay in seawater (which has a constant rate).
Inter-DOM calibration (synchronisation of DOMs in the same DU): using an LED at the top of each DOM, which illuminates the DOMs above, it is possible to calculate the time delays between optical modules belonging to the same DU.
Inter-DU calibration (synchronisation of DUs between them): event reconstruction is estimated through a procedure based on the reconstruction of down-going atmospheric muons using different detector geometries (e.g., inter-DU time offsets). This allows the average quality of the likelihood fit (
L) to be evaluated and the optimal value to be determined (see the right plot of
Figure 1).
PMT Efficiency/Gain Evaluation
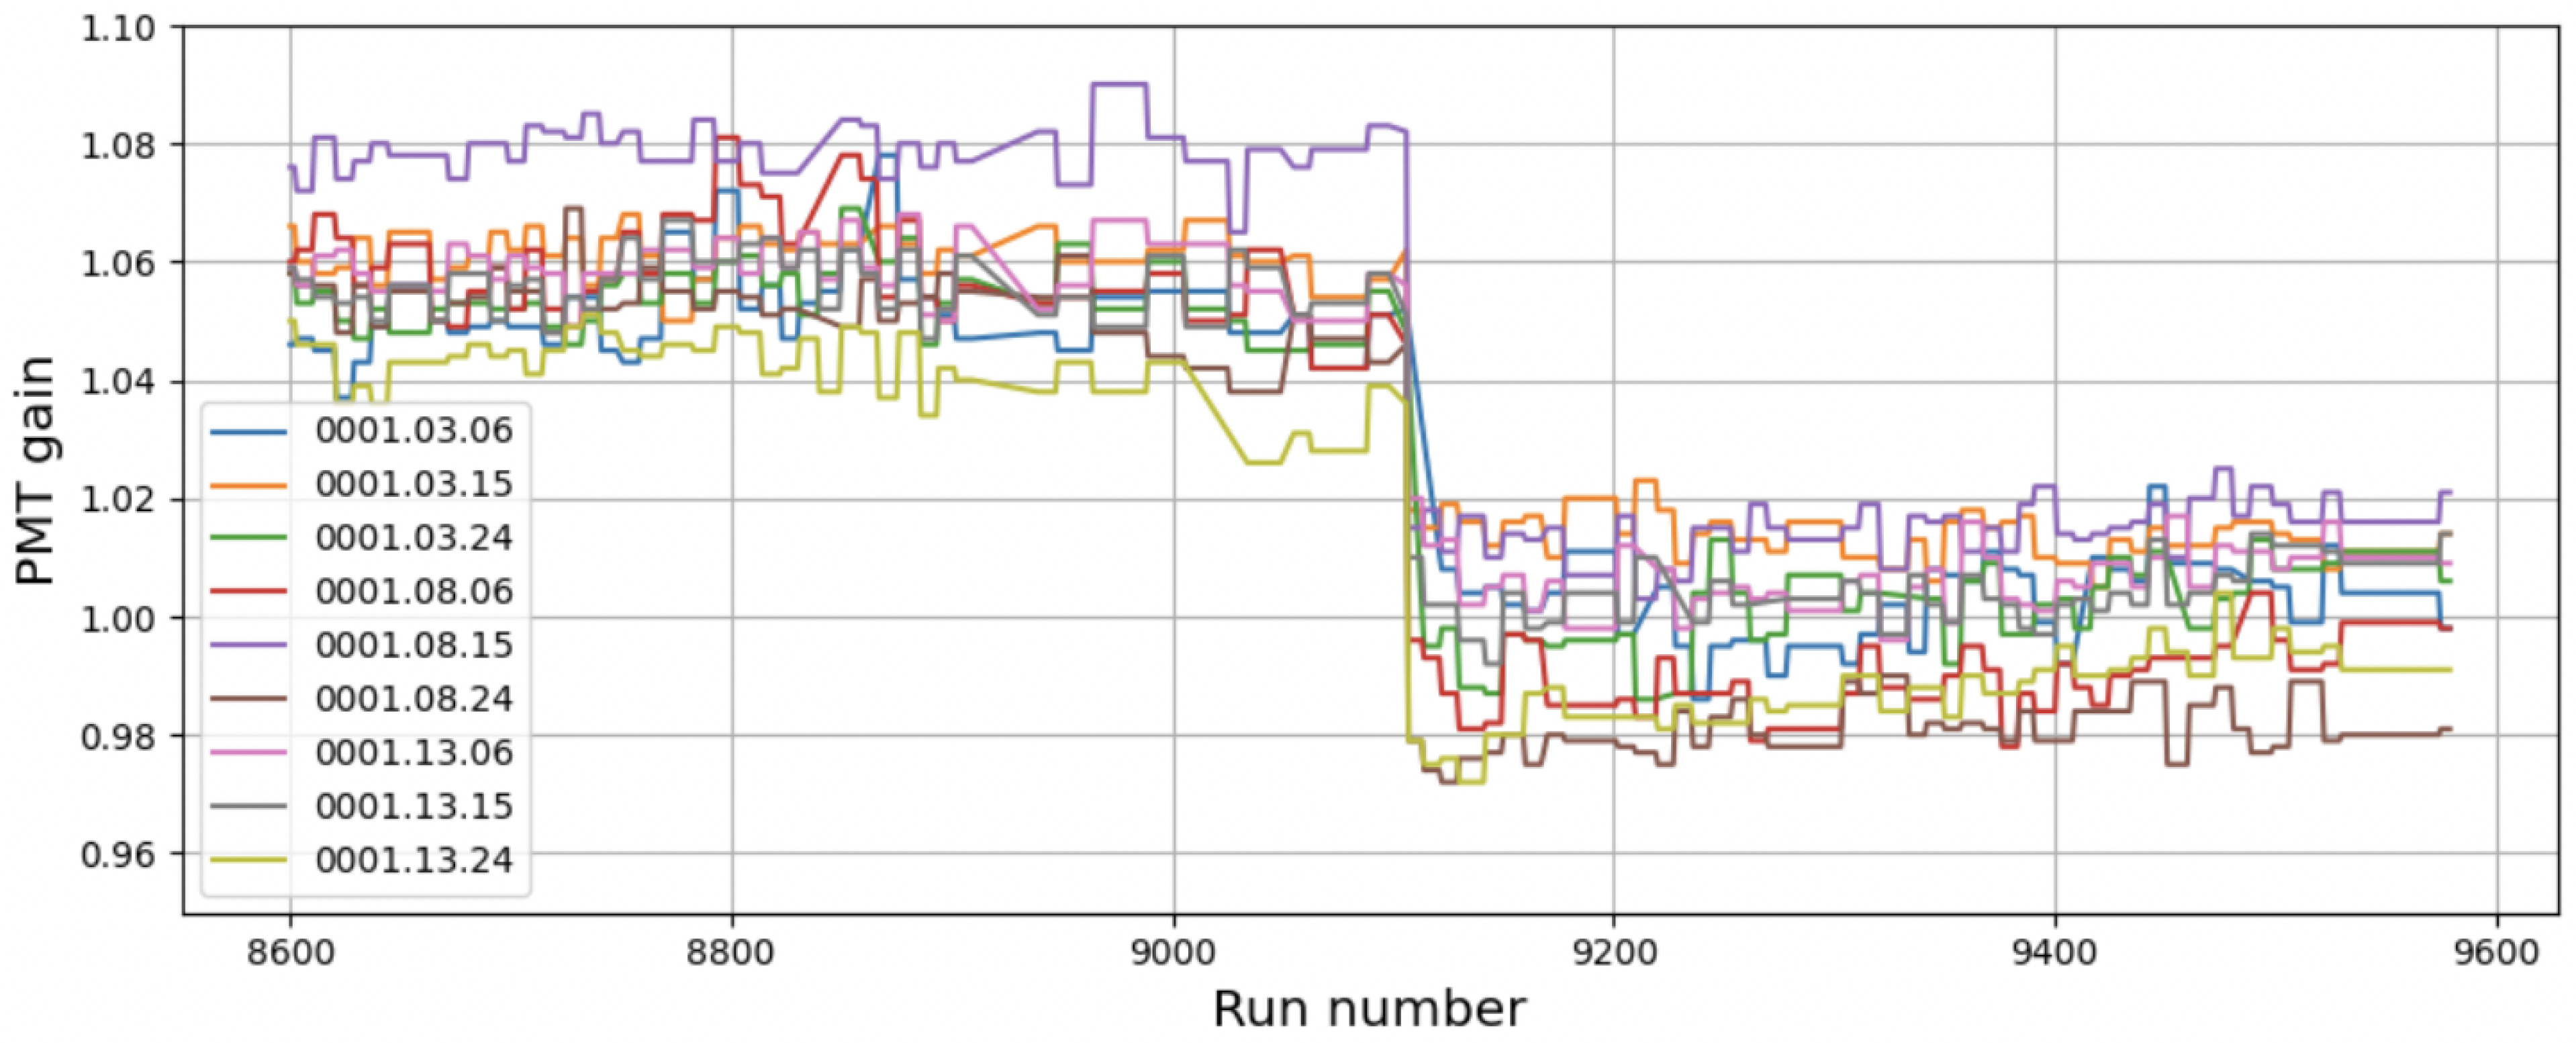
The efficiency and gain of the PMTs can be evaluated and continuously monitored through intra-DOM calibration by observing the ToT distribution of photoelectron hits due to Cherenkov photons from the
K decay. The gain value for each channel is inferred from the statistical trend of the ToT distribution of single photoelectron hits. This is achieved by applying an analytical model that relates the measured ToT values to the pulse charge and vice versa. At sea, the regular tuning of the PMTs to the applied HV is necessary in order to ensure that the analogue PMT pulses always match the preset threshold of the discriminator. The HV setting which optimizes the gain is based on the fact that HV and gain (
G) are related through the equation
where
A,
k, and
N are constants related to the dynode system of the PMTs. In
Figure 2, it is possible to observe the effect of the HV tuning on the gain of nine PMTs, and the stability of the trend over time canbe noted.
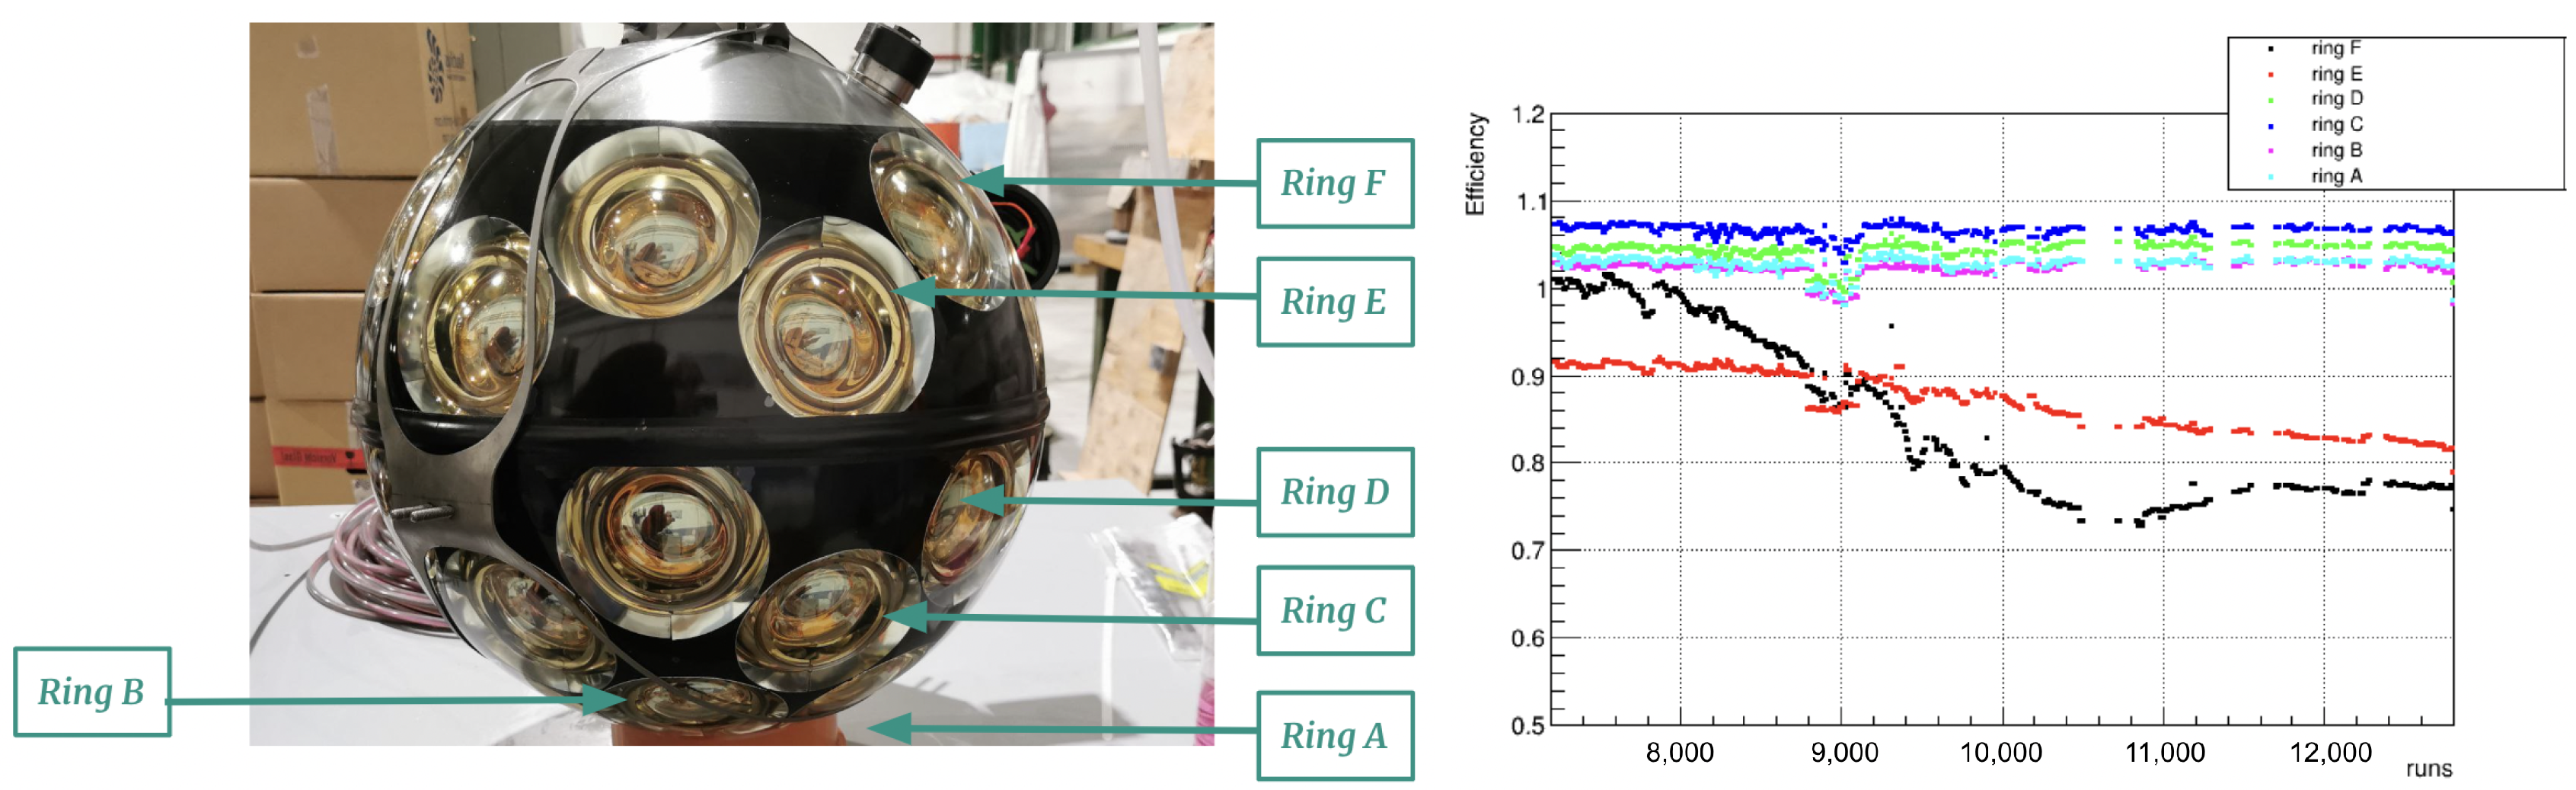
Conversely, the evaluation of collective efficiency (defined as the probability of detecting a single photon) is based on the use of coincident multi-PMT hits in the same DOM, which are due to the Cherenkov light produced in
K decays. The magnitude of the distribution of the time difference between the hits on different PMTs within the same DOM scales with the PMT efficiency. The latter is determined sufficiently accurately to monitor the effects of sedimentation on the top of each DOM. In fact, as can be seen from
Figure 3, it can be observed that the PMTs of the upper rings show decreasing efficiency with time, which is not evident for the other PMTs; this is interpreted as being due to sedimentation occurring on the upper hemispheres of the DOMs.
3. Positioning and Dynamic Calibration
DUs are anchored to the seabed, and can bend in the vertical direction due to the effect of sea currents. Hence, to ensure a spatial resolution better than 20 cm it is necessary to constantly monitor the position of all DOMs. To this end, the detector is equipped with a system of acoustic emitters located on selected DU bases or installed on autonomous stands around the apparatus and receivers located in each DOM and DU base. At predefined times, the acoustic beacons emit a set of pings which can be identified by their own waveform, then the arrival times of the acoustic signals are measured to determine the position of each DOM. Moreover, a system of compasses, one in each DOM, allows the rotation and tilt of the DOMs to be taken into account as well.
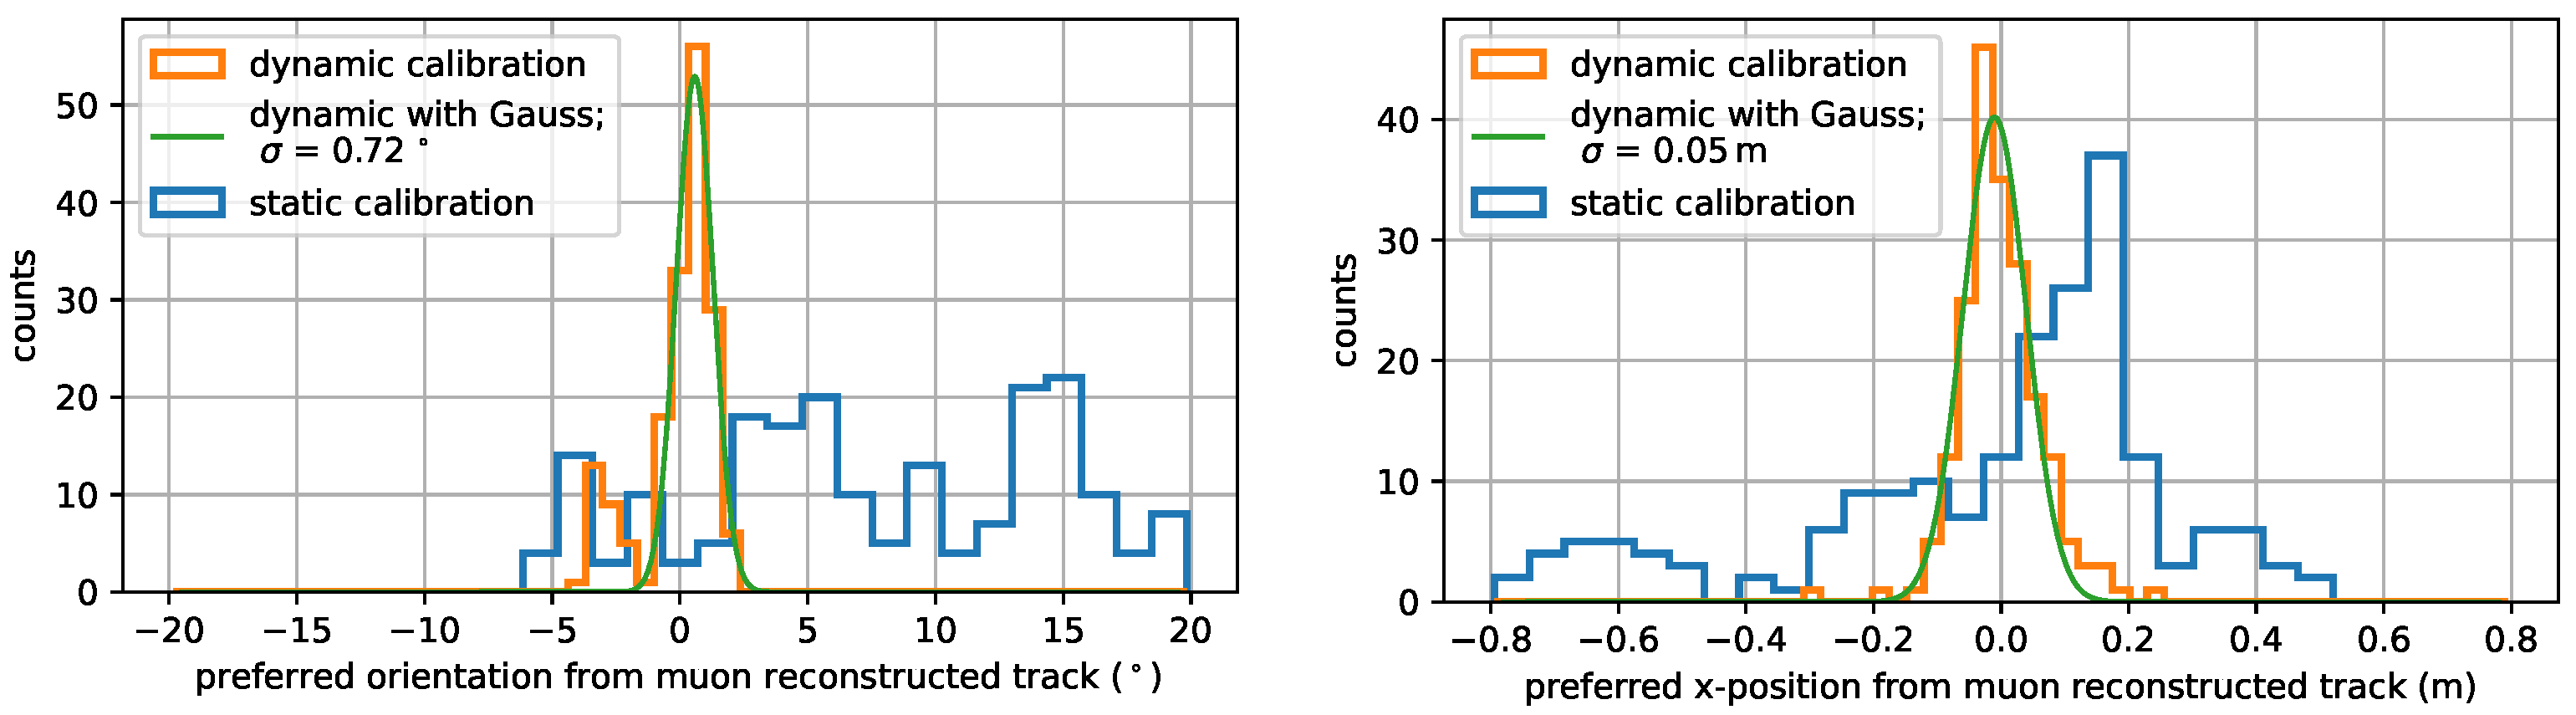
Confirmation of the degree of accuracy achieved through these dynamic calibration techniques is provided by the reconstruction of atmospheric muon tracks. In
Figure 4, it is possible to observe how the track reconstruction changes when using the results of the dynamic positioning calibration instead of assuming that the DUs remain vertical (called “static calibration” in the figure). From these plots, it can be seen that dynamic calibration provides much better results in both orientation and position, providing the accuracy to less than a degree in orientation and 10 cm in position.
Sun/Moon Shadow
A further measure, which allows for verifying the quality of the calibration, is the detection of the so-called
Moon/Sun shadow. Atmospheric muons must have an energy greater than 600 GeV to be detected by ORCA at a depth of more than 2000 m. Therefore, they are the product of the interaction between cosmic rays, with energies of several TeV, and the nuclei of the upper atmosphere. There is an angle between the primary cosmic rays and the incoming muons that on average is within
[
6], which is about five times smaller than the angular resolution of the detector. Thus, the Moon/Sun shadow is visible as a deficit in the atmospheric muon flux from the Moon/Sun direction (with an angular size of
radius) caused by the direct absorption of primary cosmic rays [
7].
In order to quantify the sensitivity to the observation of the shadow induced by the Moon or the Sun, a hypothesis test can be performed comparing the null hypothesis
and the background+signal hypothesis
. According to the null hypothesis, in the absence of shadow the distribution of cosmic ray events around the theoretical position of the Moon/Sun in the
model has
parameters, and can be described by a polynomial function incorporating the two angular parameters
where
,
, and
are free fit parameters modeling the background, which consists of
and
. On the other hand, the hypothesis
assumes that the distribution of cosmic ray events is influenced by the Moon/Sun shadow effect. The function describing this signal consists of the background component
(Equation (
2)), from which a two-dimensional Gaussian point spread function is subtracted to fit the shape of the shadow.
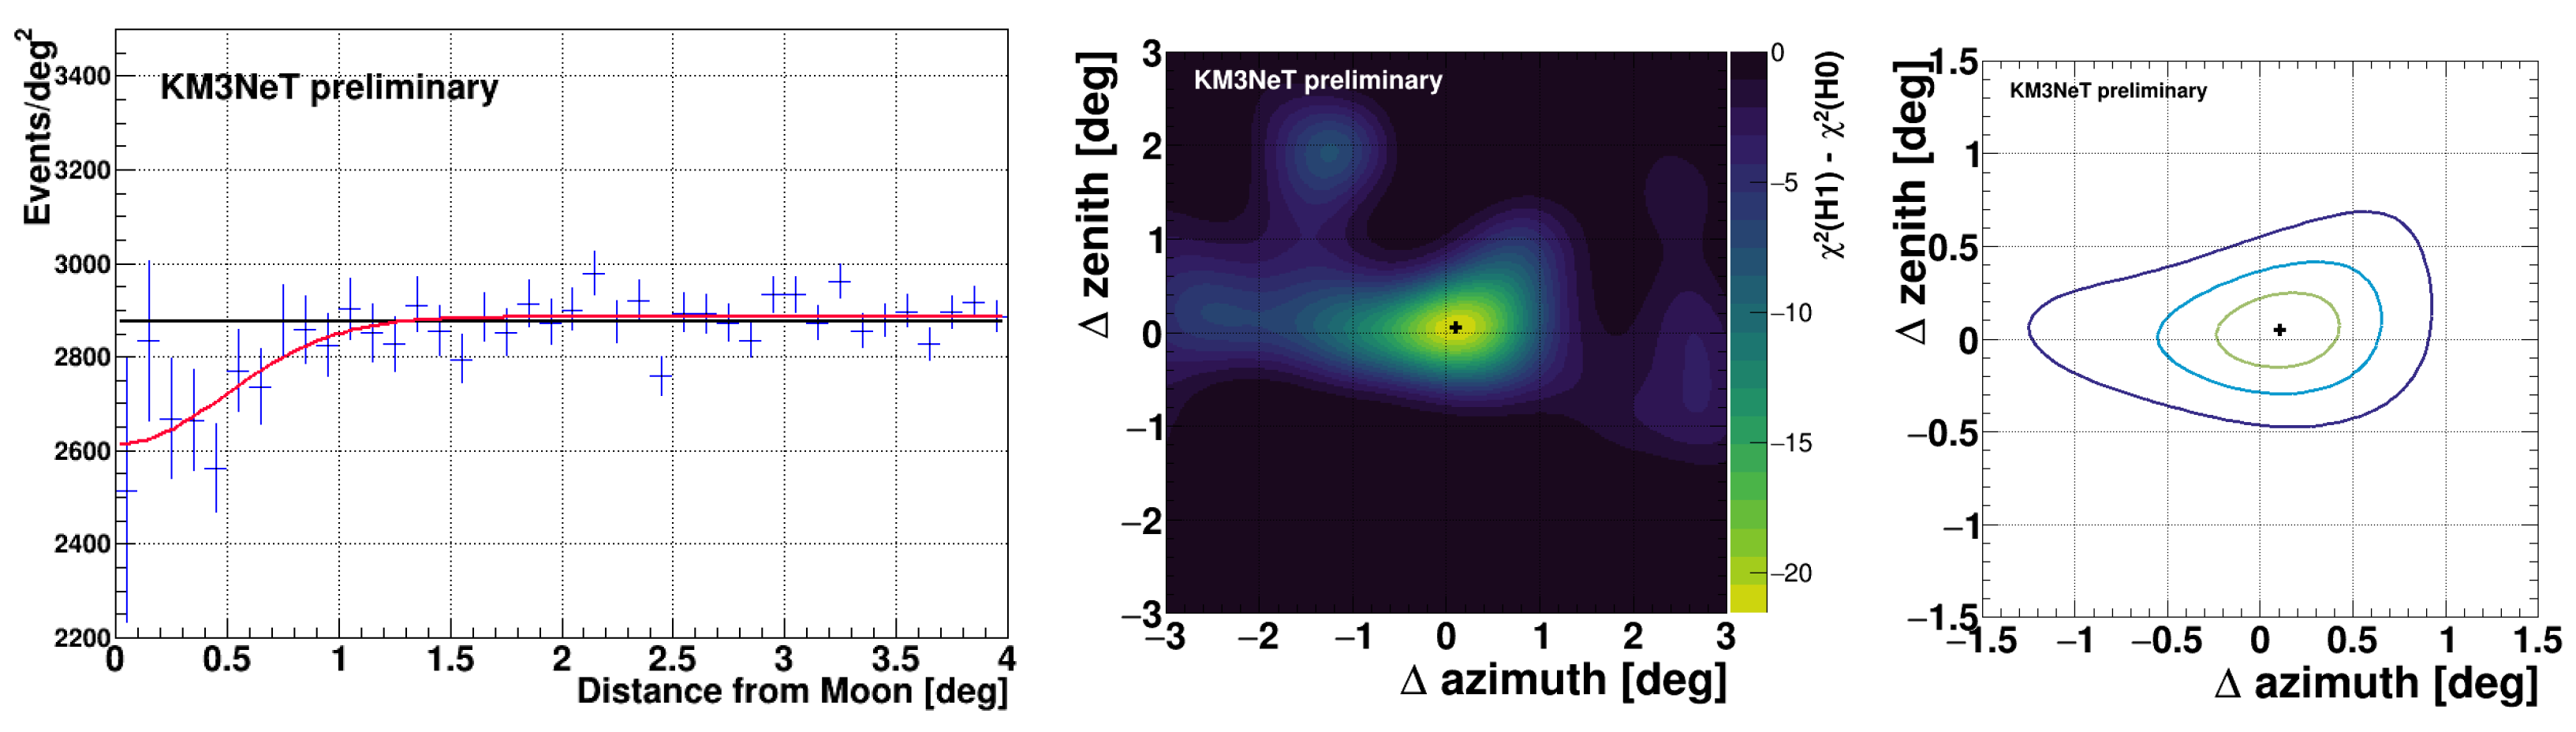
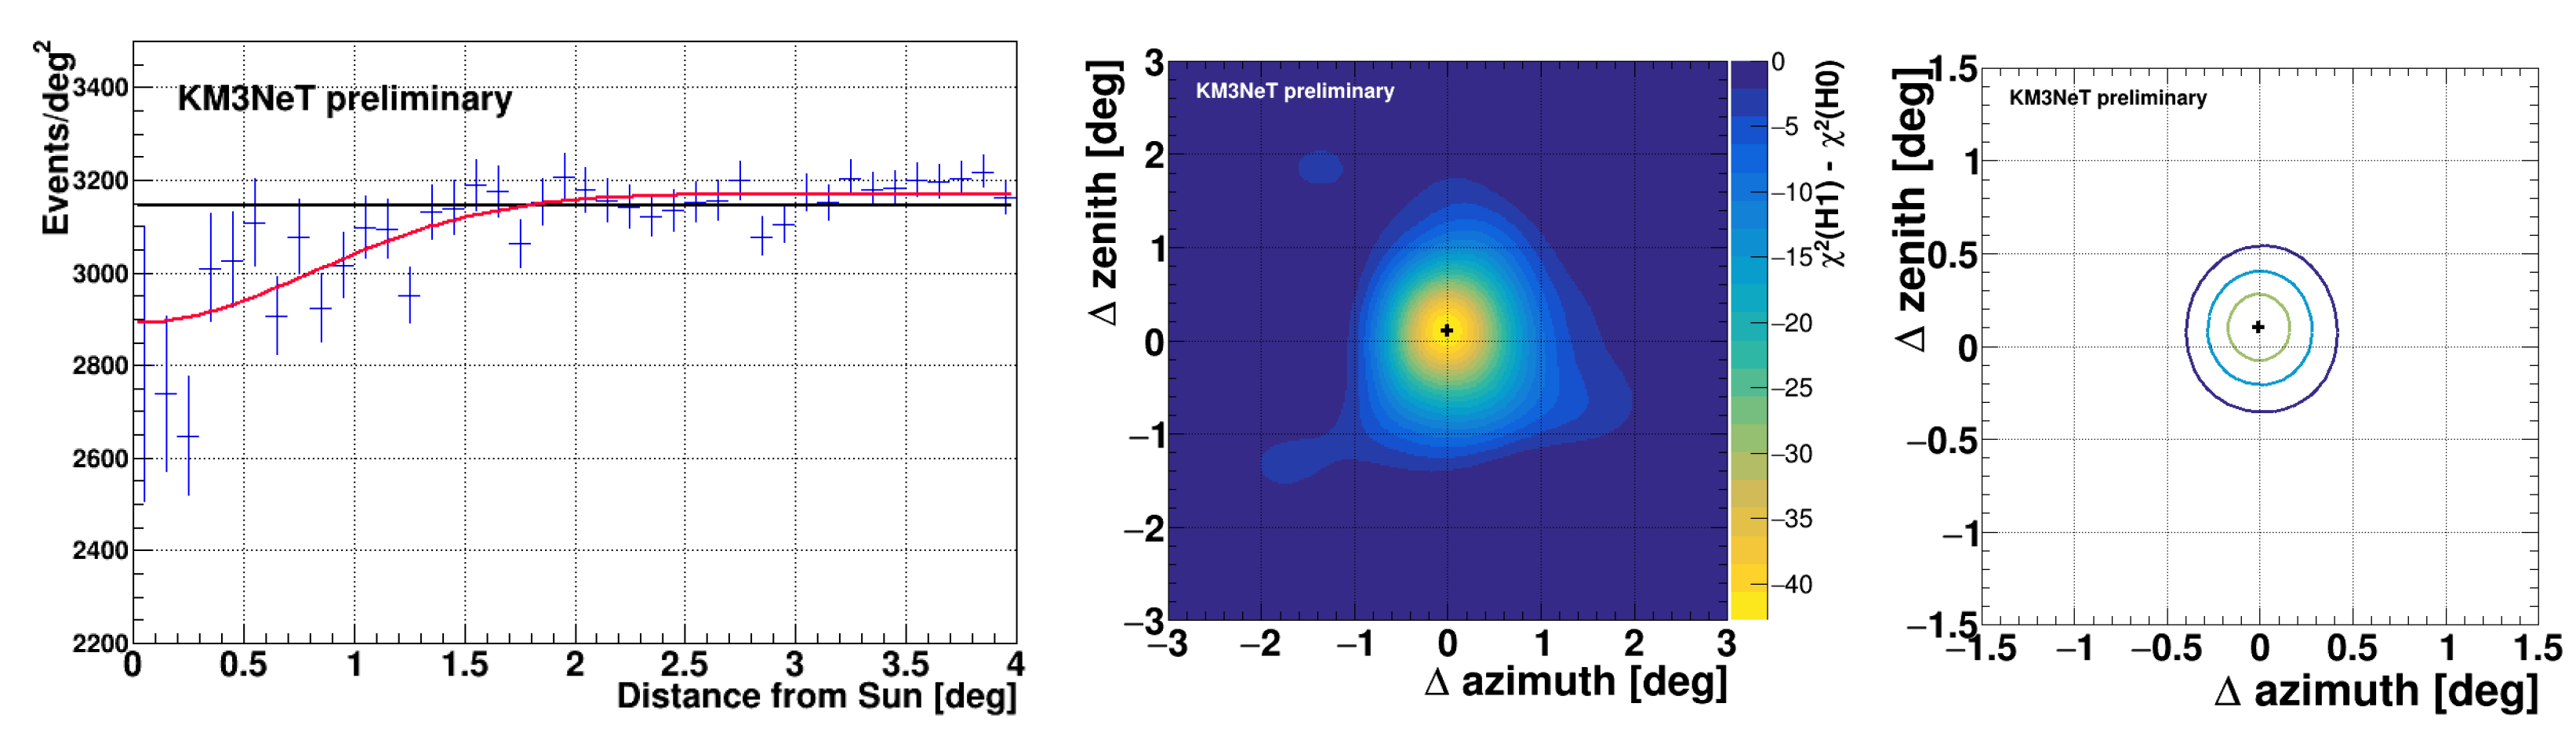
In
Figure 5 and
Figure 6, on the left plots the 1D fit in
of the incoming flux of downgoing muons is shown as a function of the angular distance from the Moon/Sun. Evidence of a shadow can be clearly seen. In the centre plots there are bidimensional fits around the nominal position of the Moon/Sun with
and
on the vertical and horizontal axes, respectively. The sensitivity to the shadow is provided by
. The greater width and strength of the Sun’s shadow in comparison to the Moon’s may be due to the particular structure of the Sun’s magnetic field, which behaves as a dipole during periods of low activity [
8]. Finally, the right plots show the
,
, and
contours with respect to the best fit position. Concerning the Moon, the signal of the shadow has a significance of
. The best fit of the shadow position is found at
and
. The true position of the Moon is contained within the
contour, yielding an
compatibility between the best fit position and the nominal position of the Moon. For the Sun, the signal of the shadow has a significance of
. The best fit of the shadow position is found at
and
. The true position of the Sun is contained within the
contour, yielding a
compatibility between the best fit position and the nominal position of the Sun.
4. Conclusions
The goal of the KM3NeT/ORCA project is the detection of low-energy atmospheric neutrinos for the study of oscillations and mass hierarchy. Time calibration procedures have been implemented to allow the synchronization of all detector lines and their DOMs, providing nanosecond-order accuracy. These procedures allow the gain and efficiency of each individual channel to be estimated and monitored. Moreover, dynamic calibration procedures carried out with a system of acoustic emitters and receivers have been implemented to provide a positional accuracy of approximately 10 cm. These results make it possible to observe the effect of the Moon/Sun shadow on the detection of atmospheric muons with high statistical significance.


