Proceeding Paper

Development of a Mathematical Model Based on an Artificial Neural Network (ANN) to Predict Nickel Uptake Data by a Natural Zeolite †

1
Laboratory of Materials Technology and Process Engineering (LTMGP), Faculty of Technology, University of Bejaia, Bejaia 06000, Algeria
2
University of Lorraine, CNRS, LRGP F-54000 Nancy, France
*
Author to whom correspondence should be addressed.
Presented at the 1st International Conference on Physics of Semiconductor Devices, Renewable Energies and Environment, Bechar, Algeria, 14–16 November 2022.
Phys. Sci. Forum 2023, 6(1), 4; https://doi.org/10.3390/psf2023006004
Published: 25 April 2023

Abstract

:
In this investigation, an artificial-neural-network-based mathematical model was developed for the prediction of nickel adsorption data. As input variables, the initial concentration, adsorbent dosage, and pH of the nickel solution were chosen, while the removal efficiency was chosen as an output variable. The hyperparameters were optimized to determine the perfect topology for the model. The study demonstrated that the 3-2-1 ANN architecture was the most suitable topology. The determination coefficient of 0.98 and the mean squared error of 0.02 indicated the high performance of the developed model, which was successfully applied for isotherm data prediction.

1. Introduction

Nowadays, due to the rapid increase in industrial production, a massive amount of industrial effluent is being created and released into the aquatic system. Heavy metal contaminants found in wastewater and industrial effluent include cobalt, nickel, lead, and copper. A high concentration of these heavy metals can induce acute or chronic poisoning [1,2,3]. Nickel is a toxic, non-biodegradable, and carcinogenic metal that can cause several health problems, including chronic asthma, dermatitis, and cancer. The permissible limit set by WHO for drinking water is 0.01 mg/L, whereas for wastewater it is 2 mg/L [3,4,5].
Several chemical and physical methods are used for heavy metals removal, such as chemical precipitation, ion exchange, electro-coagulation, and solvent extraction. However, most of these methods have been shown to have several drawbacks, i.e., a high cost and high energy consumption. Adsorption, on the other hand, has proven to be a more effective, simple, and less expensive method for heavy metals removal [1,6].
For heavy metal adsorption, several low-cost adsorbents have been studied. One of the most promising materials in this sector is natural zeolite. Natural zeolite is a porous hydrated aluminosilicate mineral with a three-dimensional structure. The fundamental building blocks of zeolite are SiO4 and AlO4, and the isomorphic substitution of Si+4 by Al+3 provides a net negative charge on the framework surface, which is balanced by alkaline and alkali-earth metals, such as Na+, Ca+, K+, and Mg+2 [4,7].
An artificial neural network (ANN) is a reliable, rebuttable, and powerful mathematical tool of the artificial intelligence (AI) family. It correlates the non-linear relationship between input and output variables for complex problems [8,9]. The principal objective of this paper was to develop a mathematical model based on ANN simulation for nickel-adsorption data prediction. Fifteen data sets were collected from our previous work [4] and divided into training and validation sets (70/30). The ANN architecture and the hyperparameters were optimized to find the best topology. In addition, the performance of the model was evaluated by minimizing the Mean Squared Error (MSE) for both the training and validation sets. The ANN model was validated by predicting the removal efficiency of nickel adsorption, and finally, it was tested for isotherm prediction to confirm the adequacy of the model.

2. Materials and Methods

2.1. Data Collection
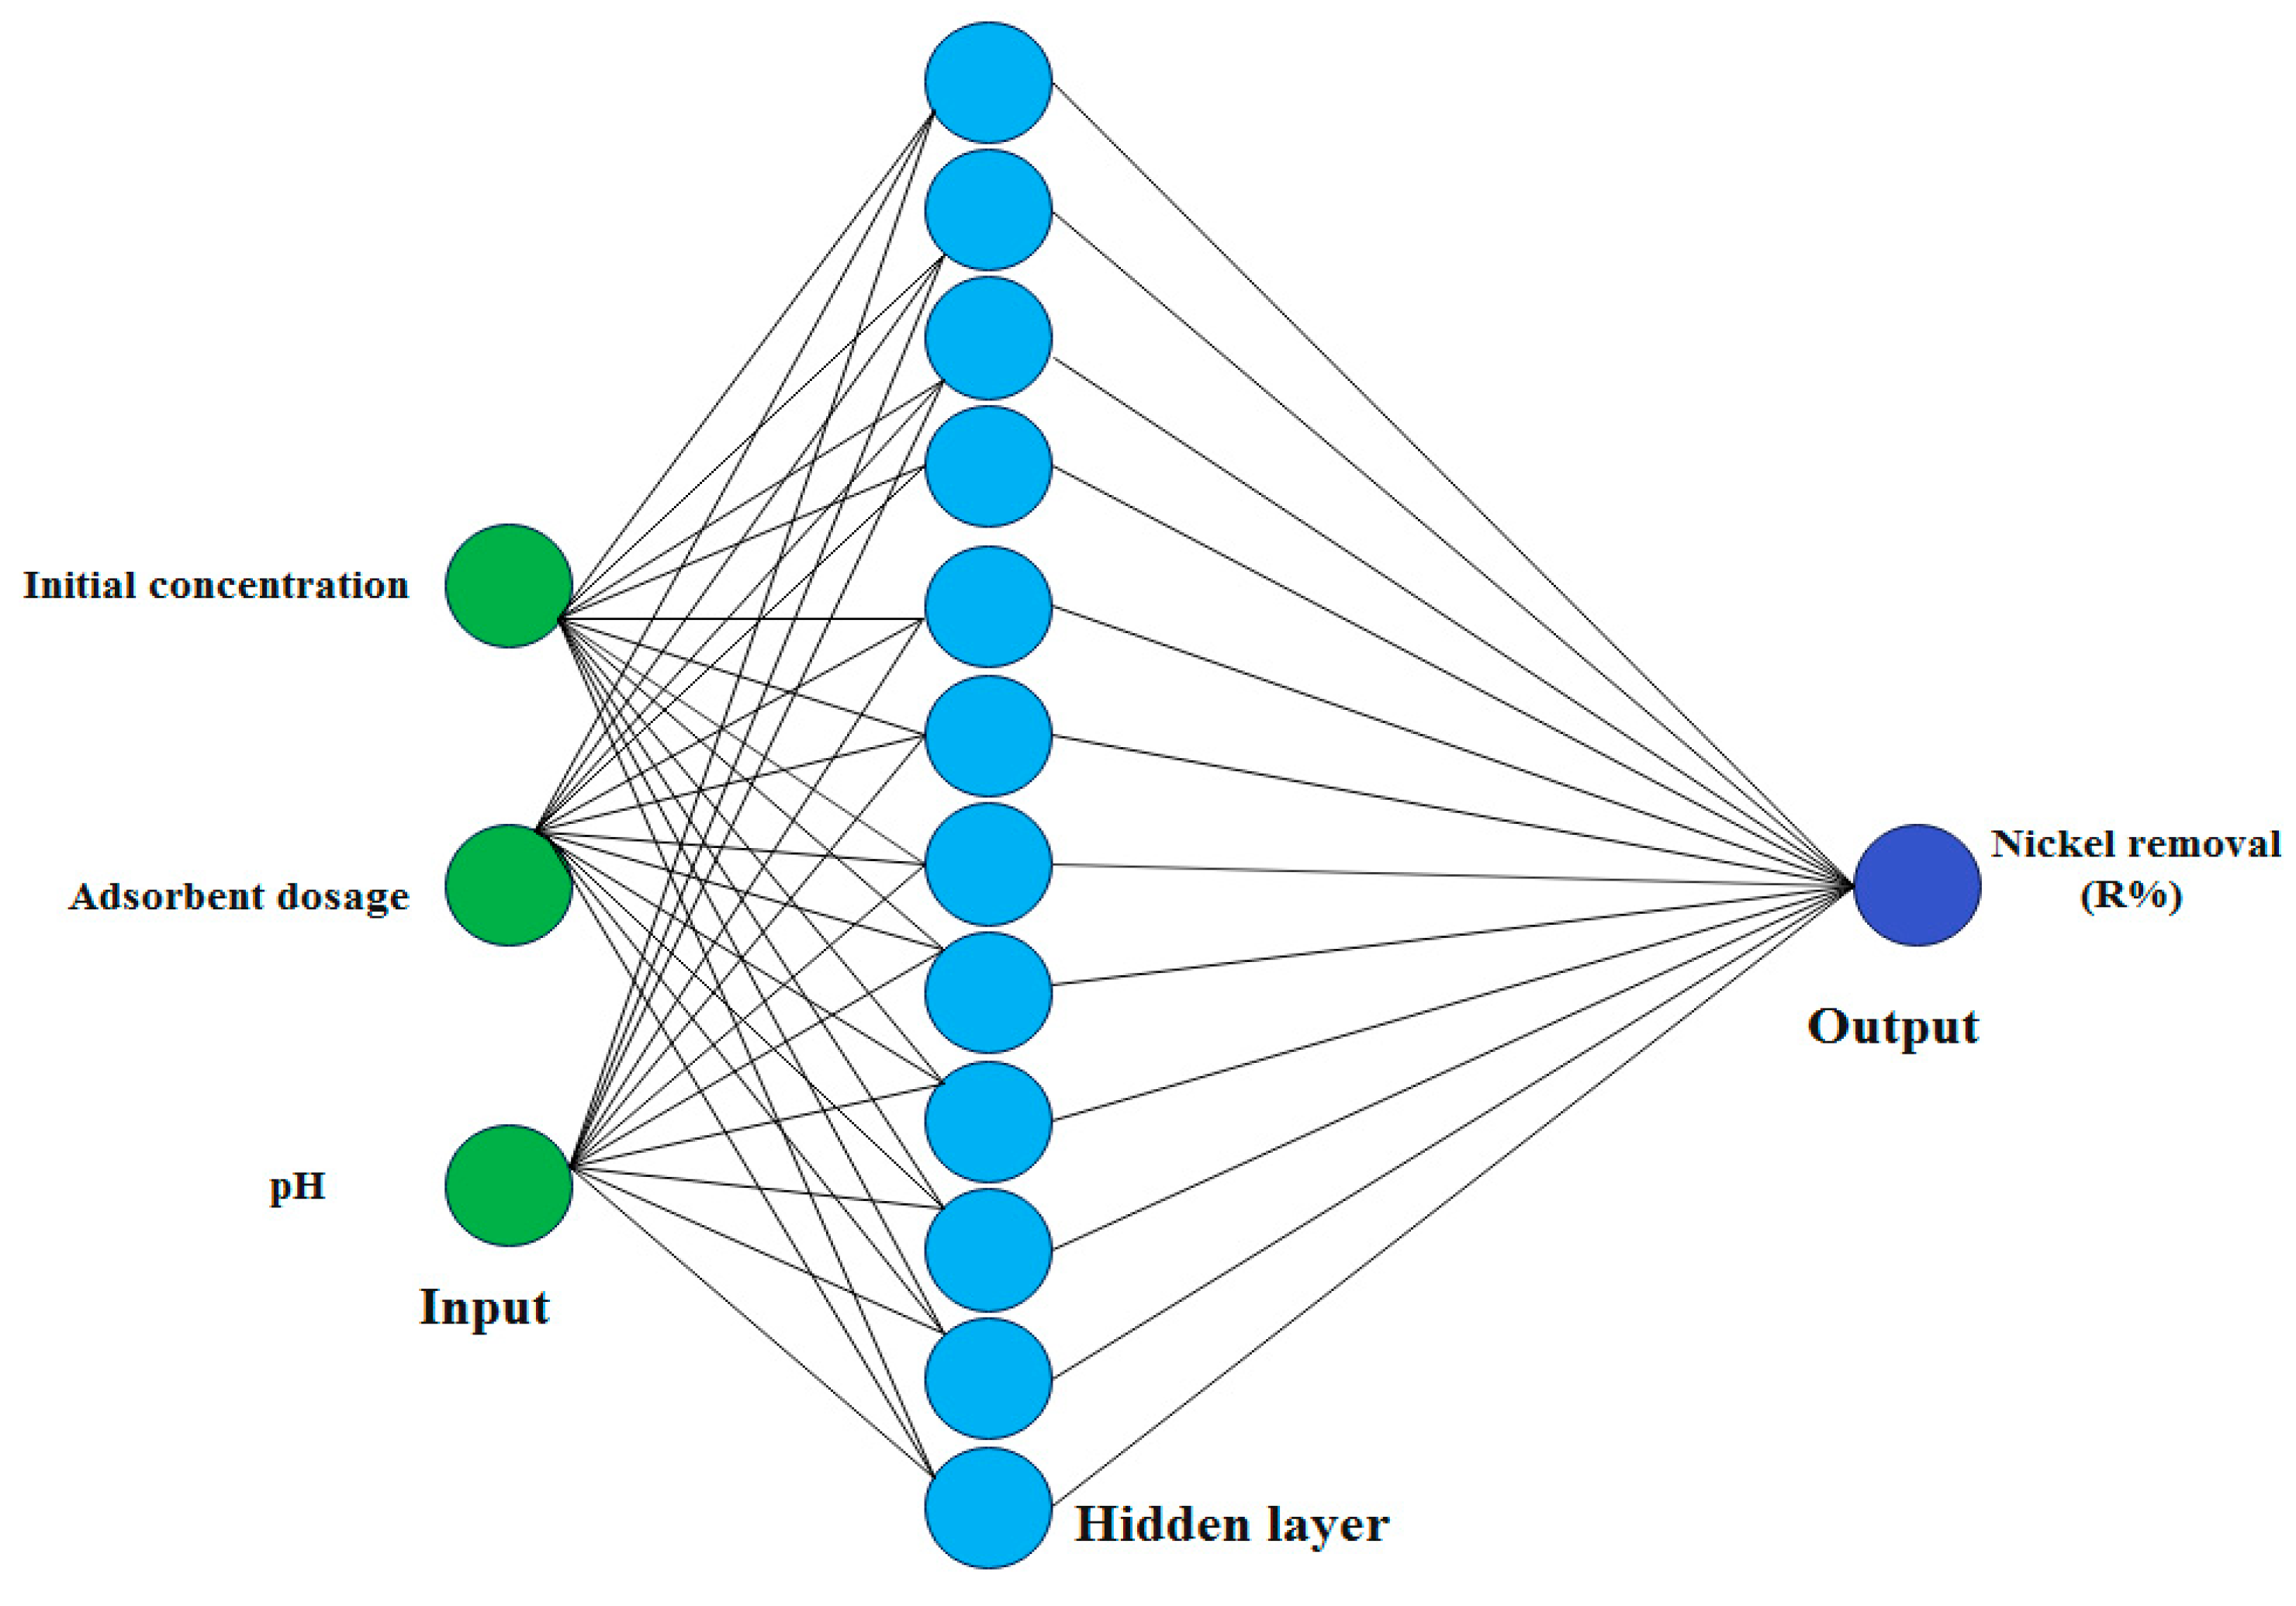
The data used in the current paper for the development of a mathematical model based on an ANN for the prediction of nickel removal in aqueous solutions came from our previous work [4]. In our previous paper, we studied the adsorption of nickel using a NaCl-activated natural zeolite where the adsorption parameters, such as the initial concentration, adsorbent dosage, and pH of the nickel solution, were optimized using the Box–Benkhen design as a response surface methodology. The adsorption process was comprehensively described in [4]. The same data were used for the development of an ANN model where the initial concentration, adsorbent dosage, and pH of the nickel solution were selected as the input variables. On the other hand, nickel removal was chosen as the output variable. The selected data are summarized in Table 1.

2.2. ANN Model

An artificial neural network is a powerful tool of artificial intelligence that is inspired by the human brain concept. This tool simulates the working principles of human intelligence in the human brain, which makes it a very powerful approach for solving many complex problems, such as regression or classification problems. The ANN architecture consists of three layers, namely input, hidden, and output. Each layer has a number of neurons, which are linked to each other, forming different architectures of the ANN [9,10]. In this paper, a 3-12-1 ANN architecture was adopted with three input variables (initial concentration, adsorbent dosage, and pH), twelve neurons in the hidden layer, and one output layer (nickel removal). The best architecture is shown in Figure 1.
In general, the data is divided into three sets, such as training, validation, and testing. But in this research, 15 data points are not enough to satisfy this condition. As a result, the data were randomly divided into two sets: training and validation. A total of 70% of the data was used for training and the remaining for validation. The ANN model was performed using Matlab software. A trainlm function based on Levenberg–Marquardt was applied for back-propagation training. The tan-sigmoid (tansing) and linear (purelin) transfer functions were applied at the hidden and output layers, respectively.
The equation that defines the process of ANN work is presented as follows [10]:
y j = f B j + i = 1 n w j i X i
where yj is the output variable, f is the transfer function, Bj is the bias in the hidden layer, n is the number of neurons in the hidden layer, wji is the connection weights between the input and hidden layers, and Xi is the input variable. To avoid overfitting or underfitting, the data were normalized in the scaled range of −1 to 1, using Equation (2) [11]:
R n o r = M max M min y i M i n y i M a x y i M i n y i + M min
where Rnor is the normalized data, and Mmax and Mmin are the maximum and minimum values of the scaling range, respectively. yi is the actual data. Max(yi) and Min(yi) are the maximum and minimum values of the actual data, respectively.

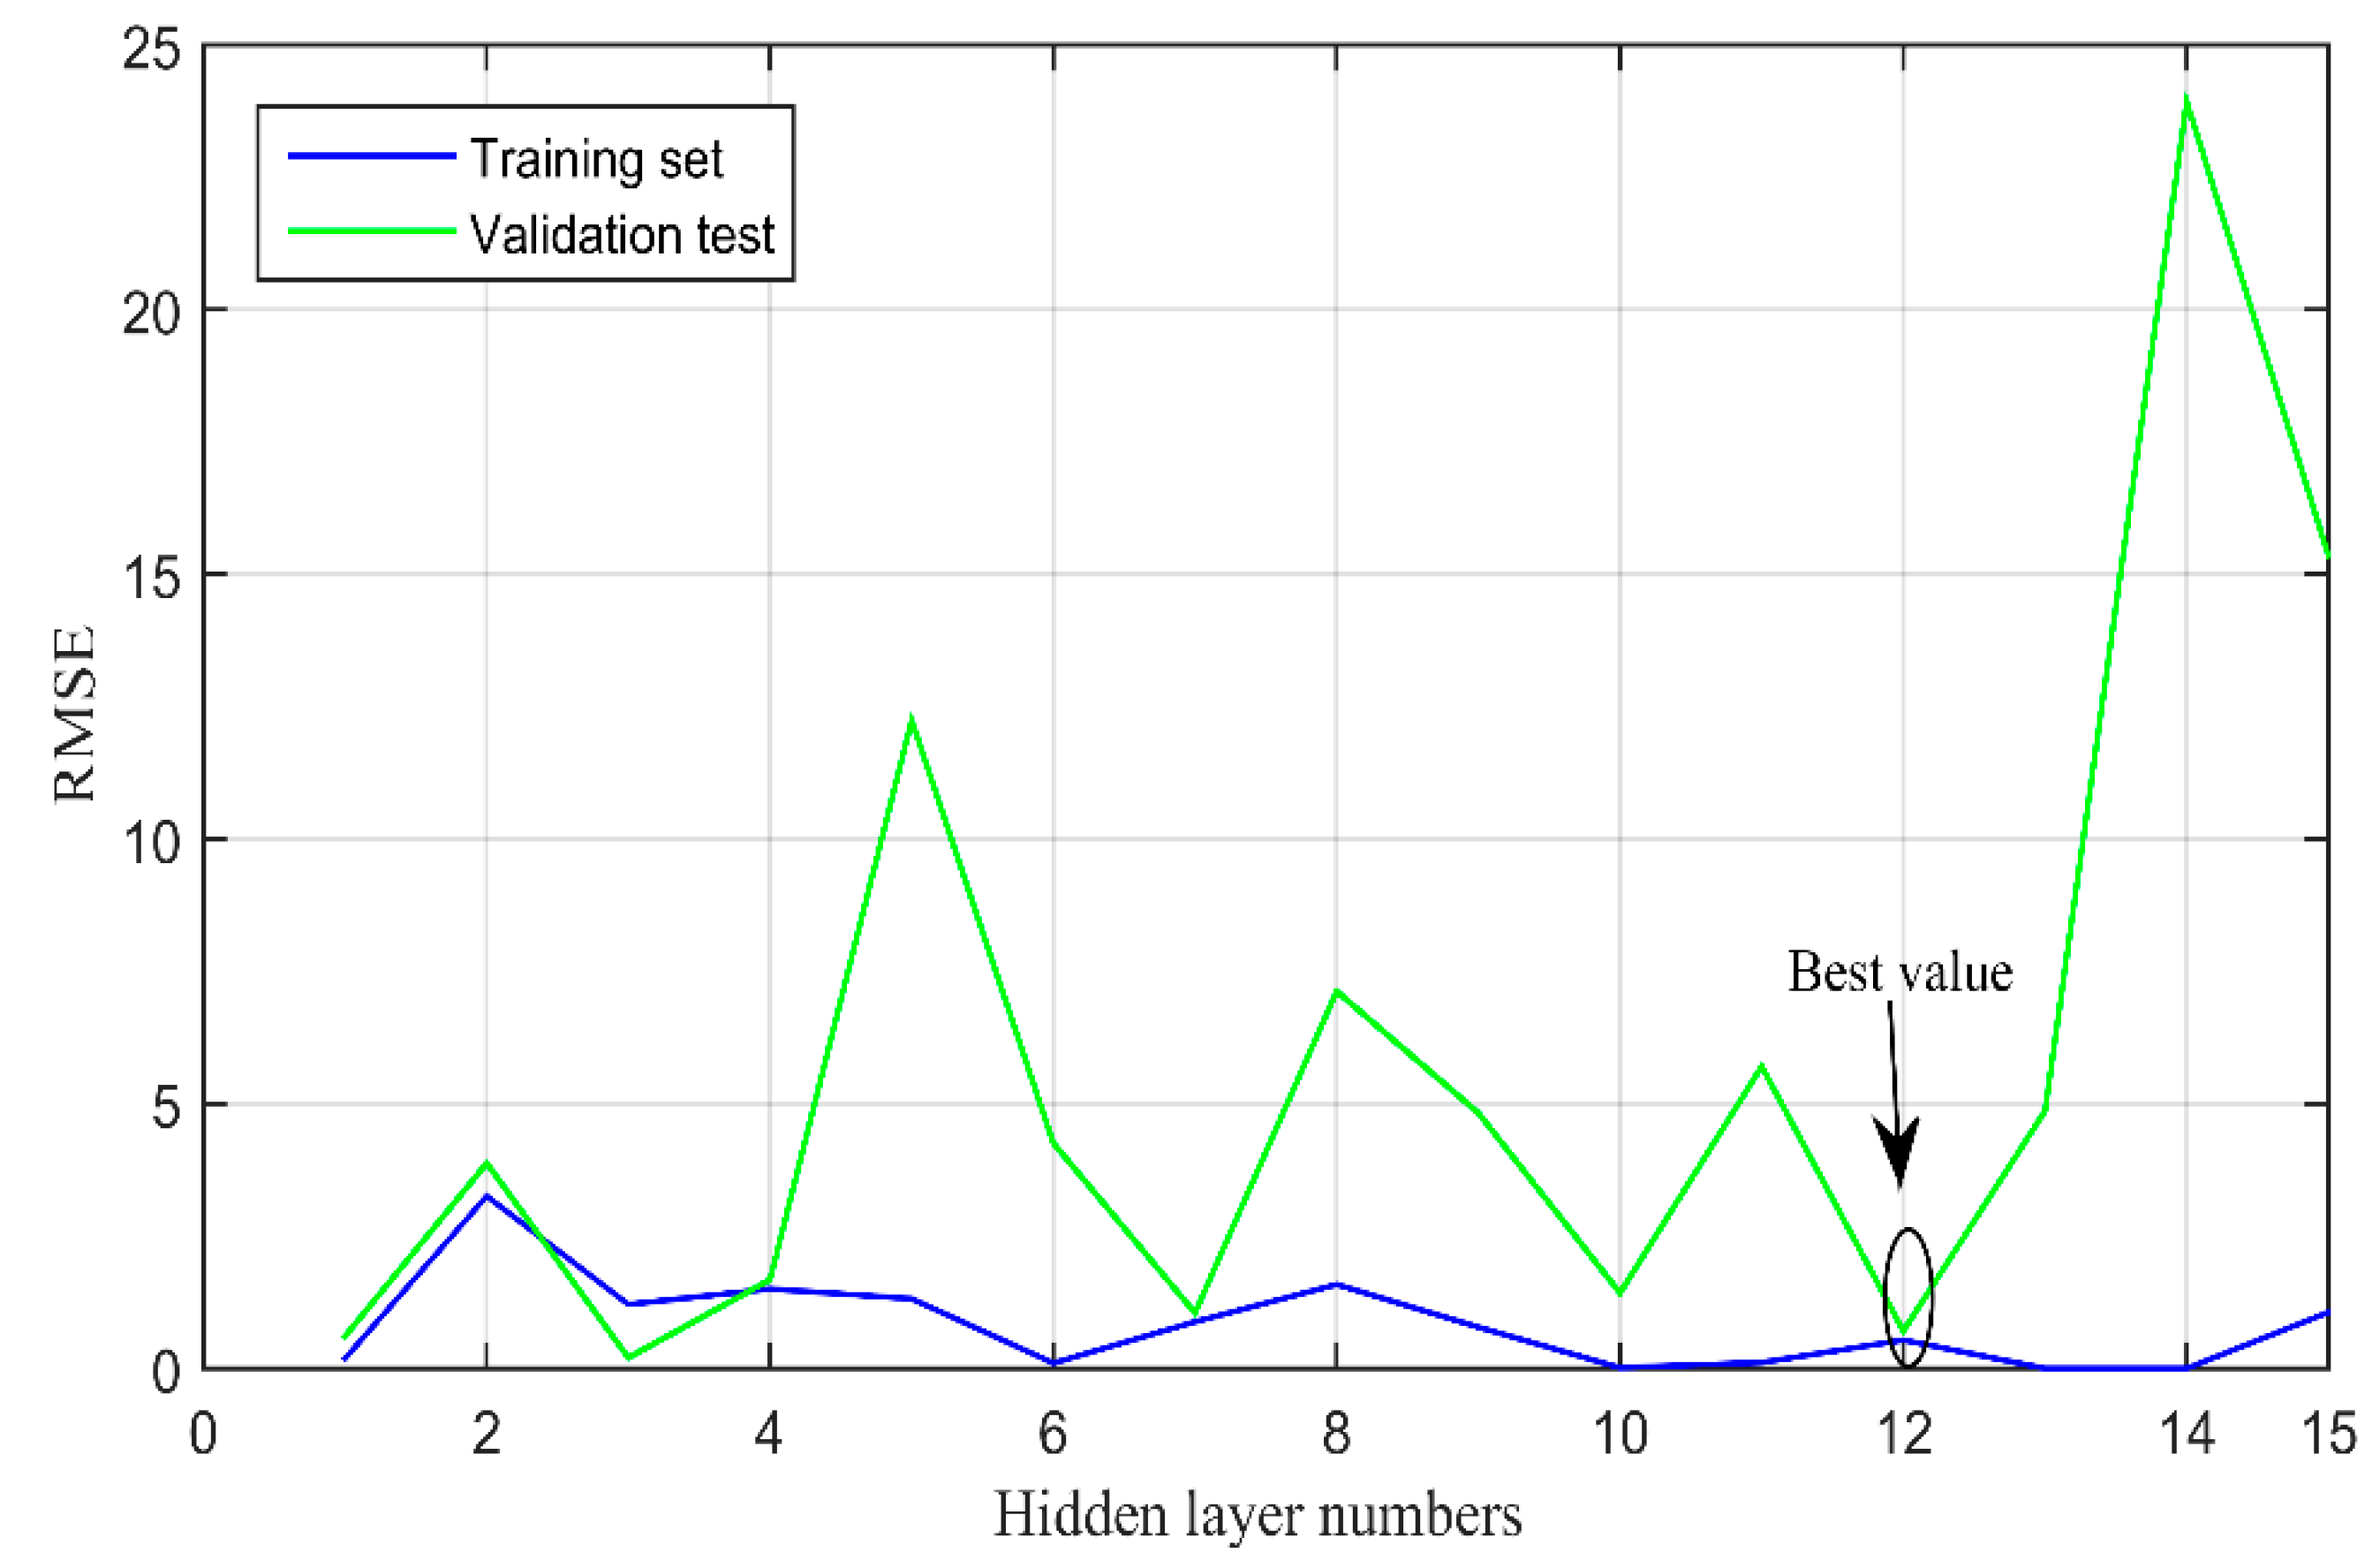
2.3. ANN Optimization

To find the best architecture for the ANN model, the hyperparameters, such as neuron numbers, transfer function type, and learning rate, should be optimized. In this work, the hidden neurons varied from 1 to 15, as shown in Figure 2. The best architecture was selected based on relative mean square error (RMSE) values for both the training and validation sets [12,13]. The optimum number of neurons was 12, where the RMSE values for the training and validation sets were as minimal as possible and converged to almost the same value.

3. Results

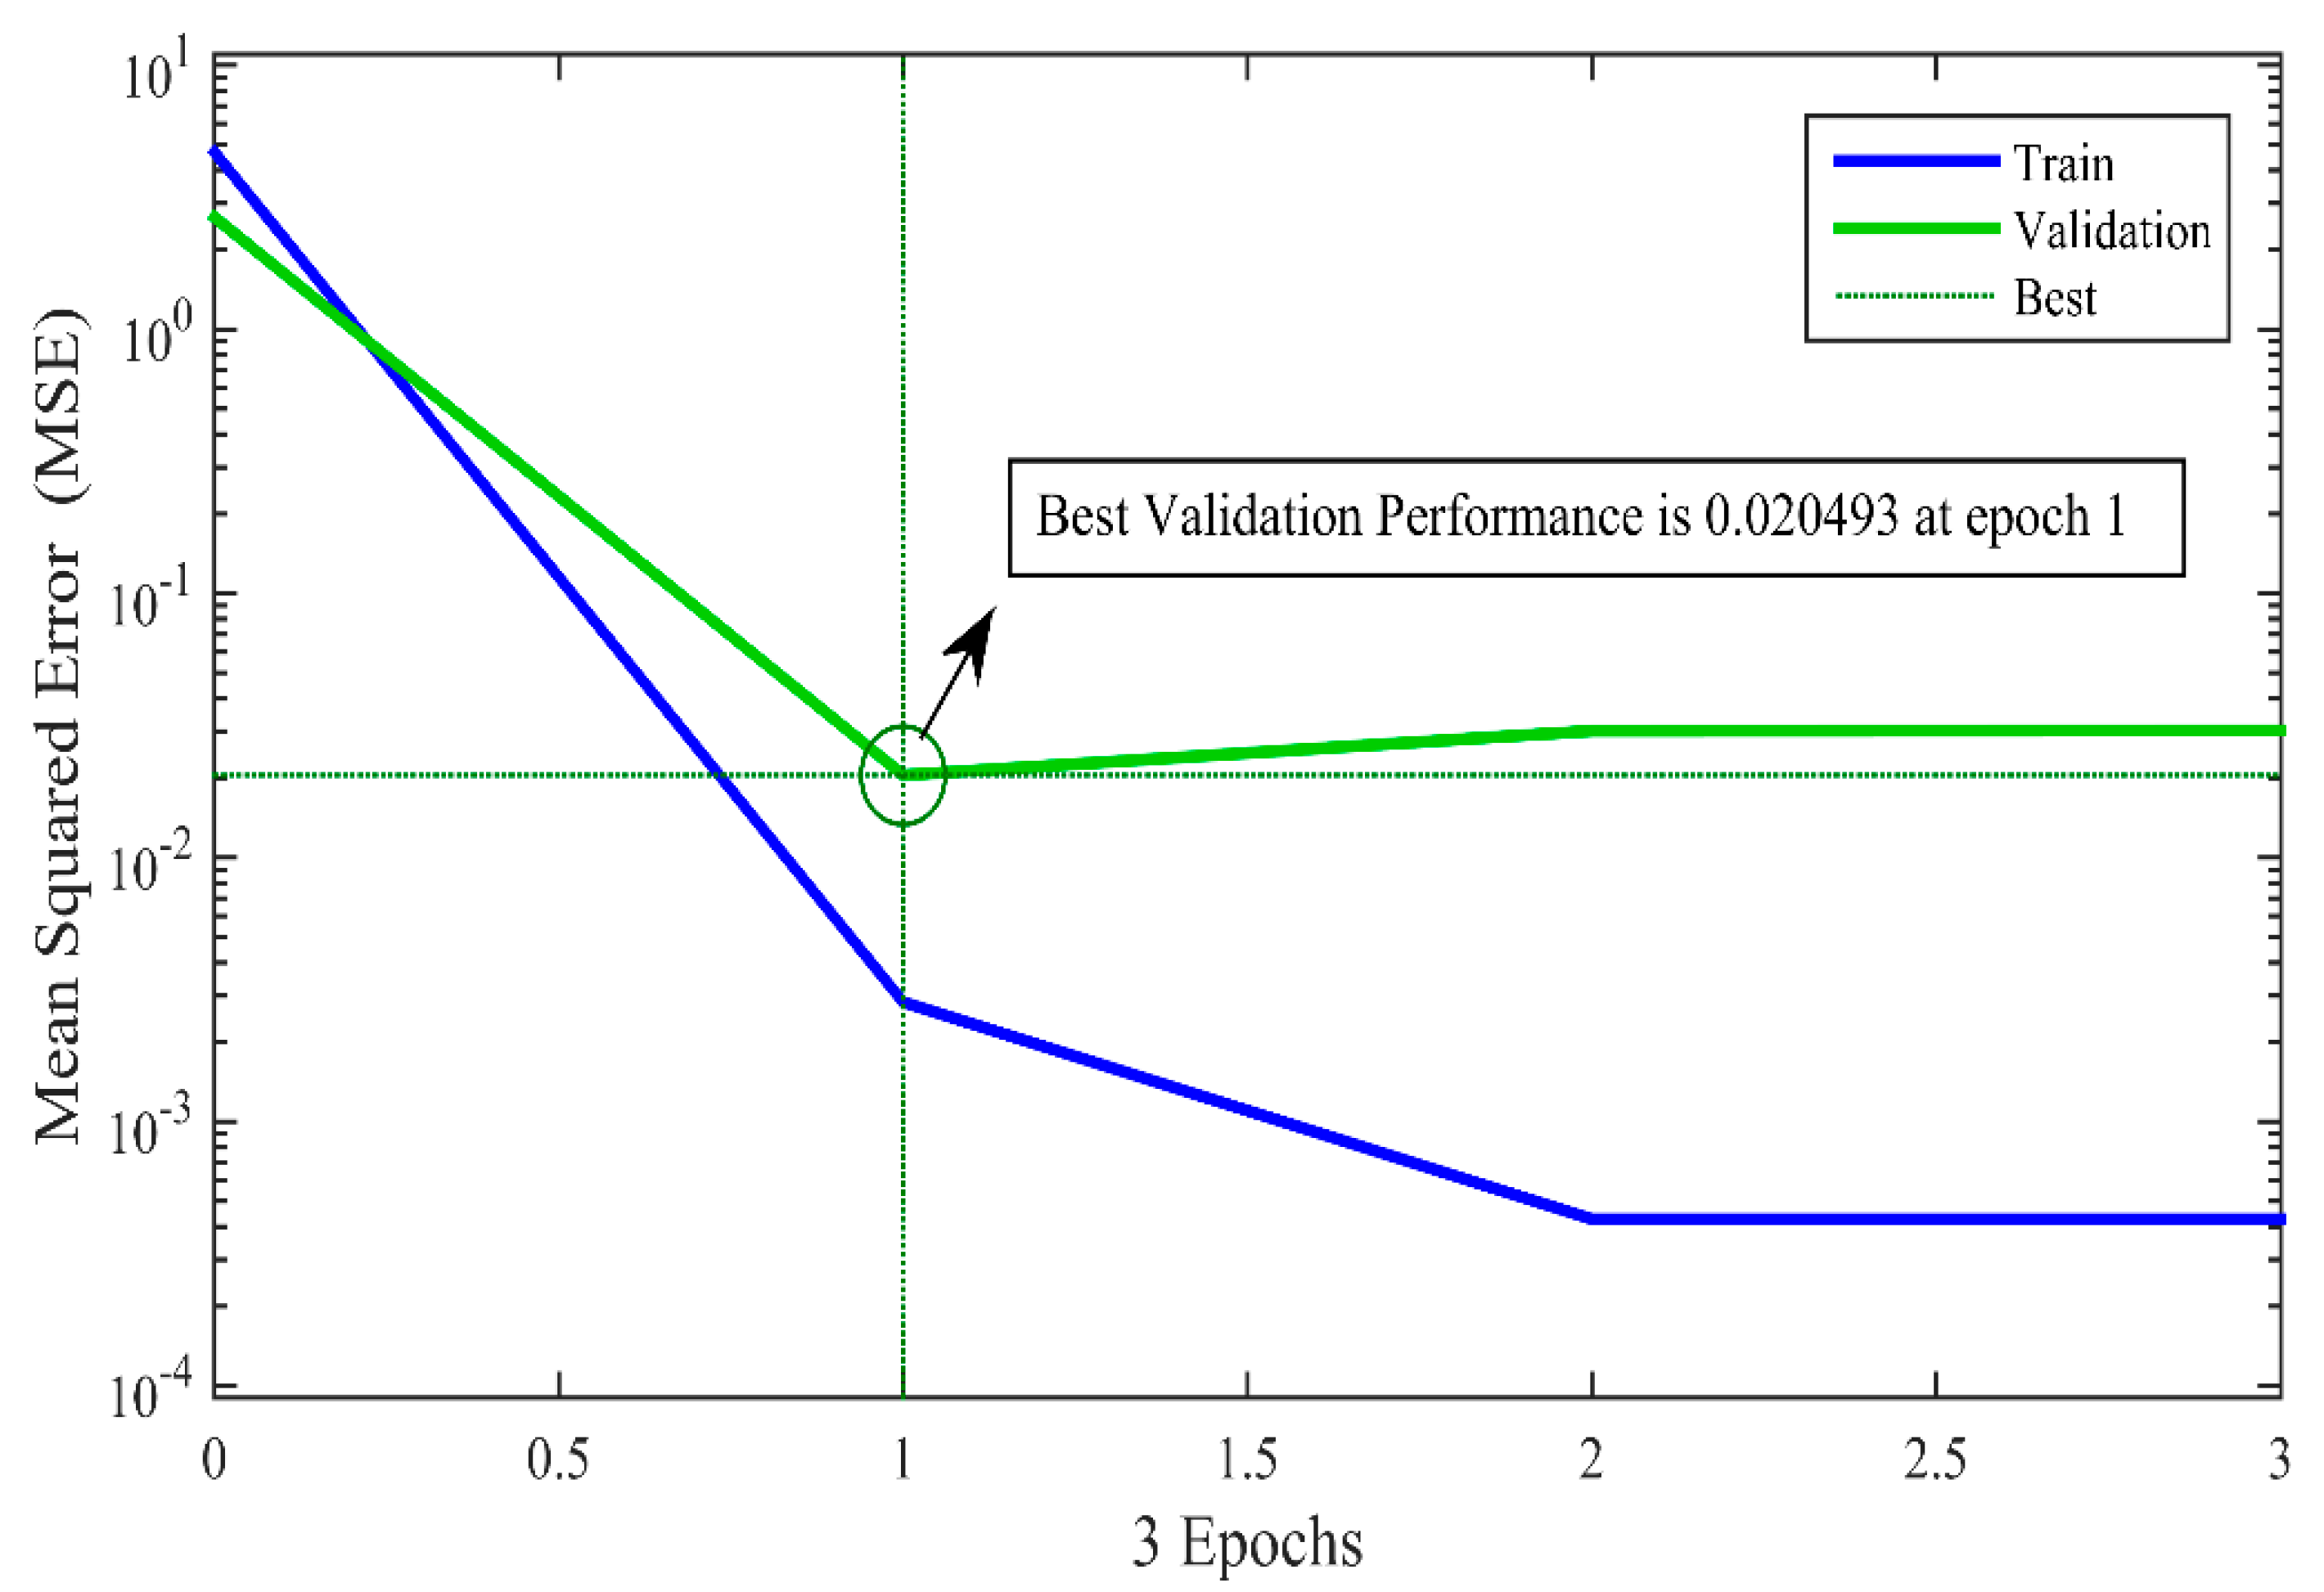
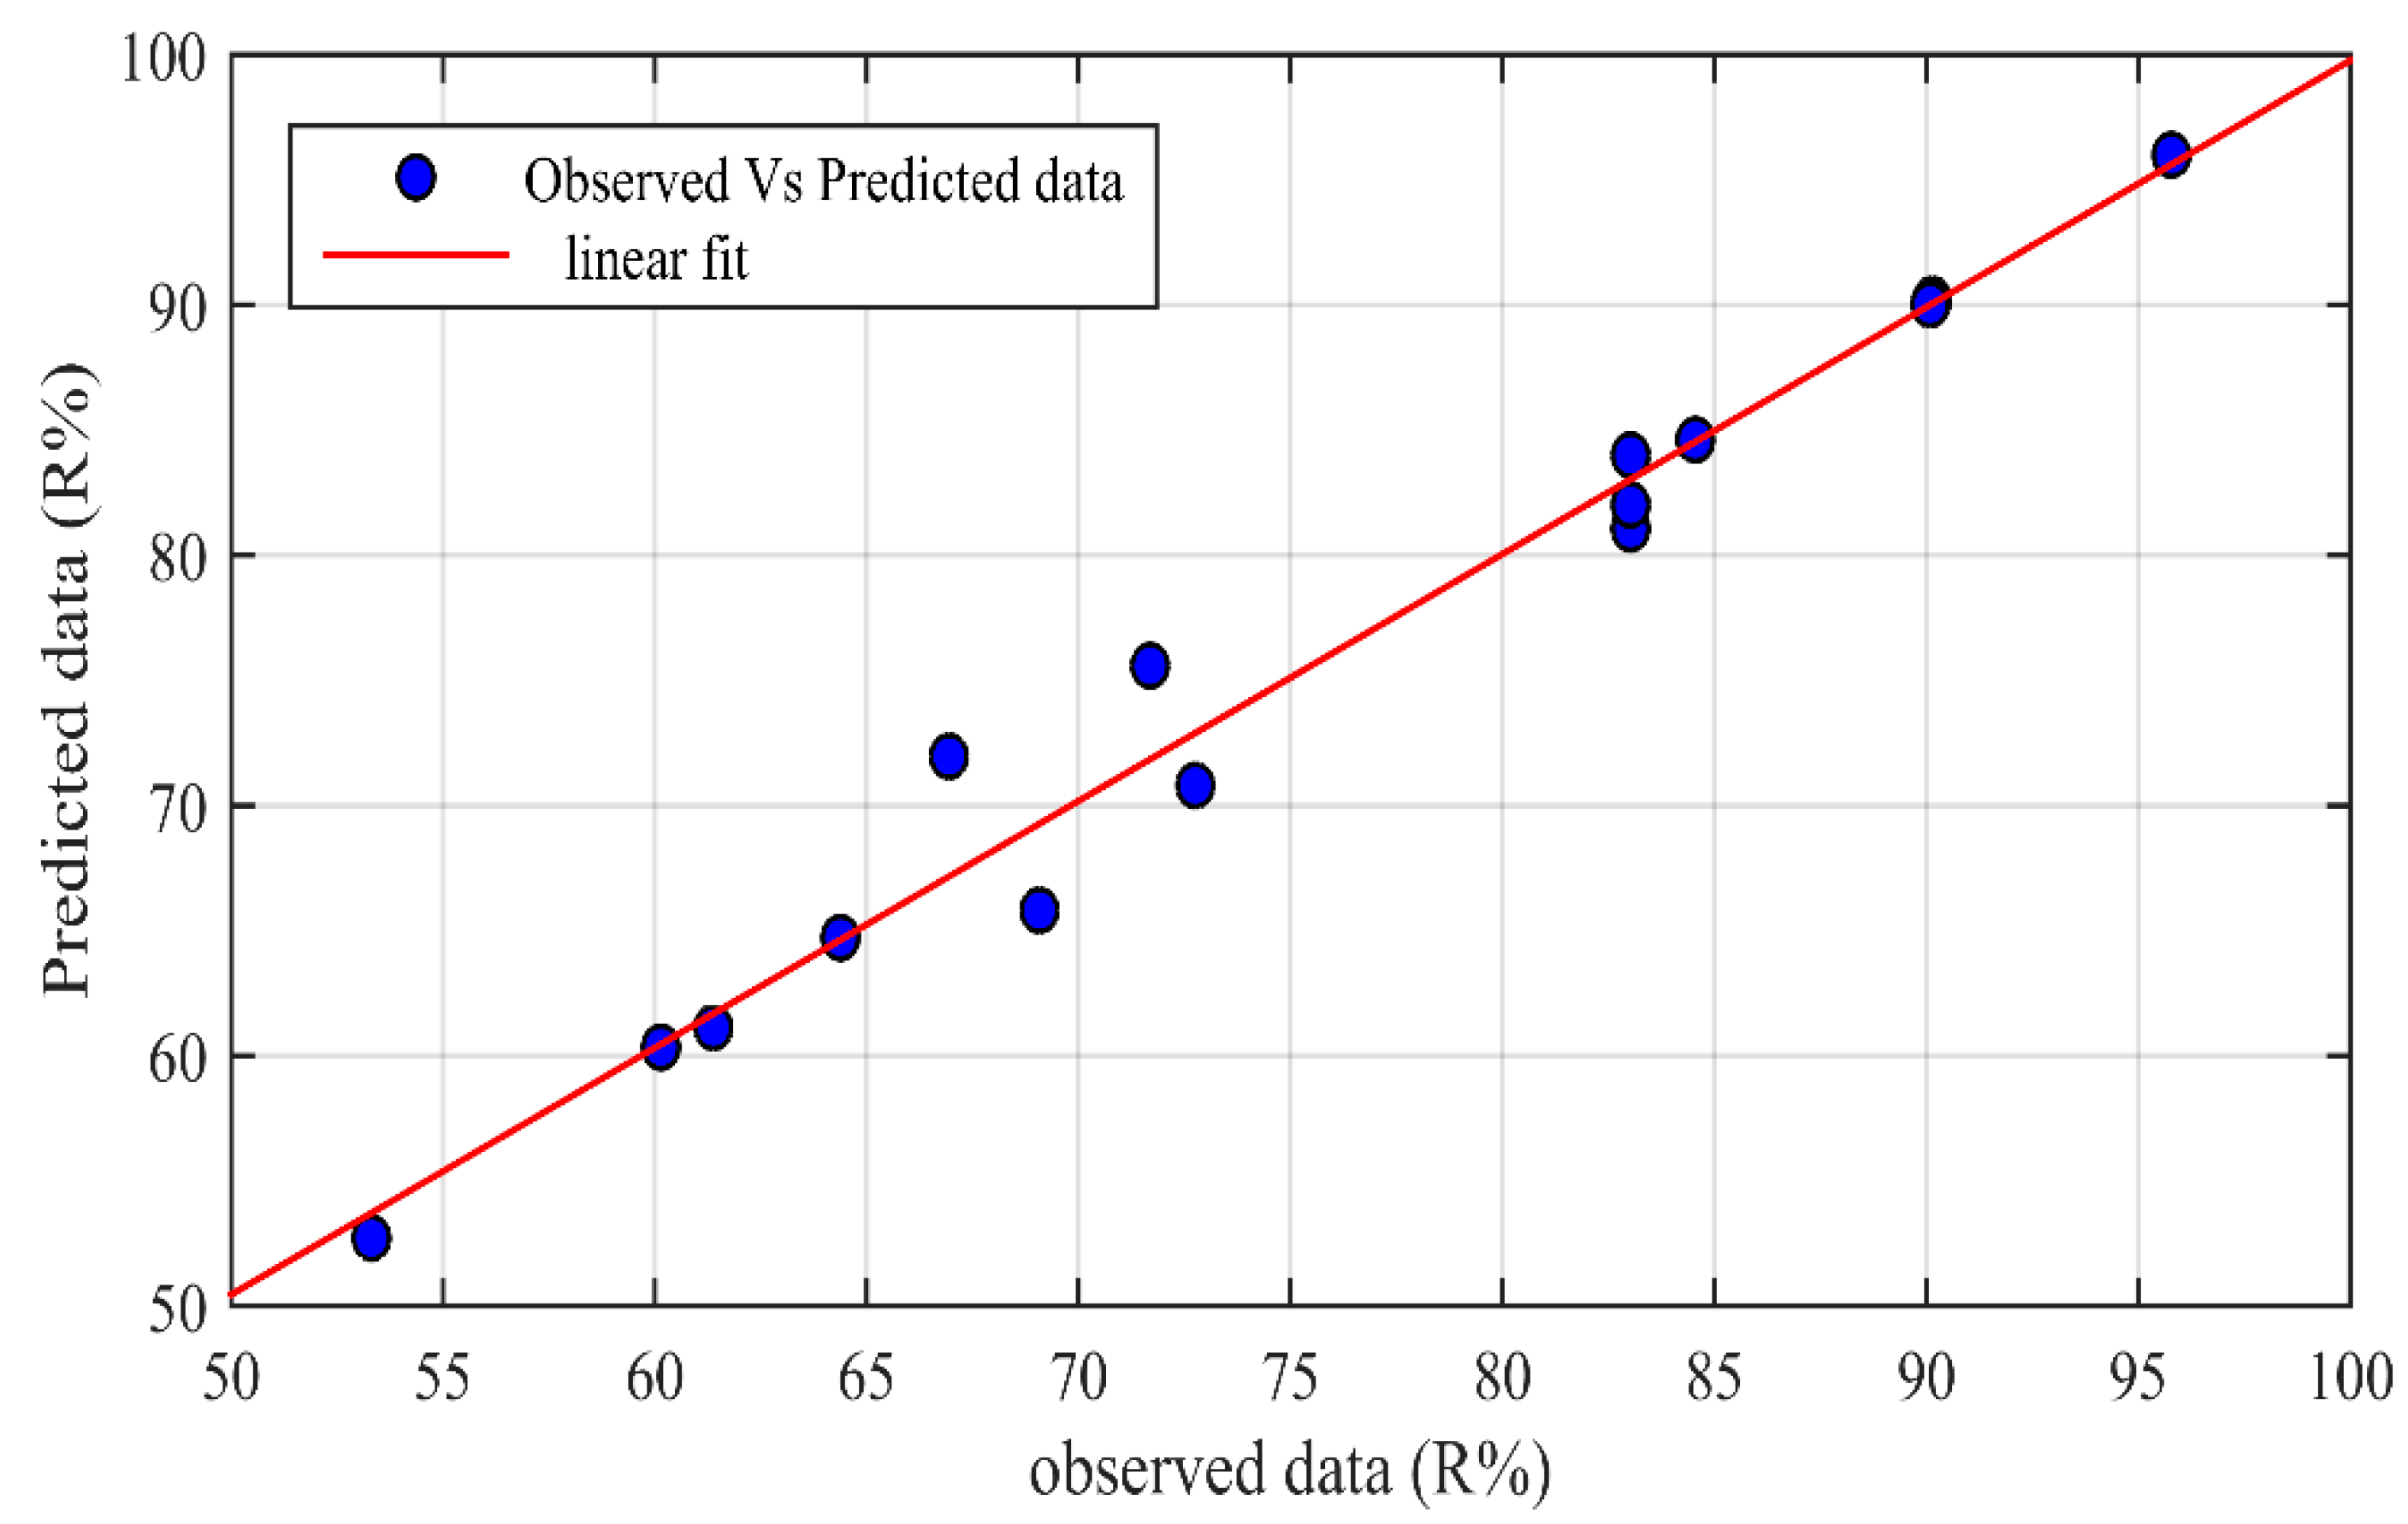
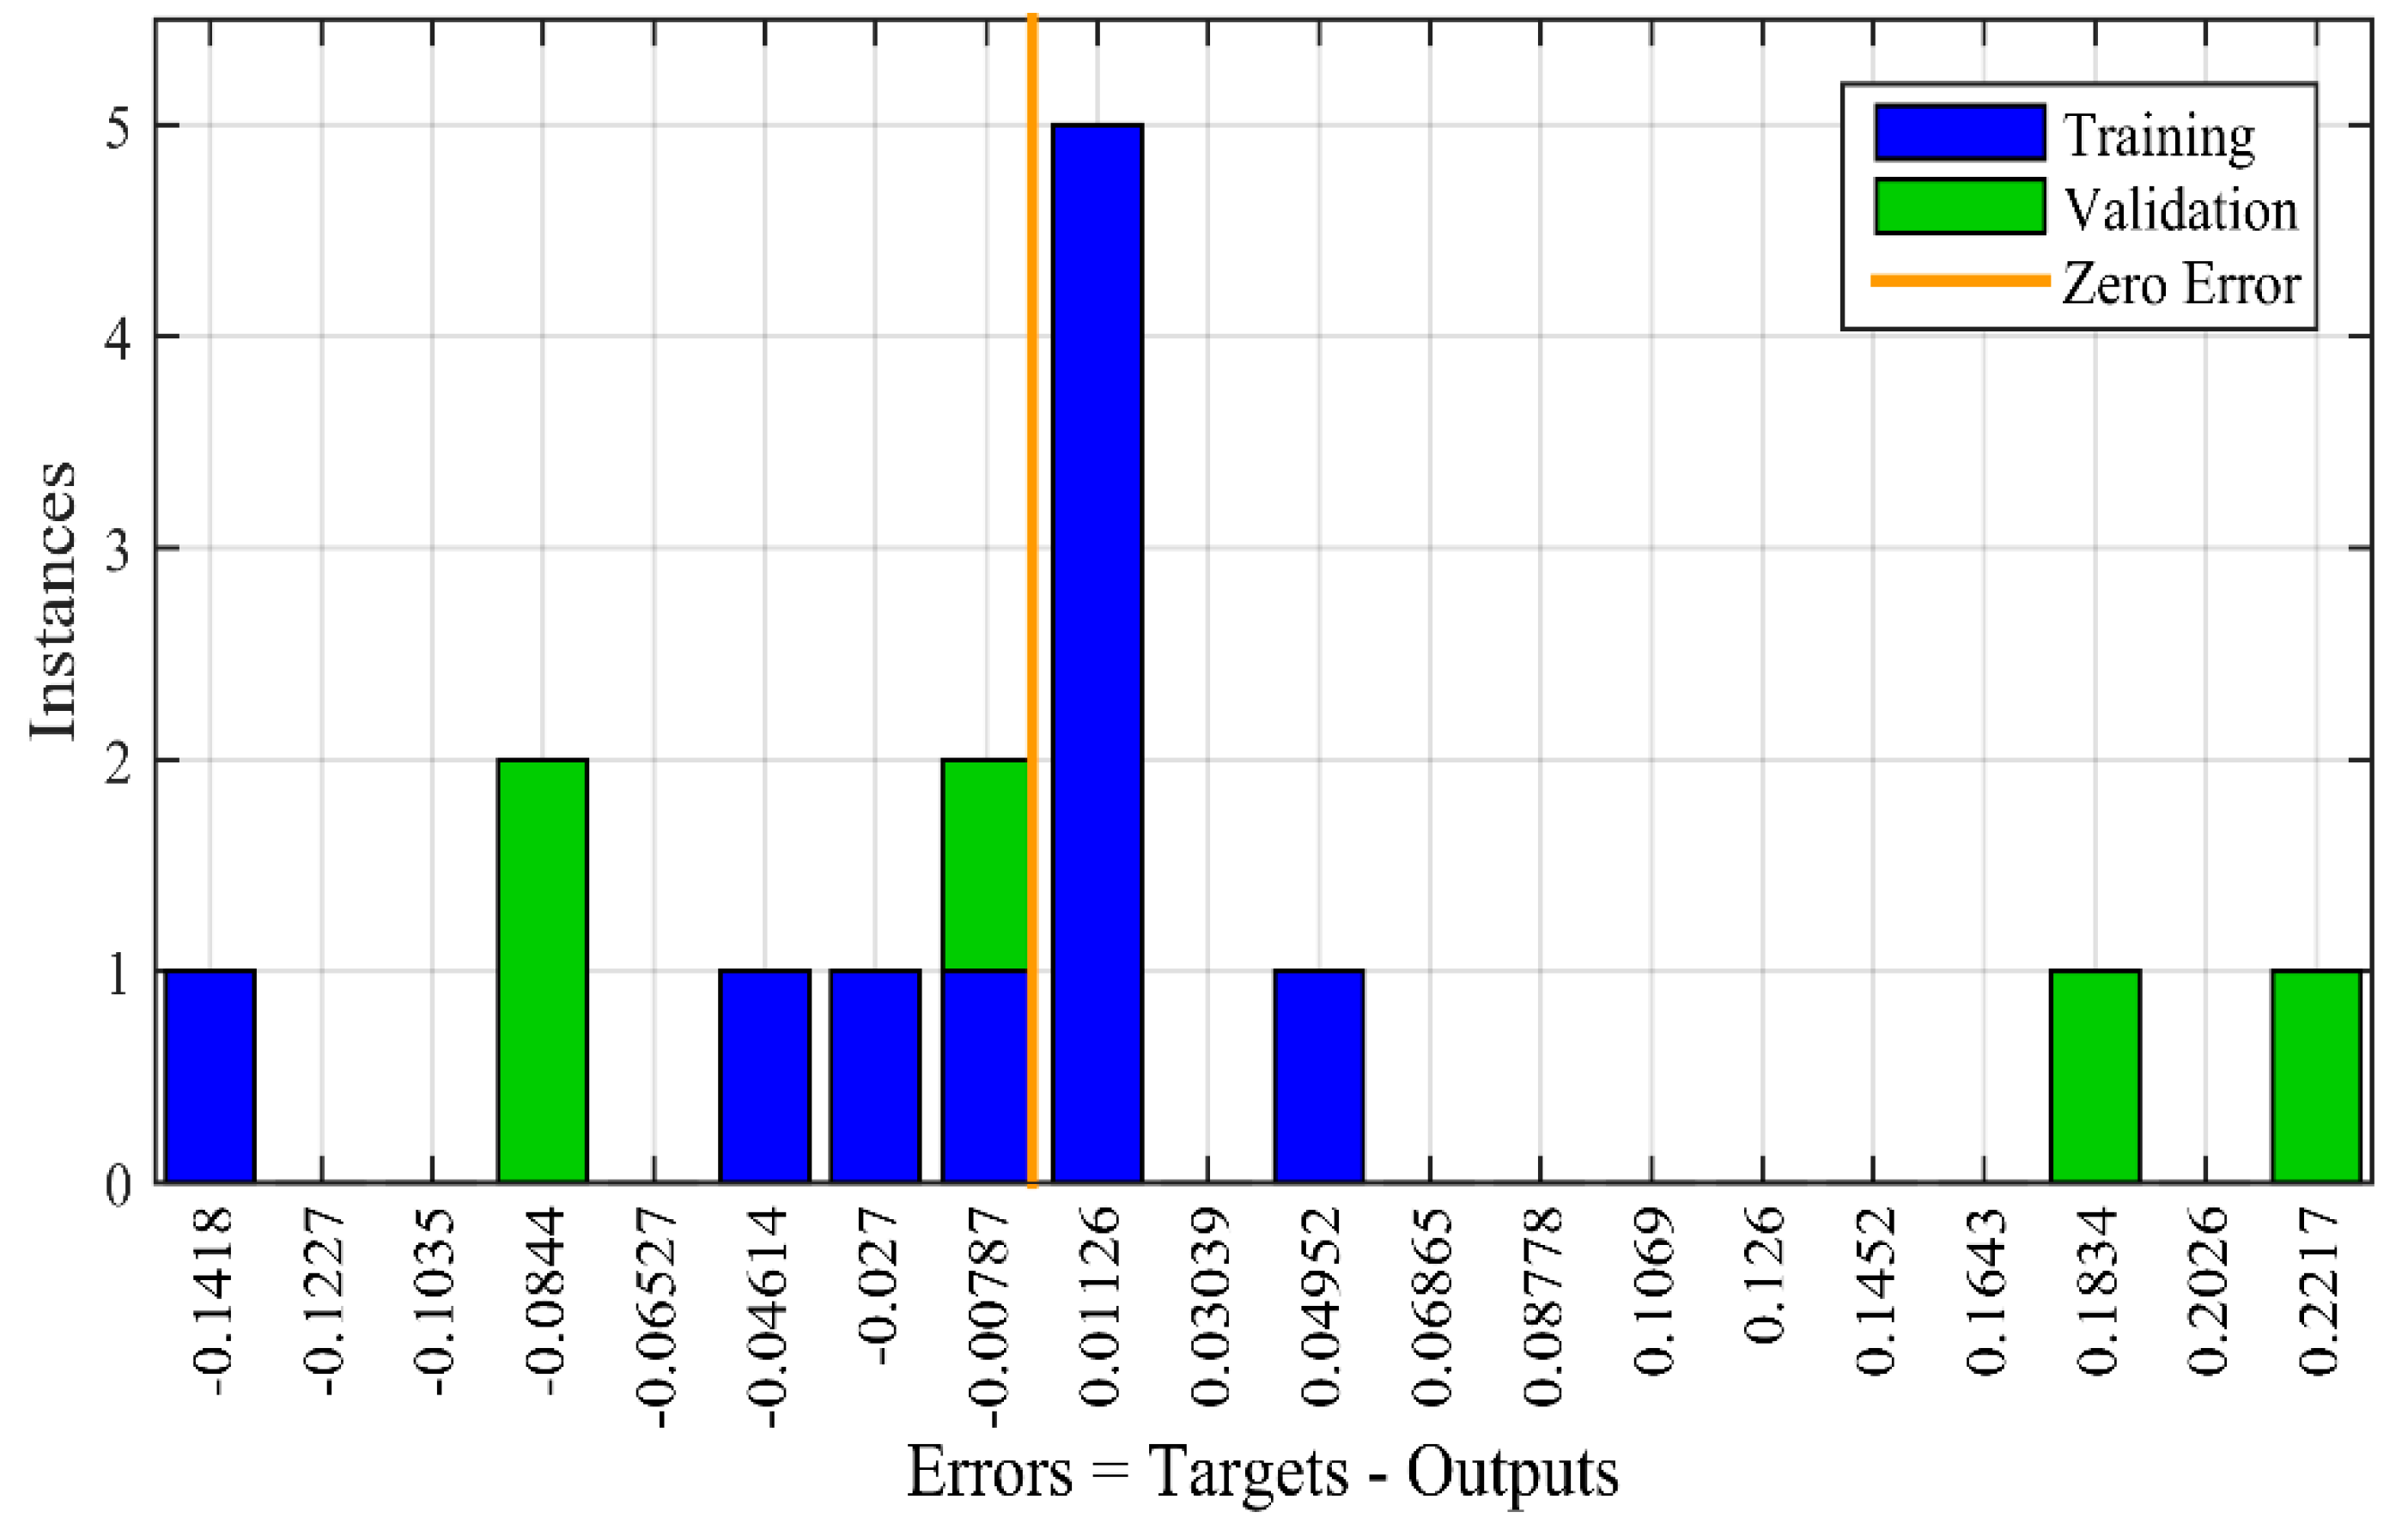
3.1. ANN Performance

The performance of the model was evaluated based on the variation of the mean squared error (MSE) as a function of the number of training cycles. As shown in Figure 3, the training stopped after three epochs, and the best validation performance was 0.02 at epoch 1. In addition, Figure 4 shows the regression plot for the model. R2 values for both the training and validation sets are above 90%, which indicates the high accuracy of the ANN model [14].

3.2. Mathematical Model Development

For the development of a mathematical model for data prediction, the simulated ANN was transformed into a mathematical equation that relies on the input variables with the output variable, based on the weights and biases extracted from the model in conjunction with the transfer function. The overall equation can be written as follows [10]:
y = b 0 + k = 1 n w k × f s i g b n k + i = 1 m w i k × X i
where b0 is the bias in the output layer, n is the number of neurons in the hidden layer, wk is the connection weights between the hidden and output layers, fsig is the transfer function, bnk is the bias at each neuron in the hidden layer, m is the number of neurons in the input layer, wik is the connection weights between the input and hidden layers, Xi is the normalized input data, and y is the normalized output data.
In the present paper, the mathematical model was constructed based on the weights and biases extracted from the 3-12-1 ANN model. The extracted values of biases and weights are presented in Table 2.
Using the information mentioned in Table 2, the Equation (3) is transformed into the Equation (4) as follows:
R n o r = b 0 + i = 1 n B n
Bn is unknown and can be calculated using Equation (5):
B n = w n o u t p tanh A n
An is also unknown and can be calculated using Equation (6):
A n = b n k + w n i n p I C + w n i n p A d + w n i n p p H
where IC is the initial concentration, Ad is the adsorbent dosage, n is the number of neurons, and wn-in p and wn-outp are the connection weights in the input and output layers, respectively. The final equation used for predicting the nickel removal after de-normalizing the data is presented as follows:
R ( % ) = 21.635 R n o r + 74.365

4. Discussion

4.1. ANN Validation

In order to validate this model, it was tested for predicting the adsorption efficiency and compared to the original data. Figure 5 shows the original data compared to the predicted data, and Figure 6 shows their error histogram. It is observed that the data follow a straight line with an R2 value of 0.98, indicating the validation and high accuracy of the model. Furthermore, the error between the output and the target is very low. Therefore, the model can be chosen as appropriate for predicting future data.

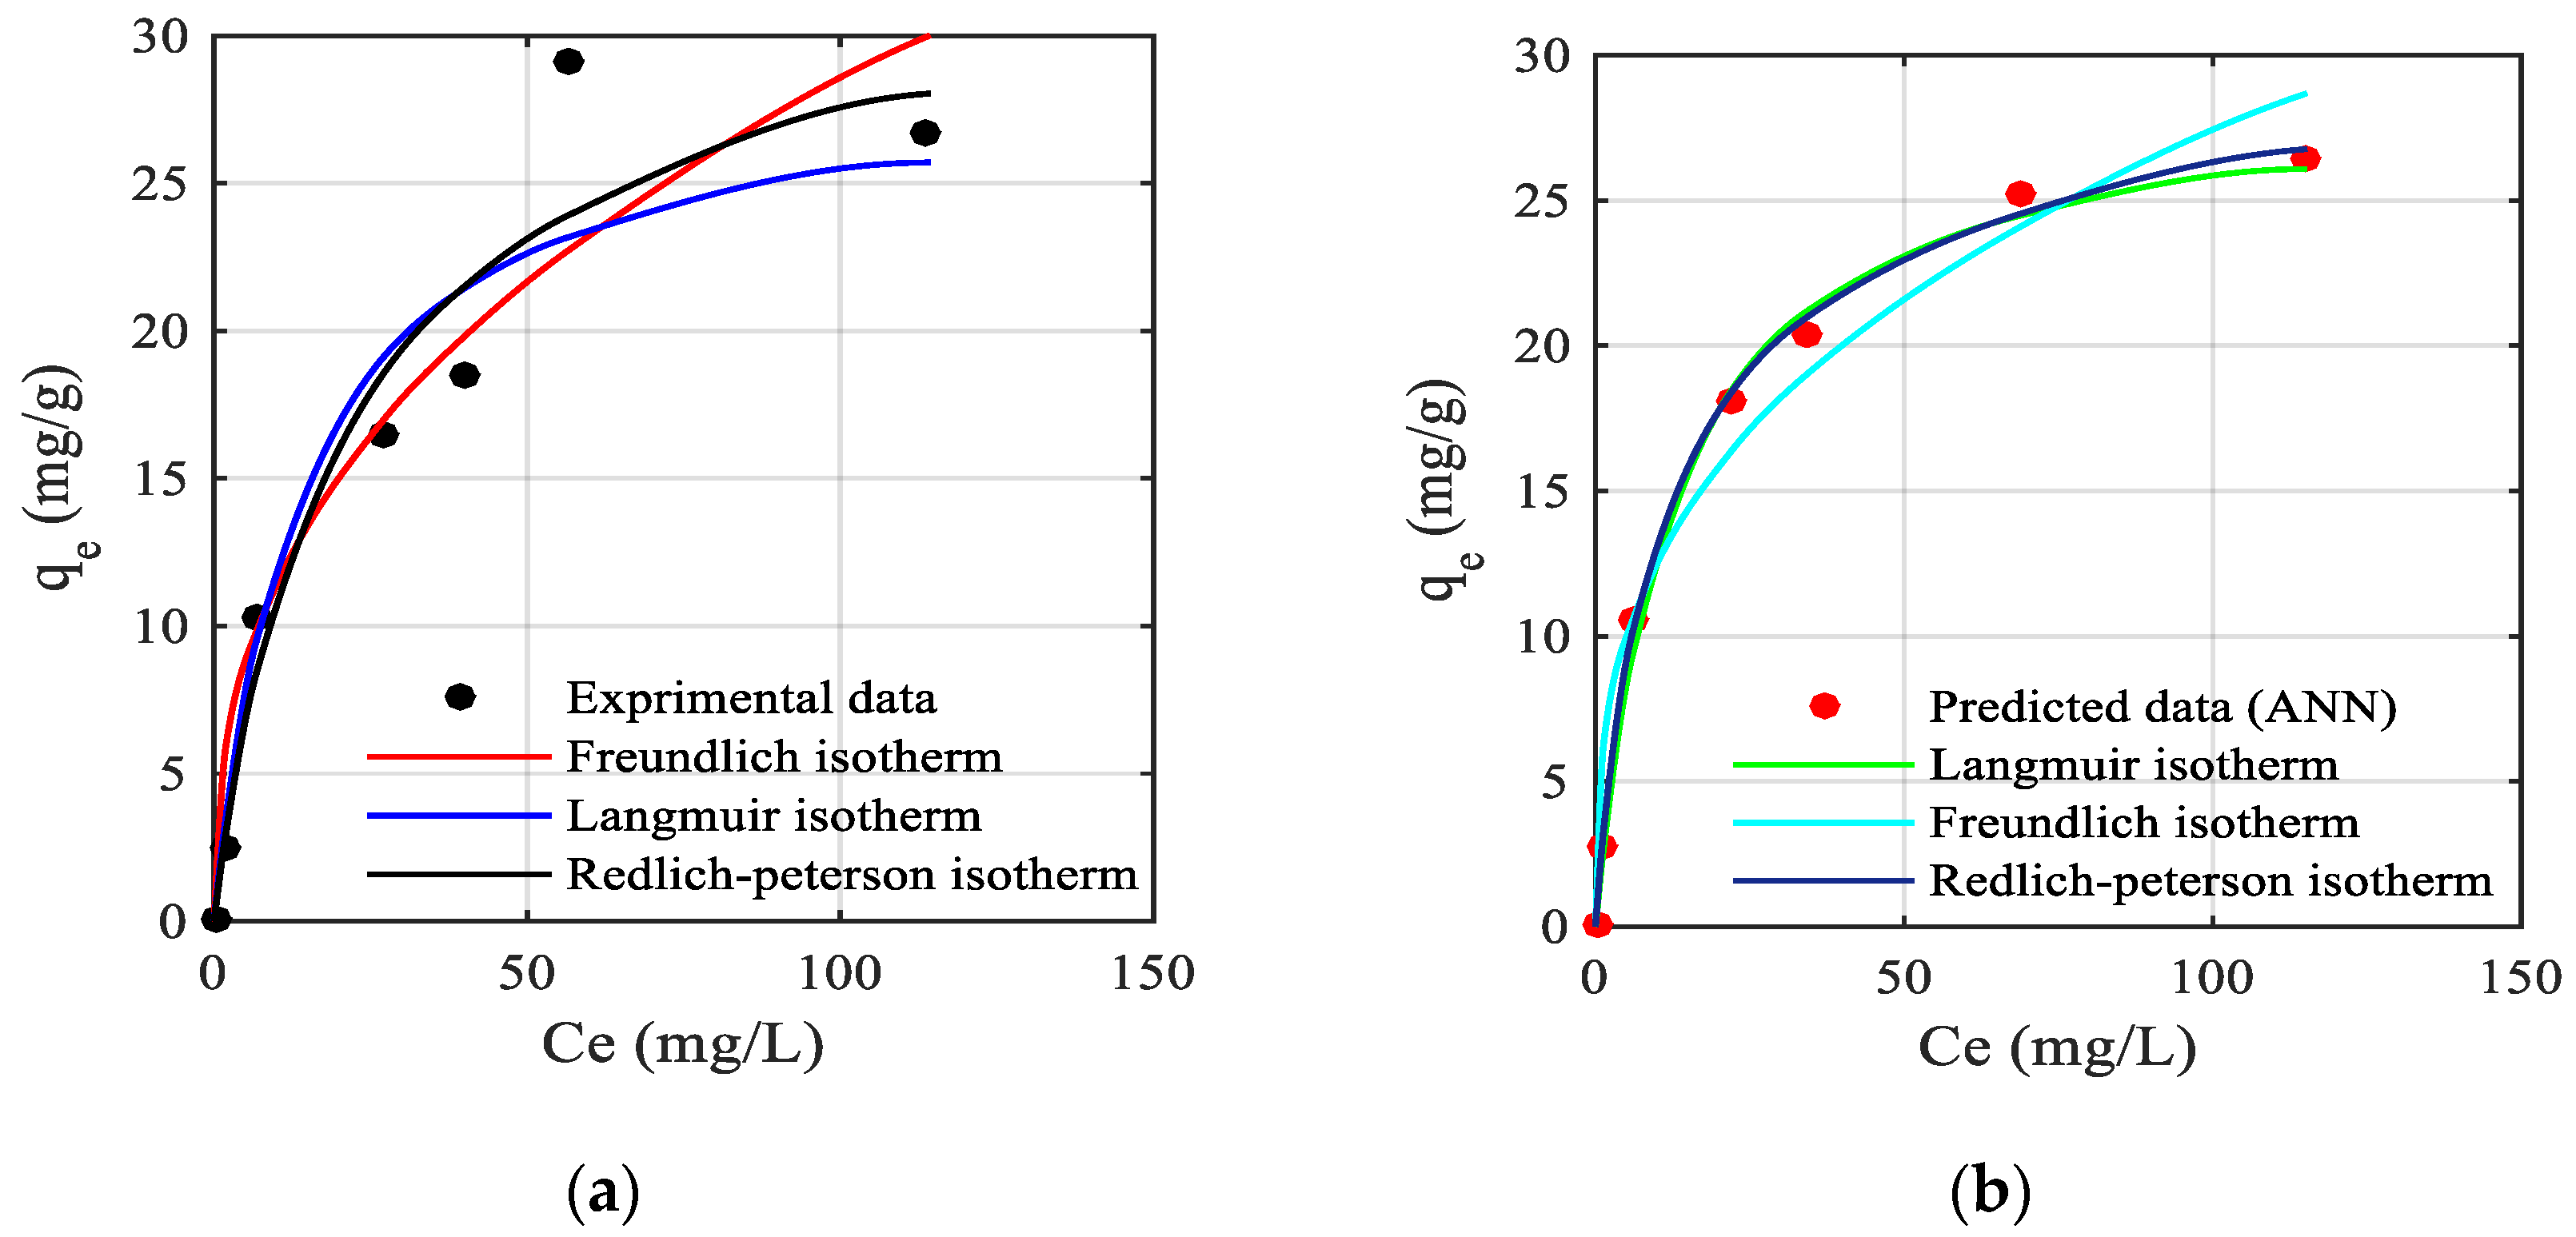
4.2. Isotherm Prediction

To confirm the accuracy of the model for an important study on the adsorption process, the model was tested for predicting the data for an isotherm study, and the obtained results were compared to the original results. Figure 7 shows the predicted isotherm plot (Figure 7b) against the original isotherm plot (Figure 7a), and Table 3 summarizes the predicted isotherm parameters.
One can see from Figure 7 and Table 3 that the best isotherm model to fit the predicted data by the ANN model was the Redlich–Peterson isotherm, which has the highest correlation coefficient of 0.996, an adjusted R2 of 0.993, and the lowest ARE and RMSE values. These results are very consistent with the experimental results. In addition, the predicted maximal adsorption capacity (Qm = 28.92) was very close to the experimental value (Qm = 28.79), with a standard deviation of−0.13. As a result, the developed ANN model was a valid and appropriate model for nickel-adsorption data prediction.

5. Conclusions

In this work, an ANN model was developed for nickel-adsorption data prediction. The latter was transformed into a simple mathematical equation that correlated the input with the output data using the weights and biases extracted from the model. The ANN model showed a high R2 of 0.98, which indicates the high accuracy of the model. In addition, the model was tested for isotherm data prediction, where the prediction data were in agreement with the experimental data. The developed ANN model was accurate and appropriate for nickel-adsorption data prediction.

Author Contributions

B.M. edited, conceptualized, and visualized the work; H.B. and L.M. conceptualized, visualized, and supervised the work; D.B.-I. reviewed and edited the paper. All authors have read and agreed to the published version of the manuscript.

Funding

This research received no external funding.

Institutional Review Board Statement

Not applicable.

Informed Consent Statement

Not applicable.

Data Availability Statement

Not applicable.

Acknowledgments

The authors would like to thank all who have contributed to this work. University of Bejaia, Ministry of Education, Science and Technological Development of Algeria.

Conflicts of Interest

The authors declare no conflict of interest.

References

  1. Qiu, W.; Zheng, Y. Removal of lead, copper, nickel, cobalt, and zinc from water by a cancrinite-type zeolite synthesized from fly ash. Chem. Eng. J. 2009, 145, 483–488. [Google Scholar] [CrossRef]
  2. Wang, S.; Peng, Y. Natural zeolites as effective adsorbents in water and wastewater treatment. Chem. Eng. J. 2010, 156, 11–24. [Google Scholar] [CrossRef]
  3. Pauletto, P.; Dotto, G.; Salau, N. Diffusion mechanisms and effect of adsorbent geometry on heavy metal adsorption. Chem. Eng. Res. Des. 2020, 157, 182–194. [Google Scholar] [CrossRef]
  4. Mehdi, B.; Belkacemi, H.; Brahmi-Ingrachen, D.; Braham, L.; Muhr, L. Study of nickel adsorption on NaCl-modified natural zeolite using response surface methodology and kinetics modeling. Groundw. Sustain. Dev. 2022, 17, 100757. [Google Scholar] [CrossRef]
  5. Ahmad, R.; Mirza, A. Adsorptive removal of heavy metals and anionic dye from aqueous solution using novel Xanthan gum-Glutathione/ Zeolite bionanocomposite. Groundw. Sustain. Dev. 2018, 7, 305–312. [Google Scholar] [CrossRef]
  6. Saravanan, A.; Sundararaman, T.; Jeevanantham, S.; Karishma, S.; Kumar, P.; Yaashikaa, P. Effective adsorption of Cu(II) ions on sustainable adsorbent derived from mixed biomass (Aspergillus campestris and agro waste): Optimization, isotherm and kinetics study. Groundw. Sustain. Dev. 2020, 11, 100460. [Google Scholar] [CrossRef]
  7. Neag, E.; Török, A.; Tanaselia, C.; Aschilean, I.; Senila, M. Kinetics and equilibrium studies for the removal of Mn and Fe from binary metal solution systems using a Romanian thermally activated natural zeolite. Water 2020, 12, 1614. [Google Scholar] [CrossRef]
  8. Narayana, P.; Maurya, A.; Wang, X.; Harsha, M.; Srikanth, O.; Alnuaim, A.; Hatamleh, W.; Hatamleh, A.; Cho, K.; Paturi, U.; et al. Artificial neural networks modeling for lead removal from aqueous solutions using iron oxide nanocomposites from bio-waste mass. Environ. Res. 2021, 199, 111370. [Google Scholar] [CrossRef] [PubMed]
  9. Souza, P.; Dotto, G.; Salau, N. Artificial neural network (ANN) and adaptive neuro-fuzzy interference system (ANFIS) modelling for nickel adsorption onto agro-wastes and commercial activated carbon. J. Environ. Chem. Eng. 2018, 6, 7152–7160. [Google Scholar] [CrossRef]
  10. Lawal, A.; Idris, M. An artificial neural network-based mathematical model for the prediction of blast-induced ground vibrations. Int. J. Environ. Stud. 2020, 773, 18–334. [Google Scholar] [CrossRef]
  11. Ke, B.; Nguyen, H.; Bui, X.; Bui, H.; Nguyen-Thoi, T. Prediction of the sorption efficiency of heavy metal onto biochar using a robust combination of fuzzy C-means clustering and back-propagation neural network. J. Environ. Manage. 2021, 293, 112808. [Google Scholar] [CrossRef] [PubMed]
  12. Khandanlou, R.; Masoumi, H.F.; Ahmad, M.; Shameli, K.; Basri, M.; Kalantari, K. Enhancement of heavy metals sorption via nanocomposites of rice straw and Fe3O4 nanoparticles using artificial neural network (ANN). Ecol. Eng. 2016, 91, 249–256. [Google Scholar] [CrossRef]
  13. Guo, X.; Wang, J. Projecting the sorption capacity of heavy metal ions onto microplastics in global aquatic environments using artificial neural networks. J. Hazard. Mater. 2021, 402, 123709. [Google Scholar] [CrossRef] [PubMed]
  14. Yildiz, S. Artificial Neural Network approach for modeling of Ni (II) adsorption from aqueous solution by peanut schell. Ecol. Chem. Eng. S 2018, 25, 581–604. [Google Scholar] [CrossRef]
Figure 1. 3-12-1-ANN model architecture.
Psf 06 00004 g001
Figure 2. Evaluation of training and validation RMSE values against hidden layer numbers.
Psf 06 00004 g002
Figure 3. Performance of the ANN model.
Psf 06 00004 g003
Figure 4. Regression plot of the ANN model.
Psf 06 00004 g004
Figure 5. Observed vs. predicted data of the ANN model.
Psf 06 00004 g005
Figure 6. Errors histogram of the training and validation sets of the ANN model.
Psf 06 00004 g006
Figure 7. Isotherm plot with different models: (a) isotherm plot of the original data (modified after [4]); (b) isotherm plot of predicted data.
Psf 06 00004 g007
Table 1. Data ranges used for ANN model development (modified after [4]).
Input DataRangeOutput
MinMaxMeanNickel removal (R %)
Initial concentration (mg/L)1015080
Adsorbent dosage (mg/g)0.10.50.3
pH364.5
Table 2. Extracted weights and biases of the ANN model.
n 1WeightsBiases
Ic 2Ad 3pHR (%)bnkb0
n = 12.531.630.870.09−3.26−0.18
n = 22.401.44−1.56−0.05−2.61
n = 31.731.06−2.48−0.79−2.03
n = 42.591.10−1.490.47−1.52
n = 5−0.17−2.19−2.290.650.89
n = 62.16−0.132.36−0.38−0.28
n = 7−0.892.172.410.72−0.33
n = 8−1.52−1.39−2.43−0.17−0.94
n = 9−0.01−3.050.98−0.50−1.43
n = 10−2.21−1.02−2.100.20−2.00
n = 112.512.01−0.56−0.782.54
n = 12−2.56−1.850.23−0.33−3.23
1 Neurons number. 2 Initial concentration. 3 Adsorbent dosage.
Table 3. Predicted isotherm parameters using ANN model.
Isotherm ModelIsotherm ParametersR2adjR2RMSEARE
Langmuir isothermQmK1 0.9930.9910.850.54
28.92 (mg/g)0.08
(L/mg)
Freundlich isothermKfnf 0.940.922.470.81
5.742.95
Redlich–Peterson isothermarpkrpβ0.9960.9930.740.50
0.153.050.91
Disclaimer/Publisher’s Note: The statements, opinions and data contained in all publications are solely those of the individual author(s) and contributor(s) and not of MDPI and/or the editor(s). MDPI and/or the editor(s) disclaim responsibility for any injury to people or property resulting from any ideas, methods, instructions or products referred to in the content.

