
Model Selection in the World of Maximum Entropy †


Institute for Medical Bioinformatics and Biostatistics, Philipps-Universität Marburg, Hans-Meerwein-Straße 6, 35032 Marburg, Germany
*
Author to whom correspondence should be addressed.
†
Presented at the 41st International Workshop on Bayesian Inference and Maximum Entropy Methods in Science and Engineering, Paris, France, 18–22 July 2022.
Phys. Sci. Forum 2022, 5(1), 28; https://doi.org/10.3390/psf2022005028
Published: 14 December 2022
(This article belongs to the Proceedings of The 41st International Workshop on Bayesian Inference and Maximum Entropy Methods in Science and Engineering)
Abstract
:Science aims at identifying suitable models that best describe a population based on a set of features. Lacking information about the relationships among features there is no justification to a priori fix a certain model. Ideally, we want to incorporate only those relationships into the model which are supported by observed data. To achieve this goal the model that best balances goodness of fit with simplicity should be selected. However, parametric approaches to model selection encounter difficulties pertaining to the precise definition of the invariant content that enters the selection procedure and its interpretation. A naturally invariant formulation of any statistical model consists of the joint distribution of features, which provides all the information that is required to answer questions in classification tasks or identification of feature relationships. The principle of Maximum Entropy (maxent) offers a framework to directly estimate a model for this joint distribution based on phenomenological constraints. Reformulating the inverse problem to obtain a model distribution as an under-constrained linear system of equations, where the remaining degrees of freedom are fixed by entropy maximization, tremendously simplifies large-N expansions around the optimal distribution of Maximum Entropy. We have exploited this conceptual advancement to clarify the nature of prominent model-selection schemes providing an approach to systematically select significant constraints evidenced by the data. To facilitate the treatment of higher-dimensional problems, we propose hypermaxent—a clustering method to efficiently tackle the maxent selection procedure. We demonstrate the utility of our approach by applying the advocated methodology to analyze long-range interactions from spin glasses and uncover three-point effects in COVID-19 data.
1. Introduction
Widespread use of parametric models enabled the tremendous success of machine learning to classify objects and to uncover relationships between the characteristics of these objects based on data. Choosing ad hoc an appropriate parametric model remains a challenge in many applications, especially if the target distribution does not belong to the exponential family. This can be attributed to the intrinsically non-linear formulation of parametric models and reparametrization symmetries, which render the precise definition and interpretation of their invariant content difficult. Together, these difficulties add to the challenge of selecting the optimal model which encompasses all relevant relationships evidenced by the data.
In model selection, different methods are commonly invoked, such as the Bayesian Information Criterion (bic) or the Akaike Information Criterion (aic), and statistical tests such as the log-likelihood ratio test. Essentially, they all try to balance the goodness of fit to the data with the number of model parameters. A goal that becomes particularly difficult with increasing model complexity, which is warranted by larger datasets unveiling more complex relationships. In the literature, there is no consensus about the best approach. Applied to parametric models, even the derivation of these scores requires further assumptions which are difficult to motivate based on data. Hence, it is not surprising that an intuitive explanation why these approaches should select an optimal model is still lacking.
Recently, we have reformulated the inverse problem to identify the joint distribution of Maximum Entropy under phenomenological constraints [1]. This led to the insight that phenomenological observations are related to the joint distribution via an invariant system of under-constrained linear equations, where a unique solution can be always found by maximizing the entropy. With this linear ansatz at hand, we can robustly define modeling architectures and as a consequence derive and understand many information-theoretic measures, scores and statistical tests.
In the large-N expansion around the maxent distribution, we have used [2] the distribution over all distributions that satisfy the provided set of phenomenological constraints to pave the way towards systematic model selection. A deductive logic dictates how to compare and meaningfully perform selection of significant constraints that can be distinguished from sampling noise in a data-driven fashion in order to draw conclusions on the association structure in the underlying system. In particular, the maxent framework gives a clear meaning to statistical tests and information criteria used in the parametric context, since the maxent distribution satisfying the selected set of constraints can be a posteriori parametrized in terms of Lagrange multipliers corresponding to those constraints.
Exploiting the insights and flexibility of constraint-based model selection we suggest hypermaxent—a clustering algorithm that tries to deduce significant associations from data in a higher-dimensional problem by adaptively decomposing it into smaller inverse problems. We benchmark its applicability by analyzing long-range interactions from simulated spin glasses. Subsequently, we turn to biomedical data and probe a three-point effect in covid-19 records from publicly accessible databases. In the spirit of maxent logic, there is no prior assumption on the association structure governing patient profiles, so that the uncovered effect constitutes a story solely told by the data. This further highlights the merits of our framework, especially in the big-data era where larger data sets enable the distinction of higher-order effects from mere sampling noise.
2. Theory of Constraint Selection
In many phenomenological studies, probability distributions over physical realizations of categorical features are investigated. We enumerate realizations in the microstate space by index so that any distribution may be viewed as a -dimensional vector with and normalization condition on the sum of all its entries. It is straight-forward to extend the developed formalism to include (structural zeros). A set of N observations that are summarized by moments of (possibly) various orders described by vector constrains admissible distributions via
where denotes the invariant form mapping probabilities from to moments with . Obviously, admits the observed counts as unique solution to which we associate the empirical distribution . By definition, the latter is always a solution to the constraint system.
For a generically under-constrained architecture and given the corresponding moment vector , there always exists a unique distribution satisfying the linear system (1) that maximizes Shannon’s differential entropy
This special solution, called maxent distribution [3], is the least-biased distribution incorporating only knowledge of provided observations and nothing more, hence being the most representative of the solution set to phenomenological problem (1). This becomes asymptotically clear, since the (combinatorial) probability density to observe any other viable distribution in the solution set,
is determined [4] by the difference of its entropy from the maxent. Higher corrections to the chi-squared distribution (3) are suppressed by powers of .
Exploiting the radial symmetry of density (3), we can compute the p-value to observe under the maxent model any other distribution satisfying the phenomenological constraints. Generally, having degrees of freedom and critical value it is given by the cumulative distribution of chi-squared:
Most interestingly, we focus on the probability to observe the empirical counts , where
describe the degrees of freedom that remain unfixed by phenomenological problem (1) and the critical value determined by the empirical entropy difference, respectively. Simplicity dictates to decide in favor of the simplest set of constraints under which the empirical distribution still has a p-value above a prespecified acceptance threshold.
Similarly, two architectures and inducing nested solution sets can be compared using the difference of their ranks and the difference of their respective maxent s to evaluate the integral in (4):
where denote the maxent distribution associated to architectures and , respectively. This selection of model architectures reproduces [2] the likelihood ratio test in the maxent framework reducing to the empirical test (5) for and . It turns out that accepting deduced by simpler architecture as representative of all distributions satisfying the additional constraints in , whenever p-value (4) lies above , exhibits the appropriate scaling by consistently identifying the asymptotic model. In particular, the inverse-N scaling seems to be necessary to ensure the appropriate asymptotic limit, so that removal of any asymptotic constraint immediately drops the p-value below the threshold. Of course, other acceptance thresholds might be used, depending on the objectives of the modeler. At a given sample size N, higher thresholds promote more complex models raising the number of false-positive associations.
3. Higher-Dimensional Problems
It is often desirable to analyze associations among a large number of categorical features simultaneously. This poses an obvious practical problem: the exponential growth of the microstate space quickly hinges upon—especially memory—limitations posed even by state-of-the-art computer hardware. Consequently, deducing the maxent distribution by iteratively updating the uniform ansatz according to
in terms of the—invertible whenever is of full row-rank—matrix
becomes practically impossible. In the literature, there exists [5] a plethora of both systematic as well as more heuristic methods trying to approximate aspects of maxent distributions. In most cases however, such approximative methods are concerned and/or rely on limiting assumptions such as that of pairwise interactions.
As we aim at probing significant constraints in a data-driven manner, we refrain from assuming anything about the underlying association structure beyond the number of features L and number of states each feature may assume. This exposes another practical limitation related to hypergraph classification which appears already before memory limitations (due to the exponential growth of the microstate space) manifest. For example, classifying architectures depicting marginal constraints at the level of features requires finding all distinct hypergraphs that contain no nested hyperedges. This problem would naively scale as , but as higher marginals imply all lower marginals, the actual number of hypergraphs leading to distinct architectures is significantly less. Still, the np completeness of such classification tasks is generically expected to manifest before the exponential growth of .
At a more fundamental level, a considerable part of the microstate space must be first sampled to be able to draw decisions using the powerful maxent toolkit outlined in Section 2. In a biomedical application with 33 binary features for instance, exceeds the whole earth population, though. As many realistic applications have to deal with finite populations, undersampling pragmatically limits full classification of possible architectures in higher-dimensional problems, in most cases already before memory limitations kick in.
- Adaptive clustering. To circumvent both finite sampling and hardware limitations we shall rely on some adaptive clustering scheme. The main idea is summarized by probing constraints in smaller sets of the L features and adaptively building up bigger clusters. In a smaller cluster of features, we anticipate that most features would not appear significantly associated, if they were not directly associated to begin with. On the other hand, more constraints might appear significant, because (a) the finite sample explores larger portions of the smaller microstate space and (b) some dominant effects are induced by marginalizing over the other features. A significant constraint hints towards feature association, which we can denote by a hyperedge entailing all participating feature vertices. In that way, one obtains a hypergraph in the L features providing a first estimation of their associations.
Hopefully, the resulting hypergraph decomposes into fully-connected sub-hypergraphs of tractable dimension, which are formed by combining all the association hints from constraint selection in the first step. If tractability is not achieved, one needs to increase the cluster size in regions of features where a dense association network has been detected and repeat the previous step. Within tractably bigger clusters now, the maxent logic is expected to explain effective associations previously uncovered in smaller clusters via confounding to intermediate features in the bigger formation generically reducing the number of significant constraints. However, if some higher-order association is indeed present in the underlying system, it cannot be excluded that constraints involving more features would appear significant, as long as the sample size offers enough evidence to distinguish them from noise.
Evidently, this clustering procedure tries to balance finite samples and limited resources against the formation of higher-dimensional clusters. It is expected [6] to converge to a handful of tractable sub-problems under the—often realistic—condition of an underlying network with sparse strong associations. Of course, cluster formation might be assisted by any geometric or other structural information available to the modeler, like in image recognition, mass spectrometry or protein folding.
- Contact prediction. To demonstrate the potential power of maxent clustering let us consider an one-dimensional spin glass comprising L sites with nearest-neighbor structure alongside some long-range interactions. Due to mediated interactions along the Ising chain, the association between two distant sites appears fuzzy in the inverse problem, as the truly interacting distant sites are not easily distinguishable from their nearest neighbors, which falsely appear to demonstrate long-range associations. Because the number of false positives can quickly scale in larger systems, we are specifically interested in detecting those non-trivial long-range interactions microscopically present.
As customary in condensed-matter literature, nearest-neighbor couplings are sampled from a Gaussian with mean J and variance. In this setting, we distinguish three regimes for pointing towards ferromagnetism: weak, intermediate and strong coupling (conversely high, moderate and low temperature). For simplicity, we assume no site-specific bias. In the pure spin glass without long-range interactions, the spin-spin correlation, when averaged over the Gaussian from which the couplings are drawn, scales as
with subleading corrections in and J. Motivated by this attenuation of correlations along the chain, we start to investigate pairs of spins differing at least by sites. Varying the cut-off we can later probe the resolution power of the clustering algorithm which evidently depends on the ferromagnetic coupling strength and N.
For concreteness, we take and free boundary conditions at the ends of the chain. We have generated instances of the spin glass at each with up to 10 randomly injected long-range couplings and sampled times from each instance. Using these 6000 Monte Carlo samples, and assuming geometric knowledge of the position of the sites along the chain (to be able to distinguish neighbors and impose a cut-off), we attempt to reconstruct the interaction map. As long as , i.e., avoiding the low-temperature regime, the algorithm precisely detects all long-range interactions and nothing more (e.g., using ). In the low-temperature regime, strongly correlated spins along the chain require a higher cut-off to avoid erroneous interactions, decreasing the resolution power of the clustering algorithm. Aside from the specifics of the adaptive clustering, the critical slowdown as the temperature approaches zero enhances finite-sampling effects, decreasing thus the sensitivity of model selection in general.
For demonstrative purposes, we look at one of the randomly generated spin-glasses with and four long-range interactions depicted in Figure 1 as a (hyper)graph. In the first pass along the chain, we look for significantly low p-values (5) under the independent-spins model among all distant pairs of spins differing more than sites. Keeping those pairs that appear significantly associated, three fully-connected clusters were found. In our statistical tests, we use an acceptance threshold that scales with as explained in Section 2. Already at the pairwise level, the hyper-maxent logic correctly detects the regions of the chain that are associated via long-range interactions. However, erroneous interactions (denoted by gray lines in Figure 1) appear due to marginalization over neighboring spins that are entailed in non-local interactions. Among all non-local associations found in the first pass, only the actual (anti)-ferromagnetic long-range interactions subsequently survive model selection: The nearest-neighbor model in each cluster with additionally all interactions found in the first pass has a finite p-value (6) under the simpler maxent model incorporating only nearest-neighbor and true long-range interactions. According to hypermaxent logic, the latter must be selected as optimal. Note that removing any of the true associations would immediately reduce the p-value far below the acceptance threshold.
The clustering algorithm adapts to the specifics of the problem using the maxent constraint selection as guiding principle. For this reason, hypermaxent can facilitate any order of actual or effective interactions with no modification in its algorithmic steps. Already in an ordinary spin glass with quadratic interactions, the hypergraph representation makes this higher-order possibility apparent. Even if we do not assume a nearest-neighbor structure in the second pass, we can test simpler models against the more complex model that incorporates all long-range associations previously found, where all architectures learn the empirical distribution within each local subcluster by heart. A local cluster is signified with a colored hyperedge in Figure 1. Using local distributions directly from the data amounts to claiming that a model with up to ℓ-th order interactions governs a subcluster with ℓ spins. As long as ℓ remains sufficiently small and N is large enough to justify the use of empirical distributions within smaller formations of spins, the conclusion of the cluster expansion remains unaltered.
4. Higher-Order Associations
In this section, we analyze covid-19 records from public databases. Specifically, we look at hospitalized patients that were admitted to the icu in Canada [7], USA [8] and Argentina [9]. From the provided de-identified data, we were able to minimalistically define a patient’s profile based on age (under/over 40) and sex (female/male). In addition, we used the record date to assign cases to pandemic waves (wild-type/alpha, delta and omicron), according to the prevalence of major variants of concern (voc) in different regions. To determine when a voc prevailed in a given country we use [10]. This allows us to align datasets from the three American countries in order to obtain—after removing missing/corrupted values—one dataset in four features with entries.
One epidemiological question of interest concerns the space-temporal variation of the profile of patients that were admitted to an icu due to covid-19 over pandemic waves and among countries. As a first line of attack, this could be quantified by plotting the relative risk (rr). Given age, sex and the country of residence, the risk to be hospitalized at an icu in the second and third wave compared to the beginning of the pandemic is defined as a probability ratio via
Analogously,
quantifies differences among countries. In the left column of Figure 2, the logarithm of such risk measures could be directly calculated from empirical distribution of the combined dataset. At this point, it is reasonable to first work with , as the dataset represents a considerable portion of the population (before data cleaning it is claimed to contain all cases recorded in the affected countries). Hence, statistical fluctuations due to finite sampling are expected to be minimal.
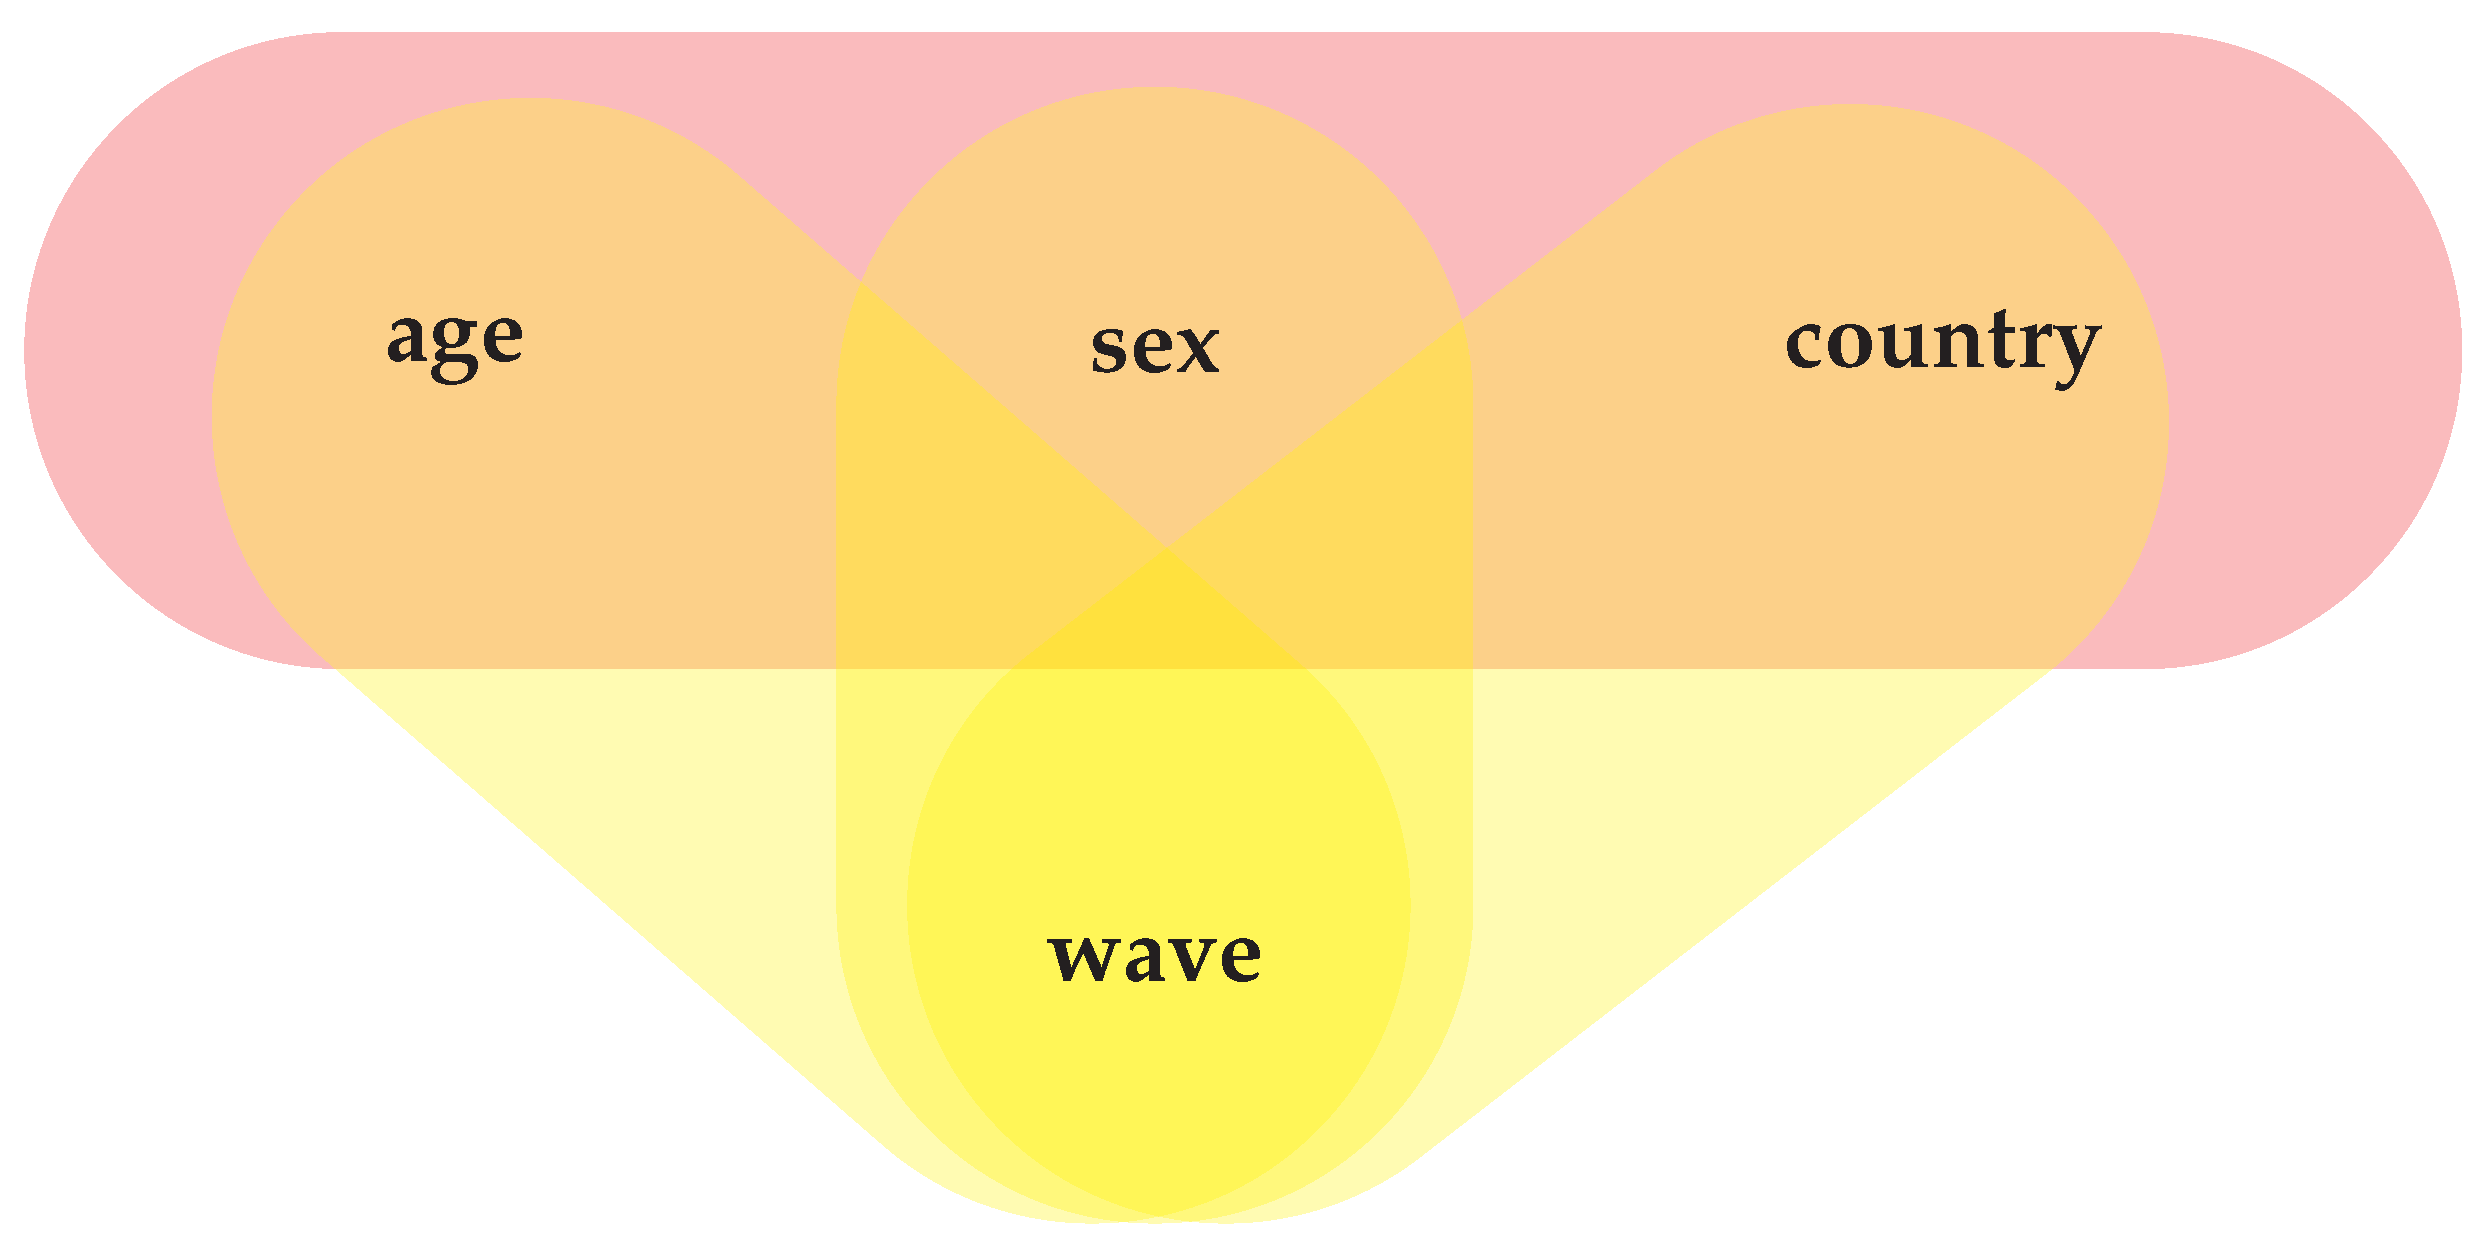
Generally, we recognize from the rr reduction in the upper-left plot that the first wave appears to be the most dangerous for all profiles in all three countries. From the lower plot on the left, we see a rr increase in the profiles from the USA compared to Canada over all waves, while the corresponding relative risk of profiles from Argentina fluctuates over the waves around the reference line. To systematically resolve significant differences in the various risks from accidental fluctuations biomedical research tries to uncover associations between the features under investigation. Starting from and the empirical distribution, we progressively remove constraints and compare models defined over the microstates. After classifying all possible architectures , there significantly remain three pairwise associations and one cubic effect depicted in the hypergraph of Figure 3. Incidentally, the same hypergraph exhibits the lowest Bayesian Information Criterion,
which essentially tells us to choose the architecture that maximizes density (3) and hence the integrand of (4) whenever evaluated at empirical distribution . Using the maxent distribution of the selected architecture, we calculate again relative risks (10) in the right column of Figure 2.
The upper-right plot clearly demonstrates the pairwise associations between wave and the other three dimensions. During both delta and omicron waves, there exists an overall country-specific decrease of the log-rr. Independently of the country, a further decrease is observed due to older age and in turn, independently of age, the log-rr decreases in male patients. On the other hand, the plot below shows the three-point association among age, sex and country. While for Argentina the maxent model recognizes again independent shifts in the log-rr for age and sex over the waves, in the USA the three-point effect becomes significant: A male patient over 40 has significantly lower rr than a female patient of the same age, while the picture is reversed at younger ages. Hence, solely specifying either age or sex in a profile from the USA is not enough to tell the exact change in rr around the overall wave-specific estimate. Of course, choosing another country as reference would lead to identical conclusion, demonstrating the natural reparametrization invariance of maxent constraint selection.
Author Contributions
Conceptualization and methodology, H.-R.C. and O.L.; Investigation, O.L. All authors have read and agreed to the published version of the manuscript.
Funding
This research received no external funding.
Institutional Review Board Statement
Not applicable.
Informed Consent Statement
Not applicable.
Data Availability Statement
Public datasets used, see References.
Conflicts of Interest
The authors declare no conflict of interest.
References
- Loukas, O.; Chung, H.R. Categorical Distributions of Maximum Entropy under Marginal Constraints. arXiv 2022, arXiv:2204.03406. [Google Scholar]
- Loukas, O.; Chung, H.R. Entropy-based Characterization of Modeling Constraints. arXiv 2022, arXiv:2206.14105. [Google Scholar]
- Jaynes, E.T. Probability Theory: The Logic of Science; Cambridge University Press: Cambridge, UK, 2003. [Google Scholar]
- Jaynes, E.T. Concentration of Distributions at Entropy Maxima (1979). In E. T. Jaynes: Papers on Probability, Statistics and Statistical Physics; Rosenkrantz, R.D., Ed.; Springer: Dordrecht, The Netherlands, 1989; pp. 315–336. [Google Scholar]
- Nguyen, H.C.; Zecchina, R.; Berg, J. Inverse statistical problems: From the inverse Ising problem to data science. Adv. Phys. 2017, 66, 197–261. [Google Scholar] [CrossRef] [Green Version]
- Cocco, S.; Monasson, R. Adaptive cluster expansion for the inverse Ising problem: Convergence, algorithm and tests. J. Stat. Phys. 2012, 147, 252–314. [Google Scholar] [CrossRef]
- Public Health Agency of Canada. Canada. Preliminary Dataset on Confirmed Cases of COVID-19, 2020–2022. Available online: https://www150.statcan.gc.ca/n1/en/catalogue/132600032020001 (accessed on 30 May 2022).
- Centers for Disease Control and Prevention (CDC). USA. COVID-19 Case Surveillance Public Use Data. Available online: https://data.cdc.gov/Case-Surveillance/COVID-19-Case-Surveillance-Public-Use-Data/vbim-akqf (accessed on 30 May 2022).
- Ministerio de Salud. Argentina. Historical File of Cases Registered from 03/01/2020 to 06/04/2022. Available online: http://datos.salud.gob.ar/dataset/covid-19-casos-registrados-en-la-republica-argentina/archivo/fd657d02-a33a-498b-a91b-2ef1a68b8d16 (accessed on 30 May 2022).
- GISAID Initiative. Variants of Concern COVID-19. Available online: https://covariants.org/ (accessed on 30 May 2022).
Figure 1.
Graph representation of the three spin clusters found over the first pass of constraint selection within pairs of spins. The gray lines represent erroneous non-local interactions, while the actual (anti)-ferromagnetic long-range interactions are signified by blue (red) lines. Among all non-local associations found in the first pass, only true interactions remain significant in the subsequent constraint selection within the three clusters, at least away from the strong coupling regime.

Figure 2.
Relative risks in log scale computed using directly the covid-19 data on the left side and using the selected maxent model on the right. The first row shows the rr against the first wave, while the second row depicts the rr against one of the three countries (Canada).
Figure 2.
Relative risks in log scale computed using directly the covid-19 data on the left side and using the selected maxent model on the right. The first row shows the rr against the first wave, while the second row depicts the rr against one of the three countries (Canada).

Figure 3.
Hypergraph representing the association structure probed at size N by maxent techniques on covid-19 data. Associations, i.e., marginal constraints flowing into linear problem (1), are depicted as hyperedges encompassing the associated features.
Figure 3.
Hypergraph representing the association structure probed at size N by maxent techniques on covid-19 data. Associations, i.e., marginal constraints flowing into linear problem (1), are depicted as hyperedges encompassing the associated features.

Publisher’s Note: MDPI stays neutral with regard to jurisdictional claims in published maps and institutional affiliations. |
© 2022 by the authors. Licensee MDPI, Basel, Switzerland. This article is an open access article distributed under the terms and conditions of the Creative Commons Attribution (CC BY) license (https://creativecommons.org/licenses/by/4.0/).
Share and Cite
MDPI and ACS Style
Loukas, O.; Chung, H.-R. Model Selection in the World of Maximum Entropy. Phys. Sci. Forum 2022, 5, 28. https://doi.org/10.3390/psf2022005028
AMA Style
Loukas O, Chung H-R. Model Selection in the World of Maximum Entropy. Physical Sciences Forum. 2022; 5(1):28. https://doi.org/10.3390/psf2022005028
Chicago/Turabian StyleLoukas, Orestis, and Ho-Ryun Chung. 2022. "Model Selection in the World of Maximum Entropy" Physical Sciences Forum 5, no. 1: 28. https://doi.org/10.3390/psf2022005028