1. Introduction
Laser microdissection microscopy (LM), a technology for isolating cells or tissue of interest, combined with RNA sequencing are powerful techniques for investigating the transcriptome profile at a cellular level of specific tissues or cell types [
1]. This type of analysis, more specific and precise, enhances the detection of low-abundance transcripts that are expressed in only few and specialized cells.
The periderm (outer bark in trees) is a protective tissue against the environment, differentiated by a secondary meristem, the phellogen or cork cambium. The outward layers of the periderm are constituted by cork or phellem tissue, which is composed of several compacted layers of suberized cells [
2,
3]. At particular regions of phellogen, a specific meristem called lenticular phellogen is responsible for lenticular channel (or lenticel) differentiation. These channels, filled with non-suberized tissue, cross the cork layers, allowing gas exchange between the interior and the exterior of the tree [
3,
4]. The phellogen is also responsible for the production of phelloderm, an inner layer of the bark [
3]. Moreover, xylem, responsible for the transportation of water and nutrients from the roots upwards, originates from another secondary meristem, the vascular cambium [
5].
Cork from
Quercus suber L. is a non-wood forest product with high economic and commercial value, as well social and ecological roles. In Portugal, cork represents 33% of all national forestry products, placing Portugal as the world leader in cork production, industrial processing, and the trade of cork. The impermeability, fire retardancy, and sound insulation properties of cork make it the optimum material for a variety of applications, such as wine bottle stoppers, insulation corkboard, shoe soles, and other fashion purposes [
2,
6].
The aim of our research is to compare the gene expression of several tissues from cork oak, namely phellogen, xylem and lenticular phellogen. The isolation of single cells using the LM technique and RNA isolation method for RNA-seq analysis was optimized in Q. suber tissues. The single-cell RNA sequencing allowed gene expression analysis in individual tissues of oaks, contributing to our understand of the molecular mechanisms associated with the development processes of secondary growth.
2. Materials and Methods
Cork oak trees were selected in the Parque Biológico da Cabeça Gorda, Beja (37°54′43.6″ N 7°47′22.7″ W), Alentejo region, Portugal. Small twigs with 5–8 mm length were cut from three-year-old branches, immediately frozen in liquid nitrogen and stored at −80 °C until use for cryosectioning/LM.
The samples were embedded in Optimal Cutting Temperature medium (OCT) (VWR Chemicals) and transversal sections were sliced using a CryoStar NX50 Cryostat (Thermo Scientific, Waltham, MA, USA). The sections were mounted on PET membrane slides with some drops of 70% and 100% ethanol to remove the OCT and facilitate the adhesion of sections, respectively.
The cells of interest selected from xylem, phellogen and lenticular phellogen tissues were microdissected using a PALM Zeiss Microbeam Microscope (Zeiss, Oberkochen, Germany). Total RNA isolation, from pooled harvested cells from several LM sessions was carried out with a PicoPure RNA Isolation kit (Thermo Fisher Scientific, Waltham, MA, USA) according to the manufacturer’s instructions, followed by DNase treatment with RNase-Free DNase I Set (Qiagen, Hilden, Germany) to eliminate genomic DNA. At the end of each extraction, a quality control was assessed by LabChip technology (Fragment Analyser System) to check the quality and quantity of the RNA extracted.
At the final stage, RNA from xylemic and phellogen tissues was converted to cDNA using the SMART-seq protocol [
7], and small fragments of cDNA were created by Nextera fragmentation [
8]. The quality of cDNA synthesis and fragmentation was analysed by LabChip technology (Fragment Analyser System). For sequencing, an ultra-low sequencing method was performed through the Illumina HiSeq 2500 platform.
For the paired-end (PE) RNA sequencing data, the raw reads were trimmed to remove Illumina adaptor sequences and duplicate reads with Trimmomatic software (v0.36; [
9]). Clean pairs of reads from each library were independently mapped to
Quercus suber genome (v1.0; [
10]) using STAR (Spliced Transcripts Alignment to a Reference) software (v2.3.0; [
11]). Blast2GO will be employed to annotate the GO terms, enzymatic protein codes and KEGG pathways. The number of unique match reads to each reference unigene was normalized to RPKM to quantify gene expression abundance.
3. Results
In this study, a protocol for single-cell isolation by Laser Microdissection and the extraction of undegraded total RNA was optimized for phellogen, lenticels and xylem tissues of cork oak (Q. suber) for transcriptomic analysis.
3.1. Laser Microdissection and RNA Isolation
Several adjustments to the laser microdissection and RNA extraction procedures were made in order to successfully isolate total RNA, using PicoPure RNA Isolation kit, from single cells of xylem, phellogen and lenticels.
The total RNA with RIN higher than 6 was converted to cDNA, fragmented and adapter sequences added onto the template using Picelli et al. [
7] and Baym et al. [
8], respectively. The paired-end sequencing libraries were sequencing through Illumina HiSeq 2500 platform.
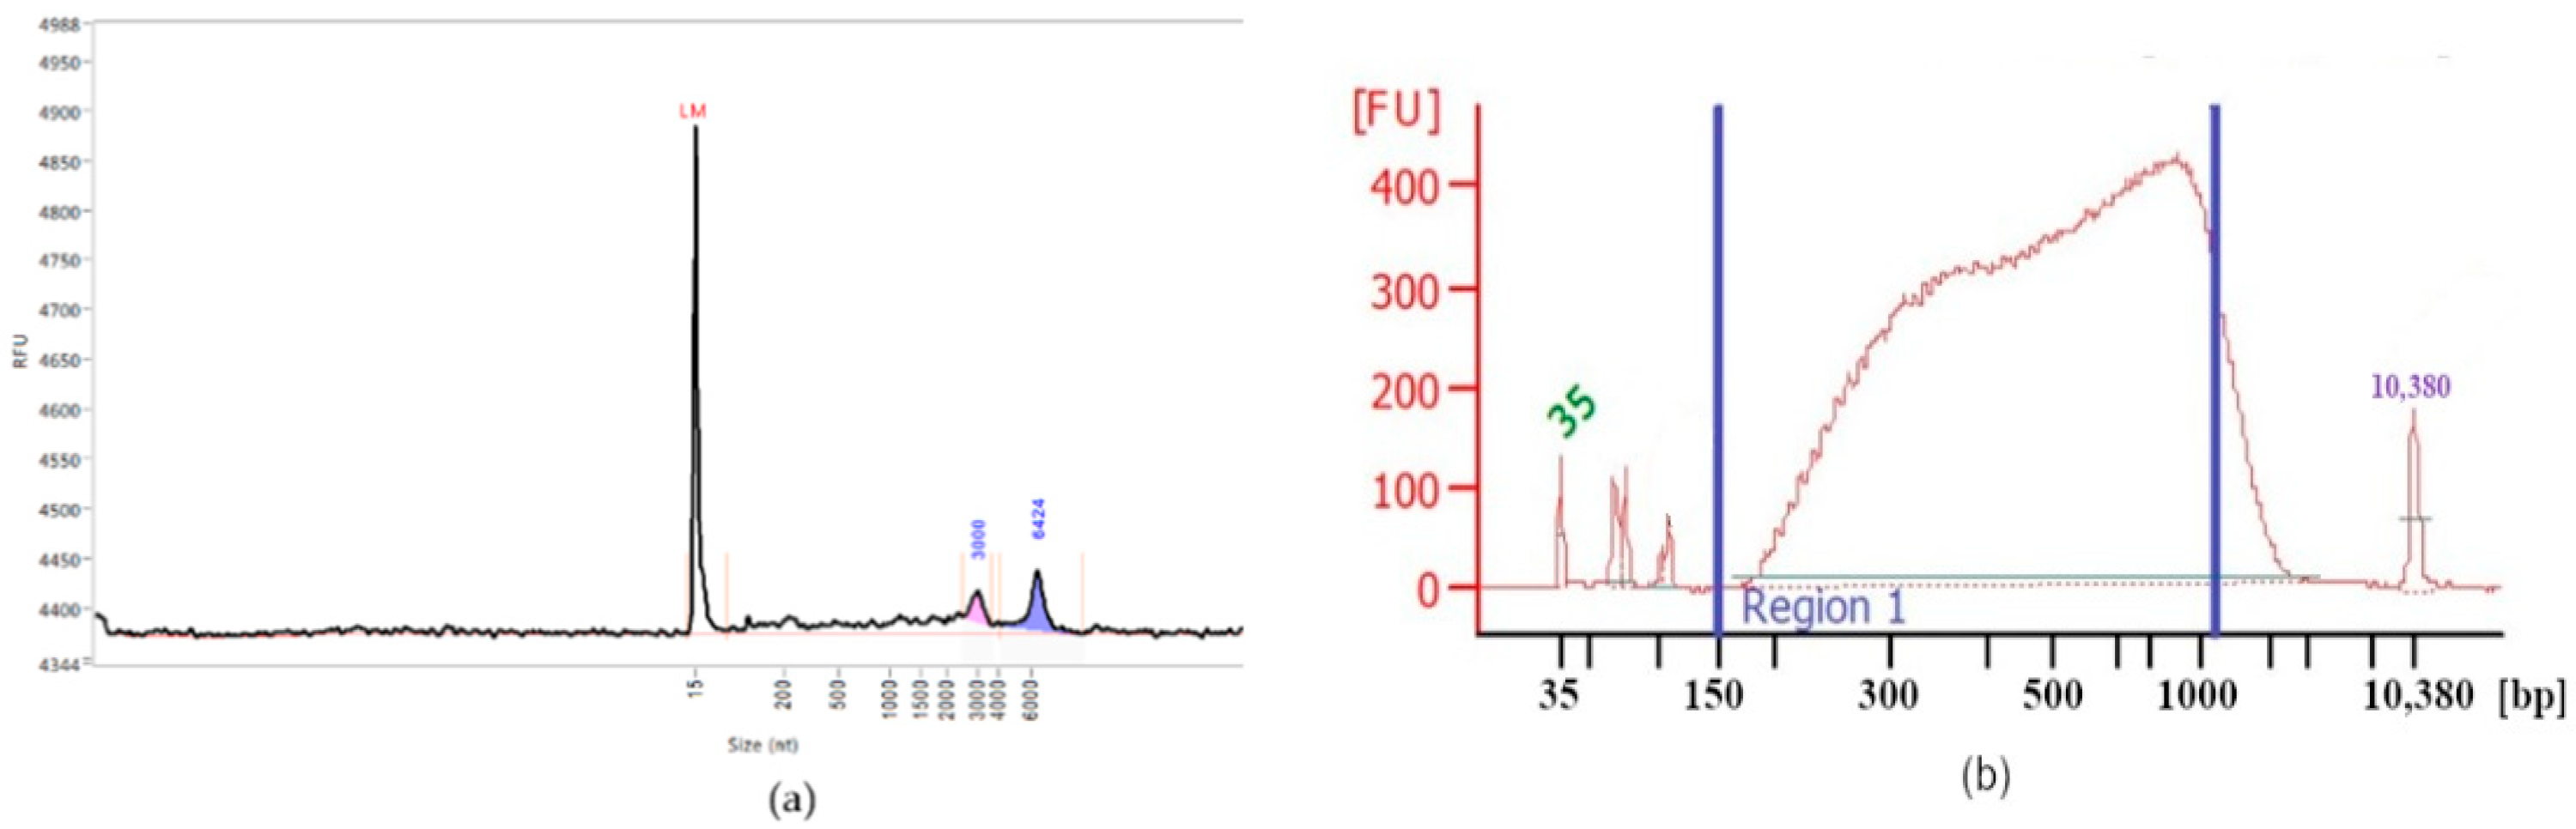
Figure 1 illustrates the electropherograms (Fragment Analyser System, Agilent, Santa Clara, CA, USA) of total RNA isolated from xylemic tissue from three-year-old branches of cork oak and subsequent fragmented cDNA library size distributions. The observed peaks (
Figure 1a) correspond to 18S and 28S rRNA. The broad size distribution of the library (from 150 bp to 1000 bp) is acceptable for further sequencing.
3.2. RNA Sequencing and Differentially Expressed Transcripts
The transcriptomic profile of the three tissues (xylem, phellogen and lenticels) were obtained. Between 30 and 50 million paired reads with 125 bp per library were generated from RNA-seq, with an average of 41% GC content (quality control evaluated with FastQC).
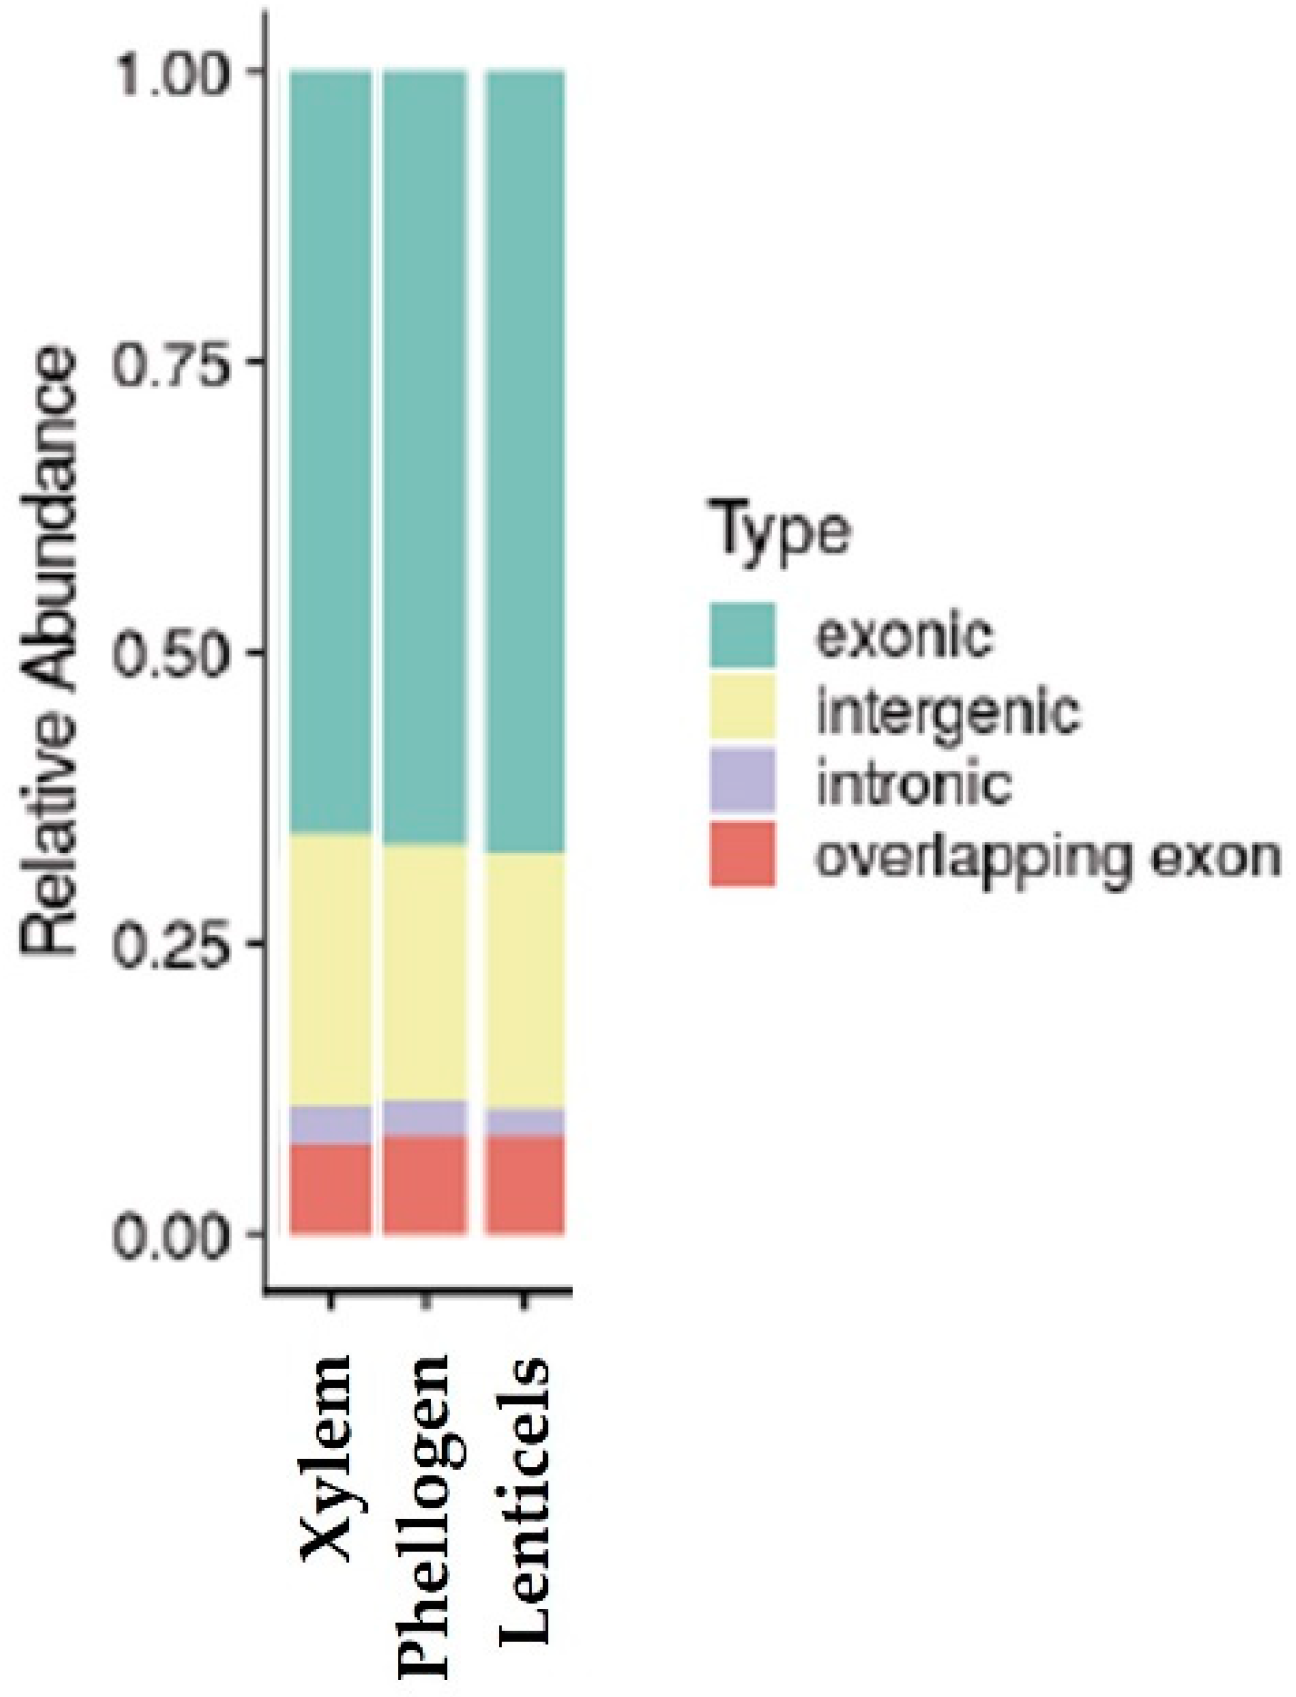
After filtering out raw reads, in order to remove duplicates and Ilumina adapter sequences, the clean reads from each library were aligned against the cork oak genome [
10]. About 25–30 M read pairs were mapped to the
Q. suber genome sequence. Considering the annotation available, the reads aligned mostly in exonic and intergenic regions (
Figure 2), which supports the high content of protein-coding transcripts in the samples analyzed.
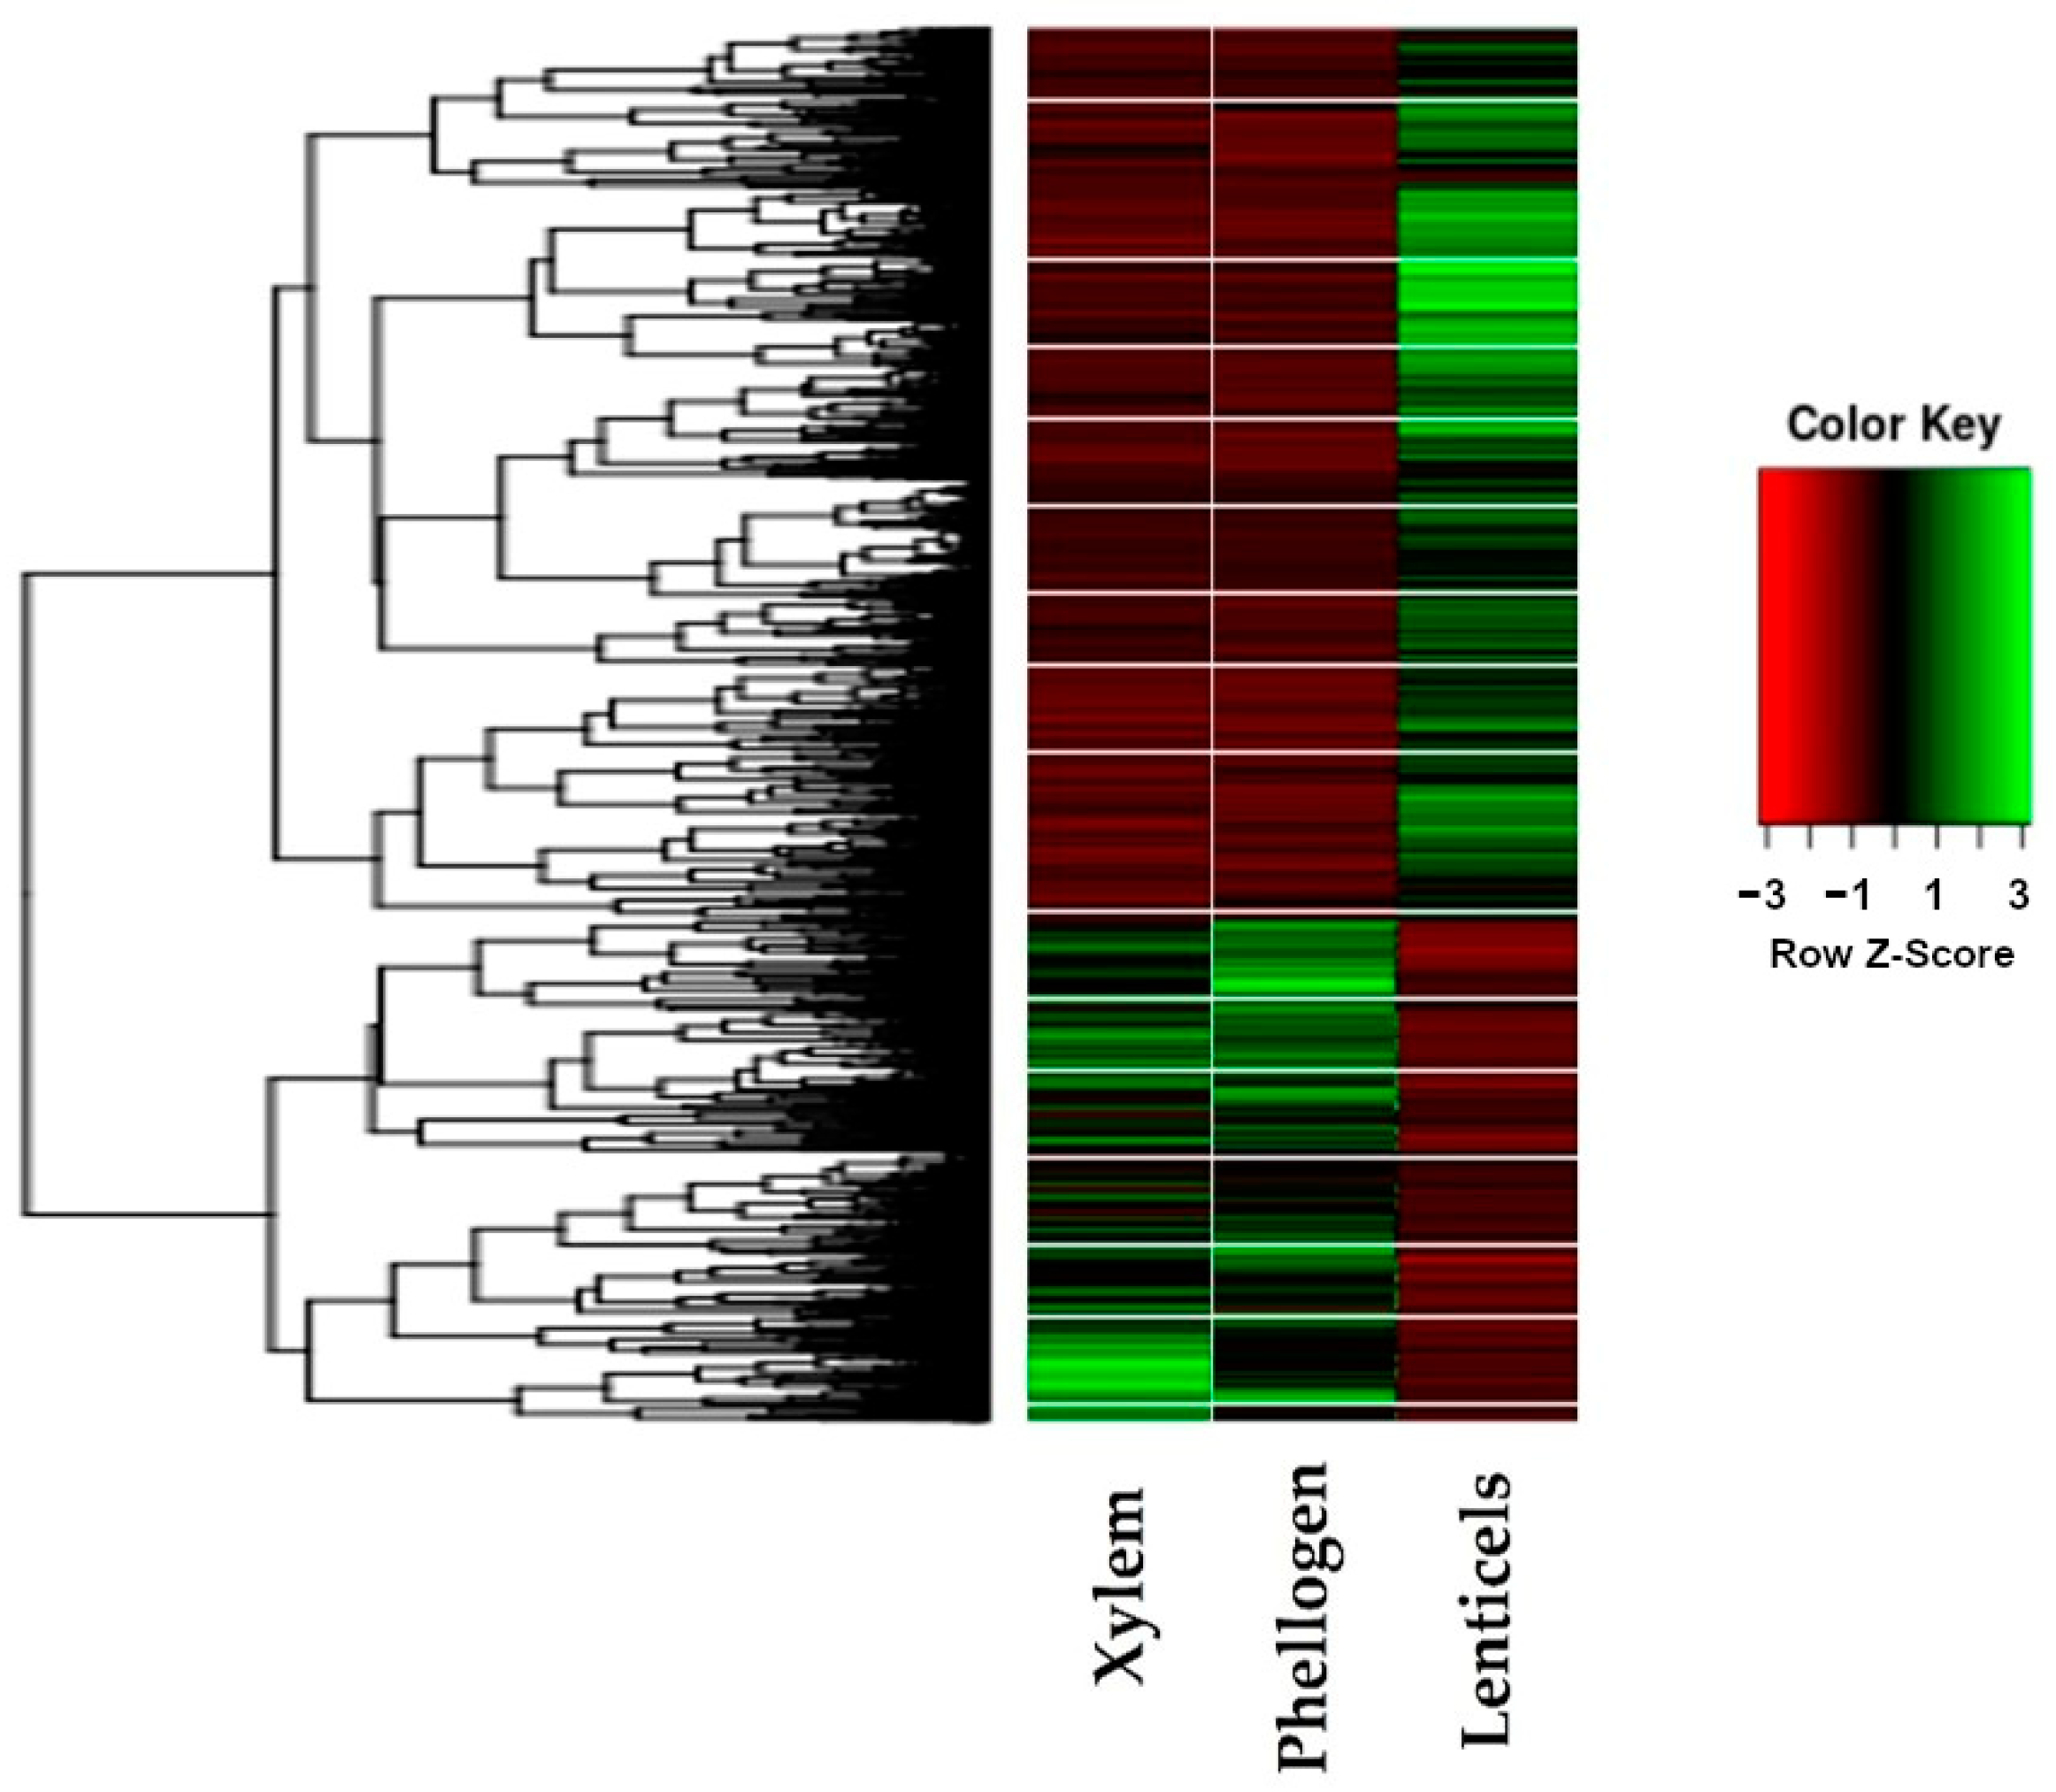
The differential gene expression analysis of the xylem, phellogen and lenticel tissues are represented as a heatmap in
Figure 3. The results show different expression patterns for the tissues studied, with an evident difference between the lenticular phellogen regarding the phellogen and xylem tissues. Differential expression and GO term analysis clearly reveal enzyme active players on lignin and suberin critical point pathways.
4. Discussion
Plants are composed of several specialized tissues with specific biological functions, thus exhibiting different genetic, protein and metabolic profiles. The data acquired from whole organ analysis can mask valuable information at the cellular level. Currently, more precise techniques for isolating individual cells have made it possible to analyze cell- or tissue-type-specific transcriptome profiles, revealing intricate and unique gene networks.
In this context, we developed a combined laser microdissection and Next-Generation Sequencing method in order to investigate the gene expression pattern of lignified and suberized tissues from Quercus suber. We successfully microdissected single cells from three different tissues, namely xylem, phellogen and lenticels from cork oak. The isolation of undegraded total RNA, followed by cDNA library preparation for RNA-seq were also accomplished.
The mapping results suggest that single-cell isolation, RNA extraction, and sequencing of Illumina library procedures were viable for transcriptomic studies of cork oak tissues. The differential gene expression of studied tissues clearly shows variations in up- and downregulated genes between the tissues, which indicates that different biological pathways are activate.
The single-cell RNA-Seq will allow gene expression analysis in individual tissues of oaks, contributing to understanding the molecular mechanisms associated with the development processes and the lenticular channel formation.
Author Contributions
Conceptualization, L.M.; methodology, R.C.P., T.C. and A.F.; software, T.C.; formal analysis, R.C.P. and T.C.; investigation, R.C.P. and T.C.; writing—original draft preparation, R.C.P. and L.M.; writing—review and editing, L.M., T.C., A.F. and R.C.P.; supervision, L.M.; project administration, L.M. All authors have read and agreed to the published version of the manuscript.
Funding
The present work was supported by Program Alentejo 2020 under the scope of Lentidev—A molecular approach to cork porosity (ALT20-03-0145-FEDER-000020), and by Program PORTUGAL 2020 Partnership Agreement, under the scope of Biodata.pt–Infraestrutura Portuguesa de Dados Biológicos (22231/01/SAICT/2016), through the European Regional Development Fund (ERDF). Authors also acknowledge FCT to Contrato–Programa to L. Marum (CEECINST/00131/2018). This work was also funded through FCT under the project UIDB/05183/2020 to Mediterranean Institute for Agriculture, Environment and Development (MED).
Institutional Review Board Statement
Not applicable.
Informed Consent Statement
Not applicable.
Data Availability Statement
The data presented in this study are available on request from the corresponding author.
Conflicts of Interest
The authors declare no conflict of interest.
References
- Gautam, V.; Sarkar, A.K. Laser Assisted Microdissection, an Efficient Technique to Understand Tissue Specific Gene Expression Patterns and Functional Genomics in Plants. Mol. Biotechnol. 2015, 57, 299–308. [Google Scholar] [CrossRef] [PubMed]
- Pereira, H. Macroscopic Appearance and Quality. In Cork: Biology, Production and Uses; Elsevier Inc.: Amsterdam, The Netherlands, 2007; pp. 163–186. ISBN 9780080476865. [Google Scholar] [CrossRef]
- Graça, J.; Pereira, H. The Periderm Development in Quercus Suber. IAWA J. 2004, 25, 325–335. [Google Scholar] [CrossRef]
- Rosner, S.; Kartusch, B. Structural Changes in Primary Lenticels of Norway Spruce over the Seasons. IAWA J. 2003, 24, 105–116. [Google Scholar] [CrossRef]
- Lopez, F.B.; Barclay, G.F. Plant Anatomy and Physiology. In Pharmacognosy: Fundamentals, Applications and Strategy; Elsevier Inc.: Amsterdam, The Netherlands, 2017; pp. 45–60. ISBN 9780128020999. [Google Scholar]
- Graça, J. Suberin: The Biopolyester at the Frontier of Plants. Front. Chem. 2015, 3, 62. [Google Scholar] [CrossRef] [PubMed]
- Picelli, S.; Faridani, O.R.; Björklund, Å.K.; Winberg, G.; Sagasser, S.; Sandberg, R. Full-Length RNA-Seq from Single Cells Using Smart-Seq2. Nat. Protoc. 2014, 9, 171–181. [Google Scholar] [CrossRef] [PubMed]
- Baym, M.; Kryazhimskiy, S.; Lieberman, T.D.; Chung, H.; Desai, M.M.; Kishony, R.K. Inexpensive Multiplexed Library Preparation for Megabase-Sized Genomes. PLoS ONE 2015, 10, e128036. [Google Scholar] [CrossRef] [PubMed] [Green Version]
- Bolger, A.M.; Lohse, M.; Usadel, B. Trimmomatic: A Flexible Trimmer for Illumina Sequence Data. Bioinformatics 2014, 30, 2114–2120. [Google Scholar] [CrossRef] [PubMed] [Green Version]
- Ramos, A.M.; Usié, A.; Barbosa, P.; Barros, P.M.; Capote, T.; Chaves, I.; Simões, F.; Abreu, I.; Carrasquinho, I.; Faro, C.; et al. The Draft Genome Sequence of Cork Oak. Sci. Data 2018, 5, 180069. [Google Scholar] [CrossRef] [PubMed]
- Dobin, A.; Davis, C.A.; Schlesinger, F.; Drenkow, J.; Zaleski, C.; Jha, S.; Batut, P.; Chaisson, M.; Gingeras, T.R. STAR: Ultrafast Universal RNA-Seq Aligner. Bioinformatics 2013, 29, 15–21. [Google Scholar] [CrossRef] [PubMed]
| Publisher’s Note: MDPI stays neutral with regard to jurisdictional claims in published maps and institutional affiliations. |
© 2021 by the authors. Licensee MDPI, Basel, Switzerland. This article is an open access article distributed under the terms and conditions of the Creative Commons Attribution (CC BY) license (https://creativecommons.org/licenses/by/4.0/).


