
Genome-Wide Association Analysis of Yield-Related Traits of Soybean Using Haplotype-Based Framework †

 ,
,  ,
,  and
and
Abstract
:1. Introduction
2. Materials and Methods
2.1. Plant Materials and Field Experiment
2.2. Genome-Wide Haplotype Association Analysis
3. Results and Discussion
4. Conclusions
Supplementary Materials
Author Contributions
Funding
Institutional Review Board Statement
Informed Consent Statement
Acknowledgments
Conflicts of Interest
References
- Karikari, B.; Chen, S.; Xiao, Y.; Chang, F.; Zhou, Y.; Kong, J.; Bhat, J.A.; Zhao, T. Utilization of Interspecific High-Density Genetic Map of RIL Popolation for the QTL Detection and Candidate Gene Mining for 100-Seed Weight in Soybean. Front. Plant Sci. 2019, 10, 1001. [Google Scholar] [CrossRef] [PubMed]
- Li, X.; Zhang, X.; Zhu, L.; Bu, Y.; Wang, X.; Zhang, X.; Zhou, Y.; Wang, X.; Guo, N.; Qiu, L.; et al. Genome-wide association study of four yield-related traits at the R6 stage in soybean. BMC Genet. 2019, 20, 39. [Google Scholar] [CrossRef] [PubMed] [Green Version]
- Patil, G.; Do, T.; Vuong, T.D.; Valliyodan, B.; Lee, J.; Chaudhary, J.; Shannon, J.G.; Nguyen, H.T. Genomic-assisted haplotype analysis and the development of high-throughput SNP markers for salinity tolerance in soybean. Sci. Rep. 2016, 6, 19199. [Google Scholar] [CrossRef] [PubMed] [Green Version]
- Wang, X.; Pang, Y.; Wang, C.; Chen, K.; Zhu, Y.; Shen, C.; Ali, J.; Xu, J.; Li, Z. New candidate genes affecting rice grain appearance and milling quality detected by genome-wide and gene-based association analyses. Front. Plant Sci. 2017, 7, 1998. [Google Scholar] [CrossRef] [PubMed] [Green Version]
- Abbai, R.; Singh, V.; Nachimuthu, V.V.; Sinha, P.; Selvaraj, R.; Vipparla, A.K.; Singh, A.K.; Singh, U.M.; Varshney, R.K.; Kumar, A. Haplotype analysis of key genes governing grain yield and quality traits across 3K RG panel reveals scope for the development of tailor-made rice with enhanced genetic gains. Plant Biotechnol. J. 2019, 17, 1612–1622. [Google Scholar] [CrossRef] [Green Version]
- Chen, K.; Zhang, Q.; Wang, C.-C.; Liu, Z.-X.; Jiang, Y.-J.; Zhai, L.-Y.; Zheng, T.-Q.; Xu, J.-L.; Li, Z.-K. G Genetic dissection of seedling vigour in a diverse panel from the 3000 Rice (Oryza sativa L.) Genome Project. Sci. Rep. 2019, 9, 4804. [Google Scholar] [CrossRef]
- Sinha, P.; Singh, V.K.; Saxena, R.K.; Khan, A.W.; Abbai, R.; Chitikineni, A.; Desai, A.; Molla, J.; Upadhyaya, H.D.; Kumar, A.; et al. Superior haplotypes for haplotype-based breeding for drought tolerance in pigeonpea (Cajanus cajan L.). Plant Biotechnol. J. 2020, 18, 2482–2490. [Google Scholar] [CrossRef]
- Lu, X.; Xiong, Q.; Cheng, T.; Li, Q.; Liu, X.-L.; Bi, Y.-D.; Li, W.; Zhang, W.-K.; Ma, B.; Lai, Y.-C.; et al. A PP2C-1 allele underlying a quantitative trait locus enhances soybean 100-seed weight. Mol. Plant 2011, 10, 670–684. [Google Scholar] [CrossRef] [Green Version]
- Barrero, R.A.; Bellgard, M.; Zhang, X. Diverse approaches to achieving grain yield in wheat. Funct. Integr. Genom. 2011, 11, 37–48. [Google Scholar] [CrossRef]
- Wang, J.; Chu, S.; Zhang, H.; Zhu, Y.; Cheng, H.; Yu, D. Development and application of a novel genome-wide SNP array reveals domestication history in soybean. Sci. Rep. 2016, 6, 20728. [Google Scholar] [CrossRef]
- Zhang, J.; Song, Q.; Cregan, P.B.; Nelson, R.L.; Wang, X.; Wu, J.; Jiang, G.-L. Genome-wide association study for flowering time, maturity dates and plant height in early maturing soybean (Glycine max) germplasm. BMC Genom. 2015, 16, 217. [Google Scholar] [CrossRef] [PubMed] [Green Version]
- Price, A.L.; Patterson, N.J.; Plenge, R.M.; Weinblatt, M.E.; Shadick, N.A.; Reich, D. Principal components analysis corrects for stratification in genome-wide association studies. Nat. Genet. 2006, 38, 904–909. [Google Scholar] [CrossRef] [PubMed]
- Zhang, Z.; Ersoz, E.; Lai, C.Q.; Todhunter, R.J.; Tiwari, H.K.; Gore, M.A.; Bradbury, P.J.; Yu, J.; Arnett, D.K.; Ordovas, J.M.; et al. Mixed linear model approach adapted for genome-wide association studies. Nat. Genet. 2010, 42, 355–360. [Google Scholar] [CrossRef] [PubMed] [Green Version]
- Segura, V.; Vilhjálmsson, B.J.; Platt, A.; Korte, A.; Seren, Ü.; Long, Q. and Nordborg, M. An efficient multi-locus mixed-model approach for genome-wide association studies in structured populations. Nat. Genet. 2012, 44, 825–830. [Google Scholar] [CrossRef] [Green Version]
- Liu, X.; Huang, M.; Fan, B.; Buckler, E.S. and Zhang, Z. Iterative usage of fixed and random effect models for powerful and efficient genome-wide association studies. PLoS Genet. 2016, 12, e1005767. [Google Scholar] [CrossRef]
- Huang, M.; Liu, X.; Zhou, Y.; Summers, R.M.; Zhang, Z. BLINK: A package for the next level of genome-wide association studies with both individuals and markers in the millions. GigaScience 2019, 8, giy154. [Google Scholar] [CrossRef]
- Schwarz, G. Estimating the dimension of a model. Ann. Stat. 1978, 461–464. [Google Scholar] [CrossRef]
- Purcell, S.; Neale, B.; Todd-Brown, K.; Thomas, L.; Ferreira, M.A.R.; Bender, D.; Maller, J.; Sklar, P.; de Bakker, P.I.W.; Daly, M.J.; et al. PLINK: A tool set for whole-genome association and population-based linkage analyses. Am. J. Hum. Genet. 2007, 81, 559–575. [Google Scholar] [CrossRef] [Green Version]
- Li, D.; Zhao, X.; Han, Y.; Li, W.; Xie, F. Genome-wide association mapping for seed protein and oil contents using a large panel of soybean accessions. Genomics 2019, 111, 90–95. [Google Scholar] [CrossRef]
- Hu, D.; Zhang, H.; Du, Q.; Hu, Z.; Yang, Z.; Li, X.; Wang, J.; Huang, F.; Yu, D.; Wang, H.; et al. Genetic dissection of yield-related traits via genome-wide association analysis across multiple environments in wild soybean (Glycine soja Sieb. and Zucc.). Planta 2020, 251, 39. [Google Scholar] [CrossRef]
- Marri, P.R.; Sarla, N.; Reddy, L.V.; Siddiq, E.A. Identification and mapping of yield and yield related QTLs from an Indian accession of Oryza rufipogon. BMC Genet. 2005, 6, 33. [Google Scholar] [CrossRef] [PubMed] [Green Version]
- Adeboye, K.A.; Semon, M.; Oyetunde, O.A.; Oduwaye, O.A.; Adebambo, A.O.; Fofana, M.; Daniel, I.O. Diversity array technology (DArT)-based mapping of phenotypic variations among recombinant inbred lines of WAB638-1/PRIMAVERA under drought stress. Euphytica 2021, 217, 130. [Google Scholar] [CrossRef]
- Han, Y.; Li, D.; Zhu, D.; Li, H.; Li, X.; Teng, W.; Li, W. QTL analysis of soybean seed weight across multi-genetic backgrounds and environments. Theor. Appl. Genet. 2012, 125, 671–683. [Google Scholar] [CrossRef] [PubMed]
- Du, W.; Wang, M.; Fu, S.; Yu, D. Mapping QTLs for seed yield and drought susceptibility index in soybean (Glycine max L.) across different environments. J. Genet. Genom. 2009, 36, 721–731. [Google Scholar] [CrossRef]
- Guan, Y. Detecting structure of haplotypes and local ancestry. Genetics 2014, 196, 625–642. [Google Scholar] [CrossRef] [Green Version]
- Mishra, S.; Singh, B.; Misra, P.; Rai, V.; Singh, N.K. Haplotype distribution and association of candidate genes with salt tolerance in Indian wild rice germplasm. Plant Cell Rep. 2016, 35, 2295–2308. [Google Scholar] [CrossRef]
- Kuroha, T.; Nagai, K.; Gamuyao, R.; Wang, D.R.; Furuta, T.; Nakamori, M.; Kitaoka, T.; Adachi, K.; Minami, A.; Mori, Y.; et al. Ethylene-gibberellin signaling underlies adaptation of rice to periodic flooding. Science 2018, 361, 181–186. [Google Scholar] [CrossRef] [Green Version]


| QTL/Marker | Chromosome | Physical Position (bp) | Trait (Environment) | Related QTL |
|---|---|---|---|---|
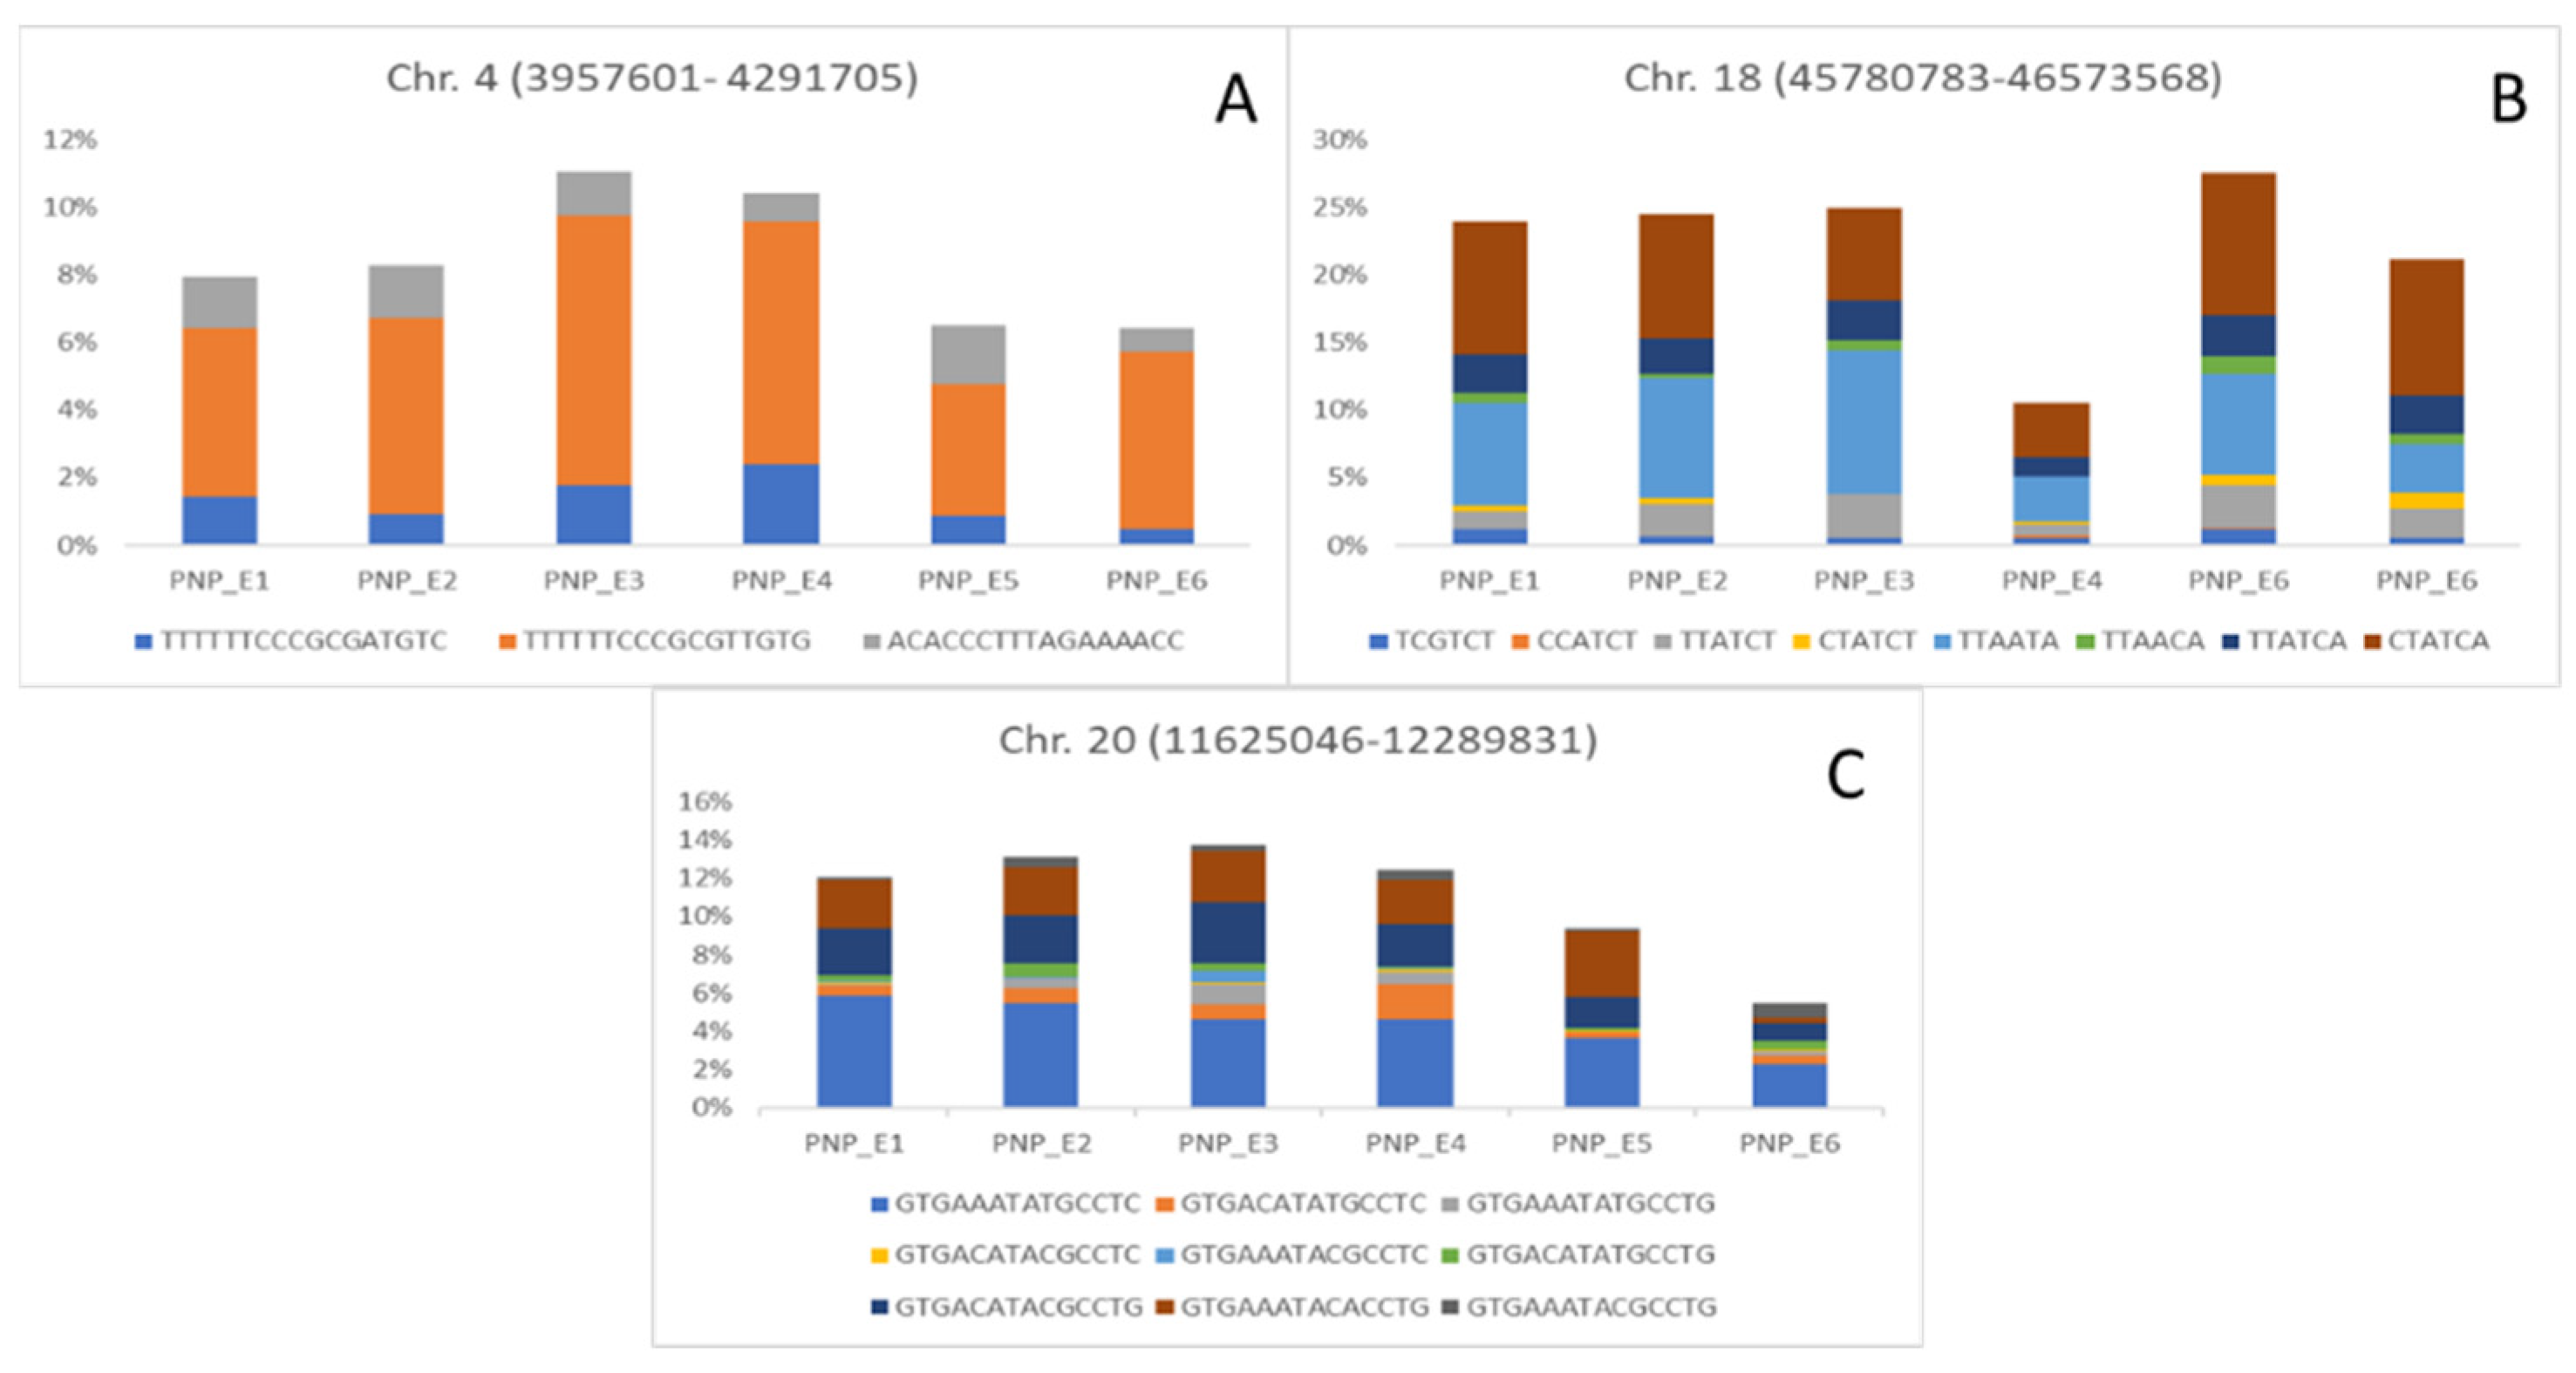
| AX-93703924 | 4 | 4,291,705 | SNP (COM and E6); PNP (E3) | No related QTL |
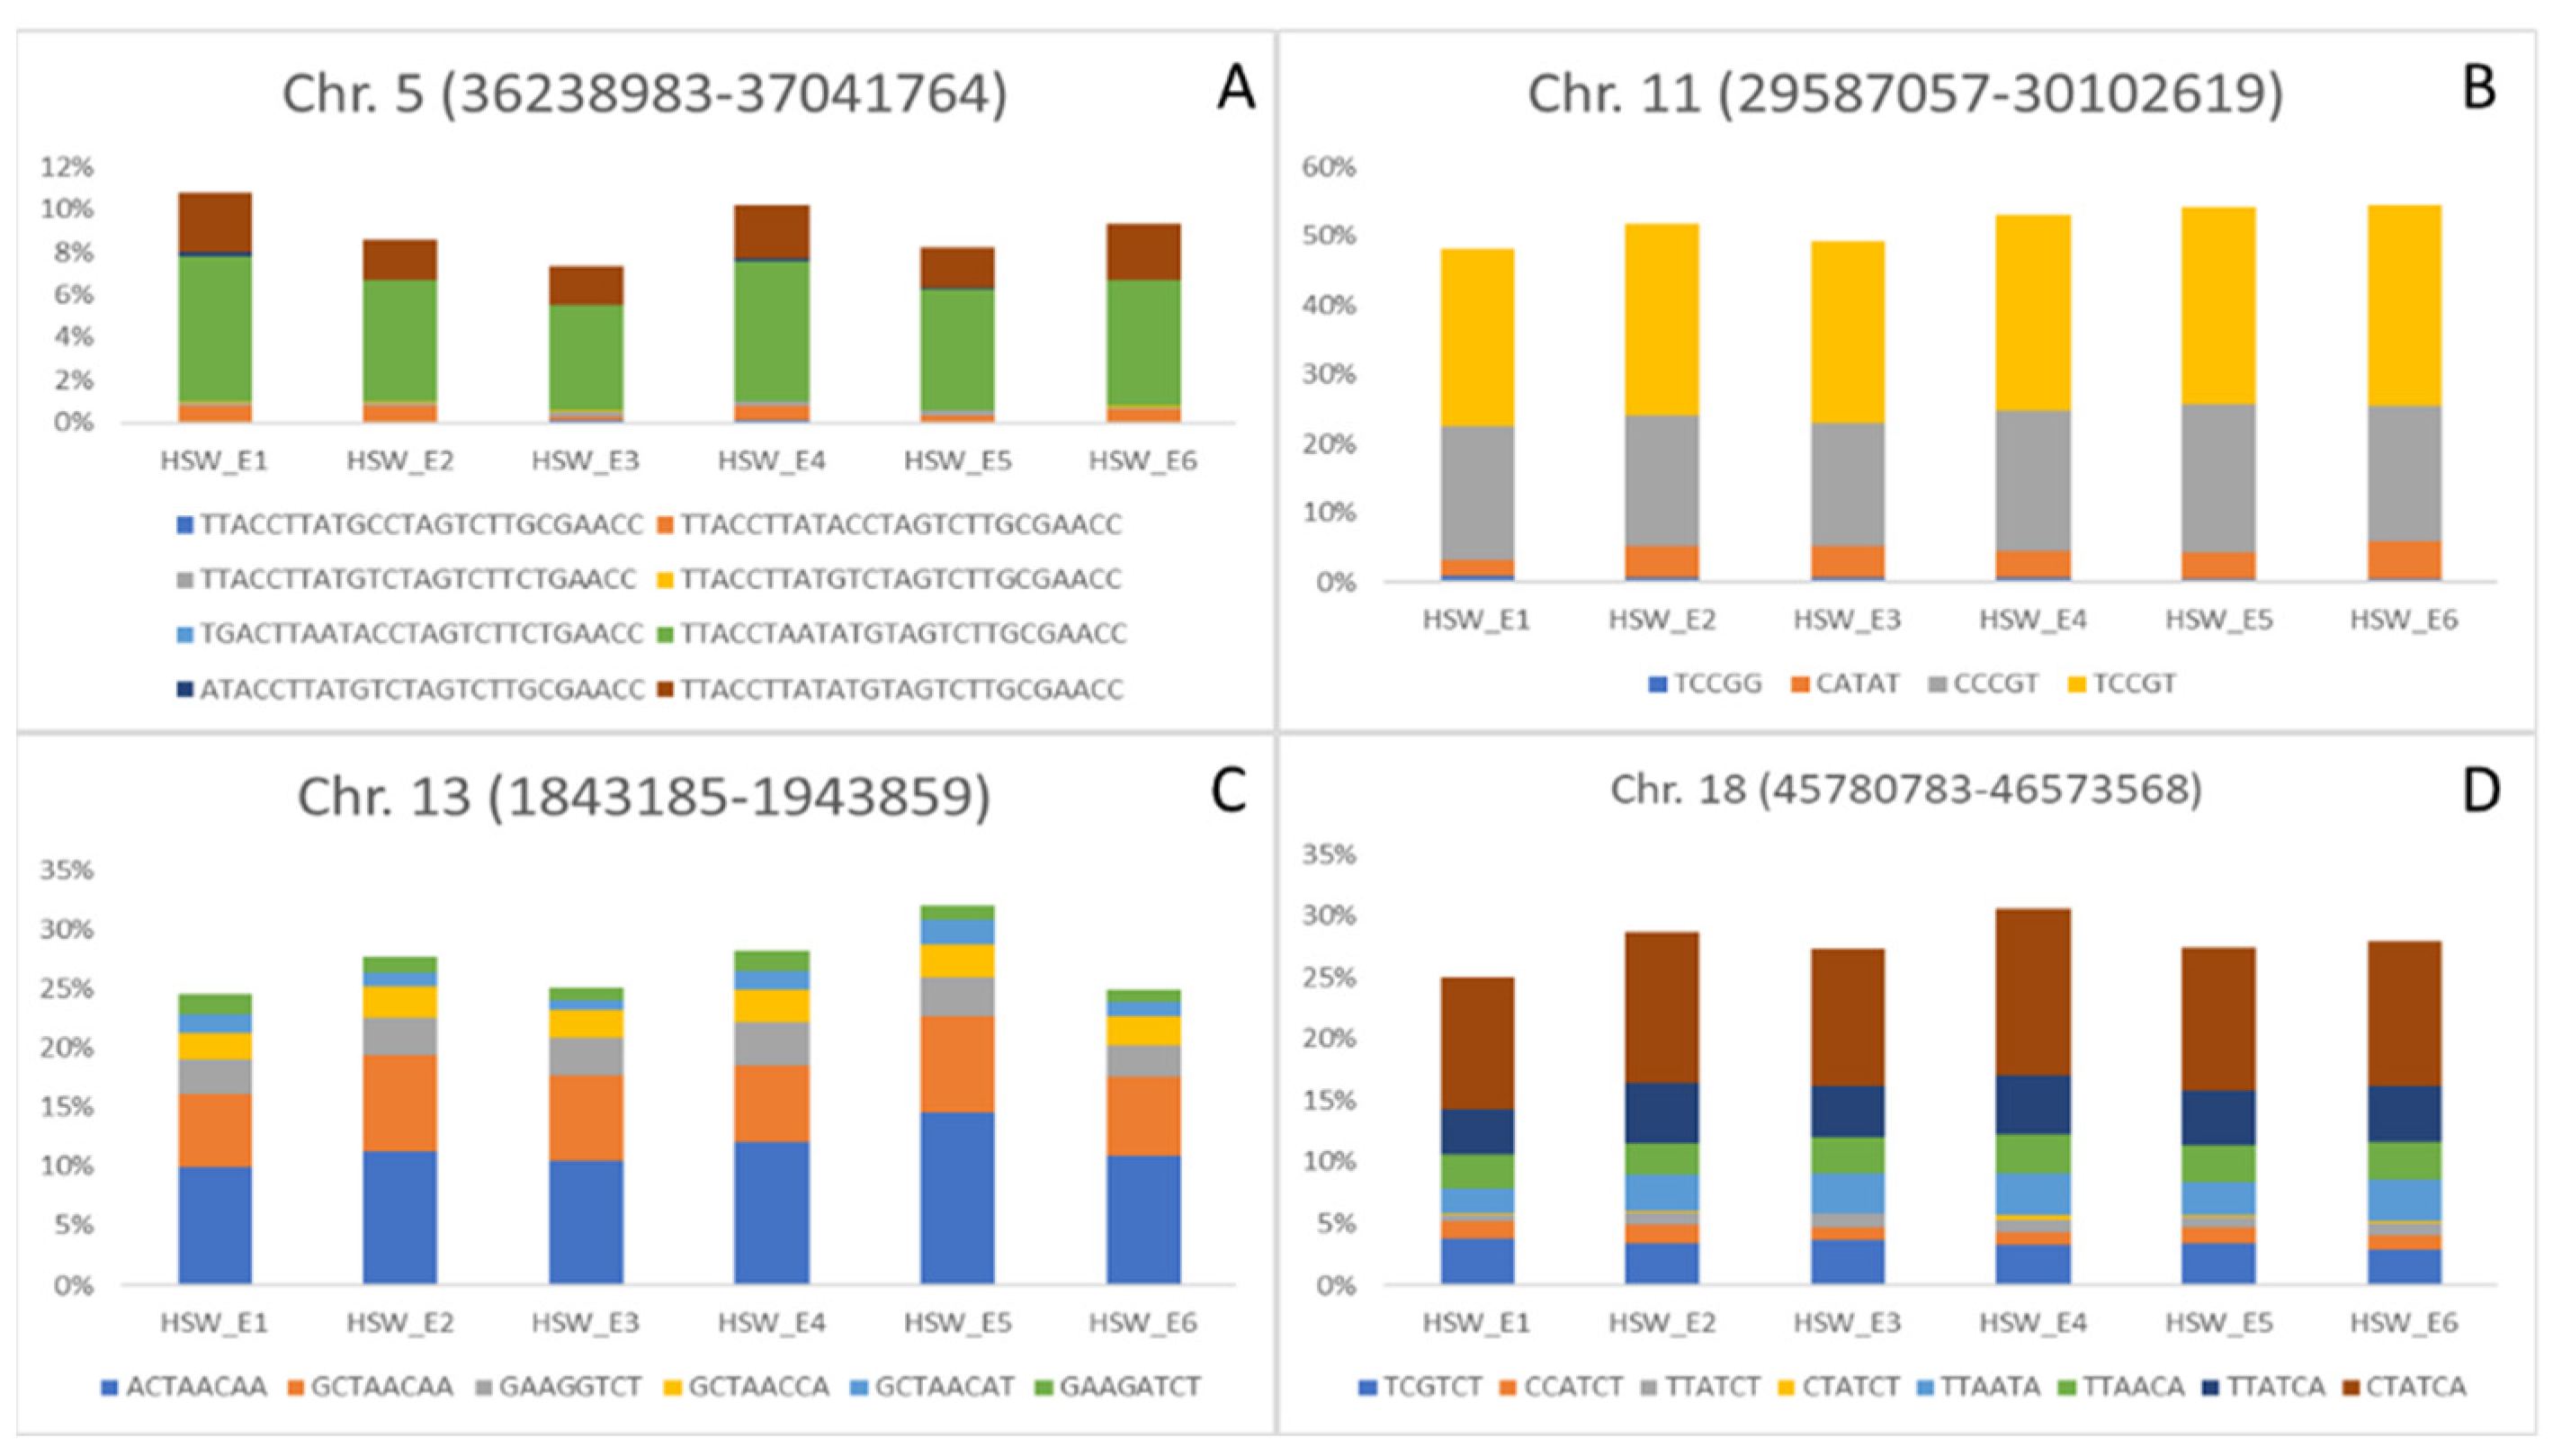
| AX-93922099 | 5 | 36,599,702 | HSW (COM, E1 and E5) | Seed weight 34–9 [17]; Seed yield 22–10 [18] |
| AX-93793210 | 11 | 29,587,057 | HSW (COM, E1, E3 and E4); SNP (E2, E3 and E5) | Seed weight 35–9 [17] |
| AX-93807406 | 13 | 1,843,185 | HSW (COM, E1, E2, E4 and E5); SNP (COM, E1 and E6) | No related QTL |
| AX-94176727 | 18 | 46,137,043 | PNP (COM and E1); HSW (E2) | No related QTL |
| AX-94199992 | 20 | 12,095,298 | PNP (COM and E3); SNP (COM and E1) | No related QTL |
Publisher’s Note: MDPI stays neutral with regard to jurisdictional claims in published maps and institutional affiliations. |
© 2021 by the authors. Licensee MDPI, Basel, Switzerland. This article is an open access article distributed under the terms and conditions of the Creative Commons Attribution (CC BY) license (https://creativecommons.org/licenses/by/4.0/).
Share and Cite
Adeboye, K.A.; Bhat, J.A.; Ganie, S.A.; Varshney, R.K.; Yu, D. Genome-Wide Association Analysis of Yield-Related Traits of Soybean Using Haplotype-Based Framework. Biol. Life Sci. Forum 2022, 11, 49. https://doi.org/10.3390/IECPS2021-12036
Adeboye KA, Bhat JA, Ganie SA, Varshney RK, Yu D. Genome-Wide Association Analysis of Yield-Related Traits of Soybean Using Haplotype-Based Framework. Biology and Life Sciences Forum. 2022; 11(1):49. https://doi.org/10.3390/IECPS2021-12036
Chicago/Turabian StyleAdeboye, Kehinde Adewole, Javaid Akhter Bhat, Showkat Ahmad Ganie, Rajeev K. Varshney, and Deyue Yu. 2022. "Genome-Wide Association Analysis of Yield-Related Traits of Soybean Using Haplotype-Based Framework" Biology and Life Sciences Forum 11, no. 1: 49. https://doi.org/10.3390/IECPS2021-12036