
Effects of Waterlogging on Growth and Development of Bread Wheat Genotypes †

 , , , and
Abstract
:1. Introduction
2. Material and Methods
2.1. Germplasm and Growth Conditions
2.2. Waterlogging Imposition
2.3. Plants Evaluation and Measurements
2.4. Statistical Analysis
3. Results
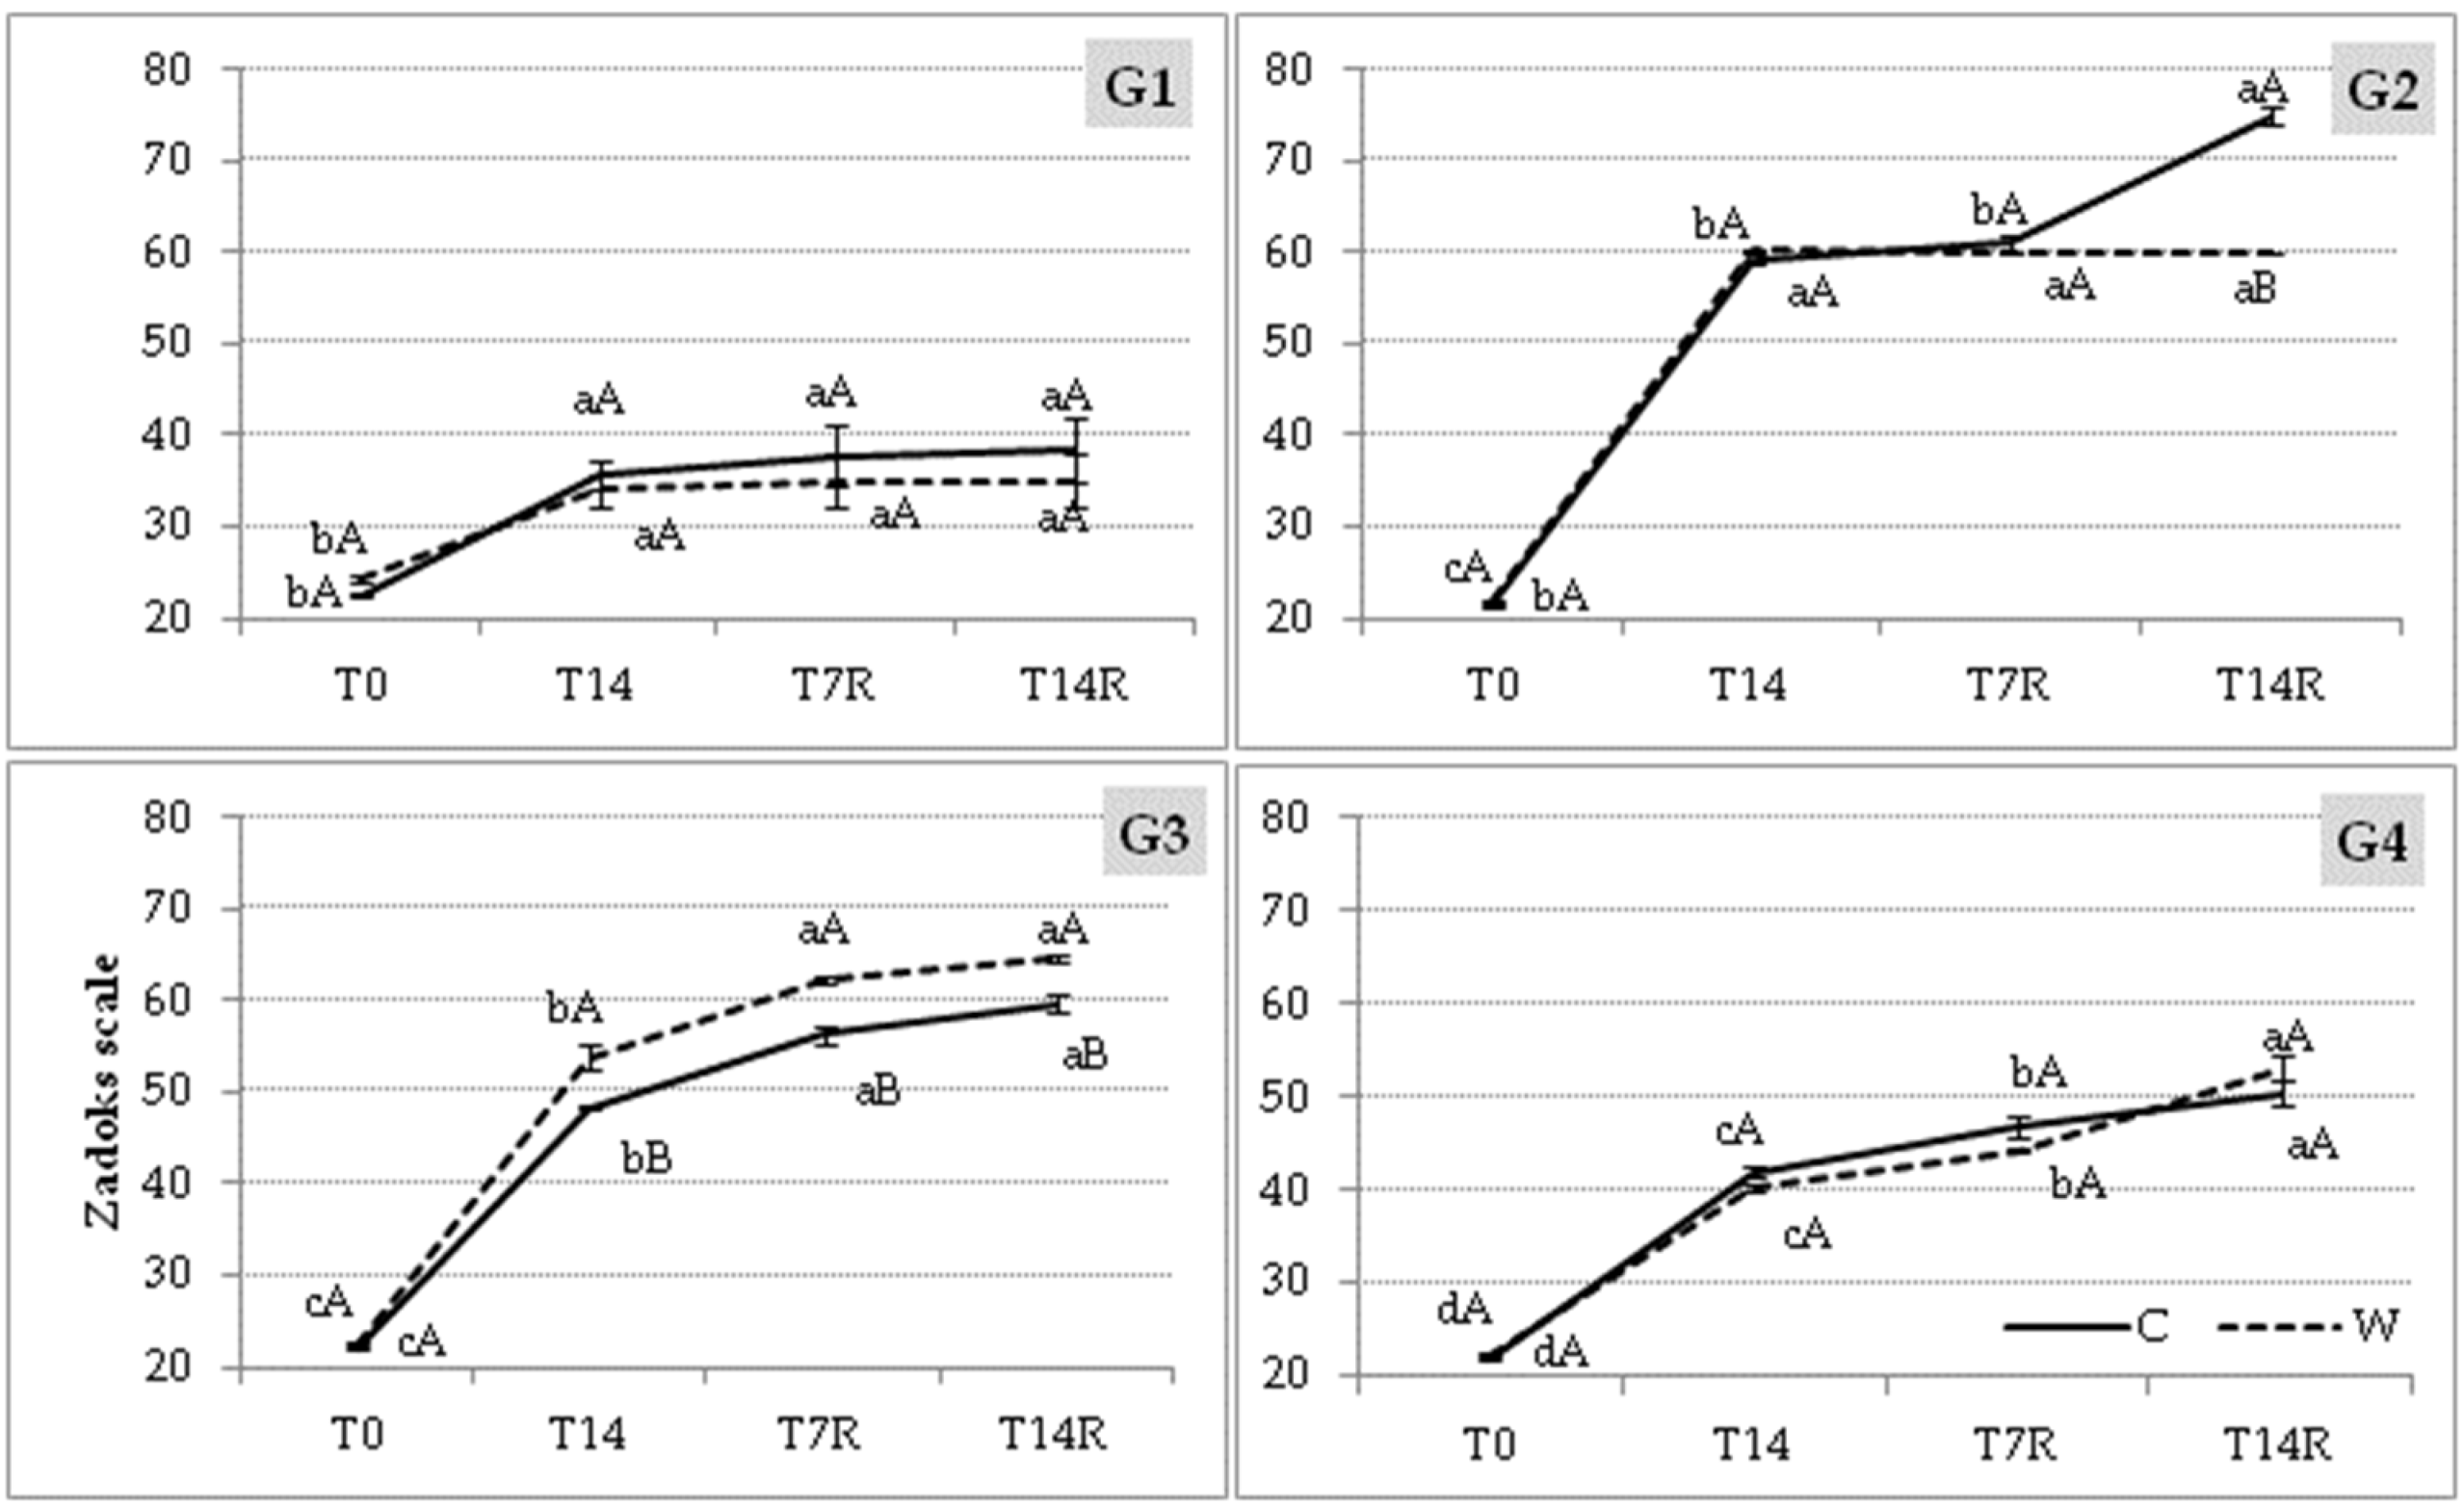
3.1. Growth Stages
3.2. Main Shoot Height
3.3. Tillers Number
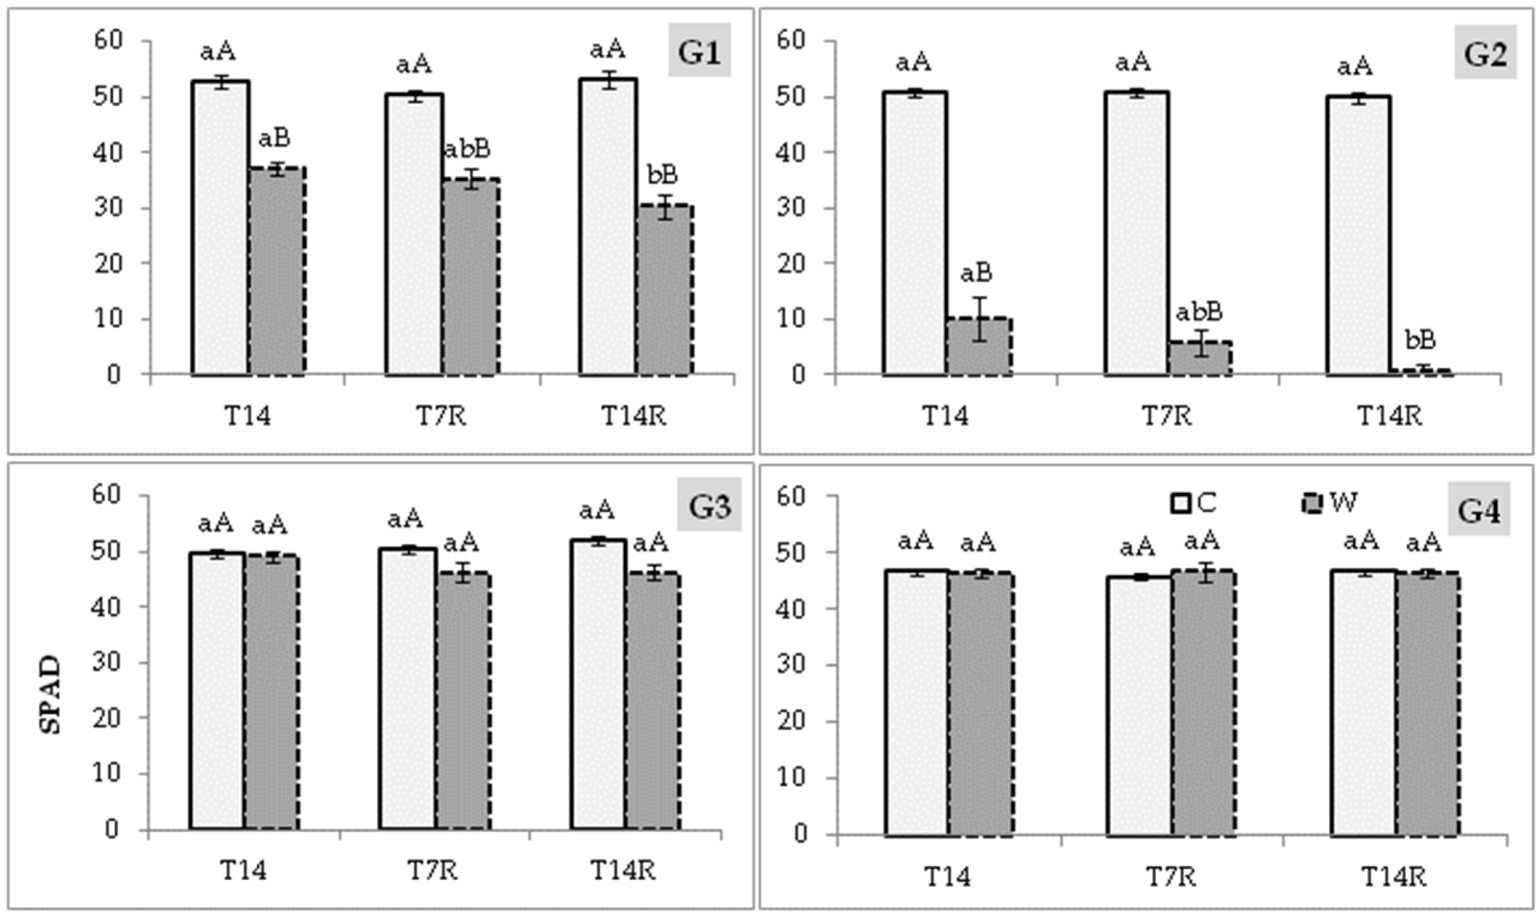
3.4. Chlorophyll Relative Content (SPAD Measurements)
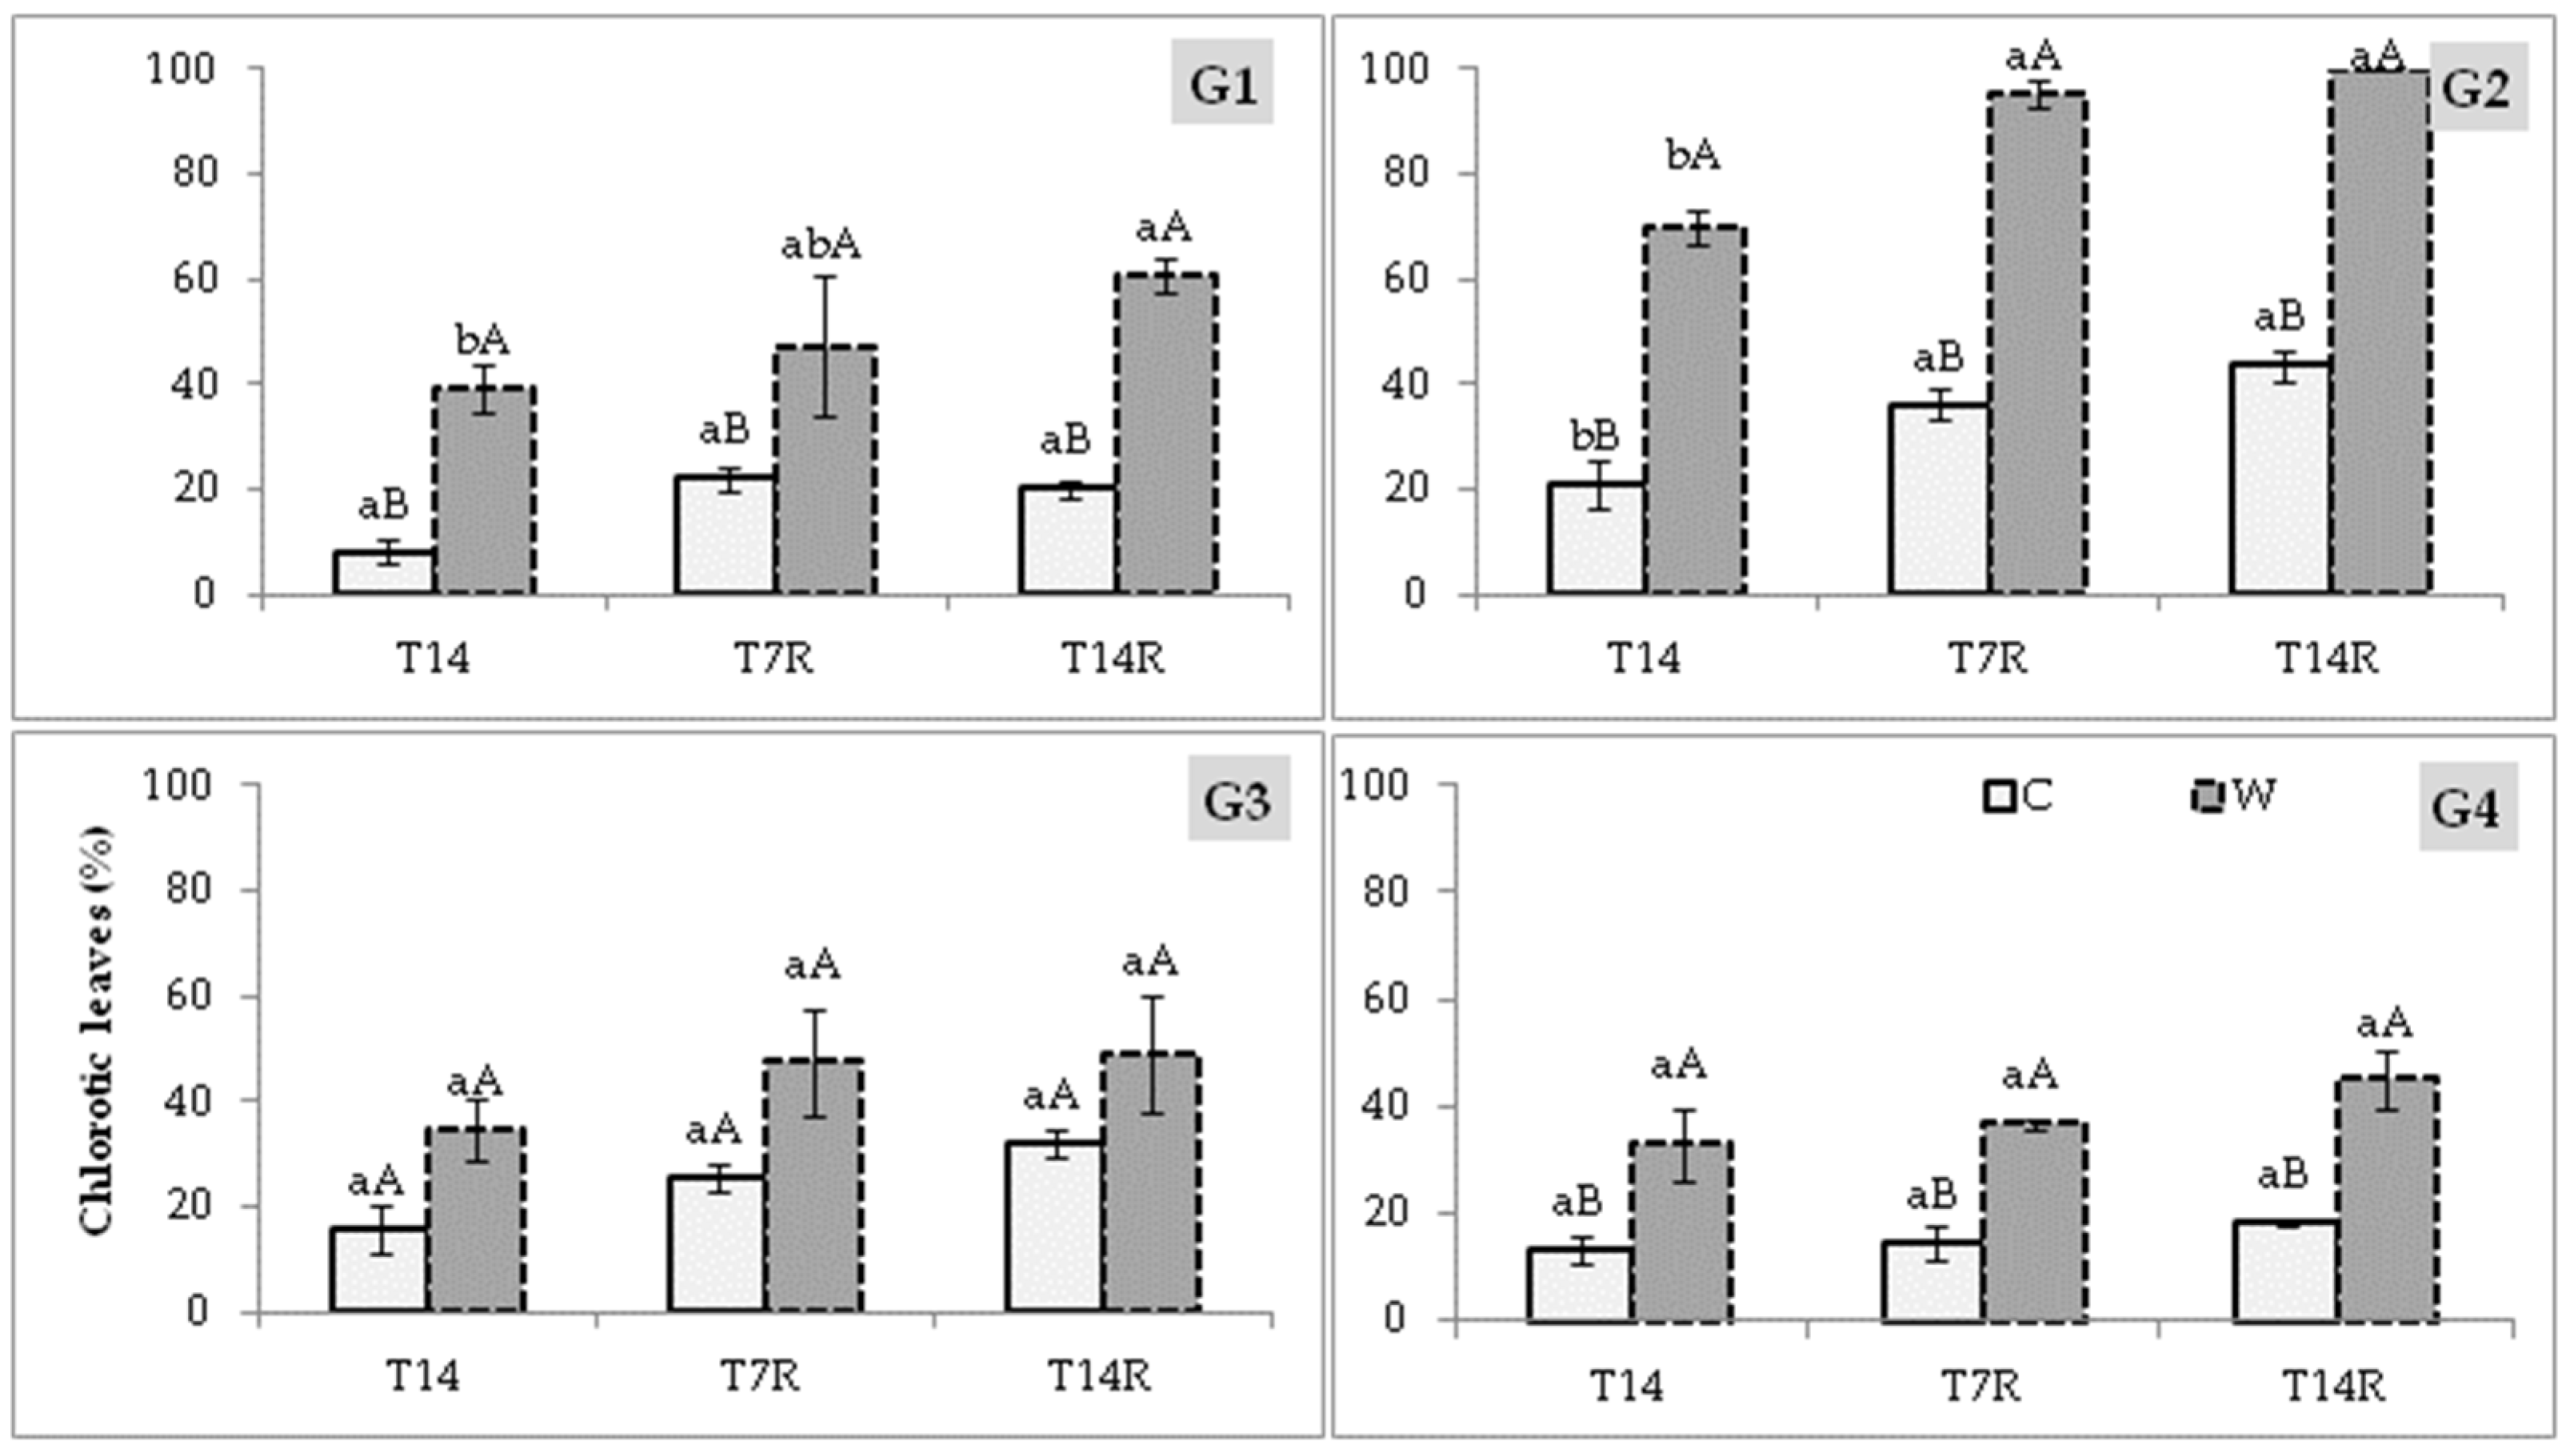
3.5. Percentage of Chlorotic Leaves
4. Discussion
5. Conclusions
Author Contributions
Funding
Institutional Review Board Statement
Informed Consent Statement
Data Availability Statement
Conflicts of Interest
References
- IPCC. Climate change 2014: Mitigation of climate change. In Contribution of Working Group III to the Fifth Assessment Report of the Intergovernmental Panel on Climate Change; Edenhofer, O., Pichs-Madruga, R., Sokona, Y., Farahani, E., Kadner, S., Seyboth, K., Adler, A., Baum, I., Brunner, S., Eickemeier, P., et al., Eds.; Cambridge University Press: Cambridge, UK; New York, NY, USA, 2014. [Google Scholar]
- Gunther, G.B.; Manske, P.; Vlek, L.G. Root architecture. Wheat as a model plant. In Plant Roots the Hidden Half, 3rd ed.; Yoav, W., Eshel, A., Kafkaf, U., Eds.; Marcel Dekker: New York, NY, USA, 2002. [Google Scholar]
- Herzog, M.; Striker, G.G.; Colmer, T.D.; Pedersen, O. Mechanisms of waterlogging tolerance in wheat—A review of root and shoot physiology. Plant Cell Environ. 2016, 39, 1068–1086. [Google Scholar] [CrossRef] [PubMed]
- Fukao, T.; Barrera-Figueroa, B.E.; Juntawong, P.; Peña-Castro, J.M. Submergence and waterlogging stress in plants: A review. Highlighting research opportunities and understudied aspects. Front. Plant Sci. 2019, 10, 340. [Google Scholar] [CrossRef] [PubMed]
- Hörtensteiner, S. Chlorophyll degradation during senescence. Annu. Rev. Plant. Biol. 2006, 57, 55–77. [Google Scholar] [CrossRef] [PubMed]
- Araki, H.; Hamada, A.; Hossain, M.A.; Takahashi, T. Waterlogging at jointing and/or after anthesis in wheat induces early leaf senescence and impairs grain filling. Field Crops Res. 2012, 137, 27–36. [Google Scholar] [CrossRef]
- de San Celedonio, R.P.; Abeledo, L.G.; Miralles, D.J. Identifying the critical period for waterlogging on yield and its components in wheat and barley. Plant Soil 2014, 378, 265–277. [Google Scholar] [CrossRef]
- Collaku, A.; Harrison, S.A. Losses in wheat due to waterlogging. Crop Sci. 2002, 42, 444–450. [Google Scholar] [CrossRef]
- Malik, A.I.; Colmer, T.D.; Lambers, H.; Setter, T.L.; Schortemeyer, M. Short-term waterlogging has long-term effects on the growth and physiology of wheat. New Phytol. 2002, 153, 225–236. [Google Scholar] [CrossRef]
- Scotti-Campos, P.; Semedo, J.N.; Pais, I.P.; Oliveira, M.; Passarinho, J.; Santos, M.; Almeida, A.S.; Costa, A.R.; Pinheiro, N.; Bagorro, C.; et al. Physiological responses to drought in four developed Triticum aestivum groups. Emir. J. Food Agric. 2015, 27, 178–185. [Google Scholar] [CrossRef] [Green Version]
- Zadoks, J.C.; Chang, T.T.; Konzak, C.F. A decimal code for the growth stages of cereals. Weed Res. 1974, 14, 415–421. [Google Scholar] [CrossRef]
- de San Celedonio, R.P.; Abeledo, L.G.; Brihet, J.; Miralles, D.J. Waterlogging affects leaf and tillering dynamics in wheat and barley. J. Agron. Crop Sci. 2016, 202, 409–420. [Google Scholar] [CrossRef]
- Poudel, P.B.; Poudel, M.R. Heat Stress Effects and Tolerance in Wheat: A Review. J. Biol. Today’s World 2020, 9, 217. [Google Scholar]
- Malik, A.I.; Colmer, T.D.; Lambers, H.; Schortemeyer, M. Changes in the physiological and morphological traits of roots and shoots of wheat in response to different depths of waterlogging. Aust. J. Plant Physiol. 2001, 28, 1121–1131. [Google Scholar] [CrossRef]
- Robertson, D.; Zhang, H.; Palta, J.A.; Colmer, T.; Turner, N.C. Waterlogging affects the growth, development of tillers, and yield of wheat through a severe, but transient, N deficiency. Crop Past. Sci. 2009, 60, 578–586. [Google Scholar] [CrossRef]
- Amri, M.; El Ouni, M.H.; Salem, M.B. Waterlogging affect the development, yield and components, chlorophyll content and chlorophyll fluorescence of six bread wheat genotypes (Triticum aestivum L.). Bulg. J. Agric. Sci. 2014, 20, 647–657. [Google Scholar]
- Kuroha, T.; Nagai, K.; Gamuyao, R.; Wang, D.R.; Furuta, T.; Nakamori, M.; Kitaoka, T.; Adachi, K.; Minami, A.; Mori, Y.; et al. Ethylene-gibberellin signaling underlies adaptation of rice to periodic flooding. Science 2018, 361, 181–186. [Google Scholar] [CrossRef] [PubMed] [Green Version]
- Alzueta, I.; Abeledo, L.G.; Mignone, C.M.; Miralles, D.J. Differences between wheat and barley in leaf and tillering coordination under contrasting nitrogen and sulfur conditions. Eur. J. Agron. 2012, 41, 92–102. [Google Scholar] [CrossRef]
- Anee, T.I.; Nahar, K.; Rahman, A.; Mahmud, J.A.; Bhuiyan, T.F.; Alam, M.U.; Fujita, M.; Hasanuzzaman, M. Oxidative damage and antioxidant defense in Sesamum indicum after different waterlogging durations. Plants 2019, 8, 196. [Google Scholar] [CrossRef] [PubMed] [Green Version]
- Manik, S.M.N.; Pengilley, G.; Dean, G.; Field, B.; Shabala, S.; Zhou, M. Soil and crop management practices to minimize the impact of waterlogging on crop productivity. Front. Plant Sci. 2019, 10, 140. [Google Scholar] [CrossRef] [PubMed] [Green Version]


| Genotype | Water Treatment | T0 | T14 | T14R | End of Growth Cycle |
|---|---|---|---|---|---|
| G1 | C | 4.9 ± 0.54 aA | 4.7 ± 0.19 aA | 6.7 ± 0.47 aA | 1.4 ± 0.29 bA |
| W | 4.9 ± 0.34 bA | 5.9 ± 0.62 abA | 7.5 ± 1.06 aA | 1.9 ± 0.48 cA | |
| G2 | C | 2.1 ± 0.22 abA | 2.6 ± 0.27 aA | 2.6 ± 0.42 aA | 1.8 ± 0.17 bA |
| W | 2.1 ± 0.08 aA | 0.0 ± 0.00 bB | 0.0 ± 0.00 bB | 0.0 ± 0.00 bB | |
| G3 | C | 2.4 ± 0.33 aA | 1.9 ± 0.30 aA | 3.1 ± 0.95 aA | 2.0 ± 0.85 aA |
| W | 2.4 ± 0.15 aA | 2.6 ± 0.23 aA | 1.6 ± 0.31 aA | 1.0 ± 0.25 aA | |
| G4 | C | 2.3 ± 0.57 aA | 2.1 ± 0.60 aA | 2.9 ± 0.64 aA | 1.3 ± 0.60 aA |
| W | 2.2 ± 0.21 aA | 2.5 ± 0.29 aA | 1.1 ± 0.36 aB | 1.8 ± 0.28 aA |
Publisher’s Note: MDPI stays neutral with regard to jurisdictional claims in published maps and institutional affiliations. |
© 2021 by the authors. Licensee MDPI, Basel, Switzerland. This article is an open access article distributed under the terms and conditions of the Creative Commons Attribution (CC BY) license (https://creativecommons.org/licenses/by/4.0/).
Share and Cite
Pais, I.P.; Moreira, R.; Semedo, J.N.; Reboredo, F.H.; Lidon, F.C.; Maçãs, B.; Scotti-Campos, P. Effects of Waterlogging on Growth and Development of Bread Wheat Genotypes. Biol. Life Sci. Forum 2022, 11, 38. https://doi.org/10.3390/IECPS2021-11989
Pais IP, Moreira R, Semedo JN, Reboredo FH, Lidon FC, Maçãs B, Scotti-Campos P. Effects of Waterlogging on Growth and Development of Bread Wheat Genotypes. Biology and Life Sciences Forum. 2022; 11(1):38. https://doi.org/10.3390/IECPS2021-11989
Chicago/Turabian StylePais, Isabel Pereira, Rita Moreira, José Nobre Semedo, Fernando Henrique Reboredo, Fernando Cebola Lidon, Benvindo Maçãs, and Paula Scotti-Campos. 2022. "Effects of Waterlogging on Growth and Development of Bread Wheat Genotypes" Biology and Life Sciences Forum 11, no. 1: 38. https://doi.org/10.3390/IECPS2021-11989