Article

Inhibitory Effect of Aqueous Extracts from Egeria densa Planch. on Cyanobacteria Microcystis aeruginosa (Kützing) Lemmermann Growth

by
Ashika Wijesinghe
,
Mudalige Don Hiranya Jayasanka Senavirathna
* and
Takeshi Fujino
Graduate School of Science and Engineering, Saitama University, Saitama 338-8570, Japan
*
Author to whom correspondence should be addressed.
Hydrobiology 2023, 2(3), 491-506; https://doi.org/10.3390/hydrobiology2030033
Submission received: 3 August 2023 / Revised: 6 September 2023 / Accepted: 13 September 2023 / Published: 15 September 2023

Abstract

:
This study aimed to investigate the allelopathic effect of live Egeria densa Planch. and its aqueous extracts in inhibiting the cyanobacterium Microcystis aeruginosa (Kützing) Lemmermann through a possible growth inhibition pathway. Under coexistence, the presence of live E. densa reduced the growth of M. aeruginosa by 48% compared to when M. aeruginosa was alone. Consequently, we prepared two separate aqueous extracts with distilled water: one from E. densa plants collected from monocultures, and the other from E. densa plants collected from co-cultivation with M. aeruginosa. At a concentration of 0.5 g/L, both extracts successfully suppressed the growth of M. aeruginosa throughout the 5-day exposure period. The extracts obtained from E. densa plants grown in a combined culture with M. aeruginosa showed significant growth-inhibiting capabilities compared to the extracts obtained from E. densa monoculture (p < 0.05). They showed 22% more growth inhibition compared to cultures exposed to monoculture extracts at day 5, indicating that the production of allelochemicals in E. densa was induced during co-existence with cyanobacteria. However, the higher concentrations (2 and 4 g/L) of both extracts did not effectively exhibit a successful inhibitive ability, possibly due to the presence of high nutrient concentrations, specifically PO43−, which may be potentially suppressing the activity of allelochemicals. Further studies are recommended in identifying the specific allelochemicals and exploring their practical implementation in the field.

1. Introduction

Cyanobacterial blooms are a significant global environmental threat worldwide [1,2,3]. The proliferation of cyanobacteria can be attributed to various factors, such as the influx of excessive nutrients from poor agricultural practices, the discharge of domestic and industrial solid and liquid waste, and changes in environmental parameters (i.e., temperature, light) [1,4,5]. They are responsible for various issues including eutrophication, hypoxia, and mortality of aquatic fauna [1,2] in both natural and man-made aquatic ecosystems. Furthermore, these blooms produce toxins, such as microcystins, which can cause severe health complications and even death in both animals and humans [5,6]. The problem has spread from temperate and tropical environments to natural and man-made aquatic environments. Therefore, the establishment of efficient methods to control harmful cyanobacteria blooms is essential for preserving water quality, protecting biodiversity, and ensuring the well-being of ecosystems and communities.
Numerous conventional in situ methods have been employed to control harmful cyanobacterial blooms. These methods include the application of synthetic halogenated algaecides, the utilization of chemicals and bio-coagulants, ultrasonic technology, sediment dredging, and the implementation of aeration towers [1,7,8]. However, these methods either adversely affect other aquatic organisms or impose significant initial investment and operational costs [1,9]. Consequently, there is a growing interest in natural control methods for in situ biological cyanobacteria mitigation as a safer alternative. Phytoplanktivorous fishes, such as Hypophthalmichthys nobilis and Oreochromis niloticus, are commonly employed in the bio-manipulation of cyanobacteria. These fishes directly feed on cyanobacteria, including toxin-producing Microcystis aeruginosa [10]. Moreover, the utilization of macrophytes and their extracts as a biological control method for cyanobacteria has been widely adopted in previous studies due to their minimal impact on the ecosystem and human health [11,12]. A new generation of natural algaecides based on allelochemicals from aquatic plants increased the attention of researchers because of their low toxicity on other aquatic life [13].
Cyanobacteria growth is inhibited by the various mechanisms exhibited by aquatic macrophytes, including nutrient absorption, light reduction through shading, and the release of allelochemicals. Aquatic plants primarily release allelochemicals to compete for resources, prevent herbivores, and help their survival in their environment. These chemicals also influence ecosystems by affecting the growth of neighboring plants or cyanobacteria. According to the Maredová et al. [14], submerged plants and their extracts, including Chara globularis, Elodea nuttallii, Ceratophyllum submersum, Hydrilla verticillata, Myriophyllum spicatum, Myriophyllum heterophyllum, and Vallisneria americana, showed the inhibition of cyanobacterial growth. This phenomenon occurs because the formation of cyanobacterial bloom layer on the surface of the water reduces light penetration into the depths, potentially causing light scarcity for submerged macrophytes [15]. Consequently, these plants may utilize the production and release of compounds that inhibit cyanobacterial growth as a defensive approach in their competition for light resources [14].
Numerous studies have been conducted using different macrophyte species and cyanobacteria to specifically induce an allelopathic effect to reduce cyanobacterial growth [16,17,18,19,20,21]. However, the inhibitive mechanisms and the efficiency of cyanobacterial control vary with macrophyte species and the condition of the aquatic environment. Declerck et al. [22] reported that cyanobacteria combined with E. nuttallii in a mesocosm exhibited a clear decline in growth at high nutrient levels. They demonstrated that cyanobacterial growth inhibition in a combined culture with macrophytes is caused by many factors, such as the shading effect, nutrient competition, and the release of anti-cyanobacterial allelochemicals. Vanderstukken et al. [23] used two macrophytes, E. densa and Potamogeton illinoensis, to investigate the consequences of allelopathy, excluding nutrient competition and zooplankton grazing effects on cyanobacterial growth. Their study showed that both macrophytes inhibited the growth of cyanobacteria by allelopathic effects. Senavirathna et al. [24] also discussed the cyanobacterial inhibitory capacity of E. densa and the influence of light parameters on the allelopathic reaction. However, the practical application of live macrophytes for in situ control of cyanobacteria is a complex process due to various reasons, including environmental factors, species-specific interactions, and the potential for disrupting the ecological balance through invasive behavior. Therefore, research interest has grown in certain biologically derived substances (BDSs) found in various macrophytes, which may also have the potential to inhibit the growth of cyanobacteria. Pretreatments such as co-culturing, mechanical grinding, autoclaving during the extraction process, or the use of aqueous and organic solvents can enhance the inhibitory potential of the extracted compounds. Using aqueous solutions for extracting allelochemicals from macrophytes provides several advantages, such as being environmentally friendly, cost-effective, and safe, while preserving the biological activity of the compounds.
A few studies have investigated the application of powdered fresh macrophyte leaves and leaf extracts to obtain their natural allelochemical, thereby inhibiting cyanobacterial growth [14,25,26]. Gross et al. [27] and Mulderij et al. [28] demonstrated that extracts derived from M. spicatum, Stratiotes aloides, Ceratophyllum demersum, and Najas marina spp. exhibit significant inhibitory effects on cyanobacteria growth. These studies focused on highly invasive allelopathic macrophyte species as a potential inhibitor of cyanobacterial growth. By using rapidly growing invasive plants to produce extracts, this method becomes a sustainable and cost-effective approach to inhibit the growth of cyanobacteria. Many invasive macrophyte species such as M. spicatum, C. demersum, and E. densa are widely distributed in many freshwater ecosystems and have shown higher allelopathic capacities [29,30,31]. Therefore, compounds extracted from such macrophytes can be used to suppress cyanobacteria in water bodies, particularly in cases where the introduction of live macrophytes is limited due to their invasive nature. This method is especially applicable to water bodies where the application of live macrophytes is impractical (i.e., boat yards, manmade shallow ponds in parks, or fountains with aesthetic value).
In this study, we selected E. densa plant, which is an invasive perennial macrophyte known to produce allelochemicals that inhibit cyanobacteria, as indicated in previous studies [11,23,24,32]. Although research has confirmed the applicability of live plants and plant extracts to suppress cyanobacteria, the enhanced allelochemical content in extracts of macrophytes that co-cultured with cyanobacteria has not been studied. Therefore, in this study, we hypothesize that co-cultivation of E. densa with cyanobacteria induces the production of allelochemicals in E. densa, resulting in an enhanced inhibitory effect of plant extracts on the growth of M. aeruginosa.

2. Materials and Methods

2.1. Preparation of Stock Cultures

2.1.1. Microcystis aeruginosa (Kützing) Lemmermann Culture

M. aeruginosa was selected for this study because it is known to be the most common bloom-forming cyanobacterial species worldwide [3]. M. aeruginosa strains (NIES-111) were obtained from the National Institute of Environmental Studies (NIES), Japan. The cells were cultured in disinfected 500 mL Erlenmeyer flasks using the BG-11 medium [33] and maintained at a controlled temperature of 20 °C. A photoperiod of 12 h darkness and 12 h light was maintained using an automatic setup device (REVEX PT7, Saitama, Japan) with a light intensity of 30 µmol photons m−2 s−1 photosynthetically active radiation (PAR) using LED lamps inside the incubators. The flasks were closed using porous stoppers (SILICOSEN, Shin-Etsu Polymer Co., Ltd., Tokyo, Japan). The cultures were gently shaken daily during acclimatization, and cultures in the exponential stage were used for experiments.

2.1.2. Egeria densa Planch. Culture

In this study, agrochemicals and chemical-free E. densa were commercially purchased and cultured in 20-litre (25 cm × 24 cm × 40 cm, height × width × length) glass tanks at 25 ± 2 °C in a temperature-controlled room. A layer of nutrient-removed river sand was used as the substrate at the bottom of the glass tank. Nutrients were provided by adding 5 ppm of commercial aquaponic solution (Hyponex concentrated nutrient solution, Hyponex, Osaka, Japan). Plants were exposed to a 12 h/12 h light/dark photoperiod with a light intensity of 80–85 µmol photons m−2 s−1 PAR using LED lamps at plant height. Water levels were kept constant by replenishing with distilled water.

E. densa Monoculture and Combined Culture with M. aeruginosa

We maintained two types of cultures: monocultures of E. densa and combined cultures of E. densa with M. aeruginosa, both under the same conditions. To establish these cultures, six healthy E. densa cuttings with an approximate length of 10 cm were planted in six 1 L Pyrex glass beakers by fixing them to half-cylindrical rubber sponges (Carboy Inc. Chiba, Japan). All beakers were filled with 1 L of 10% Hoagland nutrient solution (HNS). For the combined cultures, three of the E. densa beakers were inoculated with M. aeruginosa cells at a cell density of 2.1 ± 0.2 × 10⁴ cells/mL.
The cultures were allowed to acclimate for 5 days under controlled conditions within incubators, which maintained a light intensity of 80 µmol photons m−2 s−1 PAR, a temperature of 25 ± 1 °C, and a light duration of 12 h/12 h. After acclimatization, treatment was continued for 7 days under the same conditions. The water levels were kept constant throughout the experiment. After 7 days, macrophyte samples were collected and rinsed before plant samples were stored in a −80 °C freezer until the extraction process.

2.2. E. densa Fresh Tissue Extraction Processes

Fresh plant tissue extract was prepared according to Zhang et al. [34] with modifications using distilled water. Approximately 200 mg of fresh plant samples, separately collected from both E. densa monocultures and E. densa grown with M. aeruginosa, were finely crushed using a cold ceramic mortar and pestle in the presence of liquid nitrogen, utilizing 5 mL of distilled water. The extraction mixtures were transferred into 15 mL centrifuge tubes and centrifuged at 1400× g (TOMY MX-105, Tomy Seiko Co., Ltd., Tokyo, Japan) at 4 °C for 10 min separately. The extracts were stored at −80 °C for further experiments.

2.3. Experimental Design

2.3.1. Application of E. densa Live Plants

An experiment including M. aeruginosa monocultures and combined cultures (2 × 10⁴ cells/mL) with E. densa was conducted to confirm the inhibition of M. aeruginosa growth in the presence of E. densa live plants. Artificial plants were used in the M. aeruginosa monoculture to eliminate the potential shading effect of E. densa plants. The cultures were temperature-controlled at 25 ± 1 °C and subjected to a 12 h/12 h light/dark photoperiod using an automatic setup device (REVEX PT7) with a light intensity of 80 µmol photons m−2 s−1 PAR, achieved through LED lamps inside the incubators. The cultures were incubated for 7 days, with triplicates maintained for both mono and combined cultures.

2.3.2. Application of E. densa Extracts

Figure 1 represents the experimental procedure of E. densa aqueous extracts on M. aeruginosa inhibition. A cell suspension of cyanobacterium M. aeruginosa, with a cell density of 1 × 10⁵ cells/mL and a Chl-a concentration of 0.178 ± 0.005 μg/mL in BG-11 medium, was prepared for the experiment in accordance with the guidance levels of cyanobacteria that may potentially trigger restrictions of site use, as published by WHO [9,35]. This served as the initial cell suspension. The experiment was conducted in autoclaved 100 mL conical flasks filled to 50 mL with the M. aeruginosa suspensions. We used cultures in the exponential growth stage for the experiments. The openings of the flasks were secured with porous stoppers (SILICOSEN). The samples were acclimatized for 3 days before introducing the extracts. All experiments were conducted under controlled laboratory conditions. The cultures were temperature-controlled at 25 ± 1 °C and subjected to a 12 h/12 h light/dark photoperiod using an automatic setup device (REVEX PT7) with a light intensity of 80 µmol photons m−2 s−1 PAR and LED lamps inside of the incubators (Figure 1). The extracts were introduced after 4 days of acclimatization. The M. aeruginosa cultures were exposed to two different E. densa extracts at concentrations of 0, 0.5, 1, 2, and 4 g/L. Each flask was gently shaken twice daily during the incubation. Triplicates were maintained for each extract concentration. The experiment was conducted for 5 days, during which we regularly monitored growth parameters and collected samples every 24 h. The collected samples were centrifuged at 10,000× g for 15 min at 4 °C (TOMY MX-105) in 1.5 mL microcentrifuge tubes. The supernatant was removed, and the microcentrifuge tubes containing M. aeruginosa cell pellets were stored at −80 °C for further analysis.

2.4. Analytical Methods

The growth parameters of both M. aeruginosa monoculture and the combined culture with E. densa were measured to investigate the influence of different types and concentrations of E. densa extract on M. aeruginosa growth. Growth parameters of M. aeruginosa cultures were analyzed daily until the 5-day exposure period. To estimate M. aeruginosa growth, cell density, inhibition rate (IR), mean growth rate (μ), and Chl-a concentrations were analyzed.

2.4.1. Cell Density

Cell densities were determined by manual counting using a hemocytometer and light microscope (Zeiss Axiolab 5, Carl Zeiss, ZEISS, Tokyo, Japan) and Luna Automated Cell Counter (L10001, Logos Biosystems, Anyang, Republic of Korea) in a hemocytometer. The cell density was expressed as cells/mL. Detailed features of M. aeruginosa cells, including their shape, the presence of mucus, and the number of cells per group were observed using a light microscope (Zeiss Axiolab 5) at a magnification of 400× before and after treatment with different concentrations of E. densa extracts.

Inhibition Rate (IR)

The percentage of growth inhibition by each extract at different extract concentrations was calculated compared to the control group. The IR of the extracts on cyanobacteria growth was calculated according to Equation (1).
I R % = 1 N N o × 100
N and N o stand for the cell density of the treated culture and cell density of the control culture, respectively.

2.4.2. Chlorophyll-A

The M. aeruginosa suspension (1 mL) was collected and centrifuged at 10,000× g for 10 min at 4 °C (TOMY MX-105); the supernatant was removed, before storing the cell pellets at −80 °C until analysis. The concentration of Chl-a was measured by homogenizing the cell pellets in 1 mL of 95% ethanol. The samples were vibrated and incubated under dark conditions overnight at room temperature (25 ± 2 °C). The samples were then centrifuged at 10,000× g for 10 min at 4 °C (TOMY MX-105), and the supernatant was used to measure the absorbance spectrophotometrically (UV-1280) at 665 and 649 nm wavelengths. Chl-a concentration was calculated as μg/mL using Equation (2) described by Liu et al. [36].
C h l   a = 13.95 × A 665 6.88 × A 649
A 665 and A 649 are the absorbances at 665 nm and 649 nm, respectively, and the Chl-a concentration per protein was expressed.

2.4.3. Nitrate (NO3) and Phosphate (PO43−)

The NO3 and PO43− concentrations of E. densa extracts were evaluated using PACKTEST Nitrate (range 1–45 mg/L) and PACKTEST Phosphate (range 2–100 mg/L), respectively, with the Digital pack test meter (DPM-MTSP, KYORITSU CHEMICAL Corp, Japan). The extracts were filtered through 0.45 µm before the measurements.

2.4.4. Three-Dimensional Excitation–Emission Matrix (3D EEM)

The compounds present in two E. densa aqueous extracts were investigated using a 3D EEM created using a fluorescence spectrophotometer (LS 45, Perkin Elmer, Waltham, MA, USA). The principle of a fluorescence spectrophotometer is that the molecules in the sample absorb light energy at an extreme speed (~10−8 s) at certain wavelengths and produce emission light with greater wavelengths than the excitation wavelengths [37]. Since the excitation and emission wavelengths of every compound are unique and fixed [38], this method is widely utilized to identify the various compounds in solutions. The excitation and emission wavelengths were changed from 200 to 600 nm and 300 to 625 nm, respectively, at a scanning speed of 1500 nm/min.

2.5. Data Analysis

A statistical analysis was carried out statistical software (20.0, IBM SPSS) with a significance level of 5% (p ≤ 0.05) to evaluate the efficacy of two E. densa extracts, one from monoculture and the other from coexistence with M. aeruginosa, in inhibiting M. aeruginosa growth. Daily measurements of growth parameters over 5 days were obtained across varying extract concentrations (0, 0.5, 1, 2, and 4 g/L). The statistical analysis included a one-way analysis of variance (ANOVA) to identify differences in cell densities and Chl-a concentrations among the cultures exposed to two different extracts and the control, followed by post hoc tests. The two-sample t-test was carried out to compare the initial and final cell density, protein concentration, and Chl-a concentration of M. aeruginosa mono and combined culture with E. densa live plant. Each experiment was performed in triplicate. All of the graphs were created using OriginLab software 2022 (OriginLab Corporation, Northampton, MA, USA). All graphical images were created with BioRender.com.

3. Results

3.1. Effect of E. densa Live Plants on M. aeruginosa Growth during Coexistence
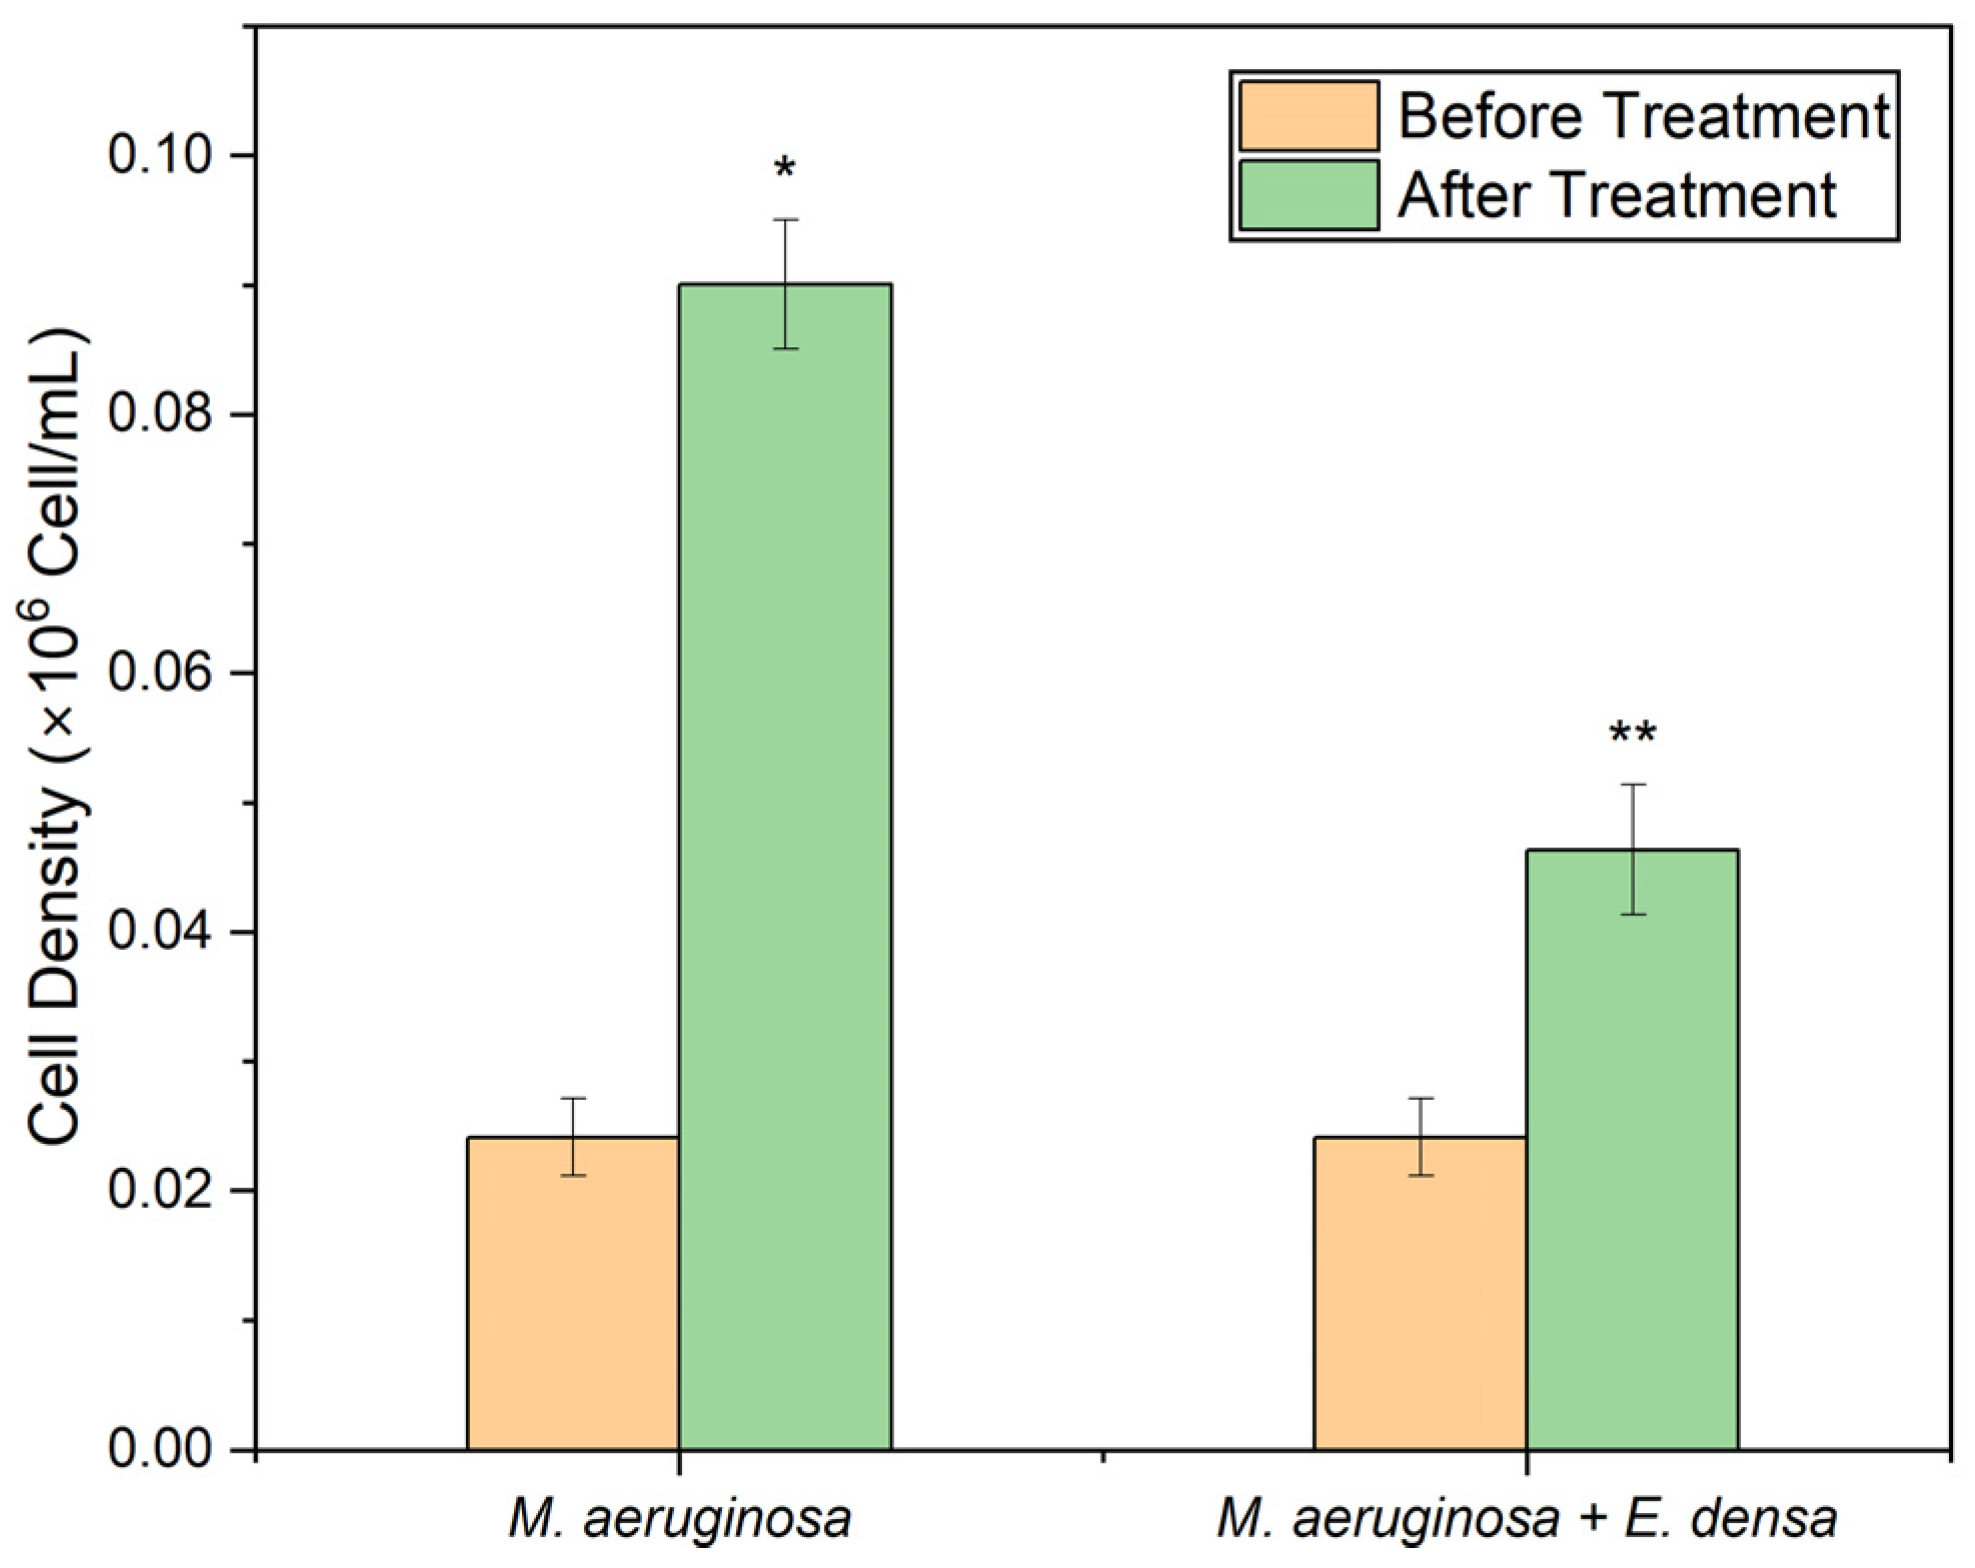
3.1.1. Cell Density

The initial cell density of M. aeruginosa culture was 0.024 ± 0.003 × 10⁶ cells/mL. The M. aeruginosa monoculture resulted a cell density of 0.09 ± 0.005 × 10⁶ cells/mL after 7 days, whereas the coculture of M. aeruginosa with E. densa showed a significantly lower cell density of 0.046 ± 0.005 × 10⁶ cells/mL (t(2) = 11.2366, p < 0.001) (Figure 2).

3.1.2. Protein Concentration

The initial protein concentration of the M. aeruginosa culture was 68.8 ± 8.1 μg/mL. The M. aeruginosa monoculture showed a protein concentration of 94.41 ± 8 μg/mL after 7 days of exposure, whereas the M. aeruginosa cultured with E. densa showed a significantly lower protein concentration of 78.42 ± 6.6 μg/mL after exposure (t(2) = 3.217, p = 0.03) (Figure 3), consistent with the cell density results (Figure 2).

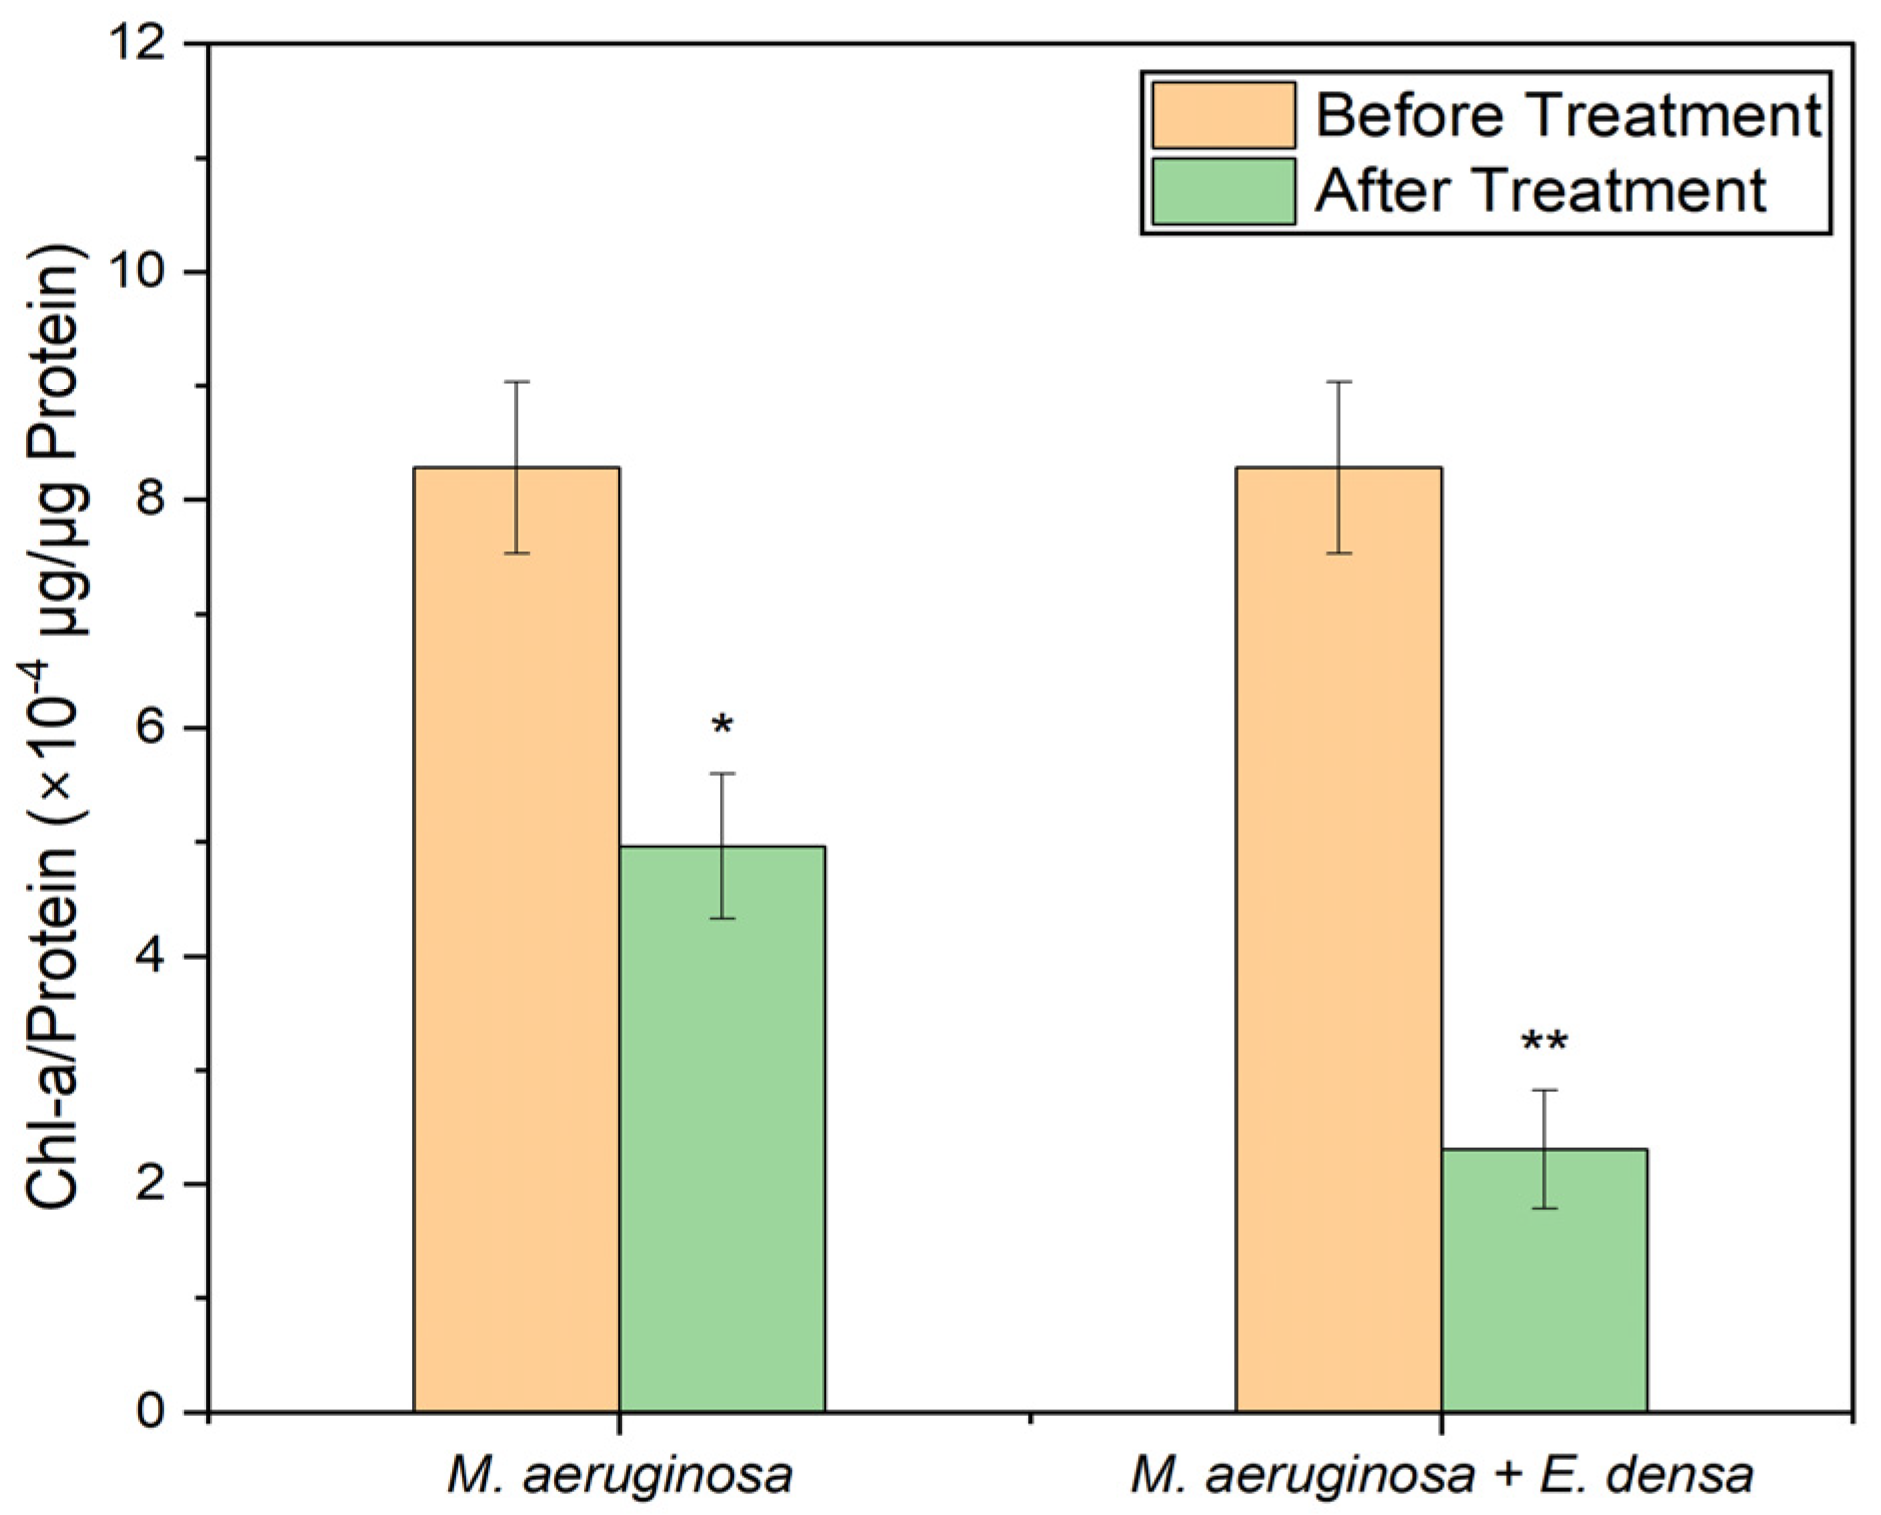
3.1.3. Chl-A Concentration

The M. aeruginosa monoculture with artificial plants showed an increase in Chl-a concentration per protein compared to the culture combined with E. densa (Figure 4). In contrast, when M. aeruginosa cultures were combined with E. densa, they exhibited a significantly lower Chl-a concentration compared to the monoculture (t(2) = 5.606, p = 0.004) after 7 days and appeared to be more controlled than the M. aeruginosa monoculture. The Chl-a concentration in the combined culture of M. aeruginosa was measured at 2.3 ± 0.5 × 10⁻⁴ µg/μg protein.

3.2. Effect of Different E. densa Extracts on Cyanobacteria Growth

3.2.1. Cell Density

Figure 5 shows the variation in the cell density of M. aeruginosa cultures under the effect of both E. densa extract gradients (0.5, 1, 2, and 4 g/L). At the end of the exposure period, the culture treated with a concentration of 0.5 g/L of the combined E. densa extract reported the lowest cell density (2.44 ± 0.1 cells/mL). A significantly lower cell density was observed in the culture treated with 0.5 g/L combined extract compared to the cell culture treated with 0.5 g/L E. densa monoculture extract and the control culture (F(2, 6) = 55.818, p < 0.001) after 5 days of exposure. Cultures treated with higher concentrations (2 and 4 g/L) of both extracts exhibited significantly increased growth of M. aeruginosa after day 3 compared with the control culture (p < 0.05). The highest cell density, 8.36 ± 0.1 cells/mL, was observed in cultures treated with 4 g/L of monoculture extract on day 5. M. aeruginosa cell cultures treated with both extracts showed high cell densities, especially after day 3, with high extract concentrations (2 and 4 g/L) compared to control cultures. However, cultures treated with E. densa combined extracts showed lower cell density when compared to cultures treated with extracts from E. densa monocultures.
The highest IR among cell cultures treated with the different concentrations of E. densa monoculture extracts was achieved by the 0.5 g/L concentration group, reaching 23.5% on day 2 (Figure 6a). Throughout the exposure period, the 0.5 g/L concentration group maintained a higher IR compared to all other concentration groups. The highest IR in the extracts obtained from E. densa combined culture was 31%, also observed in the 0.5 g/L concentration group on day 3 (Figure 6b). The 0.5 g/L concentration group of combined E. densa extracts consistently showed a high IR throughout the exposure period compared to concentration groups. Higher concentrations of both E. densa extracts did not exhibit any inhibition towards the end of the exposure period. However, the 1 g/L concentration group of combined E. densa extract did exhibit an increased IR only up to the third day.

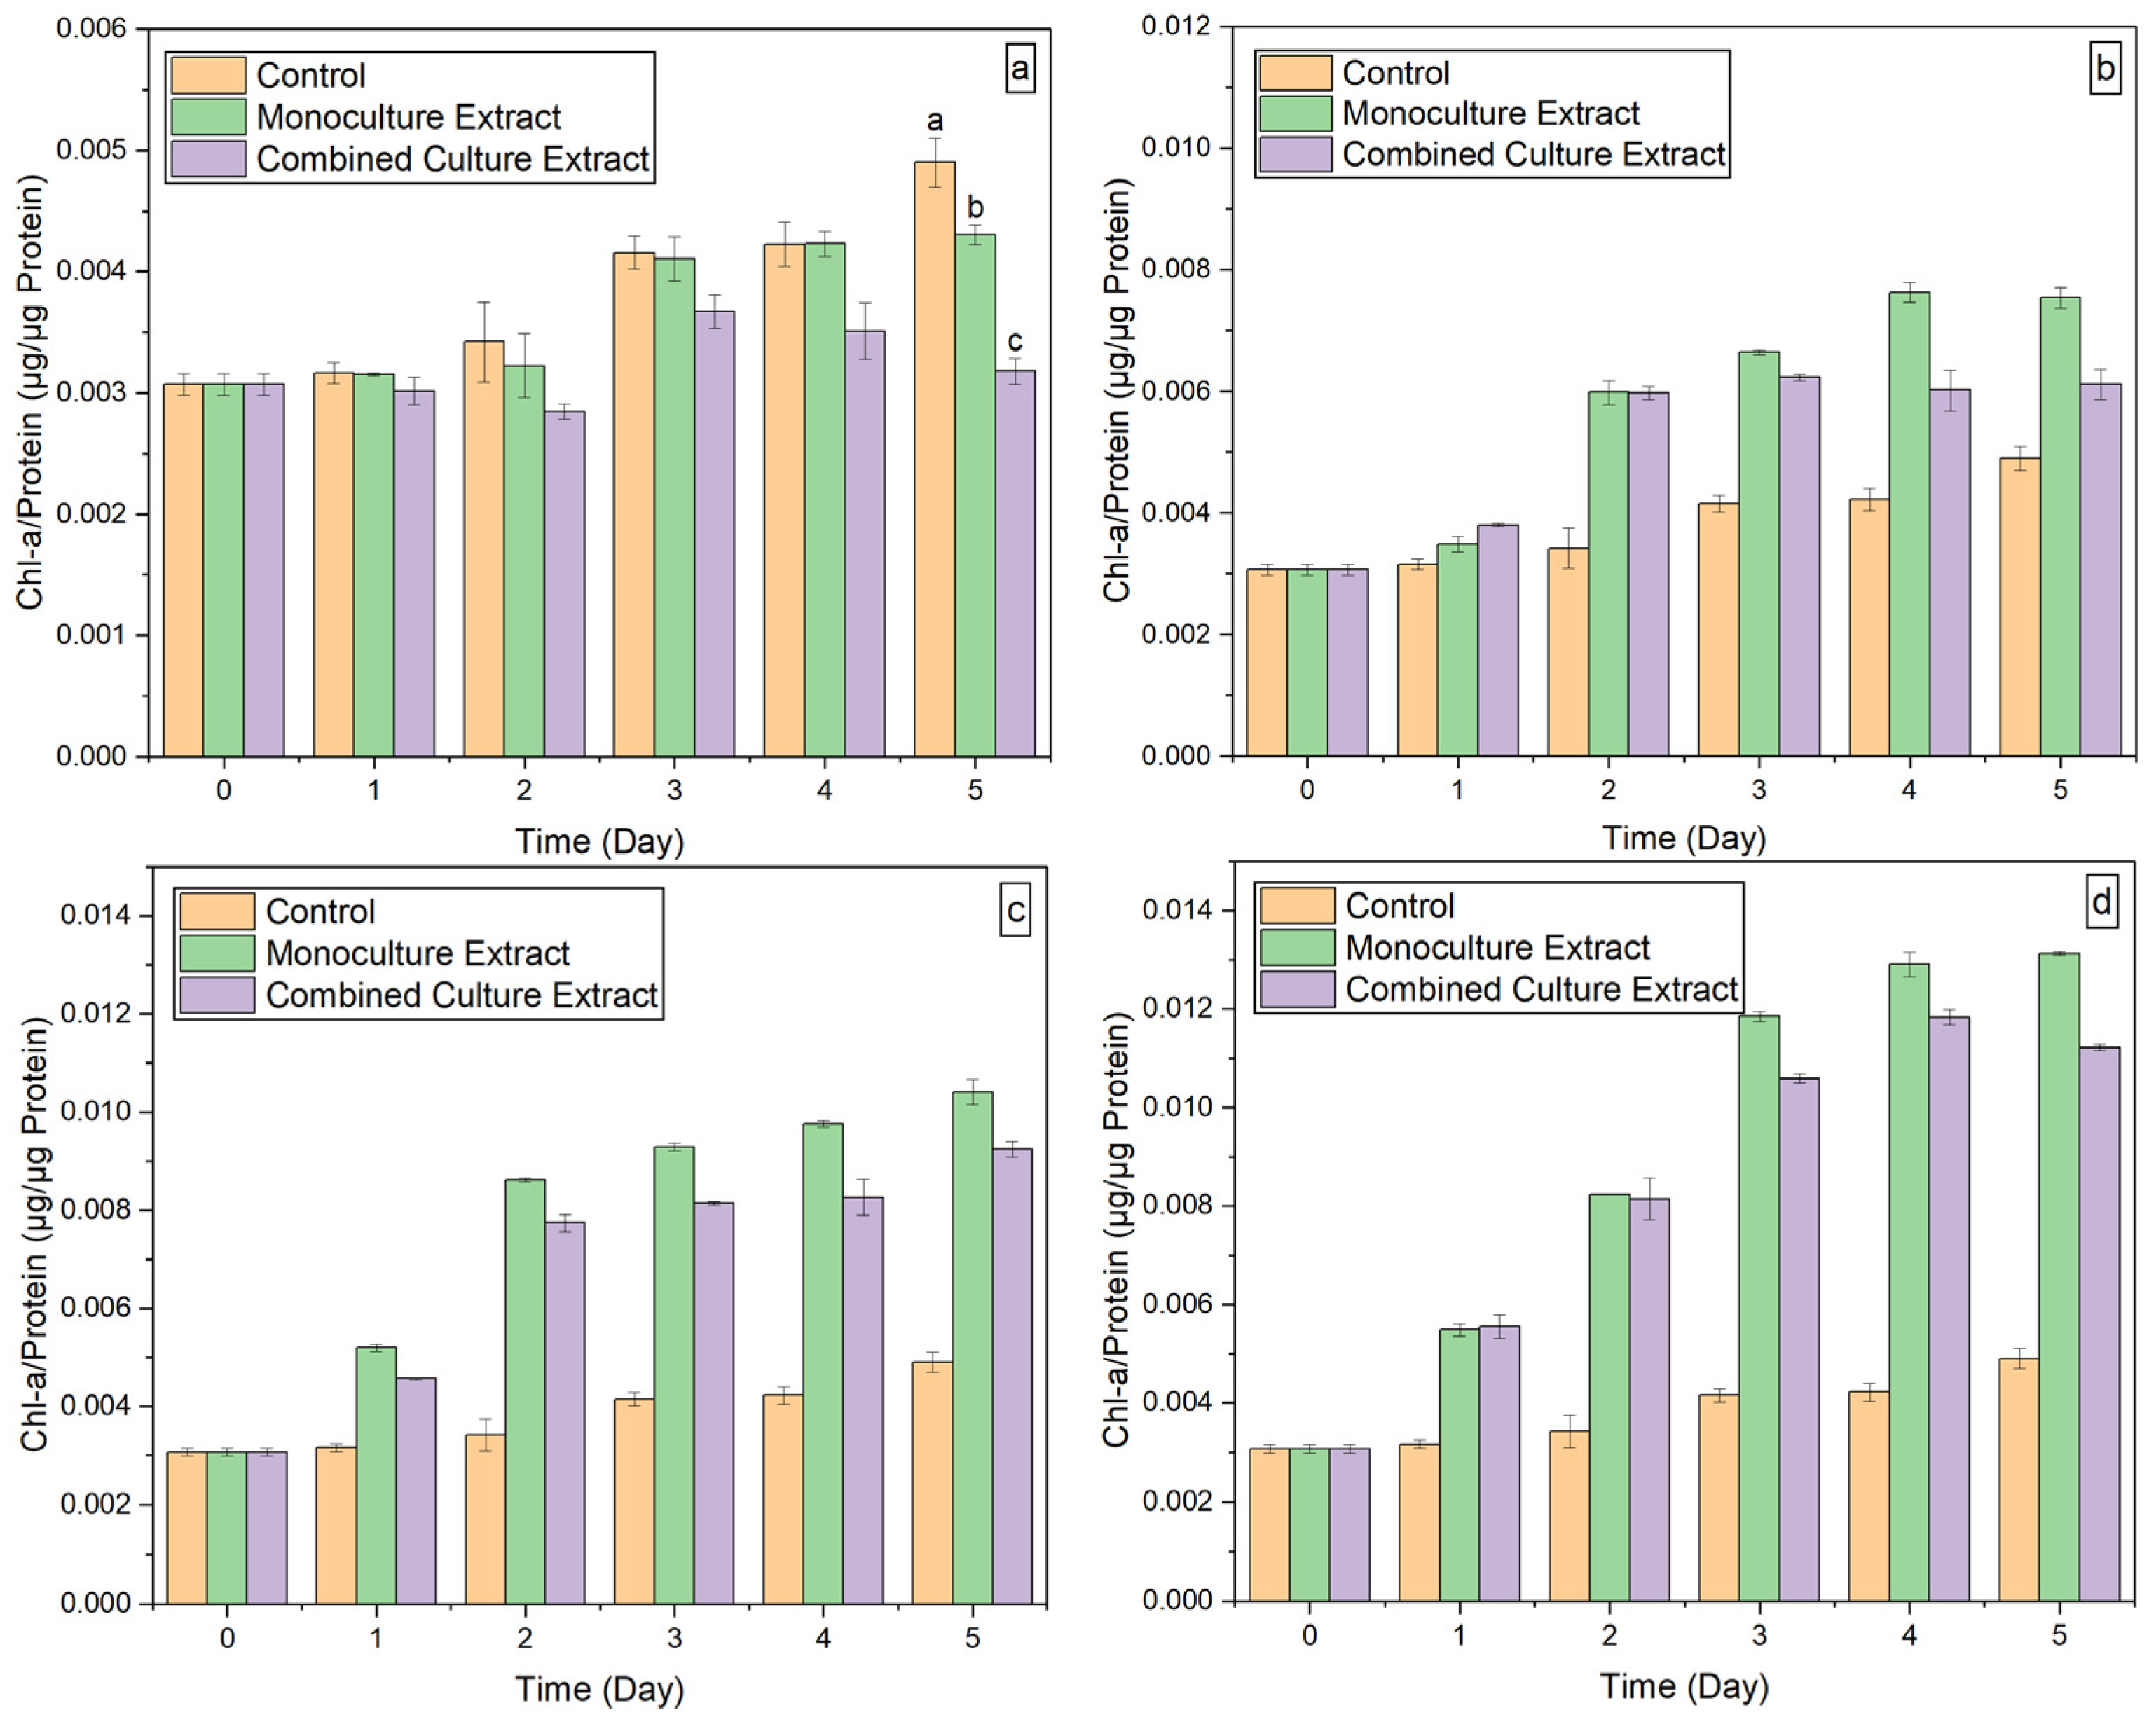
3.2.2. Chl-A Concentration

The Chl-a concentration in the treated M. aeruginosa cell cultures exhibited changes that were comparable to the variations in cell densities. All cultures treated with a 0.5 g/L concentration of both types of extracts showed lower Chl-a concentrations compared to the control culture (Figure 7). The Chl-a concentration of the cultures treated with the combined E. densa extract (0.5 g/L) was significantly lower than that of cultures treated with E. densa monoculture extracts (F(2, 6) = 118.457, p < 0.001) and the control (F(2, 6) = 118.457, p = 0.004) after day 5 of the exposure period. The lowest Chl-a concentration was observed in the culture treated with 0.5 g/L concentration of E. densa combined culture extract, measuring 3.2 ± 0.1 × 10⁻³ μg/μg protein on day 5. M. aeruginosa cultures treated with high concentrations (1, 2, and 4 g/L) of both types of E. densa extracts showed an increase in Chl-a concentration over time compared to control cultures. The highest Chl-a concentration was observed in the culture treated with 4 g/L E. densa monoculture extract on day 5 (131 × 10−3 μg/μg protein). However, cultures treated with the E. densa combined extracts showed lower Chl-a concentration than cultures treated with the monoculture extracts at all concentrations throughout the exposure period.

3.3. E. densa Extracts Analysis

The analysis of NO3 and PO43− concentrations in both E. densa monoculture and combined culture extract gradients showed that the NO3 concentration in both extracts is negligible and below the detection level of PACKTEST (<1 mg/L). Both extracts exhibited the availability of PO43− at higher concentrations (Figure 8). However, no PO43− was detected at a concentration of 0.5 g/L in either of the extracts (<2 mg/L). The extracts obtained from the E. densa monoculture exhibited a PO43− concentration of 7.5 ± 0.2 mg/L at 4 g/L, which is slightly higher than the concentration showed by the combined culture extract (7.4 ± 0.2 mg/L) at 4 g/L.
The 3D EEM obtained from both E. densa extracts displayed similar patterns with four distinct peaks (Figure 9). However, despite the similarity in the presence of these four peaks in both extracts, there were differences in their intensities. Specifically, the EEM of the extract obtained from E. densa combined culture showed higher intensities. These peaks represent the available groups of compounds and their respective intensities in the extracts. Peaks B, C, X, and Y, which are responsible for protein-like compounds, were observed in the emission wavelengths ranging from 300 to 345 nm, while peaks labeled A, D, W, and Z occurred in emission wavelengths ranging from 435 to 480 nm in the EEM, indicating their association with humic-like substances.

4. Discussion

The coculturing experiment of M. aeruginosa and E. densa was carried out to confirm the inhibitive ability of live E. densa plants on M. aeruginosa growth, before obtaining E. densa extracts. The combined culture of M. aeruginosa with E. densa showed suppression in cell density, protein concentration, and Chl-a concentration compared to the monoculture of M. aeruginosa after 7 days of exposure. The concentration of Chl-a in the culture serves as a direct indicator for determining the biomass of cyanobacteria [9]. The Chl-a concentration in the combined culture also showed a similar trend as the cell density and the protein concentration. However, after 7 days, the monoculture showed a lower Chl-a concentration per protein than at the beginning (Figure 4). This could have been a result of the shading effect of artificial plants or a result of M. aeruginosa cells being in different growth phases. Previous studies confirmed the inhibitory effects of E. densa on cyanobacteria [11], alga Scenedesmus acutus [31], and phytoplanktons [23] during co-culture. Therefore, the inhibition of M. aeruginosa growth in the combined culture could have been due to the presence of live E. densa, potentially resulting from nutrient competition or allelochemicals, as the shading effect was eliminated by using artificial plants in the M. aeruginosa monoculture. To investigate the inhibitory effect caused by allelochemicals produced by E. densa, plant extracts were obtained and utilized to treat M. aeruginosa instead of live plants.
Numerous studies have also reported the release of allelochemical induced by various species of live macrophytes when they coexisted with cyanobacteria [17,19,23,39]. However, only a few studies have investigated the effects of allelochemicals obtained from E. densa on cyanobacteria inhibition, despite its known success as a live plant in suppressing cyanobacteria growth. After confirming the ability of live E. densa plants to suppress M. aeruginosa growth, we investigated the inhibitive ability of the extracts obtained from E. densa. Therefore, we selected E. densa grown as monocultures and combined cultures with M. aeruginosa to obtain extracts to investigate the effect of coexistence on allelochemical production. The M. aeruginosa cultures exposed to 0.5 g/L concentrations of both extracts exhibited inhibition in growth compared to the control group during the 5-day exposure period (Figure 5). However, the extracts obtained from the combined culture showed a more successful inhibitory effect than the extract from E. densa monoculture, resulting in the lowest cell density and Chl-a concentration of the M. aeruginosa cultures treated with it on day 5. Cyanobacteria possess intracellular thylakoid membranes that contain chlorophyll, which is used for oxygenic photosynthesis [40]. Chlorophyll synthesis tends to decrease under certain stress conditions due to the downregulation of pigment genes in cyanobacteria [41]. Therefore, Chl-a concentration is considered a direct measure to evaluate the cyanobacteria growth. At the end of the exposure period (5 days), the 0.5 g/L concentration of combined extract suppressed M. aeruginosa growth by 22% compared to the monoculture (Figure 5). The mechanisms of the effect of allelochemicals on M. aeruginosa suppression can vary. Some allelochemicals, such as Tellimagrandin II, (+)-catechin, polyphenols pyrogallic acids, gallic, nonanoic acid, ellagic, cis-6-octadecenoic acid, and cis-9-octadecenoic acid, which were extracted from M. spicatum, have been shown to contribute to 53% of the inhibition of M. aeruginosa by decreasing the activity of photosystem II through interference with electron transfer [14]. In addition, reduction in algal photosynthesis may also be mediated by oxidative stress. This phenomenon occurs because of the excessive production of O2 (superoxide ions), which initiates free-radical reactions, leading to the peroxidation of lipids in the cell membranes. As a result, the permeability of these membranes is changed. Allelochemicals such as ethyl 2-methyl acetoacetate (EMA), produced by Phragmites communis, were found to impose significant oxidative stress, ultimately leading to the inactivation of the antioxidant defense system of M. aeruginosa [42].
In this study, a 3D EEM analysis was conducted to investigate the compounds present in the extracts. The EEM analysis revealed four similar peaks in both extract types. However, the EEM of the extract obtained from E. densa combined culture showed higher intensities. Increased intensity corresponds to higher compound concentrations. Peaks B and X (Figure 9a,b) belong to the aromatic protein region, containing amino acids such as tyrosine and tryptophan [37]. Peaks B, C, X, and Y (Figure 9a,b) observed in the emission wavelengths 300 to 345 nm are related to protein-like compounds. According to Hu and Yin [38] and Yin et al. [43], peaks labeled A, D, W, and Z (Figure 9a,b), found in the emission wavelengths of 435 to 480 nm, are associated with humic-acid-like compounds. According to Traversa et al. [44], peaks A and W (Figure 9a,b) represent phenolic compounds in the extracts. When E. densa coexists with cyanobacteria, it may induce the synthesis of phenolic compounds that exhibit allelopathic properties. These compounds can be responsible for M. aeruginosa inhibition [14]. Therefore, the high-intensity peaks observed in the combined culture could be attributed to the higher concentrations of the allelopathic compounds available in extracts obtained from the E. densa combined culture with M. aeruginosa. Moreover, the low nutrient availability in 0.5 g/L concentrations of the extract may have enhanced the effect of allelochemicals, thereby promoting the suppression of M. aeruginosa (Figure 8).
When considering the morphological variations of M. aeruginosa, cells generally exhibit a unicellular, spherical-shaped morphology. However, we observed that some of these cells produced a protective mucilaginous sheath, especially when exposed to 0.5 g/L E. densa extract concentrations. According to Rossi et al. [45], cyanobacteria were observed to produce gelatinous envelop or a sheath around the cell at unfavorable environmental conditions. In addition, no significant changes were observed in the number of cells per group at low E. densa extract concentrations, typically ranging from four to six cells per group. Cell density increased when cell suspensions were exposed to high extract concentrations, resulting in larger cell groups. Previous studies have also reported morphological changes, such as yellowing, depigmentation [46], and cell damage [43], in response to allelochemicals from macrophytes in cyanobacteria cells. The high concentrations of both E. densa extracts did not exhibit considerable growth suppression in M. aeruginosa over the exposure period. Instead, the high concentrations (1, 2, and 4 g/L) of the E. densa extracts promoted the M. aeruginosa growth towards the end of exposure time. Higher values of PO43− concentrations were observed in both cultures as the concentrations of extracts increased (Figure 8). Even though the combined extract contained effective allelochemicals, the high concentrations of nutrients may have suppressed their inhibitory effects, resulting in increased cell density in the cultures treated with high concentrations of E. densa extracts. However, the M. aeruginosa cultures treated with combined E. densa extract consistently exhibited lower cell density and Chl-a concentrations compared to the cultures exposed to monoculture extracts, confirming the presence of a high concentration of allelochemicals in the E. densa combined culture extract than in the monoculture extracts [14]. Accordingly, results suggest that the application of extracts of E. densa could be an eco-friendly potential approach for small-scale water bodies in controlling cyanobacteria at low cell densities.
Evaluations of the feasibility, environmental impacts, and cost-effectiveness are necessary steps to be considered by managers when implementing bio-derived materials for cyanobacteria control. In addition, effective communication and collaboration among managers, researchers, and policymakers can facilitate the successful implementation of bio-derived solutions into practical use. Moreover, it is important to conduct economic evaluations that compare the application of bio-derived materials for cyanobacteria control with conventional methods. For further research, monitoring the production of soluble toxins by harmful cyanobacteria is essential. It provides a more comprehensive understanding of the effectiveness of bio-derived materials in successfully inhibiting cyanobacterial growth while minimizing toxin production. Furthermore, the long-term effects of repeated use of bio-derived substances on aquatic ecosystems should be studied.

5. Conclusions

In conclusion, live E. densa plants have been found to successfully inhibit the growth of M. aeruginosa during coexistence. When applying aqueous extracts of E. densa, it was observed that a lower concentration of extracts (0.5 g/L) obtained from E. densa plants co-cultured with M. aeruginosa exhibited a stronger inhibitory capacity compared to extracts obtained from E. densa monocultures. This suggests that the production of allelochemicals in E. densa seems to be induced when coexisting with M. aeruginosa. However, higher extract concentrations with elevated nutrient levels promote the growth of M. aeruginosa rather than inhibition. For future research, we recommend considering different types of macrophytes to obtain natural allelochemicals to suppress cyanobacteria and investigation and identification of available cyanobacteria inhibitive allelochemicals.

Author Contributions

Conceptualization, A.W. and M.D.H.J.S.; data curation, A.W.; formal analysis, A.W.; funding acquisition, M.D.H.J.S.; investigation, A.W.; methodology, A.W. and M.D.H.J.S.; resources, T.F.; supervision, M.D.H.J.S. and T.F.; validation, M.D.H.J.S.; writing—original draft, A.W.; writing—review and editing, M.D.H.J.S. All authors have read and agreed to the published version of the manuscript.

Funding

This research was funded by the Japanese Society for the Promotion of Science (JSPS), JSPS KAKENHI, grant number 21K14248 and the APC was funded by the authors.

Institutional Review Board Statement

Not applicable.

Informed Consent Statement

Not applicable.

Data Availability Statement

All data and materials are available from the corresponding author upon reasonable request.

Conflicts of Interest

The authors declare no conflict of interest. The funders had no role in the design of the study; in the collection, analyses, or interpretation of data; in the writing of the manuscript; or in the decision to publish the results.

References

  1. Paerl, H.W.; Otten, T.G. Harmful Cyanobacterial Blooms: Causes, Consequences, and Controls. Microb. Ecol. 2013, 65, 995–1010. [Google Scholar] [CrossRef] [PubMed]
  2. Paerl, H.W. Mitigating Harmful Cyanobacterial Blooms in a Human- and Climatically-Impacted World. Life 2014, 4, 988–1012. [Google Scholar] [CrossRef]
  3. Harke, M.J.; Steffen, M.M.; Gobler, C.J.; Otten, T.G.; Wilhelm, S.W.; Wood, S.A.; Paerl, H.W. A Review of the Global Ecology, Genomics, and Biogeography of the Toxic Cyanobacterium, Microcystis Spp. Harmful Algae 2016, 54, 4–20. [Google Scholar] [CrossRef] [PubMed]
  4. House, W.A. Geochemical Cycling of Phosphorus in Rivers. Appl. Geochem. 2003, 18, 739–748. [Google Scholar] [CrossRef]
  5. United States Environmental Protection Agency Health Effects from Cyanotoxins. Available online: https://www.epa.gov/cyanohabs/health-effects-cyanotoxins (accessed on 21 November 2022).
  6. Dolman, A.M.; Rücker, J.; Pick, F.R.; Fastner, J.; Rohrlack, T.; Mischke, U.; Wiedner, C. Cyanobacteria and Cyanotoxins: The Influence of Nitrogen versus Phosphorus. PLoS ONE 2012, 7, e38757. [Google Scholar] [CrossRef]
  7. Pokrzywinski, K.L.; Bishop, W.M.; Grasso, C.R.; Fernando, B.M.; Sperry, B.P.; Berthold, D.E.; Laughinghouse, H.D.; Van Goethem, E.M.; Volk, K.; Heilman, M.; et al. Evaluation of a Peroxide-Based Algaecide for Cyanobacteria Control: A Mesocosm Trial in Lake Okeechobee, FL, USA. Water 2022, 14, 169. [Google Scholar] [CrossRef]
  8. Sample, D.J.; Fox, L.J. Innovative Best Management Fact Sheet No.1: Floating Treatment Wetlands. Va. Polytech. Inst. State Univ. 2013, 1–5. [Google Scholar]
  9. Chorus, I.; Welker, M. Toxic Cyanobacteria in Water: A Guide to Their Public Health Consequences, Monitoring and Management; Taylor & Francis: Abingdon, UK, 2021; ISBN 9780367533311. [Google Scholar]
  10. Chen, L.; Giesy, J.P.; Adamovsky, O.; Svirčev, Z.; Meriluoto, J.; Codd, G.A.; Mijovic, B.; Shi, T.; Tuo, X.; Li, S.C.; et al. Challenges of Using Blooms of Microcystis Spp. in Animal Feeds: A Comprehensive Review of Nutritional, Toxicological and Microbial Health Evaluation. Sci. Total Environ. 2021, 764, 142319. [Google Scholar] [CrossRef]
  11. Nakai, S.; Inoue, Y.; Hosomi, M.; Murakami, A. Growth Inhibition of Blue-Green Algae by Allelopathic Effects of Macrophytes. Water Sci. Technol. 1999, 39, 47–53. [Google Scholar] [CrossRef]
  12. Tazart, Z.; Manganelli, M.; Scardala, S.; Buratti, F.M.; Di Gregorio, F.N.; Douma, M.; Mouhri, K.; Testai, E.; Loudiki, M. Remediation Strategies to Control Toxic Cyanobacterial Blooms: Effects of Macrophyte Aqueous Extracts on Microcystis aeruginosa (Growth, Toxin Production and Oxidative Stress Response) and on Bacterial Ectoenzymatic Activities. Microorganisms 2021, 9, 1782. [Google Scholar] [CrossRef]
  13. Kurashov, E.; Krylova, J.; Protopopova, E. The Use of Allelochemicals of Aquatic Macrophytes to Suppress the Development of Cyanobacterial “Blooms”. In Plankton Communities; Pereira, L., Gonçalves, A.M., Eds.; Intech Open: London, UK, 2021. [Google Scholar] [CrossRef]
  14. Maredová, N.; Altman, J.; Kaštovský, J. The Effects of Macrophytes on the Growth of Bloom-Forming Cyanobacteria: Systematic Review and Experiment. Sci. Total Environ. 2021, 792, 148413. [Google Scholar] [CrossRef] [PubMed]
  15. Zhang, H.; Shang, Y.; Lyu, T.; Chen, J.; Pan, G. Switching Harmful Algal Blooms to Submerged Macrophytes in Shallow Waters Using Geo-Engineering Methods: Evidence from a 15N Tracing Study. Environ. Sci. Technol. 2018, 52, 11778–11785. [Google Scholar] [CrossRef] [PubMed]
  16. Zhang, S.H.; Guo, L.; Cao, J.Y.; Chang, J.J. Allelopathic Activities of Three Emergent Macrophytes on Several Monospecific Cyanobacterial Species and Natural Phytoplankton Assemblages. Polish J. Environ. Stud. 2015, 24, 397–402. [Google Scholar] [CrossRef] [PubMed]
  17. Amorim, C.A.; de Moura-Falcão, R.H.; Valença, C.R.; de Souza, V.R.; Moura, A.D.N. Allelopathic Effects of the Aquatic Macrophyte Ceratophyllum demersum L. on Phytoplankton Species: Contrasting Effects between Cyanobacteria and Chlorophytes. Acta Limnol. Bras. 2019, 31, e21. [Google Scholar] [CrossRef]
  18. Zhu, J.; Liu, B.; Wang, J.; Gao, Y.; Wu, Z. Study on the Mechanism of Allelopathic Influence on Cyanobacteria and Chlorophytes by Submerged Macrophyte (Myriophyllum spicatum) and Its Secretion. Aquat. Toxicol. 2010, 98, 196–203. [Google Scholar] [CrossRef]
  19. Wang, H.; Liu, F.; Luo, P.; Li, Z.; Zheng, L.; Wang, H.; Zou, D.; Wu, J. Allelopathic Effects of Myriophyllum aquaticum on Two Cyanobacteria of Anabaena flos-aquae and Microcystis aeruginosa. Bull. Environ. Contam. Toxicol. 2017, 98, 556–561. [Google Scholar] [CrossRef]
  20. Park, M.H.; Chung, I.M.; Ahmad, A.; Kim, B.H.; Hwang, S.J. Growth Inhibition of Unicellular and Colonial Microcystis Strains (Cyanophyceae) by Compounds Isolated from Rice (Oryza sativa) Hulls. Aquat. Bot. 2009, 90, 309–314. [Google Scholar] [CrossRef]
  21. Kim, J.S.; Kim, J.C.; Lee, S.; Lee, B.H.; Cho, K.Y. Biological Activity of L-2-Azetidinecarboxylic Acid, Isolated from Polygonatum odoratum Var. Pluriflorum, against Several Algae. Aquat. Bot. 2006, 85, 1–6. [Google Scholar] [CrossRef]
  22. Declerck, S.; Vanderstukken, M.; Pals, A.; Muylaert, K.; De Meester, L. Plankton Biodiversity along a Gradient of Productivity and Its Mediation by Macrophytes. Ecology 2007, 88, 2199–2210. [Google Scholar] [CrossRef]
  23. Vanderstukken, M.; Mazzeo, N.; van Colen, W.; Declerck, S.A.J.; Muylaert, K. Biological Control of Phytoplankton by the Subtropical Submerged Macrophytes Egeria densa and Potamogeton illinoensis: A Mesocosm Study. Freshw. Biol. 2011, 56, 1837–1849. [Google Scholar] [CrossRef]
  24. Senavirathna, M.D.H.J.; Muhetaer, G.; Atapaththu, K.S.S.; Fujino, T. Egeria densa Allelopathy on Microcystis aeruginosa Under Different Light Intensities and Preliminary Insight into Inter-Parameter Relationships. Water. Air. Soil Pollut. 2021, 232, 135. [Google Scholar] [CrossRef]
  25. Chen, J.; Zhang, H.; Han, Z.; Ye, J.; Liu, Z. The Influence of Aquatic Macrophytes on Microcystis aeruginosa Growth. Ecol. Eng. 2012, 42, 130–133. [Google Scholar] [CrossRef]
  26. Ghobrial, M.G.; Nassr, H.S.; Kamil, A.W. Bioactivity Effect of Two Macrophyte Extracts on Growth Performance of Two Bloom-Forming Cyanophytes. Egypt. J. Aquat. Res. 2015, 41, 69–81. [Google Scholar] [CrossRef]
  27. Gross, E.M.; Erhard, D.; Iványi, E. Allelopathic Activity of Ceratophyllum demersum L. and Najas marina Ssp. Intermedia (Wolfgang) Casper. Hydrobiologia 2003, 506–509, 583–589. [Google Scholar] [CrossRef]
  28. Mulderij, G.; Smolders, A.J.P.; Van Donk, E. Allelopathic Effect of the Aquatic Macrophyte, Stratiotes aloides, on Natural Phytoplankton. Freshw. Biol. 2006, 51, 554–561. [Google Scholar] [CrossRef]
  29. Senavirathna, M.D.H.J.; Wijesinghe, N.A.; Liu, Z.; Fujino, T. Effects of Short-Term Exposure to Different Salinity Levels on Myriophyllum spicatum and Ceratophyllum demersum and Suitability of Biomarkers to Evaluate Macrophyte Responses to Salinity Stress. Ann. Limnol. 2020, 56, 23. [Google Scholar] [CrossRef]
  30. Hu, H.; Hong, Y. Algal-Bloom Control by Allelopathy of Aquatic Macrophytes—A Review. Front. Environ. Sci. Eng. China 2008, 2, 421–438. [Google Scholar] [CrossRef]
  31. Espinosa-Rodríguez, C.A.; Rivera-De La Parra, L.; Martínez-Téllez, A.; Gómez-Cabral, G.C.; Sarma, S.S.S.; Nandini, S. Allelopathic Interactions between the Macrophyte Egeria densa and Plankton (Alga, Scenedesmus acutus and Cladocerans, Simocephalus Spp.): A Laboratory Study. J. Limnol. 2016, 75, 151–160. [Google Scholar] [CrossRef]
  32. Virginia, V.; Ranielle, B.; Silva, S.; Severiano, S. Can the Presence of Green Microalgae Reverse the Allelopathic Effects of the Submerged Macrophyte Egeria densa on the Toxin-Producing Cyanobacterium Raphidiopsis raciborskii? Hydrobiologia 2022, 849, 4391–4406. [Google Scholar] [CrossRef]
  33. Rippka, R.; Deruelles, J.; Waterbury, J.B. Generic Assignments, Strain Histories and Properties of Pure Cultures of Cyanobacteria. J. Gen. Microbiol. 1979, 111, 1–61. [Google Scholar] [CrossRef]
  34. Zhang, H.; Ye, Y.K.; Wang, S.H.; Luo, J.P.; Tang, J.; Ma, D.F. Hydrogen Sulfide Counteracts Chlorophyll Loss in Sweetpotato Seedling Leaves and Alleviates Oxidative Damage against Osmotic Stress. Plant Growth Regul. 2009, 58, 243–250. [Google Scholar] [CrossRef]
  35. Pilotto, L.S.; Douglas, R.M.; Burch, M.D.; Cameron, S.; Beers, M.; Rouch, G.J.; Robinson, P.; Kirk, M.; Cowie, C.T.; Hardiman, S.; et al. Health Effects of Exposure to Cyanobacteria (Blue-Green Algae) during Recreational Water-Related Activities. Aust. N. Z. J. Public Health 1997, 21, 562–566. [Google Scholar] [CrossRef] [PubMed]
  36. Hua, Q.; Liu, Y.G.; Yan, Z.L.; Zeng, G.M.; Liu, S.B.; Wang, W.J.; Tan, X.F.; Deng, J.Q.; Tang, X.; Wang, Q.P. Allelopathic Effect of the Rice Straw Aqueous Extract on the Growth of Microcystis aeruginosa. Ecotoxicol. Environ. Saf. 2018, 148, 953–959. [Google Scholar] [CrossRef]
  37. Zhang, H.; Zhao, Y.; Yin, H.; Wang, Y.; Li, H.; Wang, Z.; Geng, Y.; Liang, W.; Wang, H. Effect of Aquatic Macrophyte Growth on Landscape Water Quality Improvement. Environ. Sci. Pollut. Res. 2019, 26, 33791–33803. [Google Scholar] [CrossRef]
  38. Hu, L.; Yin, C. Development of a New Three-Dimensional Fluorescence Spectroscopy Method Coupling with Multilinear Pattern Recognition to Discriminate the Variety and Grade of Green Tea. Food Anal. Methods 2017, 10, 2281–2292. [Google Scholar] [CrossRef]
  39. Körner, S.; Nicklisch, A. Allelopathic Growth Inhibition of Selected Phytoplankton Species by Submerged Macrophytes. J. Phycol. 2002, 871, 862–871. [Google Scholar] [CrossRef]
  40. Norling, B.; Zak, E.; Andersson, B.; Pakrasi, H. 2D-Isolation of Pure Plasma and Thylakoid Membranes from the Cyanobacterium Synechocystis Sp. PCC 6803. Fed. Eur. Biochem. Soc. Lett. 1998, 436, 189–192. [Google Scholar] [CrossRef]
  41. Li, H.; Singh, A.K.; McIntyre, L.M.; Sherman, L.A. Differential Gene Expression in Response to Hydrogen Peroxide and the Putative PerR Regulon of Synechocystis Sp. Strain PCC 6803. J. Bacteriol. 2004, 186, 3331–3345. [Google Scholar] [CrossRef]
  42. Mohamed, Z.A. Macrophytes-Cyanobacteria Allelopathic Interactions and Their Implications for Water Resources Management—A Review. Limnologica 2017, 63, 122–132. [Google Scholar] [CrossRef]
  43. Wang, F.; Zhao, W.; Chen, J.; Zhou, Y. Allelopathic Inhibitory Effect on the Growth of Microcystis aeruginosa by Improved Ultrasonic-Cellulase Extract of Vallisneria. Chemosphere 2022, 298, 134245. [Google Scholar] [CrossRef]
  44. Traversa, A.; Loffredo, E.; Gattullo, C.E.; Senesi, N. Water-Extractable Organic Matter of Different Composts: A Comparative Study of Properties and Allelochemical Effects on Horticultural Plants. Geoderma 2010, 156, 287–292. [Google Scholar] [CrossRef]
  45. Rossi, F.; De Philippis, R. Role of Cyanobacterial Exopolysaccharides in Phototrophic Biofilms and in Complex Microbial Mats. Life 2015, 5, 1218–1238. [Google Scholar] [CrossRef] [PubMed]
  46. Tazart, Z.; Douma, M.; Tebaa, L.; Loudiki, M. Use of Macrophytes Allelopathy in the Biocontrol of Harmful Microcystis aeruginosa Blooms. Water Sci. Technol. Water Supply 2019, 19, 245–253. [Google Scholar] [CrossRef]
Figure 1. Experimental procedure of E. densa aqueous extracts on M. aeruginosa inhibition. ME and CE refer to monoculture extract and combined culture extract, respectively. IR and Chl-a refer to the inhibition rate and chlorophyll-a of the treated M. aeruginosa cultures, respectively (created with BioRender.com).
Hydrobiology 02 00033 g001
Figure 2. Cell density of the M. aeruginosa monoculture and combined culture with E. densa fresh plant before and after the experiment. Error bars represent the standard deviation (n = 3). Different superscripts (* and **) in the bars indicate significant differences at p ≤ 0.05 for the cell density of M. aeruginosa monoculture and combined culture with E. densa after treatment.
Hydrobiology 02 00033 g002
Figure 3. Changes in protein concentration of the M. aeruginosa monoculture and combined culture with E. densa fresh plant before and after the experiment. Error bars represent the standard deviation (n = 3). Different superscripts (* and **) in the bars indicate significant differences in protein concentrations at p ≤ 0.05 for M. aeruginosa monoculture and combined culture with E. densa after treatment.
Hydrobiology 02 00033 g003
Figure 4. Chlorophyll-a concentration per µg protein in M. aeruginosa monoculture and combined culture with E. densa fresh plant before and after the experiment. Error bars represent the standard deviation (n = 3). Different superscripts (* and **) in the bars indicate significant differences in Chl-a per protein concentration at p ≤ 0.05 for M. aeruginosa monoculture and combined culture with E. densa after treatment.
Hydrobiology 02 00033 g004
Figure 5. M. aeruginosa cell density in the cultures under the presence of both E. densa extract gradient 0.5 (a), 1 (b), 2 (c), and 4 g/L (d) compared to the control sample. Error bars represent the standard deviation (n = 3). Different lowercase letters in the bars indicate significant differences at p ≤ 0.05 for different treatments.
Hydrobiology 02 00033 g005
Figure 6. Inhibition rate (IR) of M. aeruginosa cultures exposed to (a) E. densa monoculture extract and (b) combined culture extract gradient throughout the experiment period. Error bars represent the standard deviation (n = 3).
Hydrobiology 02 00033 g006
Figure 7. Chlorophyll-a concentration per protein in E. densa monoculture and combined culture extract gradient (a) 0.5, (b) 1, (c) 2, and (d) 4 g/L compared to the control sample. Error bars represent the standard deviation (n = 3). Different lowercase letters in the bars indicate significant differences at p ≤ 0.05 for different treatments.
Hydrobiology 02 00033 g007
Figure 8. Variation of phosphate concentrations in E. densa mono and combined culture with M. aeruginosa extracts. Error bars represent the standard deviation (n = 3). “ND” refers to “not detected”, and the limit of detection (LOD) for phosphate was set at 1 mg/L.
Hydrobiology 02 00033 g008
Figure 9. The 3D EEM of (a) E. densa combined culture extract and (b) monoculture extract. A–D and W–Z indicate the different peaks produced by the combined culture and monoculture extracts, respectively.
Hydrobiology 02 00033 g009
Disclaimer/Publisher’s Note: The statements, opinions and data contained in all publications are solely those of the individual author(s) and contributor(s) and not of MDPI and/or the editor(s). MDPI and/or the editor(s) disclaim responsibility for any injury to people or property resulting from any ideas, methods, instructions or products referred to in the content.

