
Functional Diversity and Primary Production Predict Future Patterns of Periphyton Productivity after Species Extinction
 , ,
, ,
Abstract
:1. Introduction
2. Material and Methods
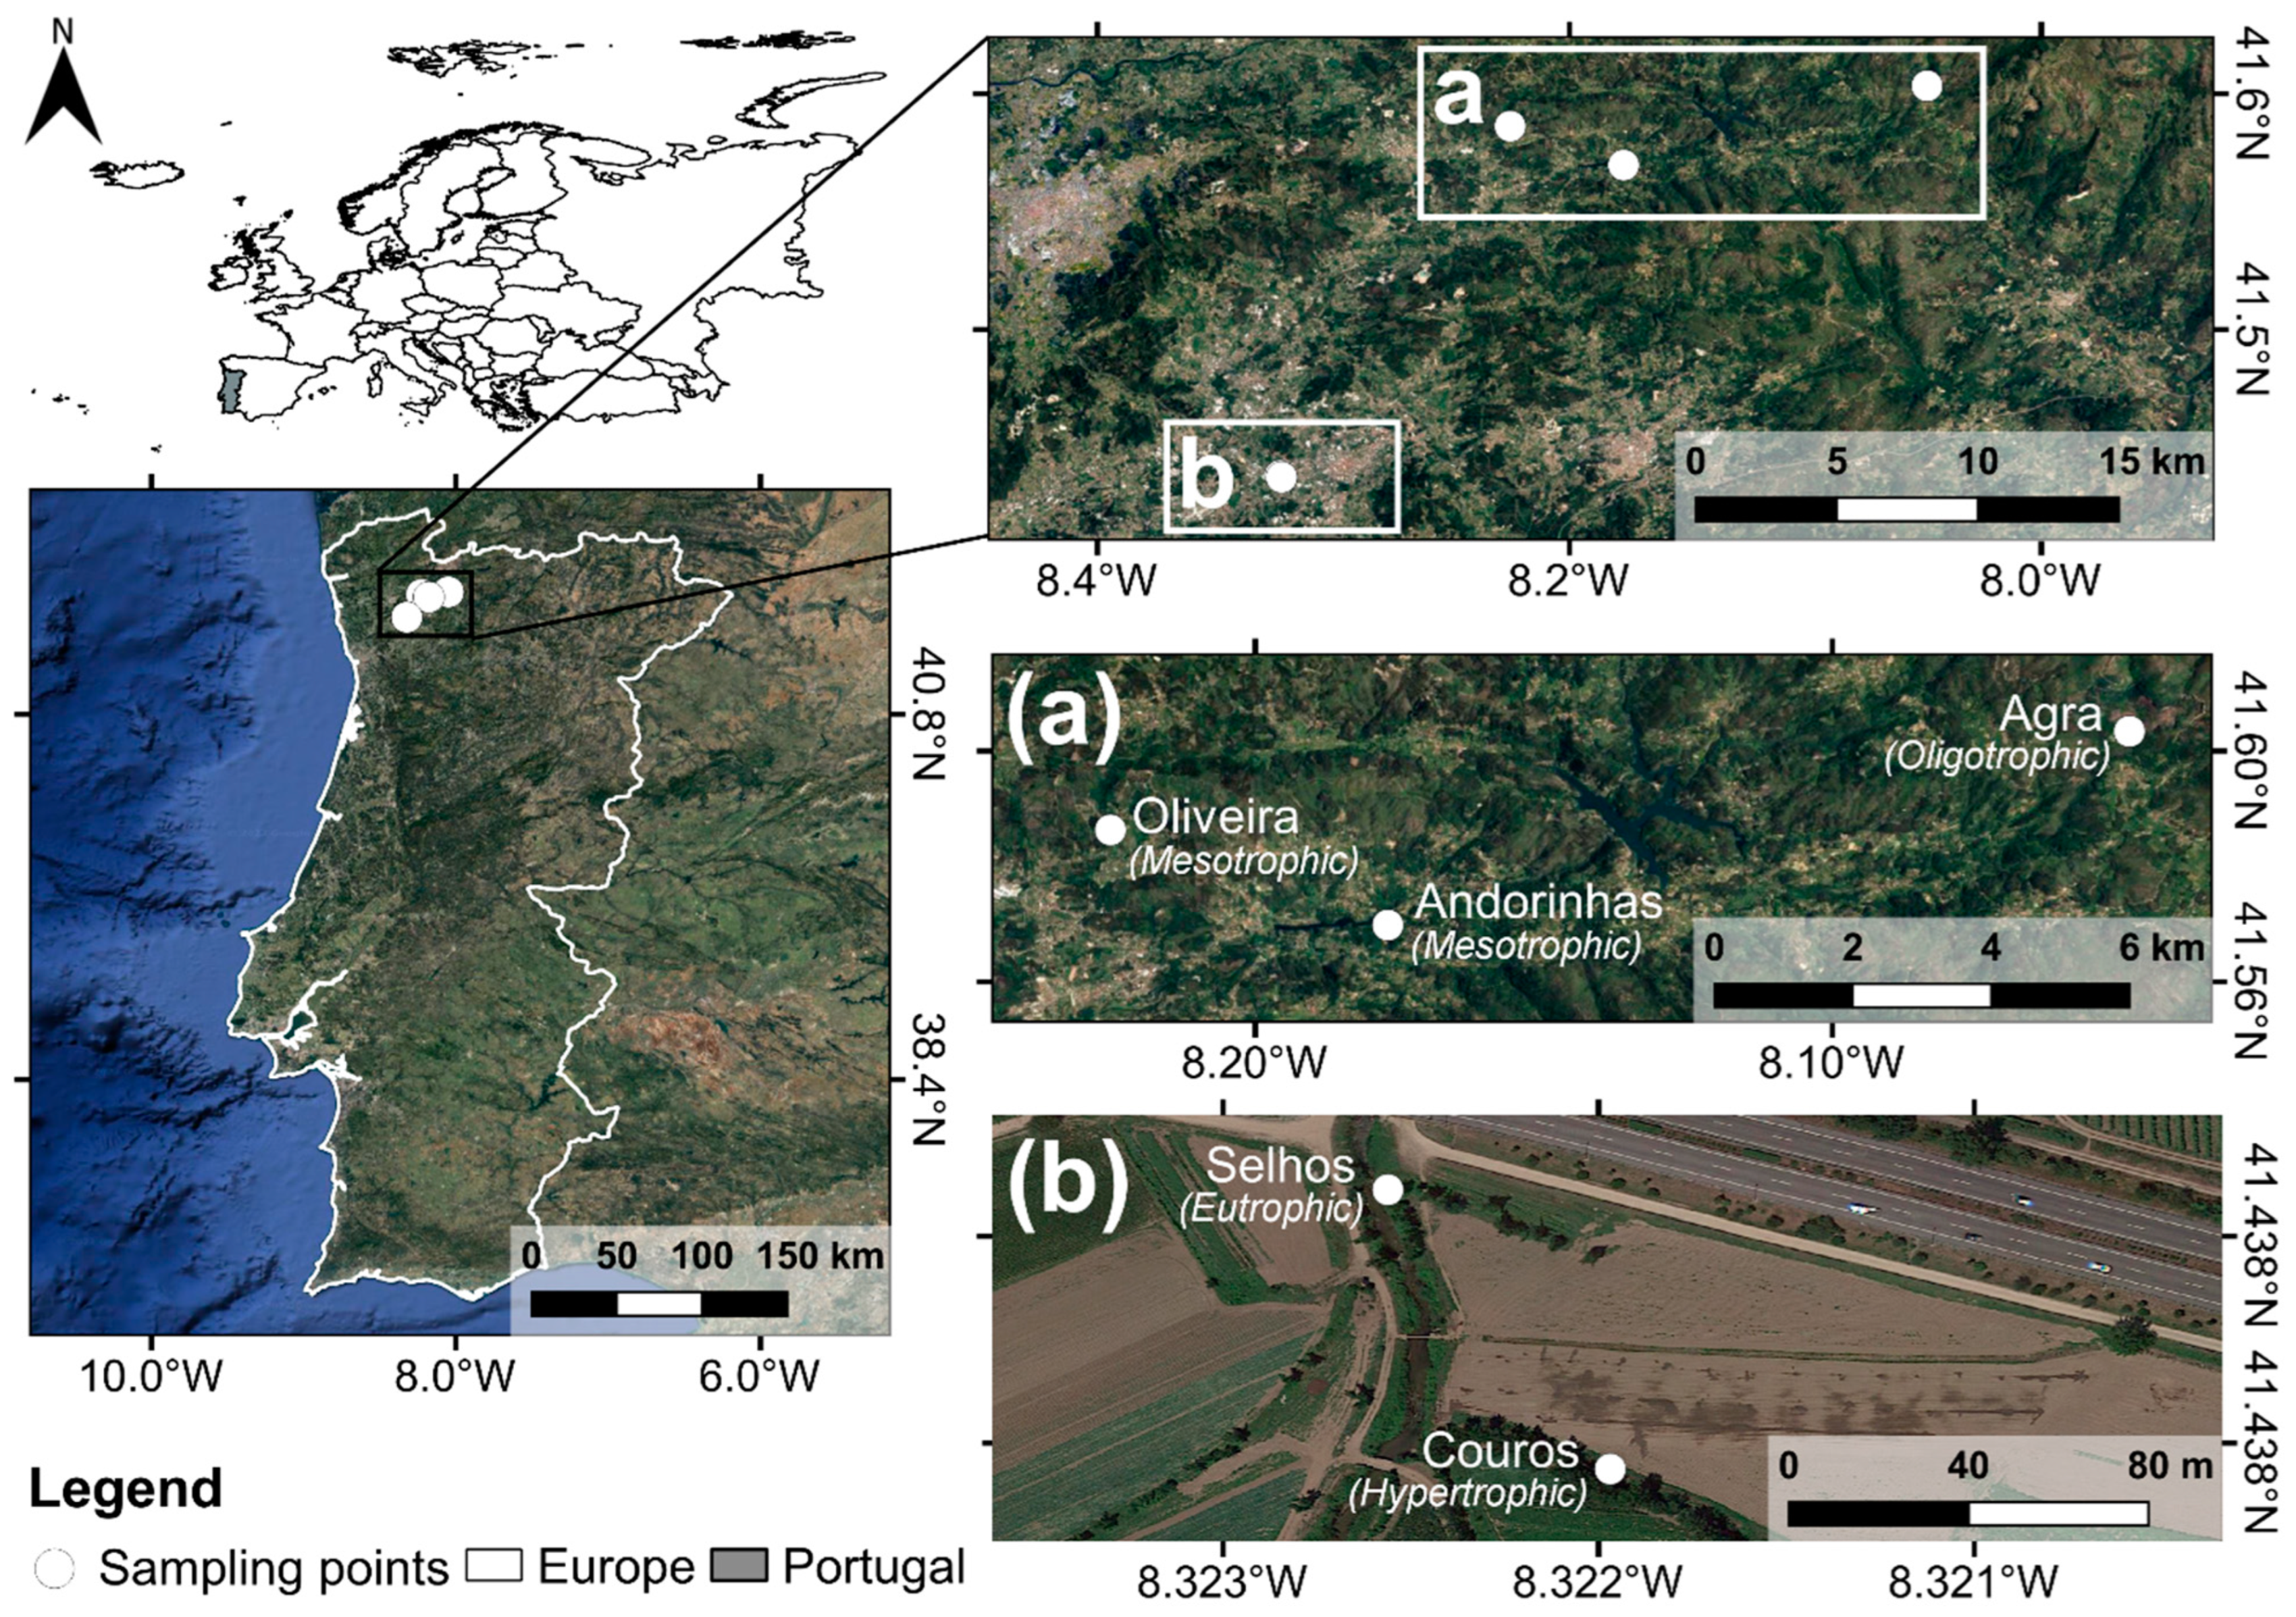
2.1. Study Area
2.2. Sampling Design
2.3. Physical and Chemical Water Parameters
2.4. Laboratory Procedures
2.5. Algal Functional Traits
2.6. Data Analysis
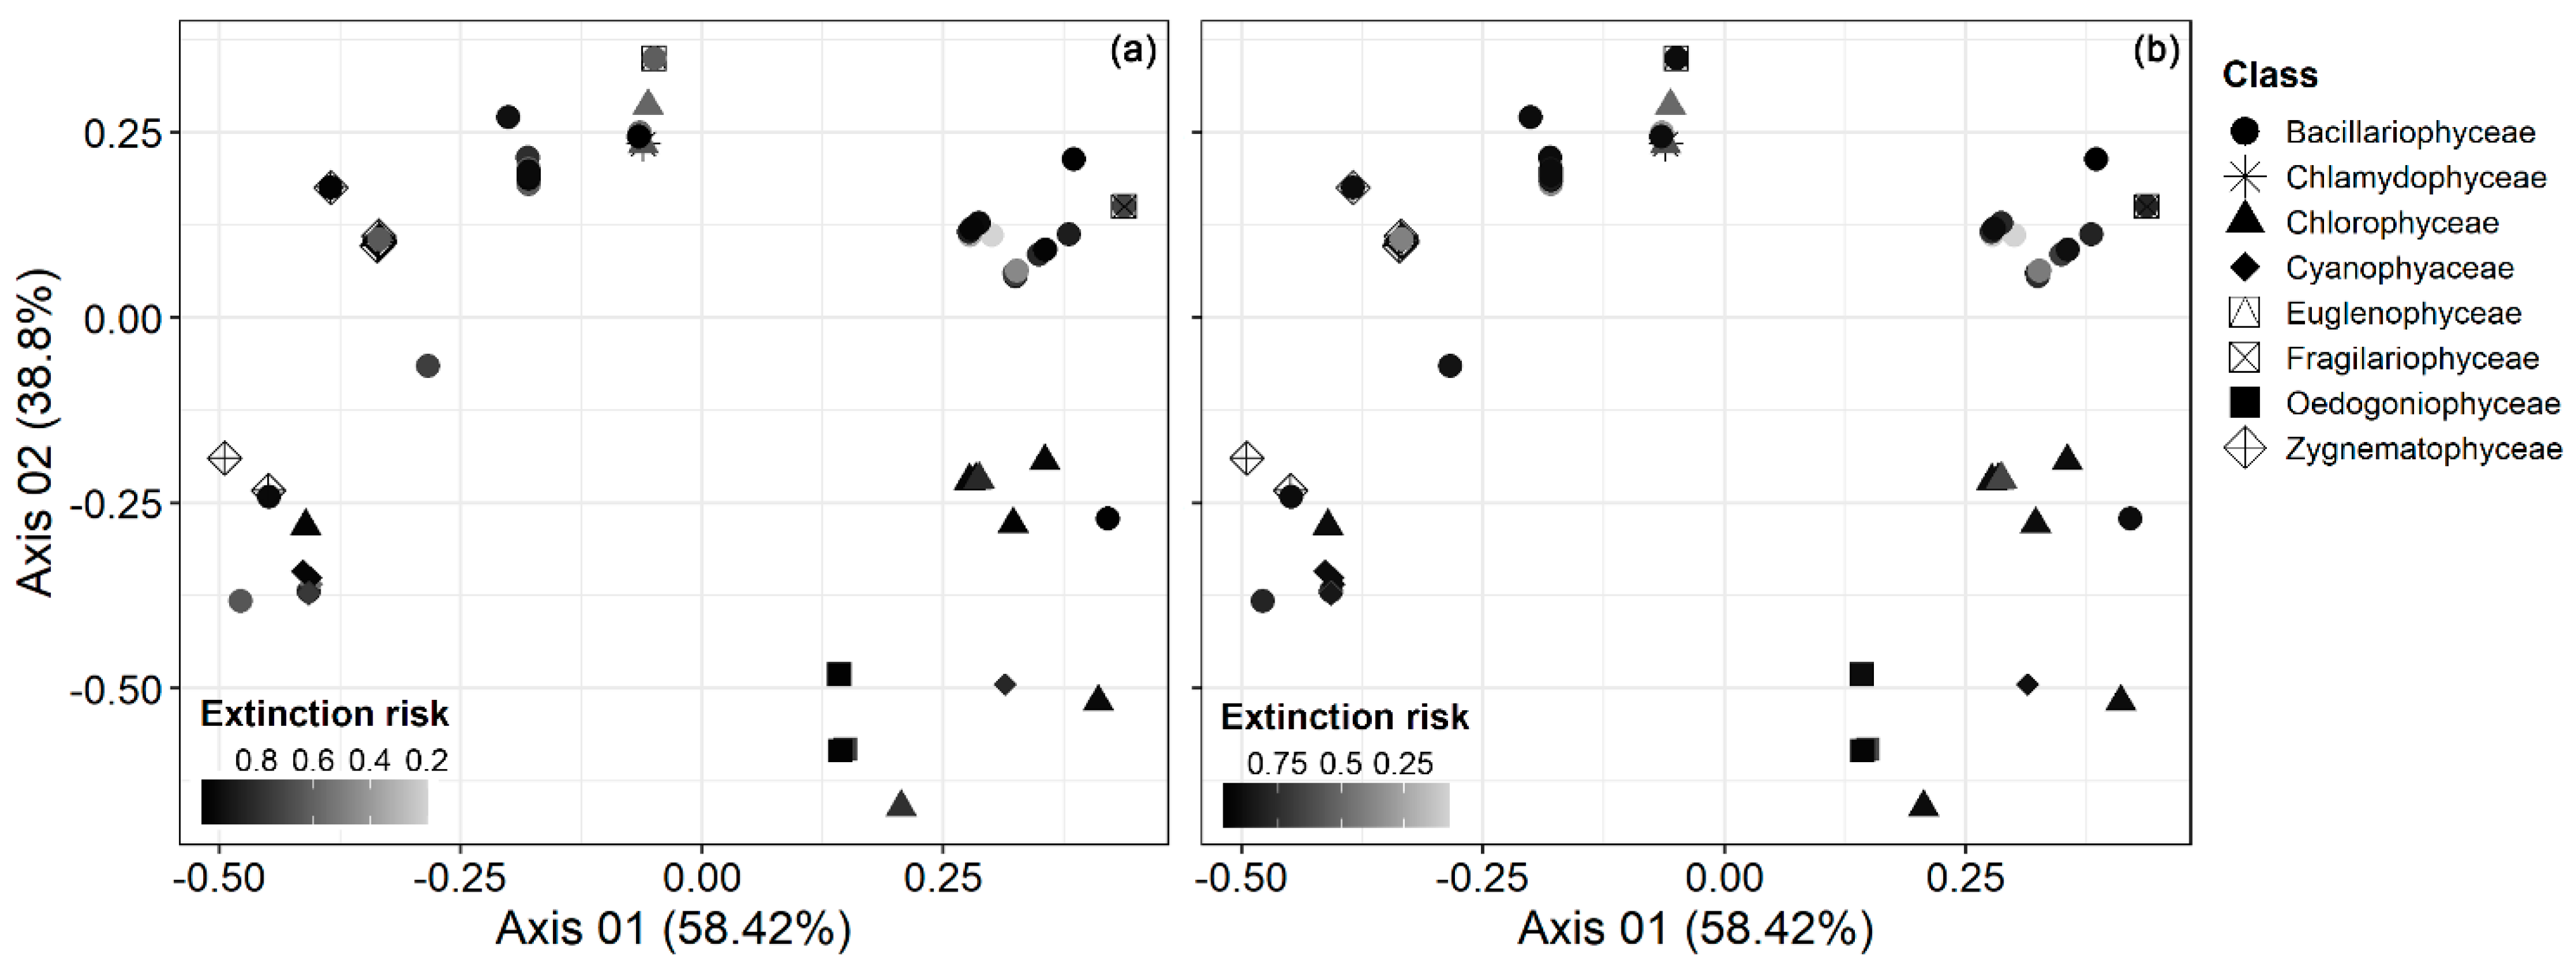
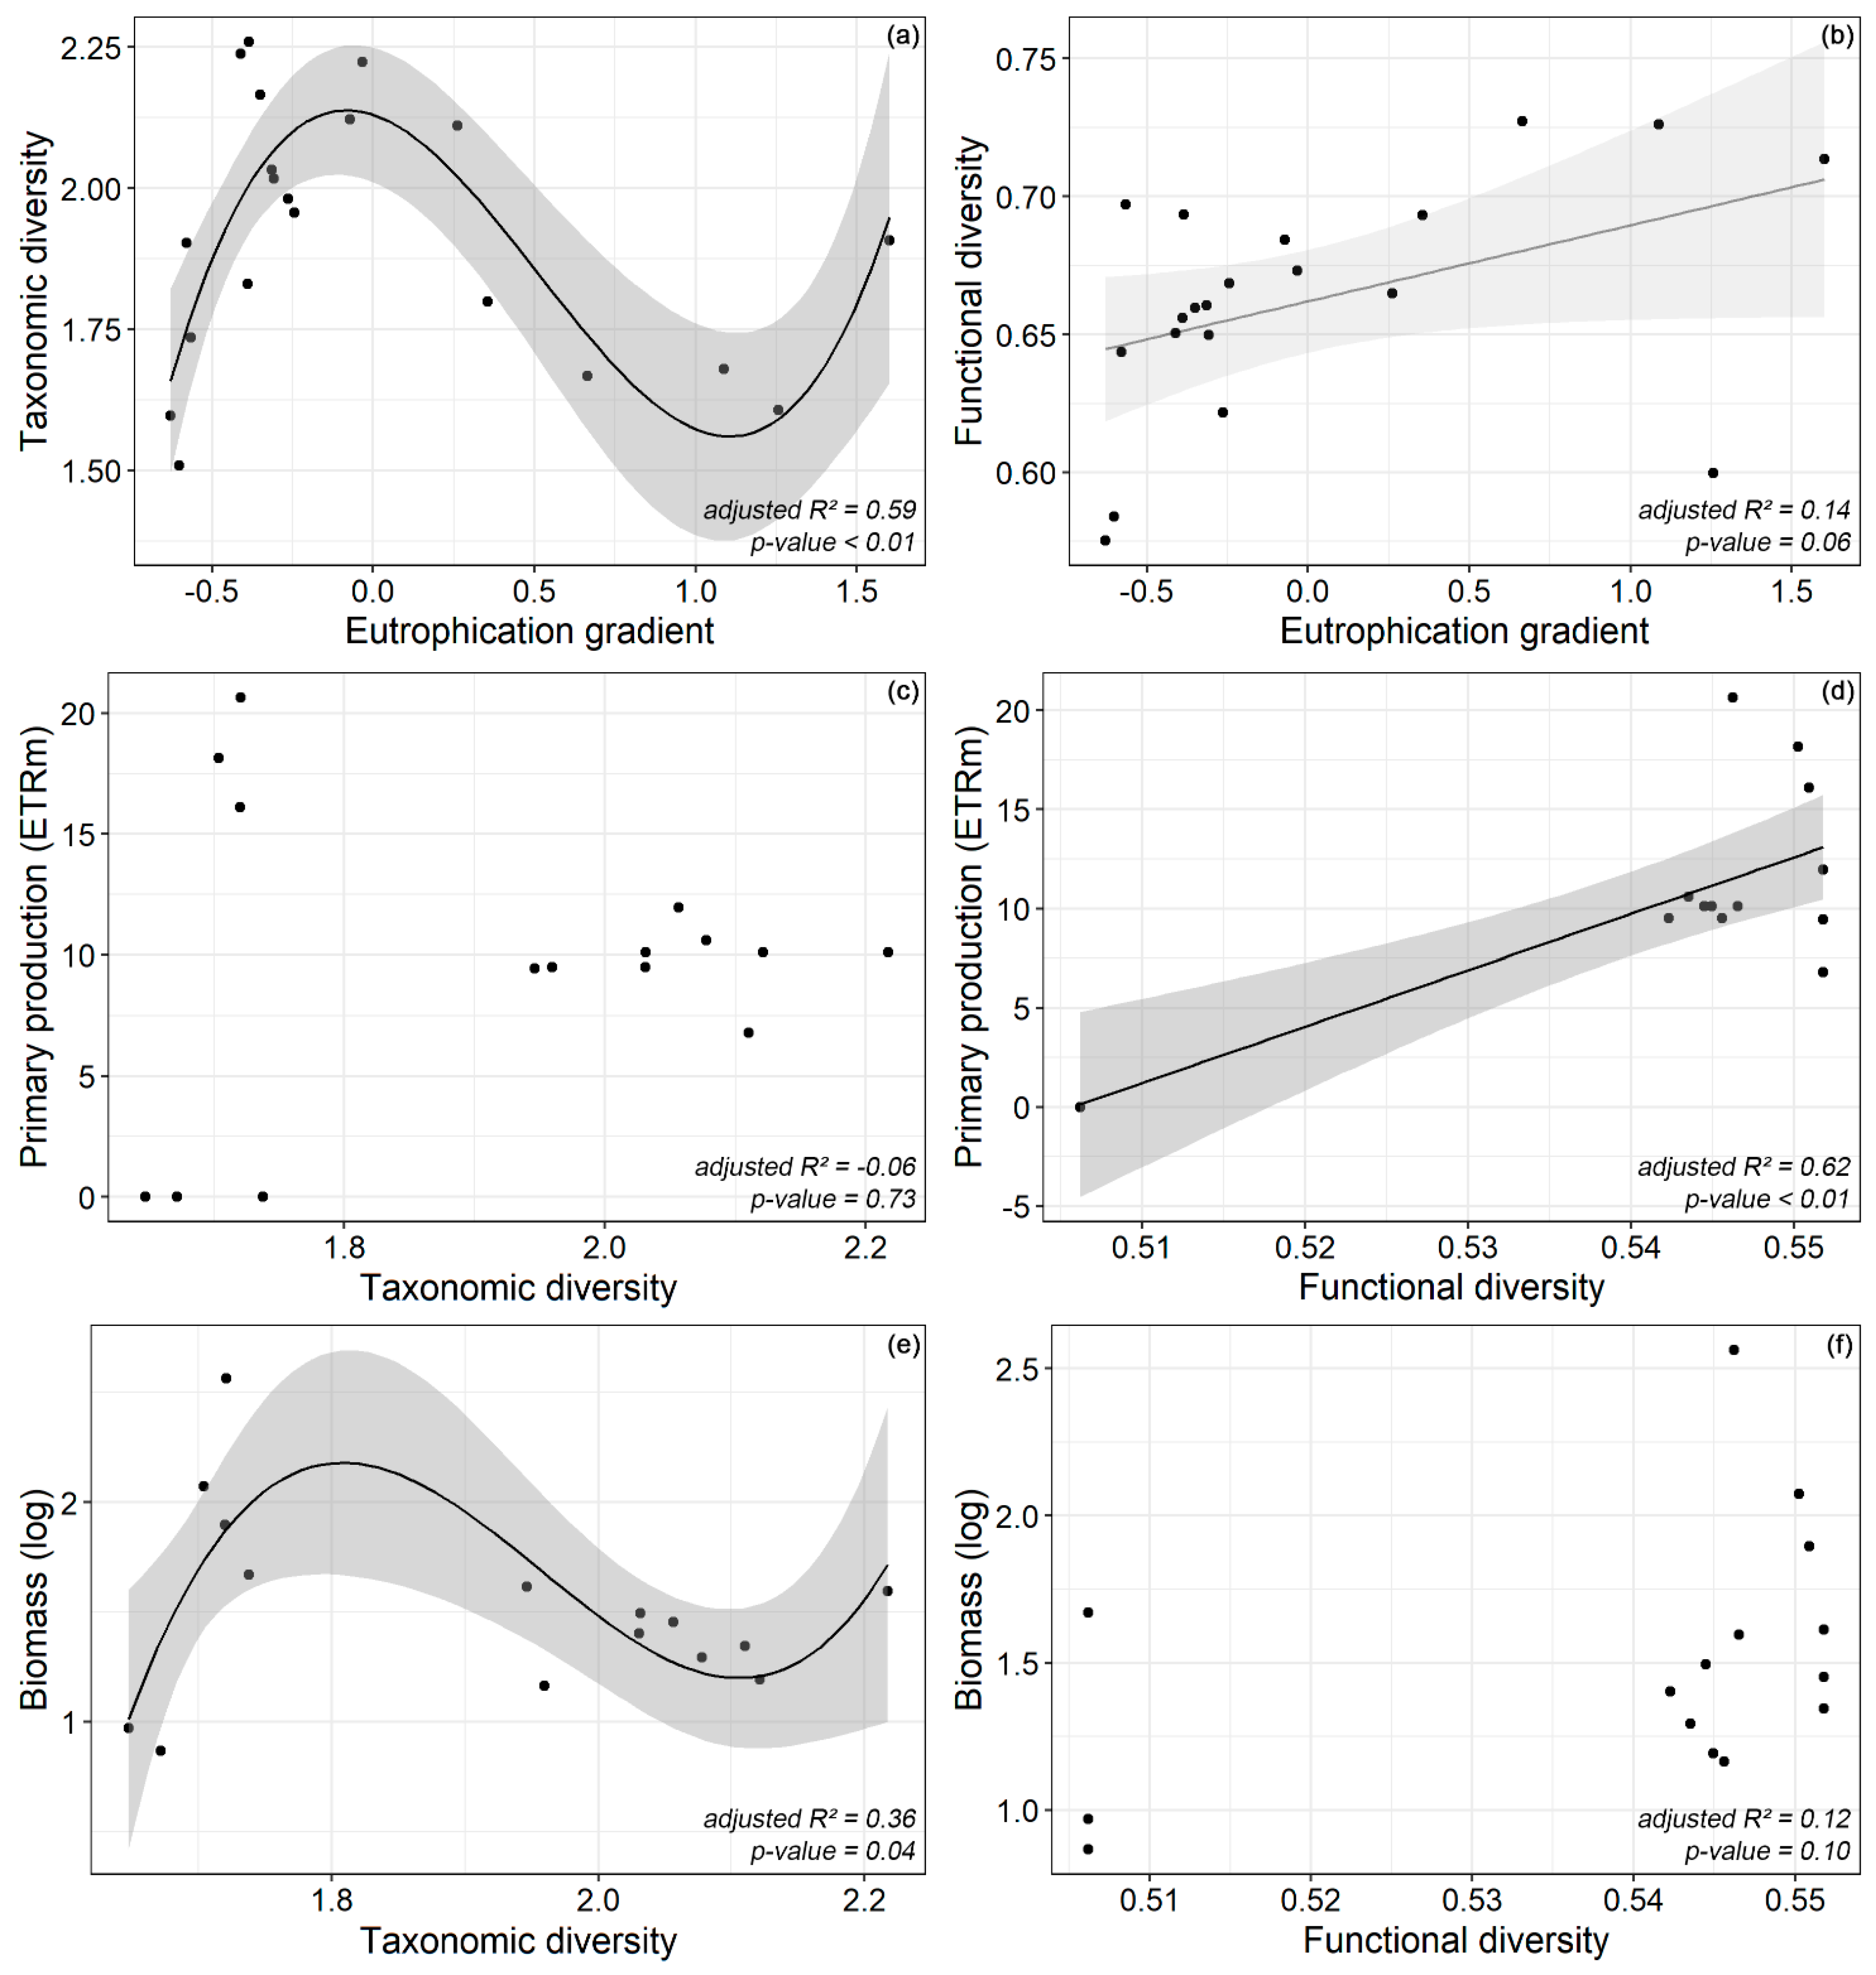
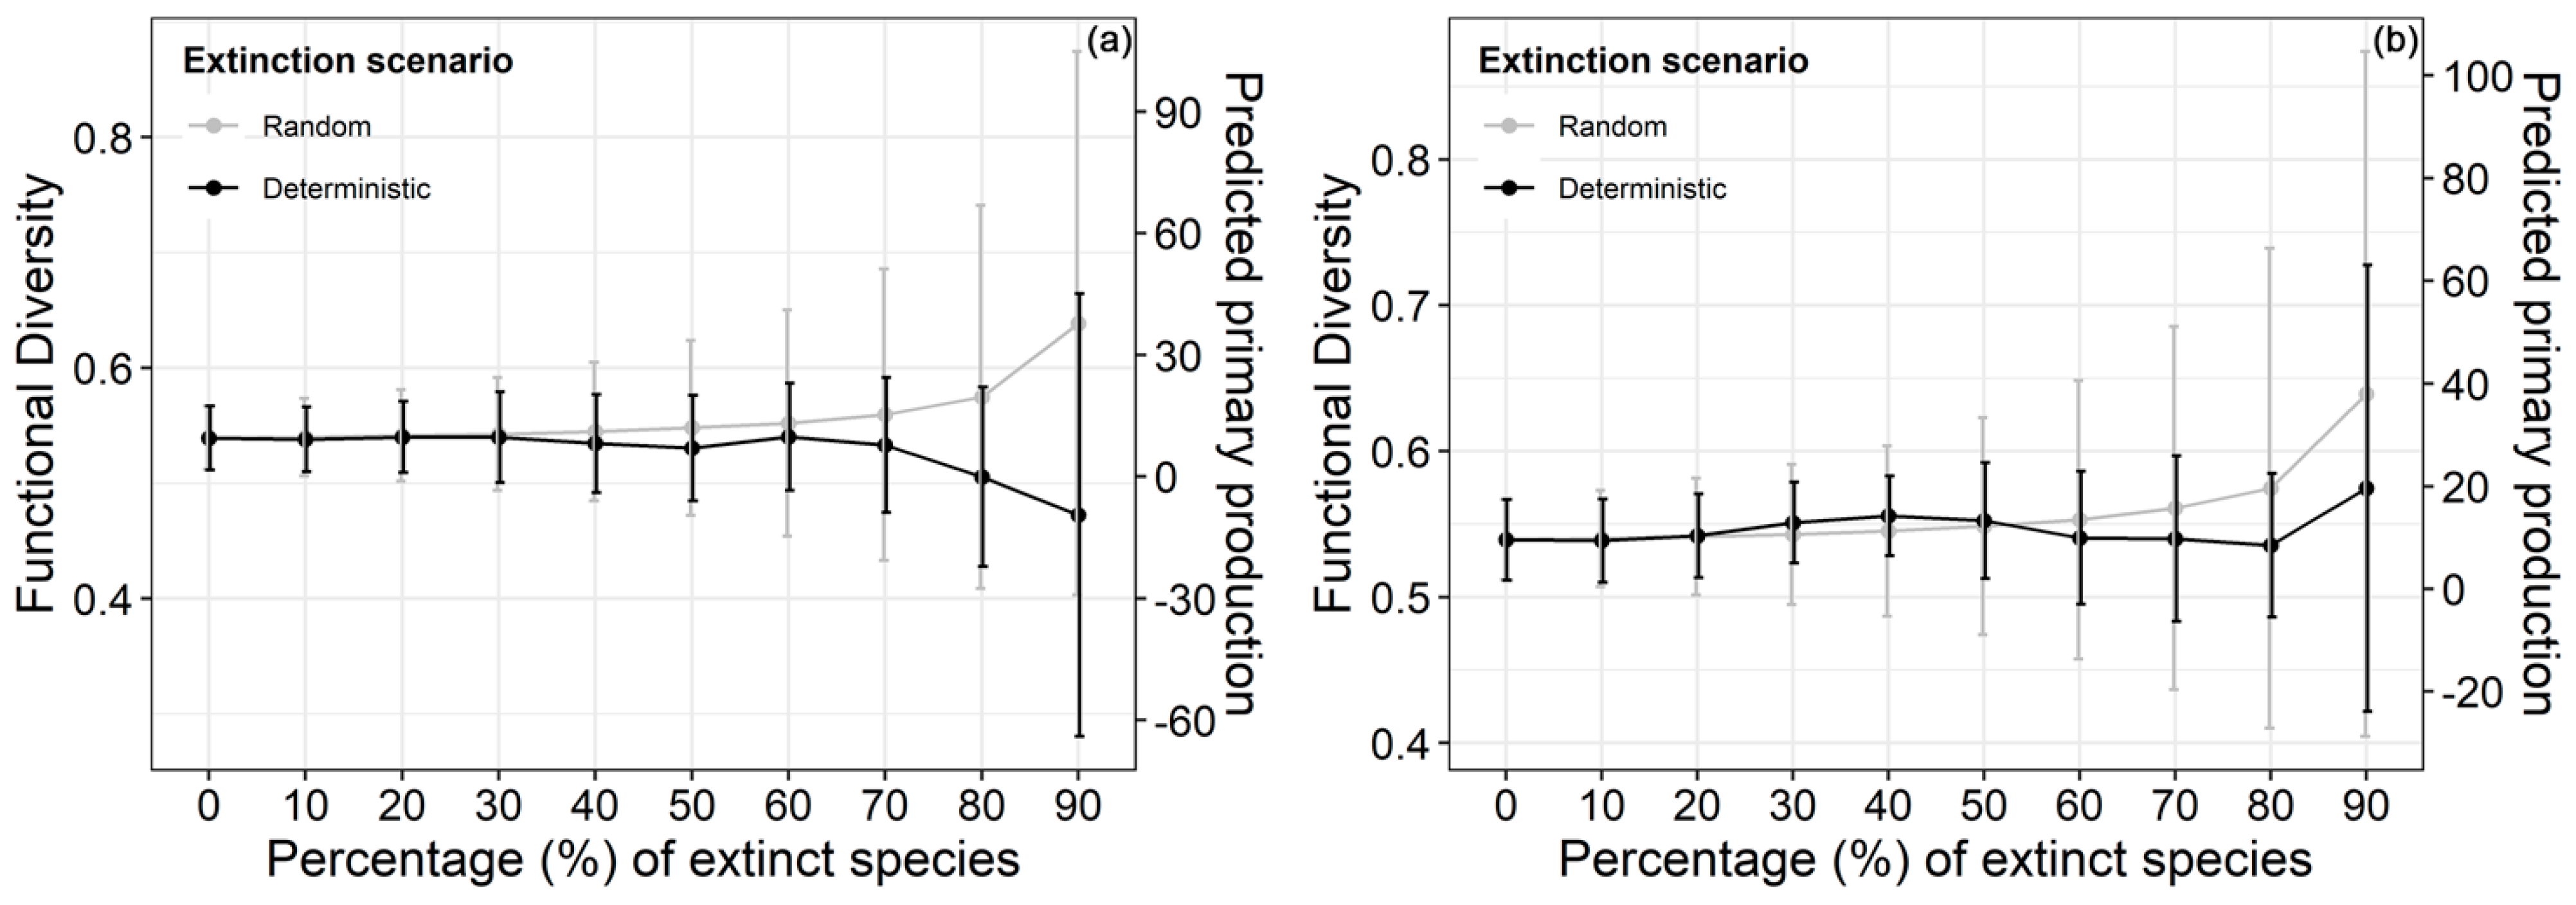
3. Results
4. Discussion
5. Conclusions
Author Contributions
Funding
Institutional Review Board Statement
Informed Consent Statement
Data Availability Statement
Acknowledgments
Conflicts of Interest
Appendix A

| Taxon | Class | Streams | Extinction Risk | |||||
|---|---|---|---|---|---|---|---|---|
| Agra | Andorinhas | Couros | Oliveira | Selho | Local | Regional | ||
| Achnanthidium minutissimum | Bacillariophyceae | 2441.140 | 2295.273 | 1936.904 | 1306.662 | 1442.227 | 0.195 | 0.067 |
| Actinotaenium cruciferum | Zygnematophyceae | 0.000 | 36.009 | 0.000 | 100.243 | 0.000 | 0.935 | 0.900 |
| Anabaena sp.1 | Cyanophyaceae | 0.000 | 66.641 | 0.000 | 0.000 | 0.000 | 0.962 | 0.900 |
| Ankistrodesmus sp.1 | Chlorophyceae | 0.000 | 54.897 | 0.000 | 0.000 | 0.000 | 0.968 | 0.900 |
| Aulacoseira alpigena | Bacillariophyceae | 0.000 | 70.508 | 0.000 | 62.167 | 0.000 | 0.874 | 0.778 |
| Aulacoseira granulata | Bacillariophyceae | 0.000 | 0.000 | 0.000 | 85.667 | 0.000 | 0.941 | 0.900 |
| Bulbochaete sp.1 | Oedogoniophyceae | 0.000 | 0.000 | 115.715 | 0.000 | 0.000 | 0.982 | 0.900 |
| Chamaesiphon sp.1 | Cyanophyaceae | 62.188 | 85.858 | 0.000 | 1399.298 | 0.000 | 0.827 | 0.888 |
| Characium sp.1 | Chlorophyceae | 0.000 | 0.000 | 978.561 | 0.000 | 0.000 | 0.794 | 0.900 |
| Chlamydophyceae sp.1 | Chlamydophyceae | 0.000 | 0.000 | 248.278 | 0.000 | 0.000 | 0.934 | 0.900 |
| Chlorococcales sp.1 | Chlorophyceae | 0.000 | 0.000 | 1510.967 | 0.000 | 502.838 | 0.650 | 0.604 |
| Oscillatoriales sp.1 | Cyanophyaceae | 0.000 | 0.000 | 6596.910 | 0.000 | 0.000 | 0.570 | 0.900 |
| Cocconeis placentula | Bacillariophyceae | 0.000 | 51.586 | 0.000 | 56.886 | 54.219 | 0.941 | 0.780 |
| Cosmarium bioculatum | Zygnematophyceae | 0.000 | 0.000 | 0.000 | 78.553 | 0.000 | 0.958 | 0.900 |
| Cosmarium reniforme | Zygnematophyceae | 0.000 | 15.538 | 0.000 | 103.720 | 0.000 | 0.890 | 0.816 |
| Cosmarium sp.1 | Zygnematophyceae | 0.000 | 57.231 | 0.000 | 0.000 | 84.640 | 0.952 | 0.900 |
| Cosmarium sp.2 | Zygnematophyceae | 0.000 | 59.793 | 0.000 | 0.000 | 0.000 | 0.956 | 0.933 |
| Cosmarium sp.3 | Zygnematophyceae | 0.000 | 50.764 | 0.000 | 0.000 | 0.000 | 0.971 | 0.917 |
| Cosmarium undulatum | Zygnematophyceae | 0.000 | 14.983 | 0.000 | 35.611 | 0.000 | 0.987 | 0.900 |
| Cymbella sp.1 | Bacillariophyceae | 0.000 | 59.886 | 0.000 | 0.000 | 0.000 | 0.962 | 0.900 |
| Desmidiaceae sp.1 | Zygnematophyceae | 0.000 | 77.631 | 0.000 | 13.333 | 59.219 | 0.935 | 0.867 |
| Desmodesmus sp.1 | Chlorophyceae | 0.000 | 0.000 | 0.000 | 0.000 | 67.778 | 0.982 | 0.900 |
| Bacillariophyceae sp.1 | Bacillariophyceae | 10.528 | 0.000 | 0.000 | 761.147 | 0.000 | 0.737 | 0.867 |
| Encyonema minutum | Bacillariophyceae | 168.251 | 28.445 | 35.417 | 25.667 | 145.883 | 0.673 | 0.372 |
| Epibolium sp.1 | Chlorophyceae | 0.000 | 0.000 | 0.000 | 113.439 | 0.000 | 0.946 | 0.900 |
| Euastrum sp.1 | Zygnematophyceae | 0.000 | 0.000 | 0.000 | 18.524 | 0.000 | 0.986 | 0.900 |
| Euglena sp.1 | Euglenophyceae | 0.000 | 0.000 | 62.688 | 0.000 | 0.000 | 0.979 | 0.900 |
| Eunotia bidens | Bacillariophyceae | 0.000 | 25.542 | 0.000 | 0.000 | 0.000 | 0.987 | 0.900 |
| Eunotia bilunaris | Bacillariophyceae | 4.615 | 215.655 | 0.000 | 185.384 | 35.038 | 0.834 | 0.694 |
| Eunotia minor | Bacillariophyceae | 1215.610 | 0.000 | 0.000 | 0.000 | 0.000 | 0.656 | 0.900 |
| Eunotia sp.3 | Bacillariophyceae | 0.000 | 146.669 | 0.000 | 691.584 | 512.852 | 0.741 | 0.755 |
| Eunotia sp.1 | Bacillariophyceae | 0.000 | 4058.203 | 1475.347 | 0.000 | 0.000 | 0.573 | 0.767 |
| Eunotia sp.2 | Bacillariophyceae | 0.000 | 1233.523 | 0.000 | 0.000 | 0.000 | 0.602 | 0.933 |
| Eunotia cf. sudetica | Bacillariophyceae | 0.000 | 1395.014 | 0.000 | 25.382 | 0.000 | 0.717 | 0.788 |
| Eunotia sudetica | Bacillariophyceae | 1688.213 | 3579.021 | 0.000 | 888.084 | 1141.484 | 0.462 | 0.424 |
| Fragilaria capucina | Bacillariophyceae | 0.000 | 48.357 | 22.229 | 0.000 | 0.000 | 0.968 | 0.889 |
| Frustulia saxonica | Bacillariophyceae | 0.000 | 113.544 | 0.000 | 0.000 | 669.451 | 0.795 | 0.900 |
| Gomphonema augur | Bacillariophyceae | 0.000 | 71.737 | 0.000 | 0.000 | 0.000 | 0.965 | 0.900 |
| Gomphonema gracile | Bacillariophyceae | 0.000 | 54.321 | 55.237 | 14.111 | 58.108 | 0.940 | 0.780 |
| Gomphonema parvulum | Bacillariophyceae | 374.761 | 884.445 | 2057.510 | 394.970 | 1089.236 | 0.344 | 0.092 |
| Gomphonema sp.1 | Bacillariophyceae | 671.534 | 0.000 | 23.899 | 30.417 | 56.719 | 0.856 | 0.761 |
| Gomphonema turris | Bacillariophyceae | 0.000 | 13.667 | 0.000 | 0.000 | 0.000 | 0.981 | 0.967 |
| Hanszchia sp.1 | Bacillariophyceae | 0.000 | 13.056 | 0.000 | 3399.648 | 55.053 | 0.622 | 0.859 |
| Hipodonta sp.1 | Bacillariophyceae | 0.000 | 0.000 | 0.000 | 20.834 | 0.000 | 0.986 | 0.900 |
| Leiblenia sp.1 | Bacillariophyceae | 0.000 | 0.000 | 0.000 | 1482.785 | 955.783 | 0.642 | 0.790 |
| Luticola sp.1 | Bacillariophyceae | 0.000 | 0.000 | 0.000 | 0.000 | 108.439 | 0.948 | 0.900 |
| Mesotaenium sp.1 | Zygnematophyceae | 0.000 | 45.334 | 0.000 | 167.146 | 0.000 | 0.824 | 0.690 |
| Monoraphidium arcuatum | Chlorophyceae | 0.000 | 77.423 | 0.000 | 0.000 | 74.334 | 0.948 | 0.865 |
| Monoraphidium contortum | Chlorophyceae | 0.000 | 46.742 | 0.000 | 0.000 | 0.000 | 0.982 | 0.900 |
| Monoraphidium sp.1 | Chlorophyceae | 0.000 | 0.000 | 0.000 | 68.443 | 0.000 | 0.959 | 0.900 |
| Monoraphidium griffithi | Chlorophyceae | 0.000 | 210.047 | 0.000 | 66.810 | 18.629 | 0.825 | 0.650 |
| Monoraphidium longisculum | Chlorophyceae | 51.084 | 0.000 | 0.000 | 0.000 | 0.000 | 0.952 | 0.900 |
| Mougeotia sp.1 | Zygnematophyceae | 0.000 | 0.000 | 0.000 | 81.667 | 0.000 | 0.944 | 0.900 |
| Navicula cryptocephala | Bacillariophyceae | 199.714 | 1186.379 | 743.822 | 623.319 | 3032.617 | 0.571 | 0.312 |
| Navicula sp.1 | Bacillariophyceae | 0.000 | 0.000 | 0.000 | 0.000 | 1626.798 | 0.618 | 0.900 |
| Niszchia palea | Bacillariophyceae | 56.188 | 745.046 | 788.123 | 295.459 | 1441.840 | 0.624 | 0.354 |
| Oedogonium sp.1 | Oedogoniophyceae | 5.264 | 0.000 | 229.596 | 0.000 | 67.890 | 0.749 | 0.626 |
| Oedogonium sp.2 | Oedogoniophyceae | 0.000 | 0.000 | 175.406 | 0.000 | 0.000 | 0.973 | 0.933 |
| Pennales sp.1 | Bacillariophyceae | 0.000 | 0.000 | 0.000 | 96.491 | 0.000 | 0.954 | 0.900 |
| Phormidium sp.1 | Cyanophyaceae | 0.000 | 0.000 | 0.000 | 51.429 | 0.000 | 0.964 | 0.900 |
| Pinnularia acrosphera | Bacillariophyceae | 0.000 | 0.000 | 0.000 | 0.000 | 6037.365 | 0.629 | 0.900 |
| Pinnularia rostrada | Bacillariophyceae | 0.000 | 0.000 | 0.000 | 0.000 | 18.133 | 0.983 | 0.900 |
| Pinnularia sp.1 | Bacillariophyceae | 0.000 | 51.586 | 0.000 | 29.276 | 0.000 | 0.948 | 0.828 |
| Pinnularia sp.2 | Bacillariophyceae | 0.000 | 104.779 | 0.000 | 0.000 | 0.000 | 0.942 | 0.900 |
| Planothidium sp.1 | Bacillariophyceae | 0.000 | 0.000 | 0.000 | 0.000 | 93.556 | 0.922 | 0.900 |
| Pseudoanabaena catenata | Cyanophyaceae | 33.945 | 91.538 | 132.625 | 13.667 | 75.696 | 0.811 | 0.662 |
| Pseudoanabaena skuja | Cyanophyaceae | 202.780 | 0.000 | 0.000 | 0.000 | 1721.926 | 0.757 | 0.854 |
| Scenedesmus sp.1 | Bacillariophyceae | 0.000 | 0.000 | 44.001 | 0.000 | 0.000 | 0.970 | 0.900 |
| Scenedesmus sp.2 | Bacillariophyceae | 0.000 | 0.000 | 25.167 | 0.000 | 0.000 | 0.982 | 0.900 |
| Sellaphora sp.1 | Bacillariophyceae | 0.000 | 48.948 | 0.000 | 0.000 | 0.000 | 0.993 | 0.900 |
| Staurastrum sp.1 | Zygnematophyceae | 16.528 | 0.000 | 0.000 | 0.000 | 5.375 | 0.985 | 0.900 |
| Stauroneis sp.1 | Bacillariophyceae | 0.000 | 104.779 | 0.000 | 0.000 | 0.000 | 0.942 | 0.900 |
| Stigeoclonium sp.1 | Chlorophyceae | 34.556 | 0.000 | 827.506 | 0.000 | 110.105 | 0.586 | 0.496 |
| Surirella angusta | Bacillariophyceae | 397.420 | 67.106 | 0.000 | 54.593 | 46.620 | 0.637 | 0.397 |
| Surirella linearis | Bacillariophyceae | 0.000 | 42.282 | 0.000 | 0.000 | 0.000 | 0.975 | 0.900 |
| Tabellaria fenestrata | Fragilariophyceae | 0.000 | 0.000 | 0.000 | 90.991 | 0.000 | 0.956 | 0.900 |
| Ulnaria ulna | Bacillariophyceae | 0.000 | 0.000 | 32.750 | 95.472 | 73.557 | 0.868 | 0.797 |

| Associations | Partial F-Tests | Models | |||||||
|---|---|---|---|---|---|---|---|---|---|
| Residual DF | RSS | DF | Sum of Squares | F | p | Adjusted R2 | Residual SE | p | |
| Functional diversity ~ Taxonomic diversity | |||||||||
| y ~ x | 18 | 0.032 | 0.016 | 0.042 | 0.269 | ||||
| y ~ x + x² | 17 | 0.028 | 1 | 0.004 | 3.281 | 0.089 | 0.065 | 0.225 | 0.219 |
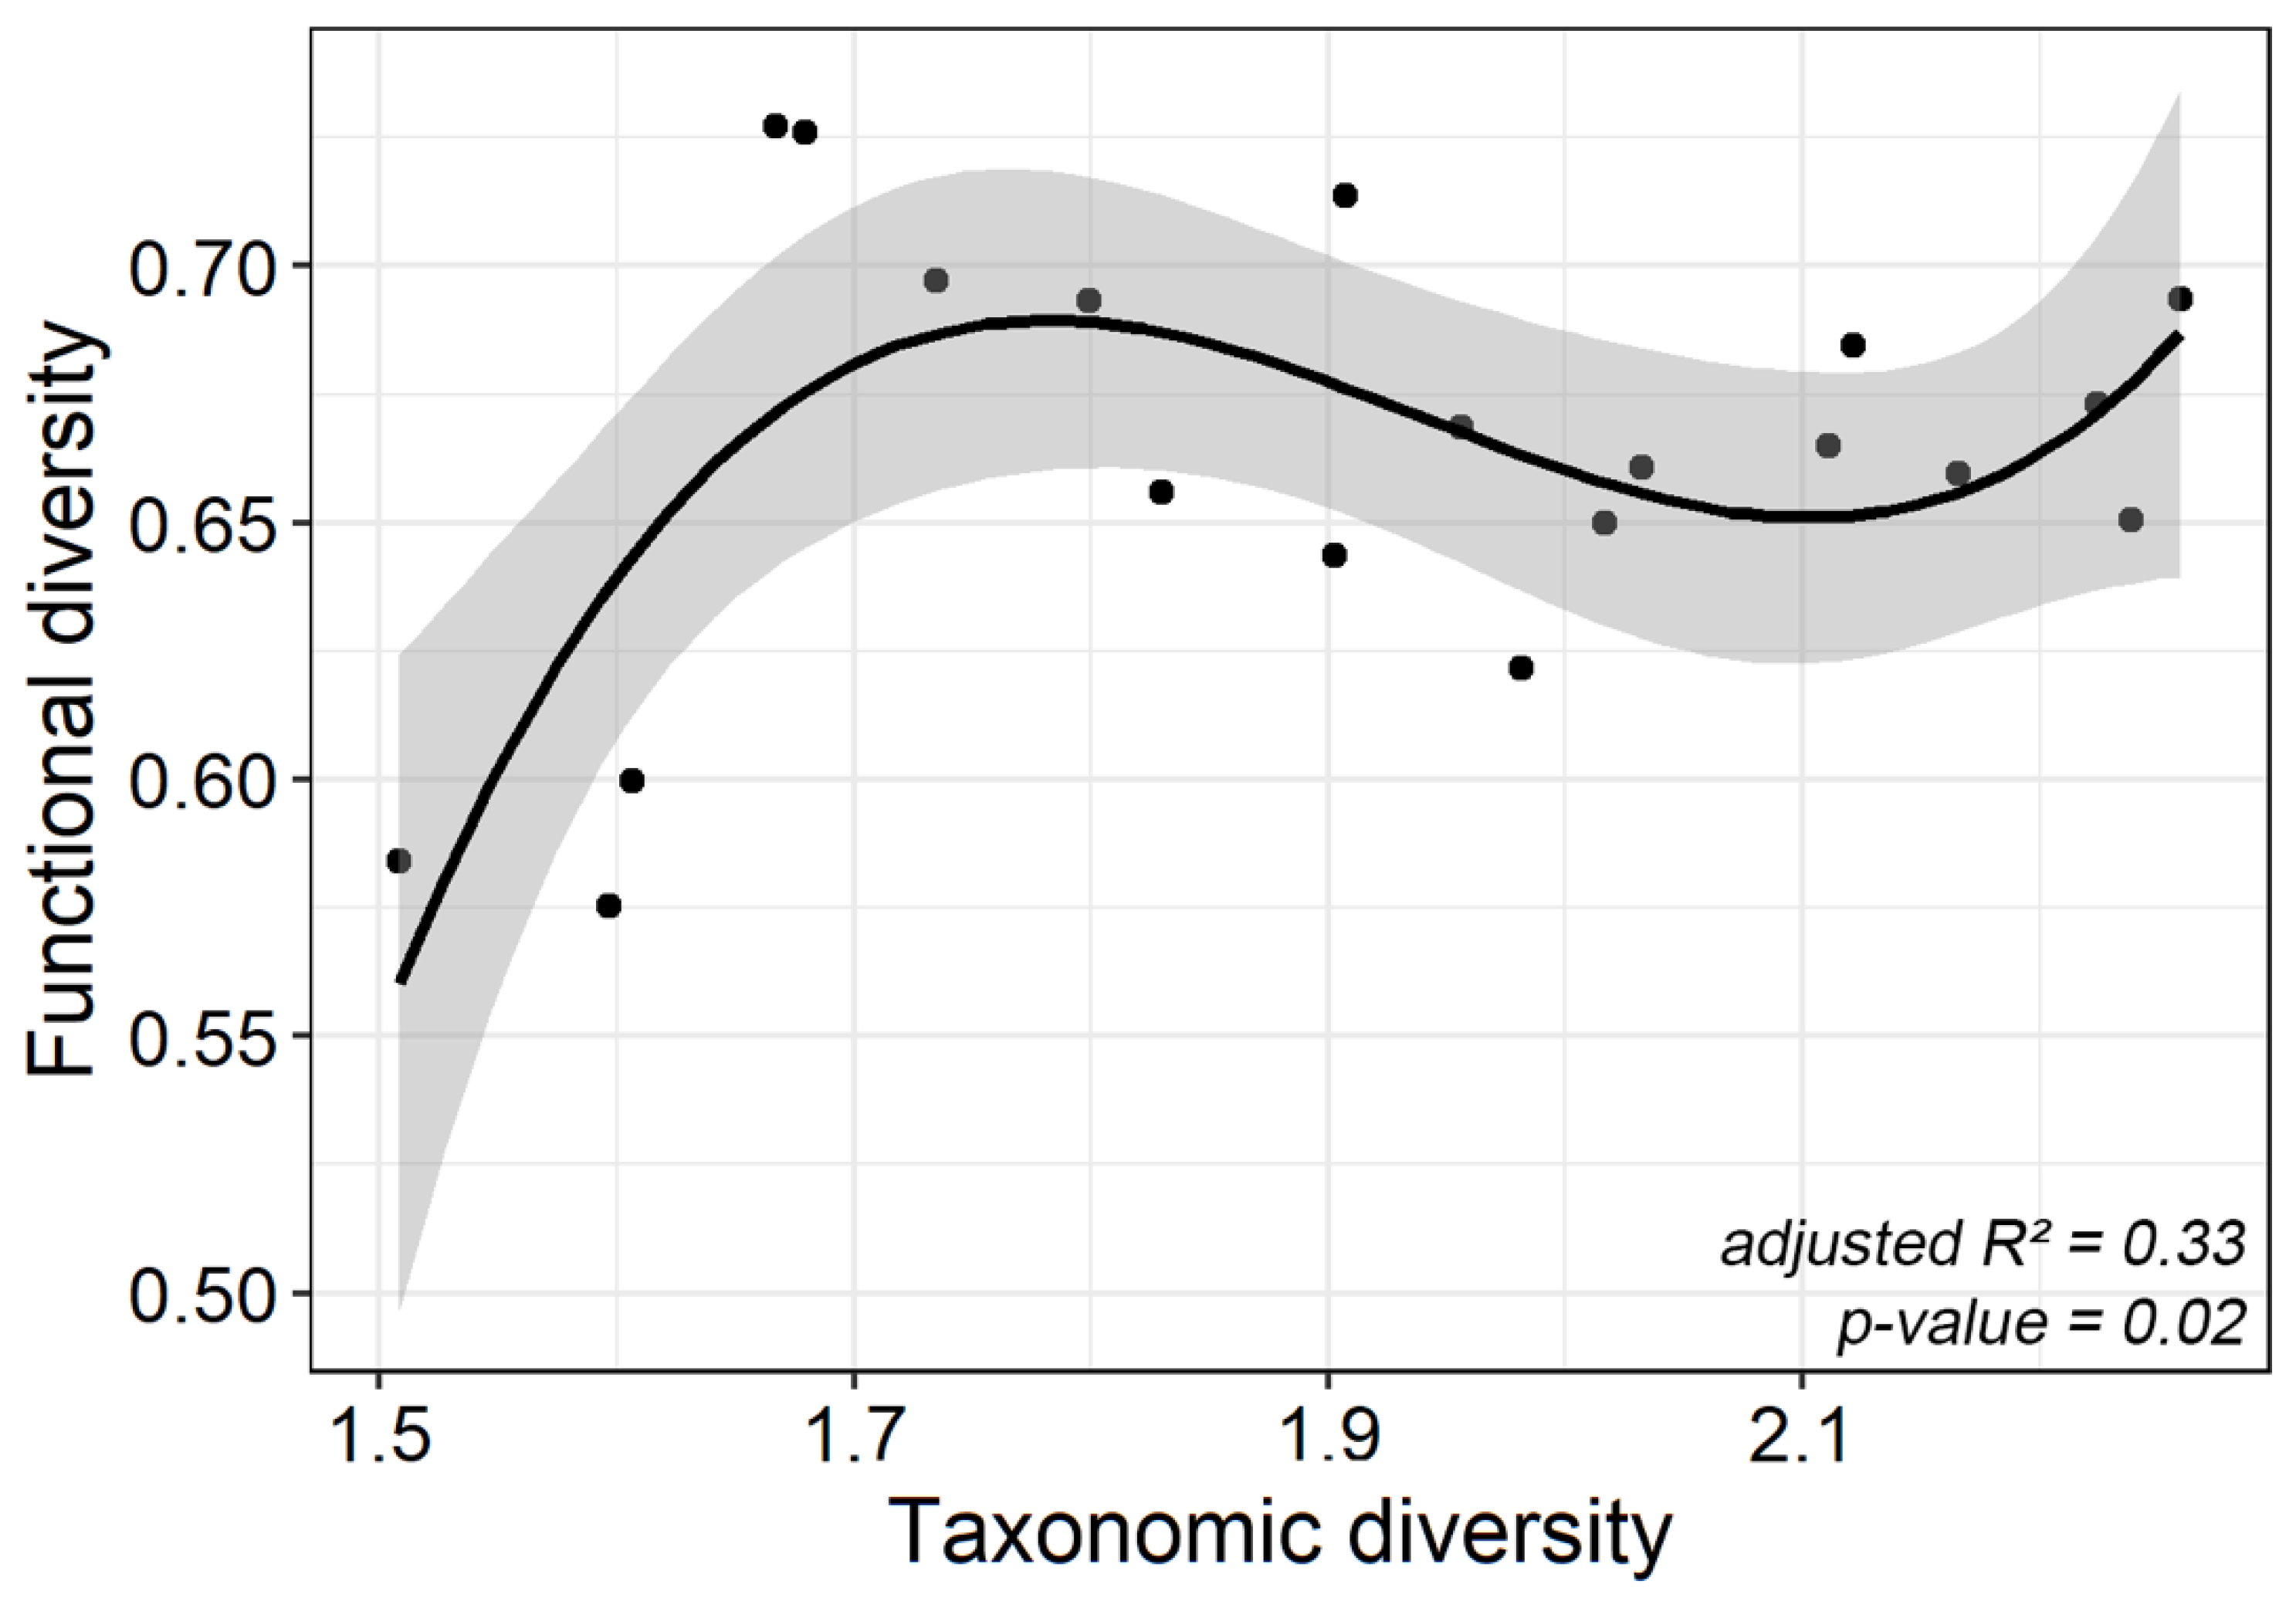
| y ~ x + x² + x³ | 16 | 0.019 | 1 | 0.009 | 7.363 | 0.015 | 0.335 | 0.035 | 0.023 |
| Taxonomic diversity ~ Eutrophication gradient | |||||||||
| y ~ x | 18 | 0.966 | 0.005 | 0.232 | 0.309 | ||||
| y ~ x + x² | 17 | 0.857 | 1 | 0.109 | 5.016 | 0.040 | 0.065 | 0.225 | 0.219 |
| y ~ x + x² + x³ | 16 | 0.348 | 1 | 0.509 | 23.416 | 0.000 | 0.597 | 0.147 | 0.000 |
| Functional diversity ~ Eutrophication gradient | |||||||||
| y ~ x | 18 | 0.028 | 0.136 | 0.040 | 0.061 | ||||
| y ~ x + x² | 17 | 0.025 | 1 | 0.004 | 2.416 | 0.140 | 0.200 | 0.038 | 0.058 |
| y ~ x + x² + x³ | 16 | 0.023 | 1 | 0.001 | 0.906 | 0.355 | 0.195 | 0.038 | 0.093 |
| Taxonomic diversity ~ Primary production | |||||||||
| y ~ x | 13 | 524.020 | −0.067 | 6.349 | 0.730 | ||||
| y ~ x + x² | 12 | 504.710 | 1 | 19.305 | 0.503 | 0.493 | −0.113 | 6.485 | 0.754 |
| y ~ x + x² + x³ | 11 | 422.060 | 1 | 82.656 | 2.154 | 0.170 | −0.015 | 6.194 | 0.459 |
| Functional diversity ~ Primary production | |||||||||
| y ~ x | 13 | 63.760 | 0.620 | 3.791 | 0.000 | ||||
| y ~ x + x² | 12 | 63.619 | 1 | 0.141 | 0.025 | 0.878 | 0.595 | 3.911 | 0.002 |
| y ~ x + x² + x³ | 11 | 62.986 | 1 | 0.632 | 0.110 | 0.746 | 0.654 | 3.614 | 0.002 |
| Taxonomic diversity ~ Biomass | |||||||||
| y ~ x | 13 | 2.497 | −0.022 | 0.438 | 0.417 | ||||
| y ~ x + x² | 12 | 2.465 | 1 | 0.031 | 0.262 | 0.619 | −0.093 | 0.453 | 0.676 |
| y ~ x + x² + x³ | 11 | 1.321 | 1 | 1.145 | 9.537 | 0.010 | 0.361 | 0.347 | 0.048 |
| Functional diversity ~ Biomass | |||||||||
| y ~ x | 13 | 2.140 | 0.124 | 0.406 | 0.108 | ||||
| y ~ x + x² | 12 | 2.110 | 1 | 0.030 | 0.186 | 0.675 | 0.065 | 0.419 | 0.265 |
| y ~ x + x² + x³ | 11 | 1.797 | 1 | 0.313 | 1.916 | 0.194 | 0.131 | 0.317 | 0.224 |
References
- Pimm, S.L.; Jenkins, C.N.; Abell, R.; Brooks, T.M.; Gittleman, J.L.; Joppa, L.N.; Raven, P.H.; Roberts, C.M.; Sexton, J.O. The biodiversity of species and their rates of extinction, distribution, and protection. Science 2014, 344, 1246752. [Google Scholar] [CrossRef] [PubMed]
- Williams-Subiza, E.A.; Epele, L.B. Drivers of biodiversity loss in freshwater environments: A bibliometric analysis of the recent literature. Aquat. Conserv. Mar. Freshw. Ecosyst. 2021, 31, 2469–2480. [Google Scholar] [CrossRef]
- Nakano, S.; Murakami, M. Reciprocal subsidies: Dynamic interdependence between terrestrial and aquatic food webs. Proc. Natl. Acad. Sci. USA 2001, 98, 166–170. [Google Scholar] [CrossRef] [PubMed]
- Sykes, L.; Santini, L.; Etard, A.; Newbold, T. Effects of rarity form on species’ responses to land use. Conserv. Biol. 2020, 34, 688–696. [Google Scholar] [CrossRef] [PubMed]
- Violle, C.; Thuiller, W.; Mouquet, N.; Munoz, F.; Kraft, N.J.B.; Cadotte, M.W.; Livingstone, S.W.; Mouillot, D. Functional Rarity: The Ecology of Outliers. Trends Ecol. Evol. 2017, 32, 356–367. [Google Scholar] [CrossRef]
- Cleveland, C.C.; Townsend, A.R.; Taylor, P.; Alvarez-Clare, S.; Bustamante, M.M.C.; Chuyong, G.; Dobrowski, S.Z.; Grierson, P.; Harms, K.E.; Houlton, B.Z.; et al. Relationships among net primary productivity, nutrients and climate in tropical rain forest: A pan-tropical analysis. Ecol. Lett. 2011, 14, 939–947. [Google Scholar] [CrossRef]
- Edwards, M.; Konar, B.; Kim, J.-H.; Gabara, S.; Sullaway, G.; McHugh, T.; Spector, M.; Small, S. Marine deforestation leads to widespread loss of ecosystem function. PLoS ONE 2020, 15, e0226173. [Google Scholar] [CrossRef]
- Török, P.; T-Krasznai, E.; B-Béres, V.; Bácsi, I.; Borics, G.; Tóthmérész, B. Functional diversity supports the biomass–diversity humped-back relationship in phytoplankton assemblages. Funct. Ecol. 2016, 30, 1593–1602. [Google Scholar] [CrossRef]
- Cernansky, R. Biodiversity moves beyond counting species. Nature 2017, 546, 22–24. [Google Scholar] [CrossRef]
- de Bello, F.; Carmona, C.P.; Dias, A.T.C.; Götzenberger, L.; Moretti, M.; Berg, M.P. Handbook of Trait-Based Ecology: From Theory to R Tools; Cambridge University Press: Cambridge, UK, 2021. [Google Scholar]
- Kearney, M.R.; Jusup, M.; McGeoch, M.A.; Kooijman, S.A.L.M.; Chown, S.L. Where do functional traits come from? The role of theory and models. Funct. Ecol. 2021, 35, 1385–1396. [Google Scholar] [CrossRef]
- Tilman, D.; Isbell, F.; Cowles, J.M. Biodiversity and Ecosystem Functioning. Annu. Rev. Ecol. Evol. Syst. 2014, 45, 471–493. [Google Scholar] [CrossRef]
- Violle, C.; Navas, M.-L.; Vile, D.; Kazakou, E.; Fortunel, C.; Hummel, I.; Garnier, E. Let the concept of trait be functional! Oikos 2007, 116, 882–892. [Google Scholar] [CrossRef]
- Lavorel, S. Plant functional effects on ecosystem services. J. Ecol. 2013, 101, 4–8. [Google Scholar] [CrossRef]
- Cadotte, M.W.; Carscadden, K.; Mirotchnick, N. Beyond species: Functional diversity and the maintenance of ecological processes and services. J. Appl. Ecol. 2011, 48, 1079–1087. [Google Scholar] [CrossRef]
- Halvorson, H.M.; Barry, J.R.; Lodato, M.B.; Findlay, R.H.; Francoeur, S.N.; Kuehn, K.A. Periphytic algae decouple fungal activity from leaf litter decomposition via negative priming. Funct. Ecol. 2019, 33, 188–201. [Google Scholar] [CrossRef]
- Ziegler, S.E.; Lyon, D.R. Factors regulating epilithic biofilm carbon cycling and release with nutrient enrichment in headwater streams. Hydrobiologia 2010, 657, 71–88. [Google Scholar] [CrossRef]
- Biggs, B.J.F.; Stevenson, R.J.; Lowe, R.L. A habitat matrix conceptual model for stream periphyton. Arch. Fur Hydrobiol. 1998, 143, 21–56. [Google Scholar] [CrossRef]
- Lange-Bertalot, H.; Bąk, M.; Andrzej, W.; Tagliaventi, N. Eunotia and Some Related Genera; Gantner Verlag: Ruggell, Liechtenstein, 2011. [Google Scholar]
- Flöder, S.; Jaschinski, S.; Wells, G.; Burns, C.W. Dominance and compensatory growth in phytoplankton communities under salinity stress. J. Exp. Mar. Biol. Ecol. 2010, 395, 223–231. [Google Scholar] [CrossRef]
- Havens, K.E.; Carlson, R.E. Functional complementarity in plankton communities along a gradient of acid stress. Environ. Pollut. 1998, 101, 427–436. [Google Scholar] [CrossRef]
- Wagg, C.; Ebeling, A.; Roscher, C.; Ravenek, J.; Bachmann, D.; Eisenhauer, N.; Mommer, L.; Buchmann, N.; Hillebrand, H.; Schmid, B.; et al. Functional trait dissimilarity drives both species complementarity and competitive disparity. Funct. Ecol. 2017, 31, 2320–2329. [Google Scholar] [CrossRef]
- Dunck, B.; Algarte, V.M.; Cianciaruso, M.V.; Rodrigues, L. Functional diversity and trait–environment relationships of periphytic algae in subtropical floodplain lakes. Ecol. Indic. 2016, 67, 257–266. [Google Scholar] [CrossRef]
- Dunck, B.; Schneck, F.; Rodrigues, L. Patterns in species and functional dissimilarity: Insights from periphytic algae in subtropical floodplain lakes. Hydrobiologia 2016, 763, 237–247. [Google Scholar] [CrossRef]
- Dunck, B.; Rodrigues, L.; Bicudo, D. Functional diversity and functional traits of periphytic algae during a short-term successional process in a Neotropical floodplain lake. Braz. J. Biol. 2015, 75, 587–597. [Google Scholar] [CrossRef] [PubMed]
- Dunck, B.; Bortolini, J.C.; Rodrigues, L.; Rodrigues, L.C.; Jati, S.; Train, S. Functional diversity and adaptative strategies of planktonic and periphytic algae in isolated tropical floodplain lake. Braz. J. Bot. 2013, 36, 257–266. [Google Scholar] [CrossRef]
- Bichoff, A.; Osório, N.C.; Ruwer, D.T.; Dunck, B.; Rodrigues, L. Trait structure and functional diversity of periphytic algae in a floodplain conservation area. Braz. J. Bot. 2018, 41, 601–610. [Google Scholar] [CrossRef]
- Dunck, B.; Amaral, D.C.; Fernandes, U.L.; Santana, N.F.; Lopes, T.M.; Rodrigues, L. Herbivory effects on the periphytic algal functional diversity in lake ecosystems: An experimental approach. Hydrobiologia 2018, 816, 231–241. [Google Scholar] [CrossRef]
- Ács, É.; Földi, A.; Vad, C.F.; Trábert, Z.; Kiss, K.T.; Duleba, M.; Borics, G.; Grigorszky, I.; Botta-Dukát, Z. Trait-based community assembly of epiphytic diatoms in saline astatic ponds: A test of the stress-dominance hypothesis. Sci. Rep. 2019, 9, 15749. [Google Scholar] [CrossRef]
- Passy, S.I. Diatom ecological guilds display distinct and predictable behavior along nutrient and disturbance gradients in running waters. Aquat. Bot. 2007, 86, 171–178. [Google Scholar] [CrossRef]
- Soininen, J.; Jamoneau, A.; Rosebery, J.; Passy, S.I. Global patterns and drivers of species and trait composition in diatoms. Glob. Ecol. Biogeogr. 2016, 25, 940–950. [Google Scholar] [CrossRef]
- Stenger-Kovács, C.; Körmendi, K.; Lengyel, E.; Abonyi, A.; Hajnal, É.; Szabó, B.; Buczkó, K.; Padisák, J. Expanding the trait-based concept of benthic diatoms: Development of trait- and species-based indices for conductivity as the master variable of ecological status in continental saline lakes. Ecol. Indic. 2018, 95, 63–74. [Google Scholar] [CrossRef]
- Stenger-Kovács, C.; Lengyel, E.; Buczkó, K.; Padisák, J.; Korponai, J. Trait-based diatom functional diversity as an appropriate tool for understanding the effects of environmental changes in soda pans. Ecol. Evol. 2020, 10, 320–335. [Google Scholar] [CrossRef]
- Williams, D.M.; Reid, G. Fossils and the tropics, the Eunotiaceae (Bacillariophyta) expanded: A new genus for the Upper Eocene fossil diatom Eunotia reedii and the recent tropical marine diatom Amphora reichardtiana. Eur. J. Phycol. 2006, 41, 147–154. [Google Scholar] [CrossRef]
- Kuussaari, M.; Bommarco, R.; Heikkinen, R.K.; Helm, A.; Krauss, J.; Lindborg, R.; Öckinger, E.; Pärtel, M.; Pino, J.; Rodà, F.; et al. Extinction debt: A challenge for biodiversity conservation. Trends Ecol. Evol. 2009, 24, 564–571. [Google Scholar] [CrossRef]
- Dunck, B.; Lima-Fernandes, E.; Cássio, F.; Cunha, A.; Rodrigues, L.; Pascoal, C. Responses of primary production, leaf litter decomposition and associated communities to stream eutrophication. Environ. Pollut. 2015, 202, 32–40. [Google Scholar] [CrossRef]
- Dunck, B.; Rodrigues, L.; Lima-Fernandes, E.; Cássio, F.; Pascoal, C.; Cottenie, K. Priority effects of stream eutrophication and assembly history on beta diversity across aquatic consumers, decomposers and producers. Sci. Total Environ. 2021, 797, 149106. [Google Scholar] [CrossRef]
- De Mattos Bicudo, C.E.; Menezes, M. Gêneros de Algas de Águas Continentais do Brasil (Chave Para Identificação e Descrições), 3rd ed.; RiMa Editora: São Carlos, Brazil, 2006; 473p. [Google Scholar]
- Utermohl, H. Zur Vervollkommung der quantitativen phytoplankton-methodik. Mitt Int. Ver Limnol. 1958, 9, 38. [Google Scholar]
- Ferragut, C.; Bicudo, D.C. Effect of N and P enrichment on periphytic algal com-munity succession in a tropical oligotrophic reservoir. Limnology 2012, 13, 131–141. [Google Scholar] [CrossRef]
- Ros, J. Prácticas de Ecología; Universidad Central, Departamento de Ecología: Barcelona, Espanha, 1979. [Google Scholar]
- Golterman, H.L.; Golterman, H.L.; Clymo, R.S.; Ohnstad, M.A.M. Methods for Physical and Chemical Analysis of Fresh Waters, Handbooks (International Biological Programme); Blackwell Scientific: Hoboken, NJ, USA, 1978. [Google Scholar]
- Schreiber, U.; Schliwa, U.; Bilger, W. Continuous recording of photochemical and non-photochemical chlorophyll fluorescence quenching with a new type of modulation fluorometer. Photosynth. Res. 1986, 10, 51–62. [Google Scholar] [CrossRef]
- Passy, S.I.; Larson, C.A. Succession in Stream Biofilms is an Environmentally Driven Gradient of Stress Tolerance. Microb. Ecol. 2011, 62, 414–424. [Google Scholar] [CrossRef]
- Sládecková, A.; Sládecek, V. Periphyton as indicator of the reservoir water quality. II. Pseudoperiphyton. Ergeb. Der Limnol. 1997, 9, 177–191. [Google Scholar]
- Komárek, J.; Anagnostidis, K. Cyanoprokaryota 1. Teil: Chroococcales; Ettl, H.G., Gärtner, H., Heynig, D., Mollenhauer, Eds.; Susswasserflora von Mitteleuropa: Berlin/Heidelberg, Germany, 1998. [Google Scholar]
- Wehr, J.D.; Sheath, R.G. Freshwater Algae of North America: Ecology and Classification; Academic Press: San Diego, CA, USA, 2003. [Google Scholar]
- Borcard, D.; Gillet, F.; Legendre, P. Numerical Ecology with R; Springer: Berlin/Heidelberg, Germany, 2011. [Google Scholar]
- Pavoine, S.; Vallet, J.; Dufour, A.-B.; Gachet, S.; Daniel, H. On the challenge of treating various types of variables: Application for improving the measurement of functional diversity. Oikos 2009, 118, 391–402. [Google Scholar] [CrossRef]
- Pavoine, S.; Bonsall, M.B. Measuring biodiversity to explain community assembly: A unified approach. Biol. Rev. 2011, 86, 792–812. [Google Scholar] [CrossRef] [PubMed]
- Weiher, E.; Keddy, P.A. The Assembly of Experimental Wetland Plant Communities. Oikos 1995, 73, 323. [Google Scholar] [CrossRef]
- Kirkpatrick, M.; Lofsvold, D.; Bulmer, M. Analysis of the inheritance, selection and evolution of growth trajectories. Genetics 1990, 124, 979–993. [Google Scholar] [CrossRef] [PubMed]
- Legendre, P.; Legendre, L. Numerical Ecology; Elsevier: Amsterdam, The Netherlands, 2012. [Google Scholar]
- Colares, L.F.; Lobato, C.M.C.; de Assis Montag, L.F.; Dunck, B. Extinction of rare fish predicts an abrupt loss of ecological function in the future of Amazonian streams. Freshw. Biol. 2022, 67, 263–274. [Google Scholar] [CrossRef]
- Leitão, R.P.; Zuanon, J.; Villéger, S.; Williams, S.E.; Baraloto, C.; Fortunel, C.; Mendonça, F.P.; Mouillot, D. Rare species contribute disproportionately to the functional structure of species assemblages. Proc. R. Soc. B Biol. Sci. 2016, 283, 20160084. [Google Scholar] [CrossRef]
- Mouillot, D.; Bellwood, D.R.; Baraloto, C.; Chave, J.; Galzin, R.; Harmelin-Vivien, M.; Kulbicki, M.; Lavergne, S.; Lavorel, S.; Mouquet, N.; et al. Rare Species Support Vulnerable Functions in High-Diversity Ecosystems. PLoS Biol. 2013, 11, e1001569. [Google Scholar] [CrossRef]
- Doledec, S.; Chessel, D.; Gimaret-Carpentier, C. Niche Separation in Community Analysis: A New Method. Ecology 2000, 81, 2914. [Google Scholar] [CrossRef]
- Hillebrand, H.; Sommer, U. Diversity of benthic microalgae in response to colonization time and eutrophication. Aquat. Bot. 2000, 67, 221–236. [Google Scholar] [CrossRef]
- Worm, B.; Lotze, H.K.; Hillebrand, H.; Sommer, U. Consumer versus resource control of species diversity and ecosystem functioning. Nature 2002, 417, 848–851. [Google Scholar] [CrossRef]
- Odum, E.P.; Finn, J.T.; Franz, E.H. Perturbation Theory and the Subsidy-Stress Gradient. BioScience 1979, 29, 349–352. [Google Scholar] [CrossRef]
- Mittelbach, G.G.; Steiner, C.F.; Scheiner, S.M.; Gross, K.L.; Reynolds, H.L.; Waide, R.B.; Willig, M.R.; Dodson, S.I.; Gough, L. What is the observed relationship between species richness and productivity? Ecology 2001, 82, 2381–2396. [Google Scholar] [CrossRef]
- Wang, C.; Long, R.; Wang, Q.; Liu, W.; Jing, Z.; Zhang, L. Fertilization and litter effects on the functional group biomass, species diversity of plants, microbial biomass, and enzyme activity of two alpine meadow communities. Plant Soil 2010, 331, 377–389. [Google Scholar] [CrossRef]
- Arthaud, F.; Vallod, D.; Robin, J.; Bornette, G. Eutrophication and drought disturbance shape functional diversity and life-history traits of aquatic plants in shallow lakes. Aquat. Sci. 2012, 74, 471–481. [Google Scholar] [CrossRef]
- Duré, G.A.V.; Simões, N.R.; de Souza Magalhães Braghin, L.; Ribeiro, S.M.M.S. Effect of eutrophication on the functional diversity of zooplankton in shallow ponds in Northeast Brazil. J. Plankton Res. 2021, 43, 894–907. [Google Scholar] [CrossRef]
- Cardinale, B.J.; Matulich, K.L.; Hooper, D.U.; Byrnes, J.E.; Duffy, E.; Gamfeldt, L.; Balvanera, P.; O’Connor, M.I.; Gonzalez, A. The functional role of producer diversity in ecosystems. Am. J. Bot. 2011, 98, 572–592. [Google Scholar] [CrossRef]
- Hagan, J.G.; Vanschoenwinkel, B.; Gamfeldt, L. We should not necessarily expect positive relationships between biodiversity and ecosystem functioning in observational field data. Ecol. Lett. 2021, 24, 2537–2548. [Google Scholar] [CrossRef]
- O’Connor, M.I.; Gonzalez, A.; Byrnes, J.E.K.; Cardinale, B.J.; Duffy, J.E.; Gamfeldt, L.; Griffin, J.N.; Hooper, D.; Hungate, B.A.; Paquette, A.; et al. A general biodiversity-function relationship is mediated by trophic level. Oikos 2017, 126, 18–31. [Google Scholar] [CrossRef]
- Loreau, M.; Hector, A. Partitioning selection and complementarity in biodiversity experiments. Nature 2001, 412, 72–76. [Google Scholar] [CrossRef]
- Godoy, O.; Gómez-Aparicio, L.; Matías, L.; Pérez-Ramos, I.M.; Allan, E. An excess of niche differences maximizes ecosystem functioning. Nat. Commun. 2020, 11, 4180. [Google Scholar] [CrossRef]
- Stevenson, R.J.; Bothwell, M.L.; Lowe, R.L.; Thorp, J.H. Algal Ecology: Freshwater Benthic Ecosystem; Academic press: Cambridge, MA, USA, 1996. [Google Scholar]
- McCormick, P.V. Resource competition and species coexistence in freshwater benthic algal assemblages. In Algal Ecology; Elsevier: Amsterdam, The Netherlands, 1996; pp. 229–252. [Google Scholar]
- Antoniades, D.; Hamilton, P.; Douglas, M.; Smol, J. Diatoms of North America: The Freshwater Floras of Prince Patrick, Ellef Ringnes and Northern Ellesmere Islands from the Canadian Arctic Archipelago; Gantner Verlag: Ruggell, Liechtenstein, 2008. [Google Scholar]
- Lange-Bertalot, H. A First “Red List” of Endangered Taxa in the Diatom Flora of Germany and of Central Europe-Interpretation and Comparison. In Proceedings of the 14th International Diatom Symposium, Koeltz, Koenigstein, 1999; pp. 345–351. [Google Scholar]
- Lange-Bertalot, H. A first ecological evaluation of the diatom flora in Central Europe. Lauterbornia 1997, 31, 117–123. [Google Scholar]
- Krammer, K.; Lange-Bertalot, H. Süßwasserflora von Mitteleuropa, 640 Bacillariophyceae. Centrales, Fragilariaceae, Eunoticeae; Gustav Fischer Verlag: Stuttgart, Germany, 1991; Volume 3. [Google Scholar]
- Patrick, R.; Reimer, C.W. The Diatoms of the United States, Exclusive of Alaska and Hawaii: Fragilariaceae, Eunotiaceae, Achnanthaceae, Naviculacae; Academy of Natural Sciences of Philadelphia: Philadelphia, PA, USA, 1996. [Google Scholar]
- Potapova, M.; Hamilton, P.B. Morphological and ecological variation within the Achnanthidium minutissimum (Bacillariophyceae) species complex. J. Phycol. 2007, 43, 561–575. [Google Scholar] [CrossRef]
- Denys, L. Historical Distribution of “Red List Diatoms” (Bacillariophyceae) in Flanders (Belgium). Syst. Geogr. Plants 2000, 70, 409. [Google Scholar] [CrossRef]
- Cowie, R.H.; Bouchet, P.; Fontaine, B. The Sixth Mass Extinction: Fact, fiction or speculation? Biol. Rev. 2022, 97, 640–663. [Google Scholar] [CrossRef]
- De Castro, L.S.; de Souza Lopes, A.A.; Colares, L.; Palheta, L.; de Souza Menezes, M.; Fernandes, L.M.; Dunck, B. Dam promotes downriver functional homogenization of phytoplankton in a transitional river-reservoir system in Amazon. Limnology 2021, 22, 245–257. [Google Scholar] [CrossRef]
- Shuai, F.; Lek, S.; Li, X.; Zhao, T. Biological invasions undermine the functional diversity of fish community in a large subtropical river. Biol. Invasions 2018, 20, 2981–2996. [Google Scholar] [CrossRef]


Publisher’s Note: MDPI stays neutral with regard to jurisdictional claims in published maps and institutional affiliations. |
© 2022 by the authors. Licensee MDPI, Basel, Switzerland. This article is an open access article distributed under the terms and conditions of the Creative Commons Attribution (CC BY) license (https://creativecommons.org/licenses/by/4.0/).
Share and Cite
Dunck, B.; Colares, L.F.; Rodrigues, L.; Cássio, F.; Pascoal, C. Functional Diversity and Primary Production Predict Future Patterns of Periphyton Productivity after Species Extinction. Hydrobiology 2022, 1, 483-498. https://doi.org/10.3390/hydrobiology1040029
Dunck B, Colares LF, Rodrigues L, Cássio F, Pascoal C. Functional Diversity and Primary Production Predict Future Patterns of Periphyton Productivity after Species Extinction. Hydrobiology. 2022; 1(4):483-498. https://doi.org/10.3390/hydrobiology1040029
Chicago/Turabian StyleDunck, Bárbara, Lucas Ferreira Colares, Liliana Rodrigues, Fernanda Cássio, and Cláudia Pascoal. 2022. "Functional Diversity and Primary Production Predict Future Patterns of Periphyton Productivity after Species Extinction" Hydrobiology 1, no. 4: 483-498. https://doi.org/10.3390/hydrobiology1040029