Article

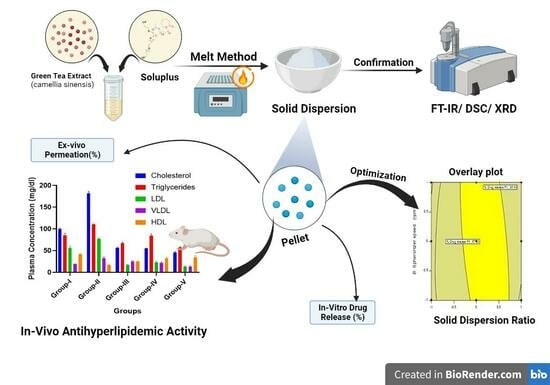
Green Tea Extract Solid Dispersion Pellets with Enhanced Permeability for Hyperlipidemia

1
Department of Pharmaceutics, Dr. D. Y. Patil Institute of Pharmaceutical Sciences and Research Pimpri, Pune 411018, India
2
Department of Pharmacy Practice, Dr. D. Y. Patil Institute of Pharmaceutical Sciences and Research Pimpri, Pune 411018, India
3
Department of Pharmaceutical Chemistry, Dr. D. Y. Patil Institute of Pharmaceutical Sciences and Research Pimpri, Pune 411018, India
4
Department of Pharmaceutical Sciences, The State University of New York, Buffalo, NY 14214, USA
*
Authors to whom correspondence should be addressed.
Future Pharmacol. 2023, 3(4), 708-730; https://doi.org/10.3390/futurepharmacol3040044
Submission received: 15 August 2023 / Revised: 15 September 2023 / Accepted: 3 October 2023 / Published: 10 October 2023

Abstract

:
Green tea extract, rich in polyphenols like catechins, has been reported to have pharmacological benefits in patients with hyperlipidemia. The minimal membrane permeability of green tea limits its use in terms of bioavailability. To improve the permeability of green tea catechins in order to enhance theiranti-hyperlipidemia activity, a surfactant-based polymer was used to formulate a solid dispersion of green tea and convert it into commercially acceptable pellets. Green tea extract solid dispersions (GTE-SDs) were prepared withsolvent evaporation method using Soluplus® as a carrier. The GTE-SDs were evaluated for ex vivo permeation studies and characterized using FTIR, DSC, and XRD for confirming the formation of SD. The GTE-SDs exhibiting enhanced ex vivo permeation of EGCG were converted into a pellet formulation using the extrusion spheronization technique while being optimized using a 32 full factorial design. Soluplus® exhibited a four-fold improvement in the ex vivo permeation of EGCG from GTE-SD pellets (33.27%) as compared to GTE (10.43%) (p-value < 0.0001). In male Wistar rats, optimized GTE-SD pellets reduced the lipid blood profiles as compared to GTE (p-value < 0.0001). Thus, GTE-SD pellets can serve as an effective drug delivery platform for hyperlipidemia.

Graphical Abstract

1. Introduction

Hyperlipidemia is a condition characterized by elevated blood lipid and lipoprotein levels (total cholesterol ≥ 240 mg/dL, LDL-C = 160–180 mg/dL, HDL-C = 40 mg/dL, triglycerides = 200–400 mg/dL) [1,2]. It can be due to obesity, dietary issues, genetic disorders such as familial hypercholesterolemia (FH), or additional ailments like diabetes [3]. High levels of blood lipids are widely recognized markers for cardiovascular diseases like atherosclerosis, coronary artery diseases, cardiac arrest, etc. [4]. By 2030, the sustainable development goals of the United Nations demand improved early detection, national and global risk reduction, and management of non-communicable chronic illnesses, including hyperlipidemia [5]. According to recent estimates given by the American Heart Association, there are 28.5 million adults who have substantial serum cholesterol levels, with a recorded frequency of 11.9% [6].
Currently, statins are the first-line lipid-lowering medications, but when administered in high doses, they can cause myalgia, liver damage, and diabetes [7]. Fibrates can lower triglyceride levels and increase HDL cholesterol, but they too are linked with side effects such as stomach upset, liver problems, and muscle pain. Although proprotein convertase subtilisin/kexin type 9 (PCSK9) inhibitors have been advanced to achieve targeted therapeutics to reduce the side effects, they lack patient compliance due to their higher cost and unproven safety, thus preventing them from being used in more clinical settings [8].
To overcome the drawbacks of current medical therapy for treating hyperlipidemia, the development of alternative therapies is of utmost importance. Traditional medicine claims that herbal-based medications have therapeutic value for a variety of illnesses [9]. Polyphenols are naturally occurring compounds that occur in fruits and vegetables. In recent years, it has been observed that using dietary polyphenols can have some positive impacts on human health [10]. According to reports, they have potent antioxidant activity that helps protect cells from oxidative stress and reactive oxygen species, hence preventing degenerative disorders or illnesses related to increased oxidative stress [11].
Green tea is obtained from the dried leaves of the Camellia sinensis plant, which belongs to the Theaceae family [12]. Green tea is reported to exhibit pharmacological activities like antioxidant, anticancer, antidepressant, and anti-neurodegenerative [13]. Patients with hypertension, hyperlipidemia, coronary heart disease, and arteriosclerosis may benefit from drinking green tea. It has a greater amount of polyphenols like flavonols and derivatives of gallic acid [14]. Green tea contains four major catechins, namely epicatechin, epigallocatechin, epicatechin gallate and epigallocatechin gallate. Epigallocatechin gallate (EGCG) is one of the predominant polyphenols found in green tea and is a potent antioxidant that inhibits the oxidation of LDL by in vitro integrating itself into LDL particles in nonconjugated forms and reducing fat absorption from the gut by preventing the development of micelles [15,16]. In spite of the various advantages offered by green tea in regulating lipid levels, studies report that after oral administration, the peak plasma level of tea catechins in humans and animals is in the sub-micromolar range [17]. This lower bioavailability of catechins is attributed to its minimal membrane permeability in the gastrointestinal tract, limiting its therapeutic effect [18]. To solve the permeability issues of green tea catechins, many formulation approaches have been studied such as emulsion-based systems namely (liposomes and nanoemulsion) [19], nanoparticles [20], and structural modifications of EGCG [21]. Even though these approaches have improved the bioavailability of green tea catechins, challenges still exist, which include the journey of these nanocarriers from the laboratory to the pharmaceutical market, the formulation cost, and the repeatability of product characteristics on a large scale. Hence, an attempt was made to use a simple and scalable method to increase the permeability of green tea catechins in order to boost its anti-hyperlipidemic activity.
Solid dispersion is one of the most efficient and simple methods for increasing a drug’s solubility, rate of dissolution, permeability, and subsequently, its bioavailability. The utilization of self-emulsifying and surface-active carriers such as Soluplus® with amphiphilic properties and the ability to inhibit p-glycoprotein (P-gp) pump have opened up a new way for making solid solutions of certain medicines with low water solubility and permeability [22]. According to Linn et al., Soluplus® acts as an inherited P-gp inhibitor and thus could contribute to enhanced bioavailability for poorly permeable drugs [23]. Hence, formulating SD using Soluplus® can pave the way for enhancing the permeability of green tea catechins. The formulation of SDs requires a high amount of polymer, which makes its handling and dispensing difficult. Hence, the formed SD was converted into a pellet formulation because pellets are free-flowing, their handling is easy, and they can be conveniently filled into capsules and are consequently, preferred commercially.
In this study, we endeavored to improve the permeability of EGCG from GTE-SD pellets using Soluplus® as a carrier for formulating SD. The developed GTE-SD pellets were evaluated for the ex vivo permeation of EGCG. The in vivo efficacy of the GTE-SD pellets in lowering the lipid profile was evaluated by analyzing the lipid blood profile in male Wistar rats.

2. Materials and Methods

2.1. Materials

Green tea leaves were purchased from Ayurvedic Centre, (Pune, India). Polyvinylpyrrolidone (PVP K30) was obtained from Himedia (Mumbai, India). Croscarmellose sodium was procured from Research Lab Fine Chem, (Mumbai, India). Microcrystalline cellulose was purchased from LOBA Chemie, (Mumbai, India). Lactose was obtained from Himedia, (Mumbai, India). Hydroxy-Propyl-β-Cyclodextrin was obtained from Himedia, (Mumbai India). Poloxamer 188 and Soluplus® were kindly provided as gift samples by BASF (Mumbai, India). All of the chemicals utilized were of analytical quality.

2.2. Methods

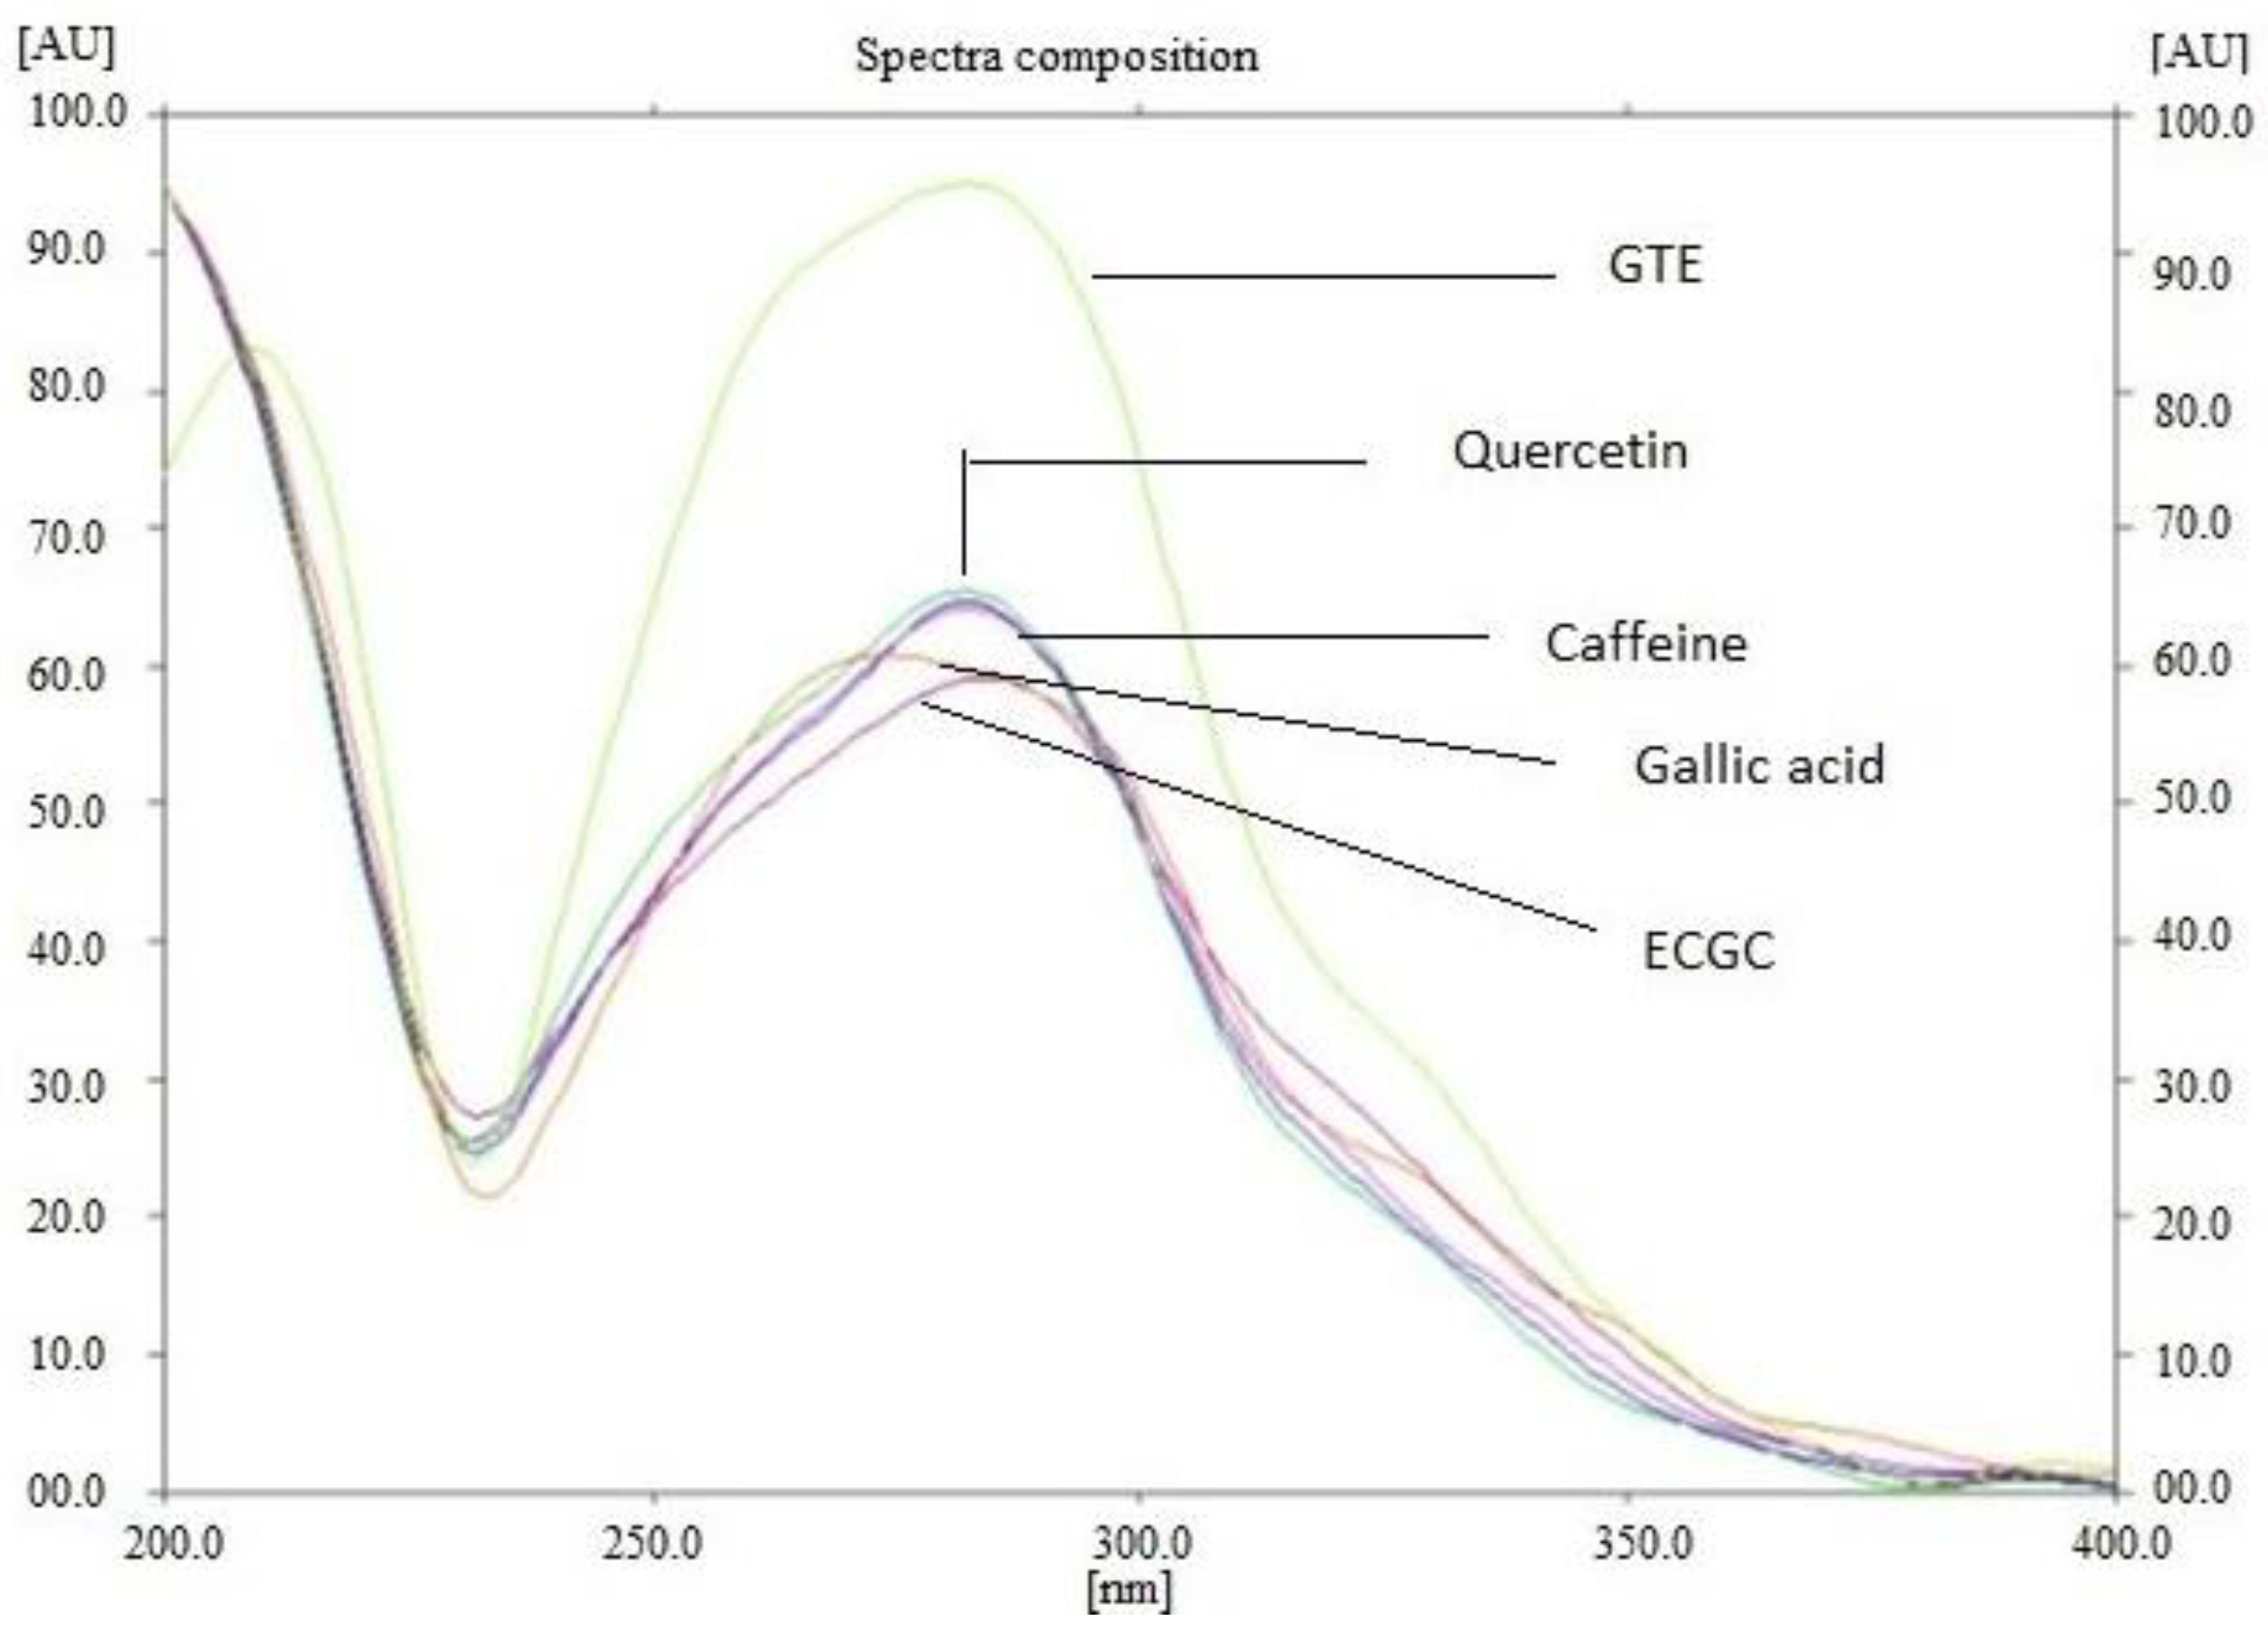
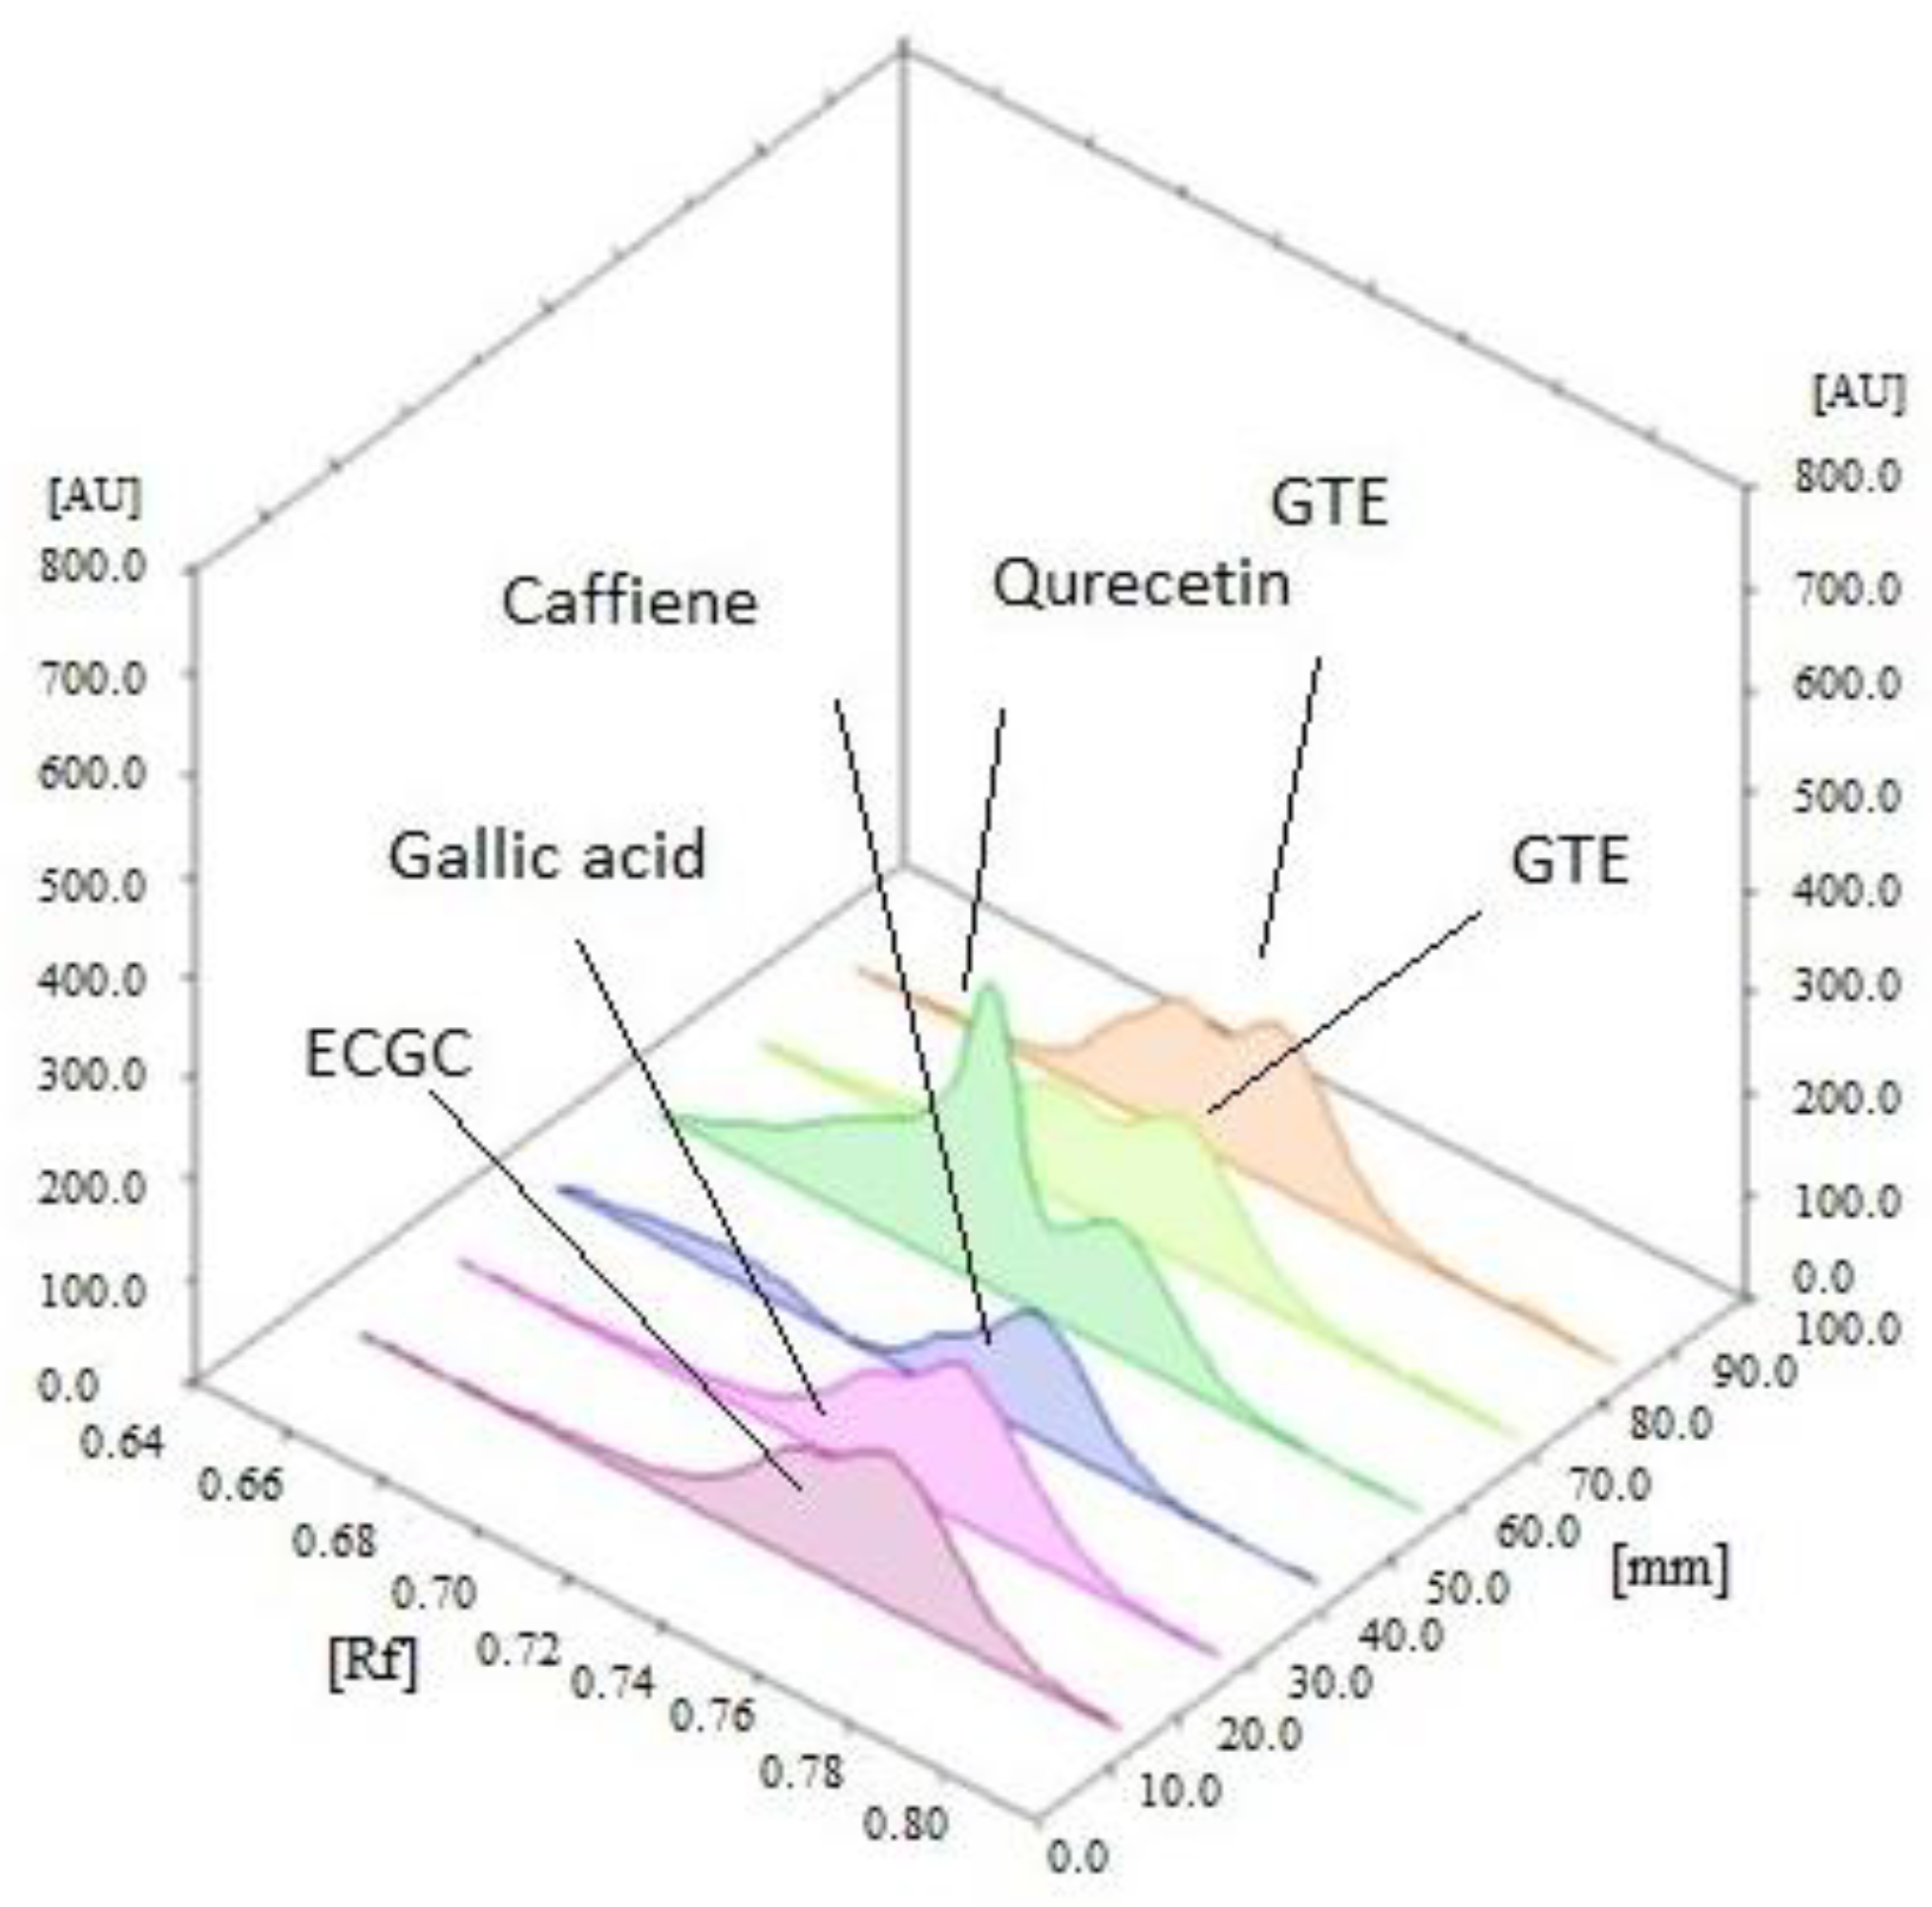
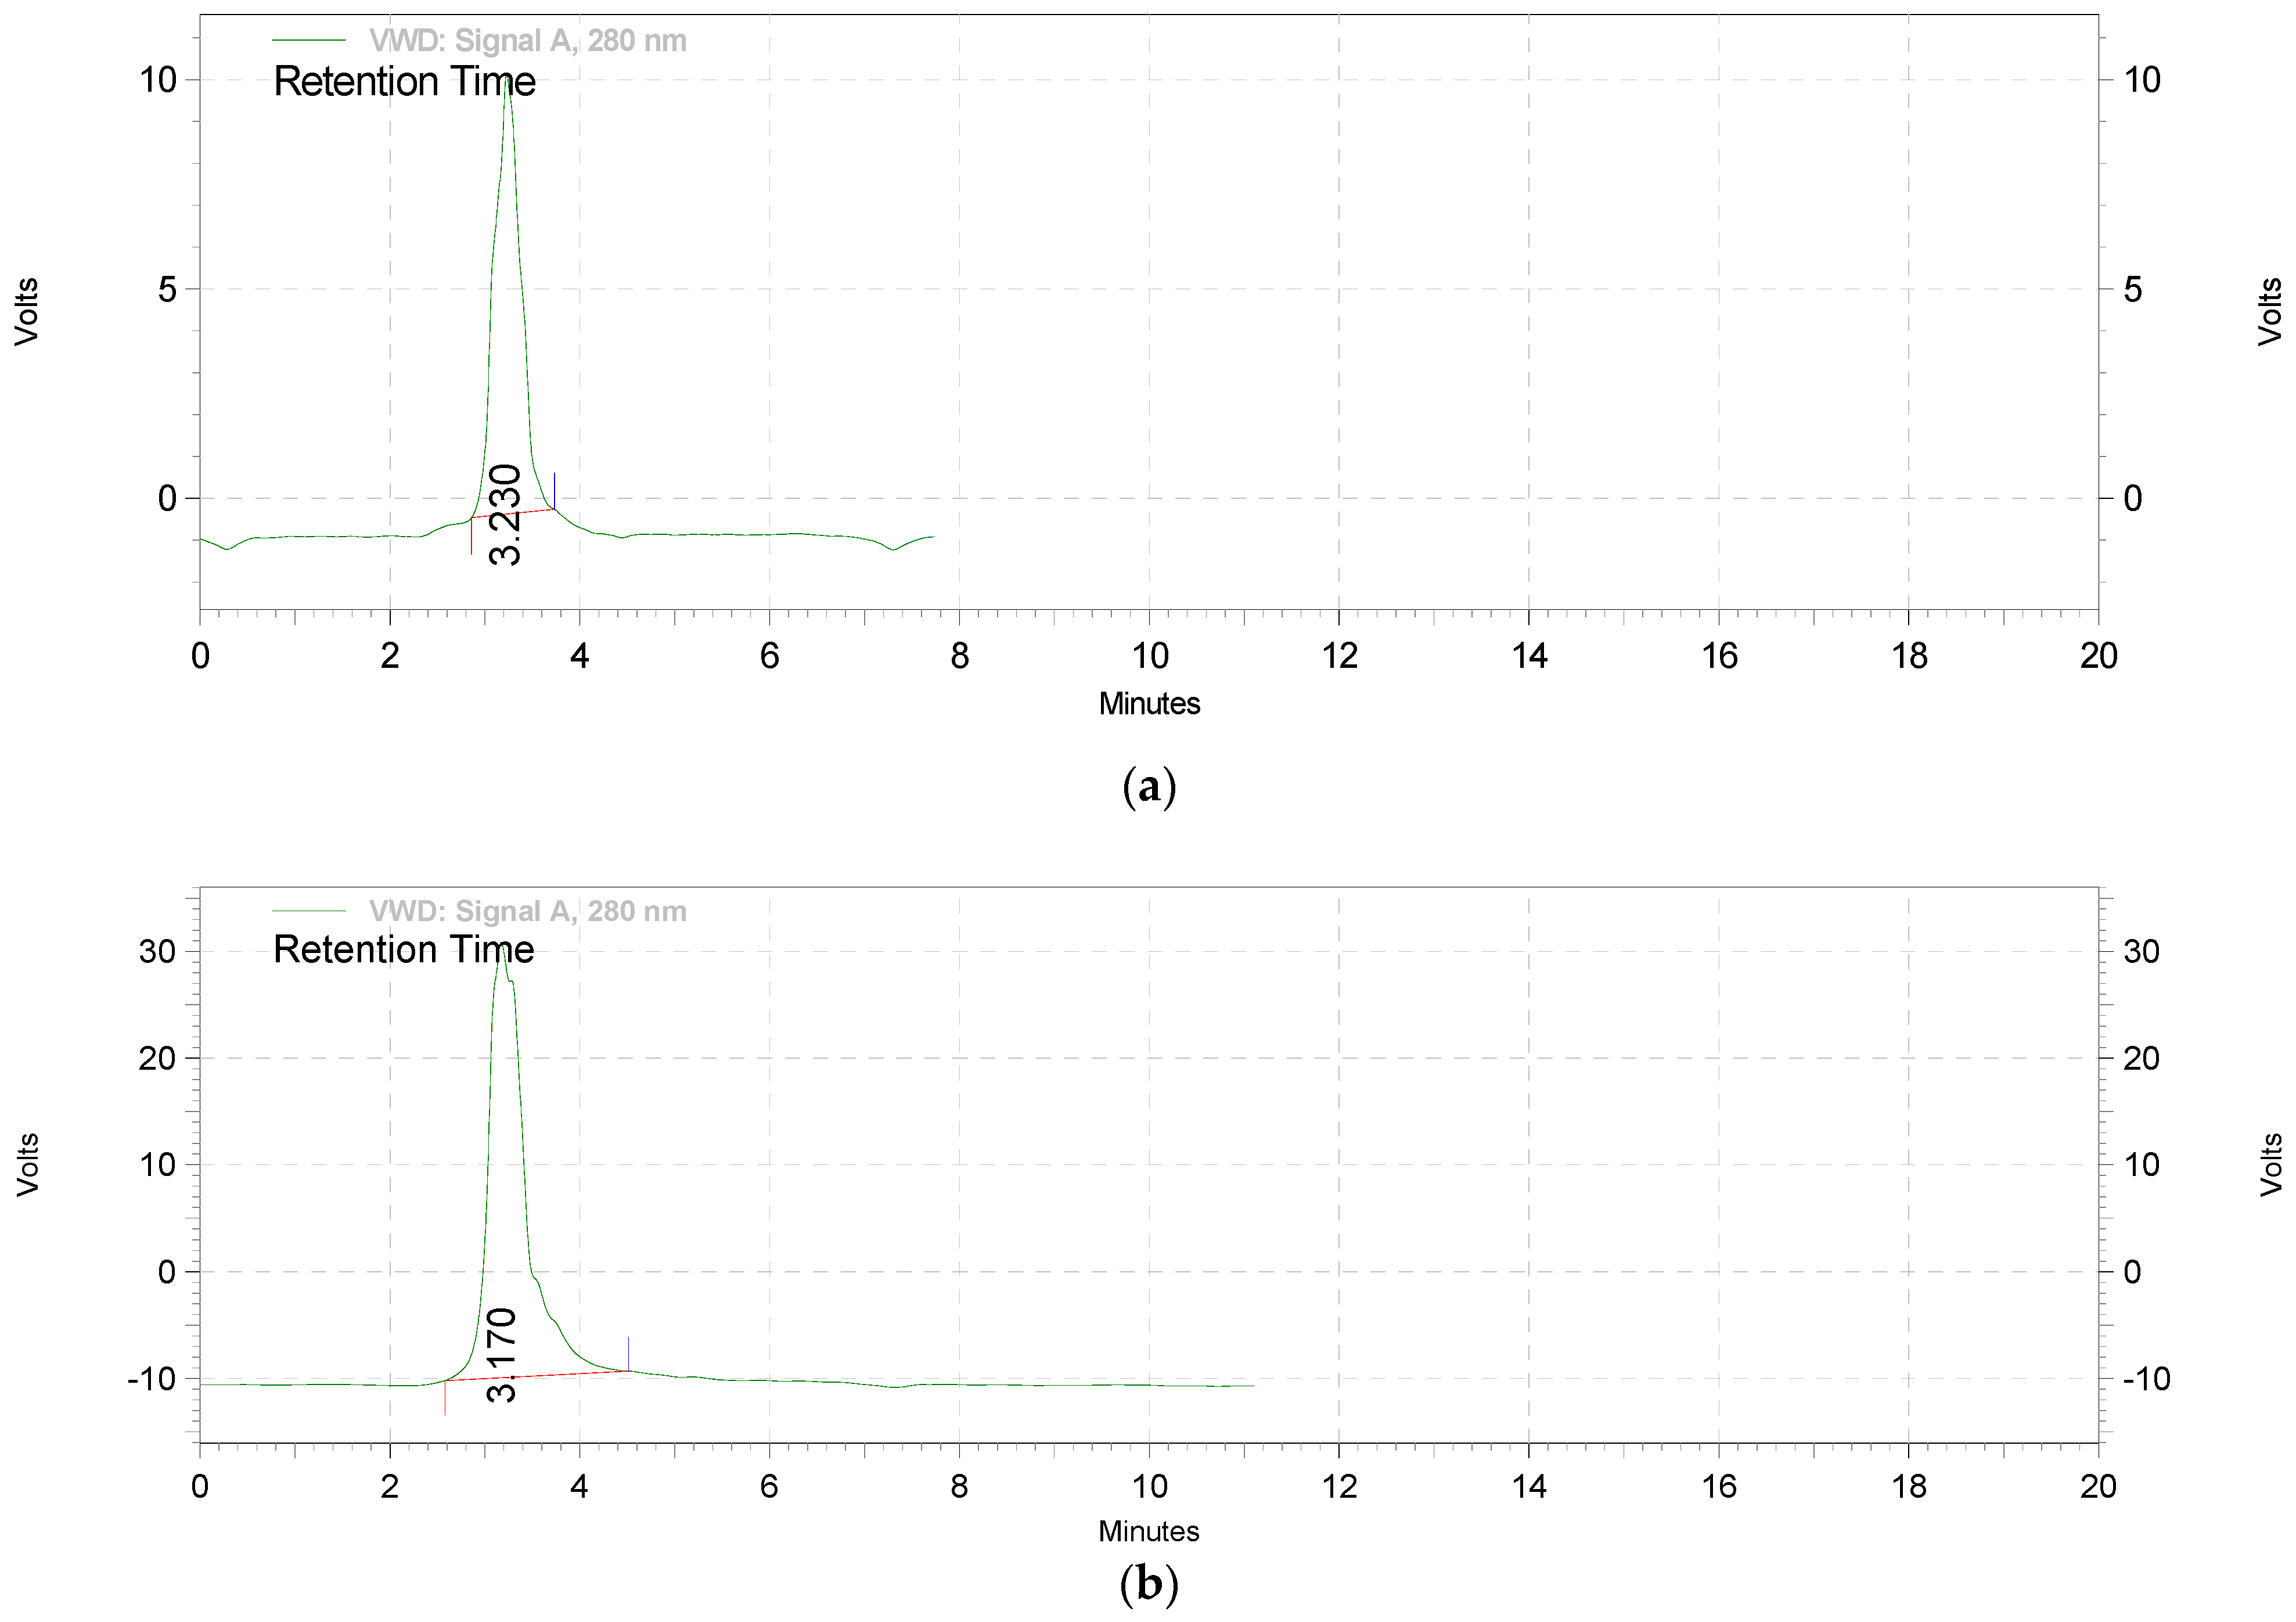
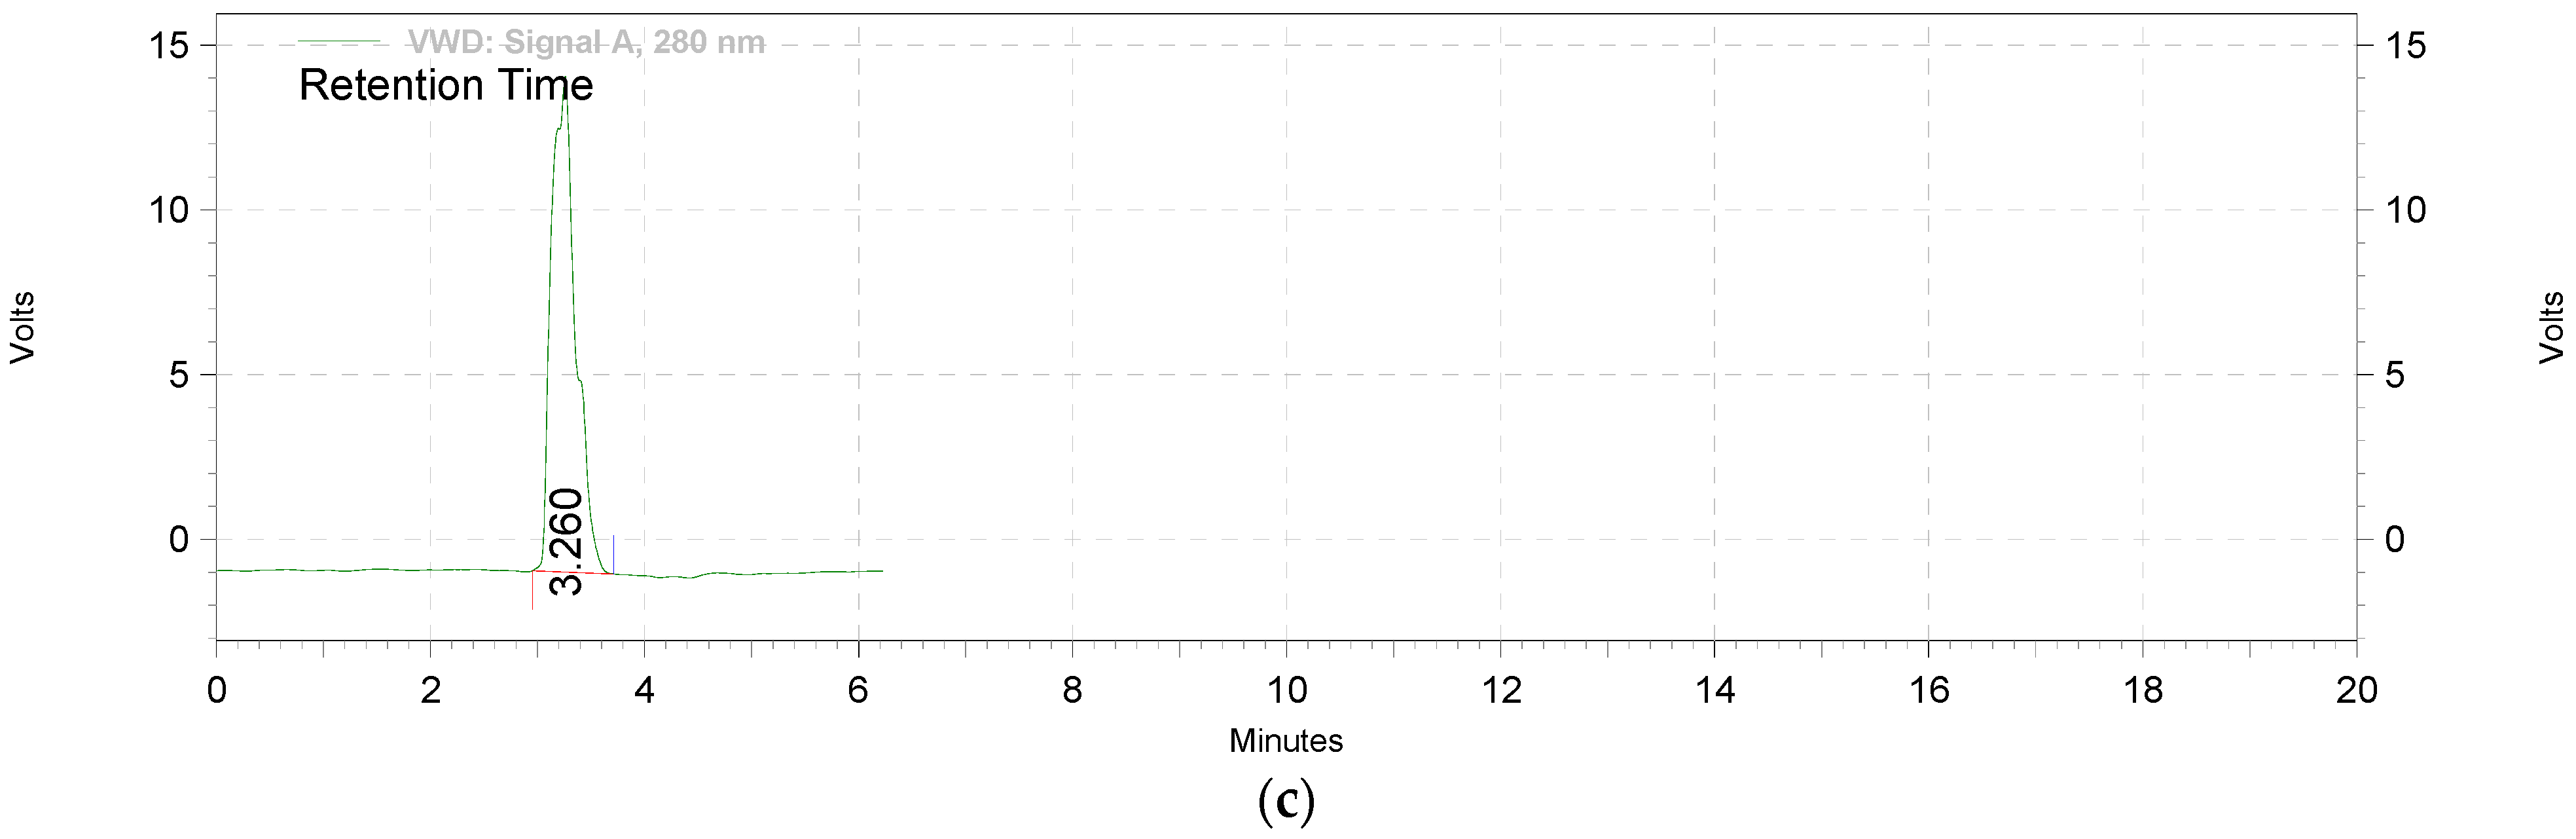
2.2.1. Extraction and Standardization of Green Tea Extract by HPTLC

Green tea leaves were first brewed in 75% ethanol for 10 min at 30 °C in a thermostat heating mantle (J B Scientific, Mumbai, India). The infusion was filtered and again brewed in 35% ethanol for another 1 h at 90 °C [24]. Finally, the infusion was dried to a powder form over a rotary vacuum evaporator in order to obtain an extract rich in polyphenols. The extract was standardized with the developed HPTLC method outlined in our previously published work [25]. The standardization of the extract was carried out with respect to the specific markers epigallocatechin gallate (EGCG), caffeine, gallic acid, and quercetin to determine the purity of the extract and confirm the presence of polyphenols, especially EGCG in GTE. The sample solution (GTE) was prepared by dissolving 50 mg of GTE in 10 mL of methanol, followed by sonication for 15 min; it was then filtered through a 0.2 µm nylon syringe filter and finally injected into an HPTLC system (Camag, Linomat 5, Model CHF 47150). All the standards (EGCG, caffeine, gallic acid, and quercetin) were used at a concentration of 1 mg/mL in methanol for carrying out the chromatographic separation.

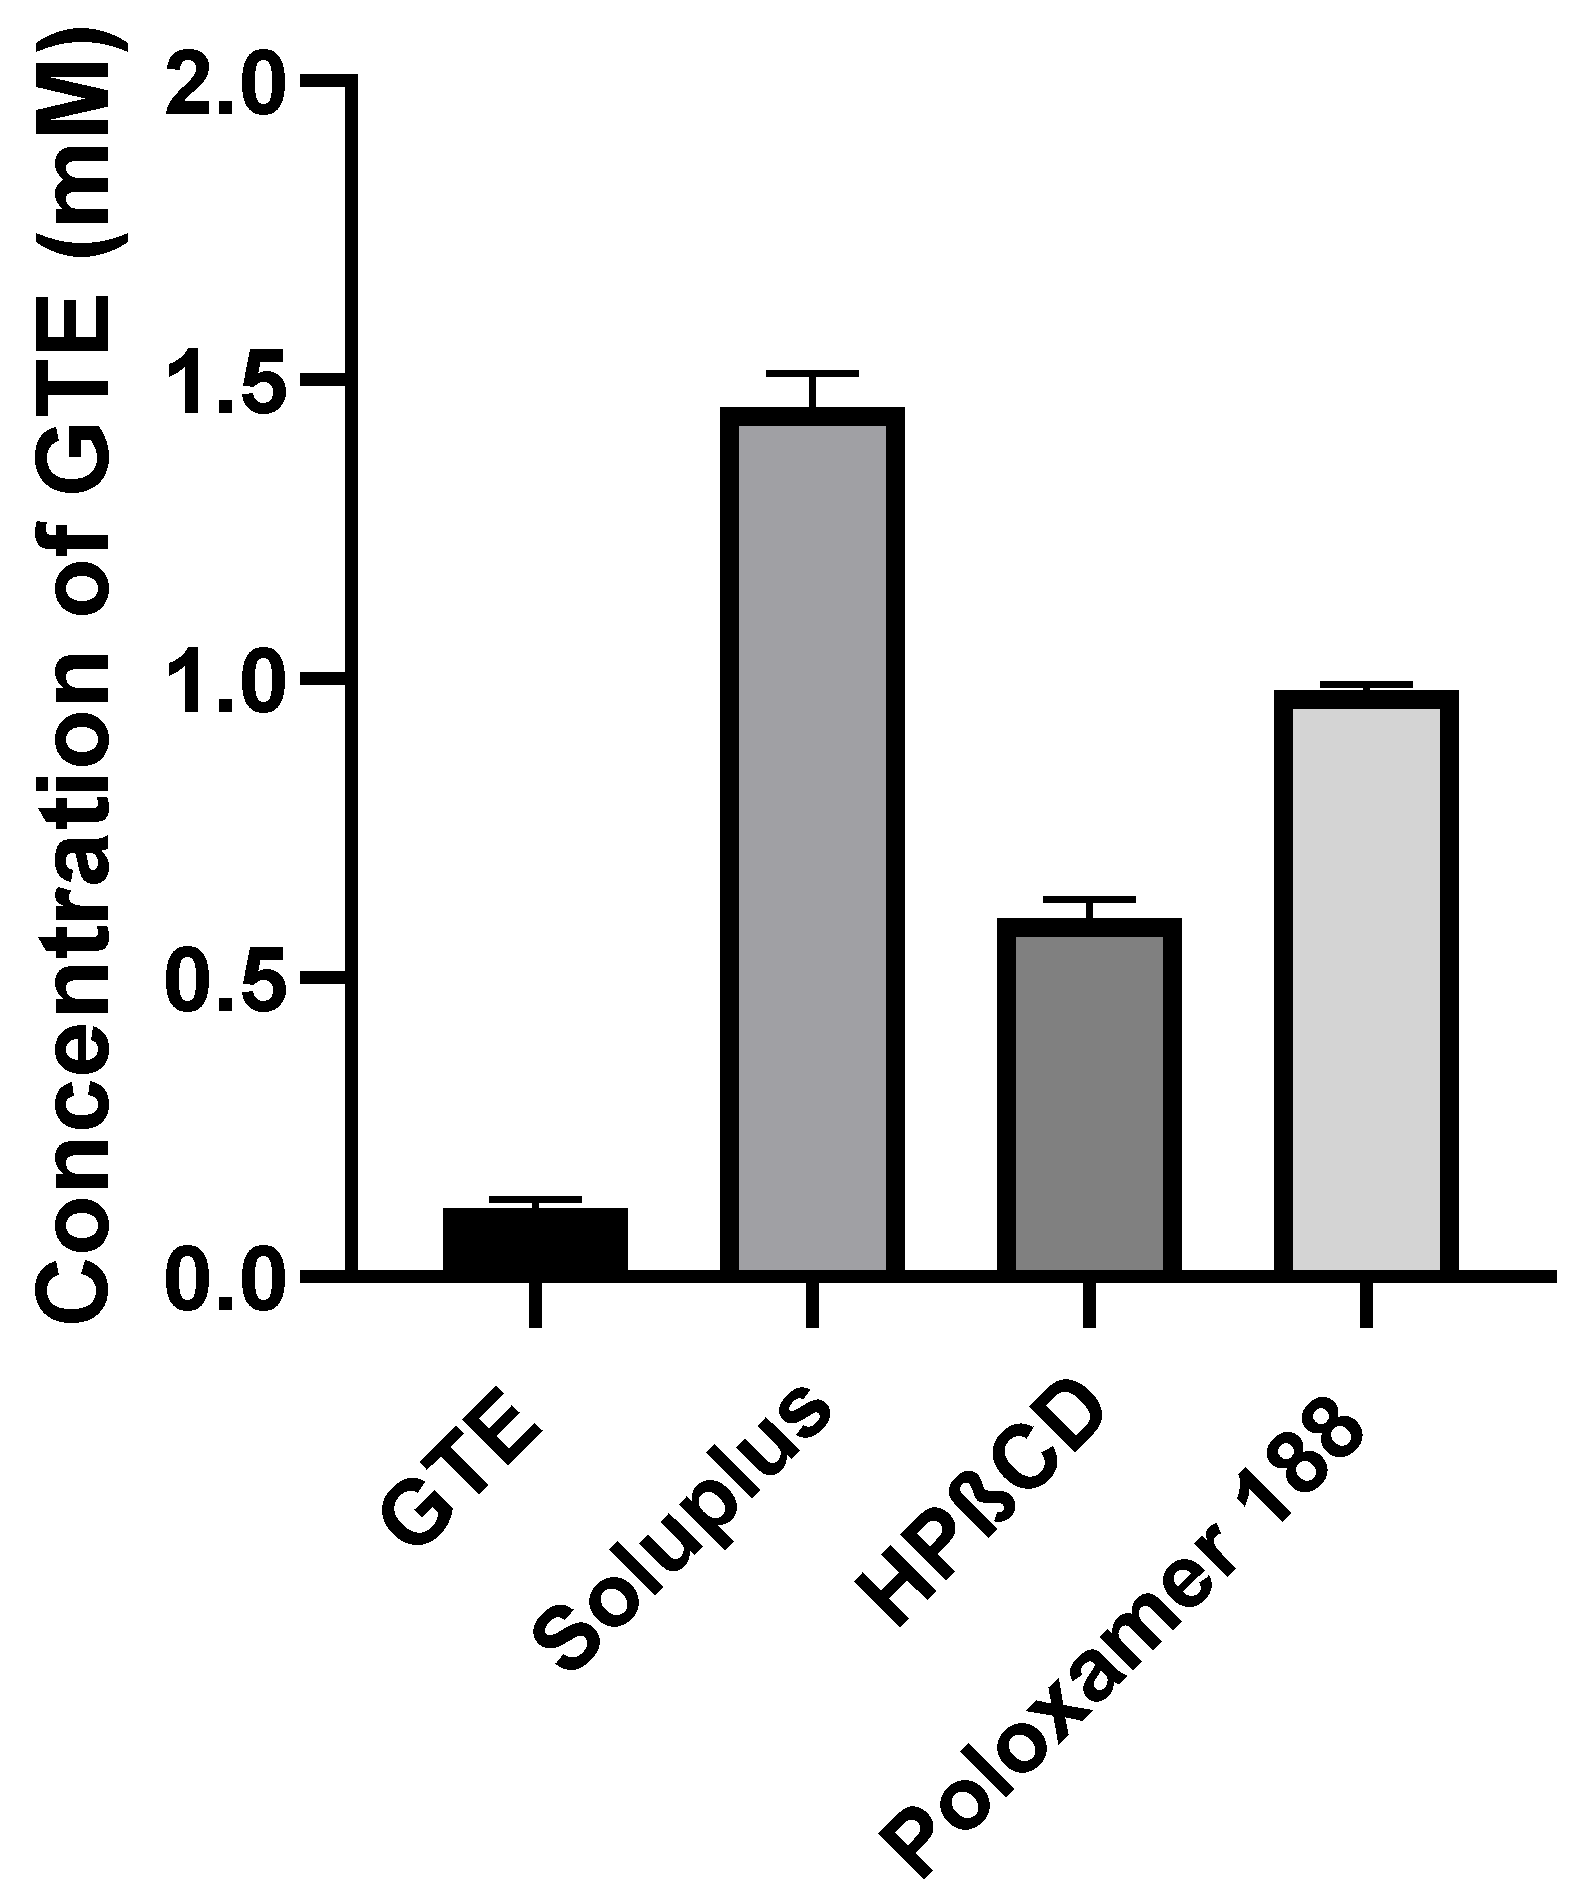
2.2.2. Phase Solubility Analysis

A phase solubility analysis of GTE in water was performed using three different polymers, namely Poloxamer 188, Soluplus®, and Hydroxy-Propyl-β-Cyclodextrin, to understand the nature of the solubility relationship between GTE and the polymers. The objective was to investigate the solubility of GTE in different polymers and select the polymer showing significant improvement in the solubility of GTE. Initially, a series of solutions (1, 2, 3, 4, and 5 mM) using different carriers, namely Poloxamer 188, Soluplus®, and Hydroxy-Propyl-β-Cyclodextrin, were prepared in water. This was followed by the addition of an excess amount of GTE to each of the carrier solutions separately. The resultant dispersions were shaken in an orbital shaker at 100 rpm (Remi, CIS-18 plus, Mumbai, India) for 24 h at 37 °C to bring them to equilibrium. The dispersions were then filtered using Whatman filter paper and suitably diluted with water, and the samples were analyzed at 274 nm using UV spectrophotometry (Shimadzu, UV 1700, Kyoto, Japan) to determine the solubility of GTE in the different carriers. The analysis was carried out in triplicate (n = 3) [26].

2.2.3. Preparation of GTE Solid Dispersion (GTE-SD)

Solid dispersions of GTE were formulated with a diverse weight proportion of GTE-Soluplus® (1:2, 1:4 1:6, 1:8, and 1:10). GTE was weighed accurately (10 mg) and dispersed in 15 mL of ethanol in a beaker. Then, this mixture was added to the melt of Soluplus® and coded as F1, F2, and F3 accordingly. The solutions were quickly cooled by placing the individual beakers in an ice bath with constant manual stirring. The obtained solid dispersion (SD) mass was air-dried, crushed, pulverized, passed through a sieve #80, and kept in the desiccator until future use [27].

2.2.4. Saturation Solubility of GTE and GTE-

An excess amount of the GTE and GTE-SD was added to 10 mL of distilled water and sonicated for 15 min. Then, the glass vials were placed into an orbital shaker for 24 h at 37 ± 0.5 °C and 100 rpm. The supernatant solutions were then passed through Whatman filter paper, suitably diluted, and analyzed by UV spectrophotometry (Shimadzu, UV 1700, Japan) at 279 nm. All the measurements were performed in triplicate to estimate the saturation solubility of GTE and GTE-SD.

2.2.5. Characterization of GTE-SD

The characterization of the GTE and GTE-SD was performed using FTIR, DSC, and XRD to investigate the compatibility of GTE with the excipients and confirm the formation of solid dispersion.

Fourier-Transform Infrared Spectroscopy

The IR absorption spectra of the GTE, Soluplus®, and its physical blend with Soluplus® and GTE-SD were verified using an FTIR spectrophotometer (Shimadzu, 8400S, Japan) across a range of 400–4000 cm−1 [28].

Differential Scanning Calorimetry Study

The thermal behavior of the pure GTE, Soluplus®, and GTE-SD were determined by using DSC (HITACHI DSC7020). Five-milligram samples were accurately weighed and placed in a sealed aluminum pan. The samples were heated at a temperature ranging from 30 to 350 °C at a scanning rate of 10 °C per minute with a flow rate of nitrogen of 20 mL/min. The reference was an empty aluminum pan [29].

X-ray Diffraction Study

The X-ray diffraction was studied for the GTE, Soluplus®, and GTE-SD using an X-ray diffractometer (make: Rigaku Model—ULTIMA IV) and Cu K 2α rays with an energy of 40 kV and a current of 40 mA. The samples were scanned at a 2θ angle from 10° to 80° [30].

Characterization of GTE-SD for Self-Micellizing Property

The particle size of GTE-SDs was determined using a particle size analyzer (Horiba, SZ 100, Kyoto, Japan), which utilizes the dynamic light scattering principle. The dispersions were dissolved in distilled water and ultrasonicated for 15 min. Further, all the measurements were carried out at a fixed angle of 90°. Each trial was conducted in triplicate [31].

Ex Vivo Permeation of GTE-SD

Everted intestine was used to determine the amount of EGCG permeating from the GTE through the intestine utilizing an in vitro continuous dissolution–absorption system design based on the method given by Dhome [32]. A fresh goat small intestine was obtained from slaughterhouse and placed in Tyrode solution of pH 6.5. The ileum section was carefully located inside the intestine. An appropriate dimension of ileum (about 5 cm) was removed, everted with a glass rod, and linked to a U-shaped device after being cleaned in fresh Tyrode solution. The ex vivo drug permeation testing of the preparation was carried out in a 1000 mL dissolution vessel containing 900 mL of pH 6.8 phosphate buffer as the dissolving media. The ex vivo U tube device was attached to this vessel comprising the same buffer and preserved at a persistent temperature of 37 ± 0.5 °C. The ex vivo permeation of different weight ratios of SDs were evaluated using this assembly. The SDs were dispersed in the dissolution medium, and after a specified interval of 15 min, the 5 mL samples were withdrawn from the side arm of the ex vivo U-shaped apparatus. After each withdrawal, an equivalent volume of buffer solution was replaced to ensure the maintenance of the sink’s condition. The amount of EGCG that permeated from the dissolving medium (the mucosal side or donor side) to the absorption compartment (the serosal side or receptor) was determined using high-performance liquid chromatography (HPLC). The analysis of EGCG that permeated from the GTE-SD was carried out using an Agilent LC1120 Compact HPLC system (Agilent LC 1120 Compact, Santa Clara, CA, USA). A Kromasil reversed-phase C18 (250 × 4.6 mm × 5 μm) column and a UV single-wavelength detector (D2) was used. The mobile phase used was methanol: potassium dihydrogen phosphate buffer at a 60:40 volume ratio (Ph = 4). The flow rate was maintained at 0.7 mL/min. The analysis of EGCG was carried out at adetection wavelength of 280 nm. The calibration curve of EGCG was performed in the concentration range of 0.5–5 µg/mL. Triplicate injections of 20 µL were subjected to chromatography under the conditions specified above for each concentration level of EGCG to obtain the calibration curve [33].
The permeability model used for the permeation studies has two compartments: donor and receptor. The apparent permeability coefficient was determined using the following equation:
P a p p = d Q d t × 1 / A C
where Papp is the apparent permeability coefficient, and dQ/dt is the amount of drug permeated per unit time and is calculated from the slope of the linear graph of the cumulative amount of drug diffused per unit area vs. time. A is the exposed area through which absorption takes place in cm2 and can be calculated using the following formula: 2 × π × internal radius of intestinal tube (cm) × height of intestinal tube (cm) (2 πrh); C is the initial concentration of the drug on the mucosal side in mg (in this case, it was 10 mg). The apparent permeability coefficient was calculated using the equation shown above. Additionally, the mean values of percent GTE that permeated from the various ratios of GTE-SD were analyzed statistically using one-way ANOVA (GraphPad prism software version (8)) and compared with the permeation of pure GTE. A p-value greater than 0.05 was considered as a criterion for indicating statistically significant distinctions.

2.2.6. The Formulation of GTE-SD Pellets

GTE-SD pellets were formulated utilizing the extrusion and spheronization method. The constitution of the pellets is shown in Table 1. For the formulation of the pellets, PVP K30 was used as a binder solution and IPA and water (2:1) were combined to dissolve it. In a mortar, the dispersion of GTE-SD was blended with all of the other excipients. To the resultant powder mixture, PVP solution was added to form a moist mass, which was then extracted into cylindrical extrudates by passing them through sieve#18. After that, the extrudates were put in a spheronizer (Shakti, SSP 120, Gujarat, India), which was equipped with a crosshatched plate (2 mm), and spheronized for 5 min at different rpms (1100, 1200, and 1300 rpm). The pellets were collected and dried in a vacuum oven for 30 min at 30 °C [34].

2.2.7. Experimental Design

The formulation optimization of the GTE-SD pellets was carried out using 32 full factorial design Design Experiment® software (version 11; Stat-Ease, Inc., Minneapolis, MN, USA 2018), which involved two variables examined at three different levels. The first variable, denoted as X1, represented the GTE-SD ratio, with ratios of 1:4, 1:6, and 1:8. The second variable, X2, referred to the spheronization speed, which was set to1100, 1200, and 1300 rpm. A total of nine formulations were suggested by the Design expert software, as shown in Table 2, and their effects on the percent drug release after 150 min (Y1), percent ex vivo permeation after 150 min (Y2), and geometric mean diameter (Y3) of the pellets were evaluated. To analyze the data from the nine trial runs, ANOVA and multilinear regression analysis were used. Parameters like model F-value and p-value were used to evaluate the significance of the model. Contour plots and 3D surface response plots were created using this software to explore the impact of the independent variables on the responses.

2.2.8. Characterization of GTE-SD Pellets

Scanning Electron Microscopy

The external surface morphology of the optimized pellet formulation was studied using scanning electron microscopy (Nova nano SEM NPEP 303, Waltham, MA, USA). In order to make the samples electrically conductive, a 20 nm layer of platinum was applied to them. After that, in the FESEM chamber, the coated specimens were randomly scanned at a 5.00 KV acceleration voltage. The photomicrographs were taken at various magnifications [35].

Micromeritic Properties

All the batches of the pellet formulations from A1 to A9were assessed for micrometric properties like bulk density, tapped density, Carr’s compressibility index, and angle of repose as per standard procedures described in USP [36].

Drug Content

The drug content of the pellets was assessed using HPLC analysis. The pellets were ground into a powder in a mortar pestle. After being thoroughly pulverized, powder samples equivalent to 100 mg of GTE were transferred to 100 mL of distilled water and ultrasonicated for 15 min. The samples were analyzed using the HPLC method as described in the section Ex Vivo Permeation of GTE-SD. The experiment was carried out in triplicate, and the EGCG content was determined using a calibration curve that had already been created [37].

In Vitro Dissolution Study

To carry out the in vitro dissolution experiments, a USP apparatus I (basket assembly) was utilized. A capsule was filled with a precisely weighed sample equal to 100 mg of GTE-SD and placed in the dissolving vessel basket filled with 900 mL of dissolution medium, kept at a persistent temperature of 37 ± 0.5 °C, and rotated at 100 rpm. To preserve the sink’s condition, five-milliliter samples were removed at specified intervals of 15, 30, 45, 60, 75, 90, 105, 120, 135, and 150 min and then immediately substituted with the fresh dissolving medium. The Whatman filter paper was then used to filter the samples. The amount of EGCG released was quantified using the previously described HPLC method. The dissolution tests were carried out in triplicate [38].

Ex Vivo Permeability Study

The ex vivo permeability of the GTE-SD pellets was analyzed using the same procedure described in the section Ex Vivo Permeation of GTE-SD. AU-shaped tube was used for study. The amount of permeated EGCG was then determined using HPLC analysis [39].

In Vivo Study

To evaluate the in vivo efficacy of the GTE-SD pellets for anti-hyperlipidemic activity, 15–16-week-old rats weighing 300–400 gm were employed in the investigation. The animals were procured from Crystal Life Sciences Pune and were kept at a temperature of 25 ± 2 °C and 40% relative humidity. The animals were kept in typical light/dark conditions and fed a conventional pellet diet. They had unrestricted access to food and liquids. The investigational procedure was approved by the Institutional Animal Ethical Committee as per protocol number DYPIPSR/IAEC/Feb/22-23/P-37 and undertaken in accordance with the Guidelines for the Use and Care of Experimental Animals published by the Indian National Science Academy. The animals were put into five groups at random (Group I to V) (6 rats in each group).
Once the study was initiated, Group I (the control group) was given regular food and unlimited water. A high-fat diet (casein 12%, maize starch 42.96%, soybean oil 25%, cholesterol 1%, choline 0.04%, salt mixture 5%, vitamin mixture 1%, and cellulose 13%) was given to Group II (the negative control group). Group III (the marketed group) received a high-fat diet without restriction for 15 days, followed by another 15 days of liquid atorvastatin (10 mg once day in distilled water) solution administration. Group IV (test group I) received a GT solution (0.5 mL) once daily for an additional 15 days, at a dose of 100 mg/kg/day, along with a high-fat diet at their discretion. Group V (test group II) received the optimized formulation A3 solution (0.5 mL) once daily for an additional 15 days, at a dose of 100 mg/kg/day, along with a high-fat diet at their discretion. Blood samples from all the animal groups were obtained from the retro-orbital sinuses at the end of the study period and analyzed for cholesterol, high-density lipoproteins (HDLs), low density lipoproteins (LDLs), serum triglycerides, and very-low-density lipoproteins (VLDLs) [40,41,42]. All the animals were then anesthetized using diethyl ether anesthesia. The animals were then humanely sacrificed by using a CO2 chamber after the collection of the blood samples.

2.2.9. Statistical Analysis for In Vivo Studies

Utilizing the GraphPad Prism (Version 8.0.2 (263)) software, statistical analysis was performed. The average and standard deviation of the mean were used to express the experimental results. One-way analysis of variance (ANOVA) was adapted to analyze the data with Dunnett’s multiple comparison test, and p < 0.001 was used to determine statistical significance.

3. Results and Discussion

3.1. The Extraction and Standardization of Green Tea Extract

The maximum resolution for all the standards was achieved with the mobile phase toluene: acetone: formic acid (9:9:2). The Rf values were 0.77 for EGCG, 0.76 for gallic acid, 0.75 for caffeine, and 0.74 for quercetin. The overlapping of the UV absorption spectra of EGCG, caffeine, gallic acid, and quercetin with that of the test sample indicated the presence of these biomarkers in the GTE, thereby confirming the standardization of the extract (Figure 1). The test sample peaks matched the standard sample peak, as shown in Figure 2 for all tracks scanned with a CAMAG TLC scanner 3 at 274 nm. Ethanol was used in the extraction of EGCG as ethanol exerts a protective role on catechins by preventing their epimerization and protecting them from undergoing oxidation during the extraction process. Ethanol is reported to avoid the association reaction between the catechins that occurs during their extraction process by destroying the hydrogen bonds, thereby favoring the enhanced extraction of GTE catechins [43].

3.2. Phase Solubility Analysis

The phase solubility of the GTE was analyzed in distilled water. It was observed that when increasing the concentration of different carriers, viz., Soluplus®, Poloxamer 188,and Hydroxy Propyl-β-Cyclodextrin (HPβCD) within the range of 1 to 5 mmol, the solubility of the GTE was also discovered to be rising in all the carriers, as shown in Figure 3. As compared to all the other carriers, there was a significant increase in the solubility of the GTE using Soluplus®. At a concentration of 5 mM of Soluplus®, the solubility of the GTE was found to be 1.473 mM, whereas the solubility of the GTE was found to be 0.113 mM. Thus, 13.03 times higher GTE solubility was found with Soluplus®. The reason for this could be the amphiphilic characteristics of Soluplus and the presence of a large number of hydroxyl groups, making it water-soluble. It forms micelles at lower concentrations with a CMC value of 0.0007% (w/v) at 37 °C, which contributes to the formation of stable micelles. The lower HLB value of Soluplus as compared to Poloxamer 188 makes it more prone to forming stable micelles, thereby improving the apparent solubility of GTE. The same findings were reported by Naharros-Molinero et al. [44].

3.3. Formulation and Evaluation of GTE-SDs

The phase solubility analysis revealed that Soluplus® is a suitable carrier for the formation of SD. GTE-SDs were prepared with Soluplus® using the melt method with weight proportions of 1:2, 1:4, 1:6, 1:8, and 1:10. Here, these weight ratios were used due to the high molecular weight of Soluplus®.

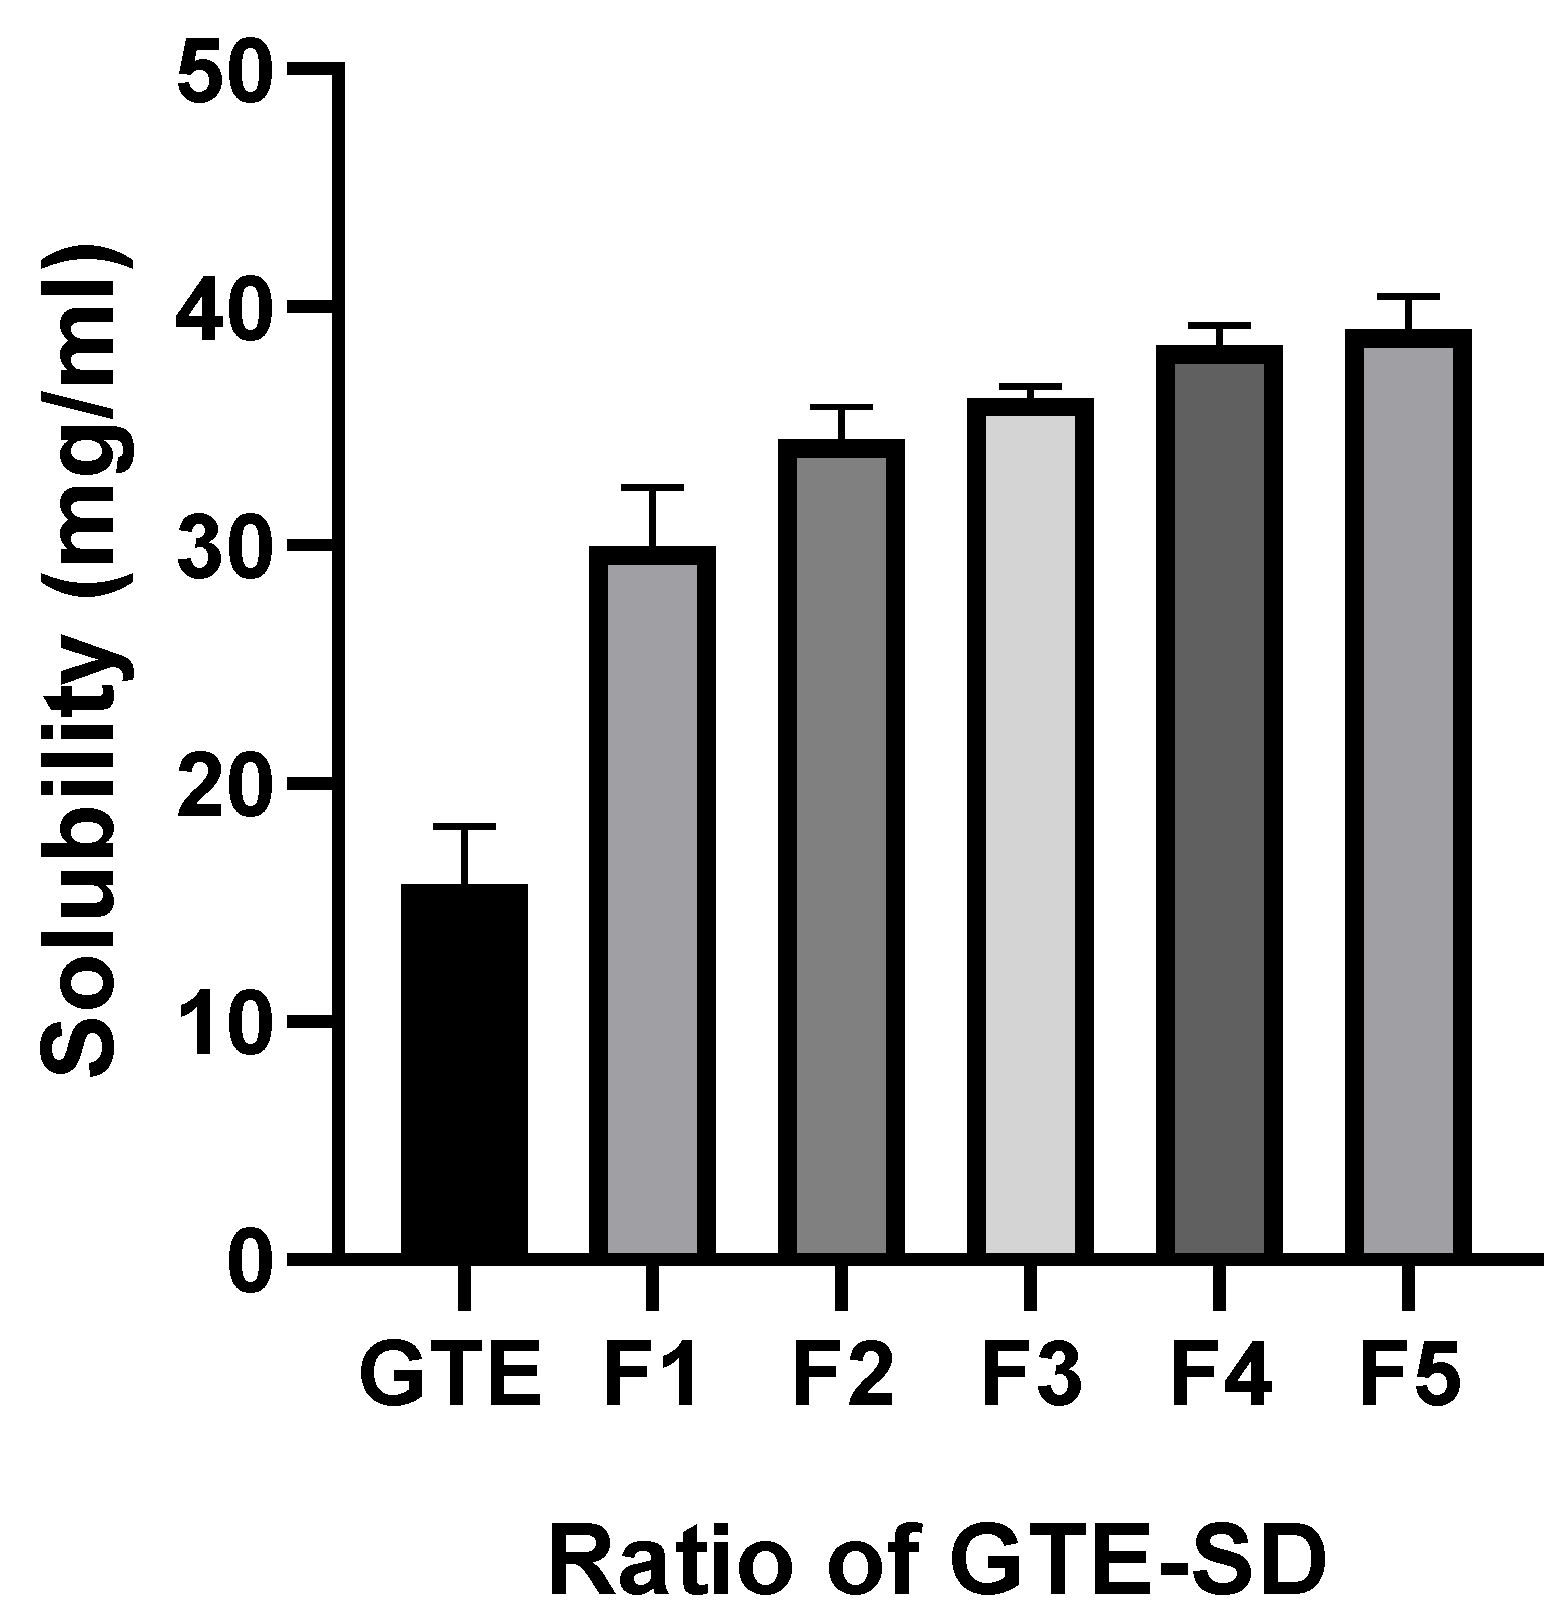
3.3.1. Saturation Solubility

The saturation solubility of GTE and various ratios of GTE-SD were determined in water (Figure 4). The GTE-SD with a 1:6 ratio showed a significant increase (p < 0.001) in the solubility of GTE (36.2 mg/mL) as compared to the pure GTE (15.75 mg/mL). As the ratio of GTE-SD increased, the solubility of GTE also increased considerably. This might be due to an increase in micelle production with an increase in the GTE-SD ratio. Although GTE is basically hydrophilic in nature, it also contains essential oils and other hydrophobic substances, which add on to the total composition of GTE. Micelles can serve as transporters for hydrophilic substances. The hydrophilic substances exist close to the micelle’s outer shell and can easily interact with the water molecules while being held in place by the micellar structure, thereby further improving the solubility of GTE.

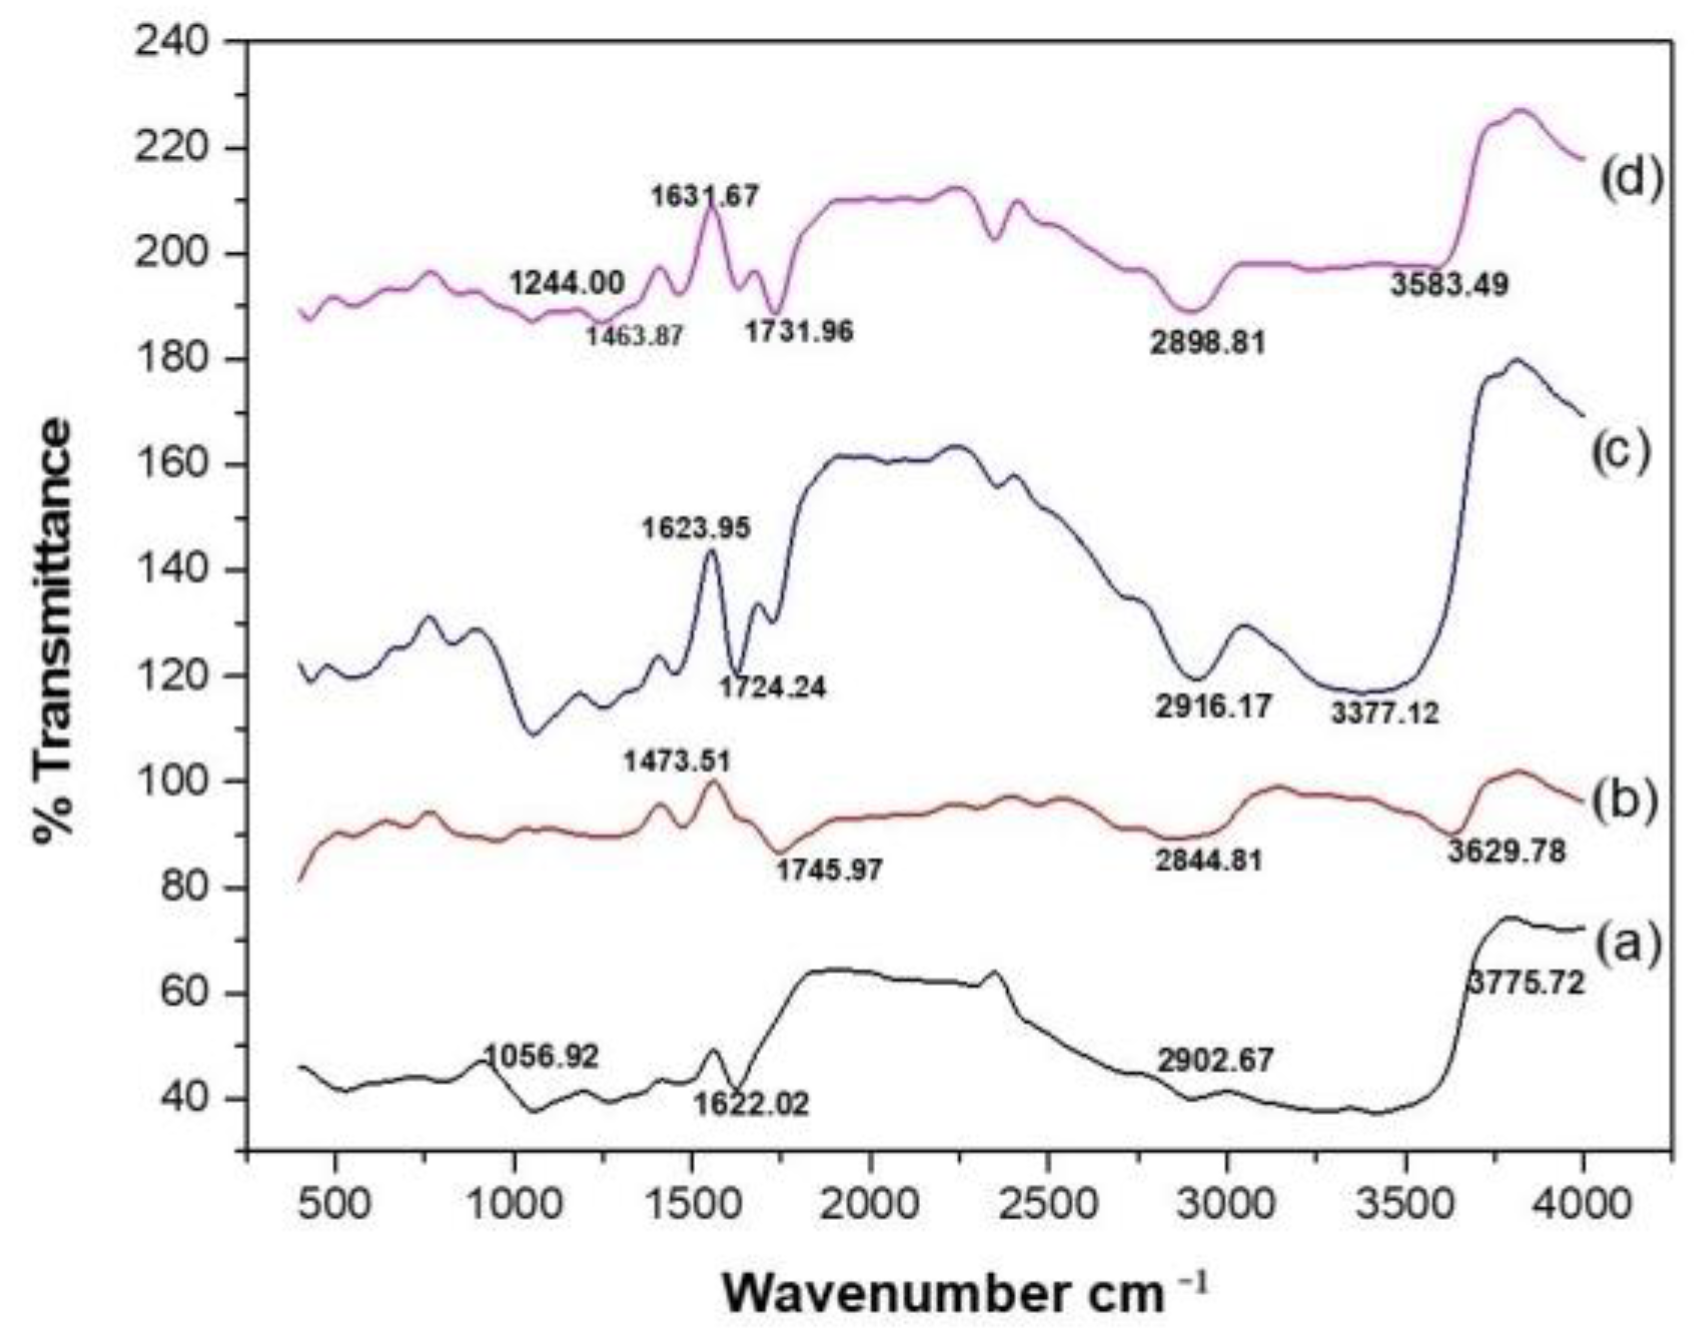
3.3.2. Fourier-Transform Infrared Spectroscopy

The IR spectrum of GTE, Soluplus®, the physical mixture of GTE and Soluplus®, and GTE-SD is shown in Figure 5. The IR spectrum of GTE in Figure 5a extract exhibits a peak at 3775.72 cm−1, indicating the presence of OH groups of alcohol, phenols, and N–H stretching in amines. The C–H stretching in alkanes appears at 2902.67 cm−1. The presence of a sharp peak at 1622.02 cm−1 demonstrates the existence of the C=O group of aryl ketone. One band at 1056.92 cm−1 indicates the presence of a C–O stretch of the ester group. The IR spectrum of Soluplus® in Figure 5b shows a broad peak at 3629.78 cm−1 (OH stretch). Major absorption peaks at 2844.81 cm−1 indicate bands due to aromatic C–H stretching [45]. The peak at 1745.97 cm−1 indicates the existence of ester carbonyl stretching. A peak at 1473.51 cm−1 is observed due to C–O–C stretching. The IR spectrum of the physical mixture of GTE and Soluplus® shown in Figure 5c is characterized by the presence of major absorption peaks at 2916.17 cm−1 due to C–Hstretching. The peaks at 1623.95 cm−1 and 1724.24 cm−1 show the occurrence of C=O stretching and C=O ester carbonyl stretching, respectively. The peak at 3377.12 cm−1 indicates the occurrence of an OH group. The IR spectrum of the physical mixture of GTE and Soluplus® demonstrates the existence of both components; the entire IR spectrum suggests that there isno chemical interface between them. The IR spectrum of the solid dispersion in Figure 5d exhibits peaks at 3583.49 cm−1 due to the OH group, and a sharp peak at 1731.96 cm−1 is observable in the spectrum, indicating the existence of an ester carbonyl group; the peak at 1631.67 cm−1 shows C=O stretching, and peaks at 1244.00 cm−1 and 1463.87 cm−1 indicate the existence of (C–O) and (C=C). The peak at 3583.49 cm−1 corresponding to the OH group appears consistently in the entire spectrum but was slightly shifted and became broader due to the formation of hydrogen bonding. The presence of a carbonyl (C=O) and alkane (C–H) group in GTE enables the formation of hydrogen bonds with the hydroxyl group of Soluplus® during the formation of solid dispersion, causing a reduction in the intensity of the carbonyl group in the formulation [46]. However, no additional peak was observed in GTE-SD, indicating an absence of any chemical interaction between the GTE and polymer. The IR spectrum of the solid dispersion shows the presence of broad and reduced peaks as compared to the sharp peak observed for the GTE and Soluplus®.

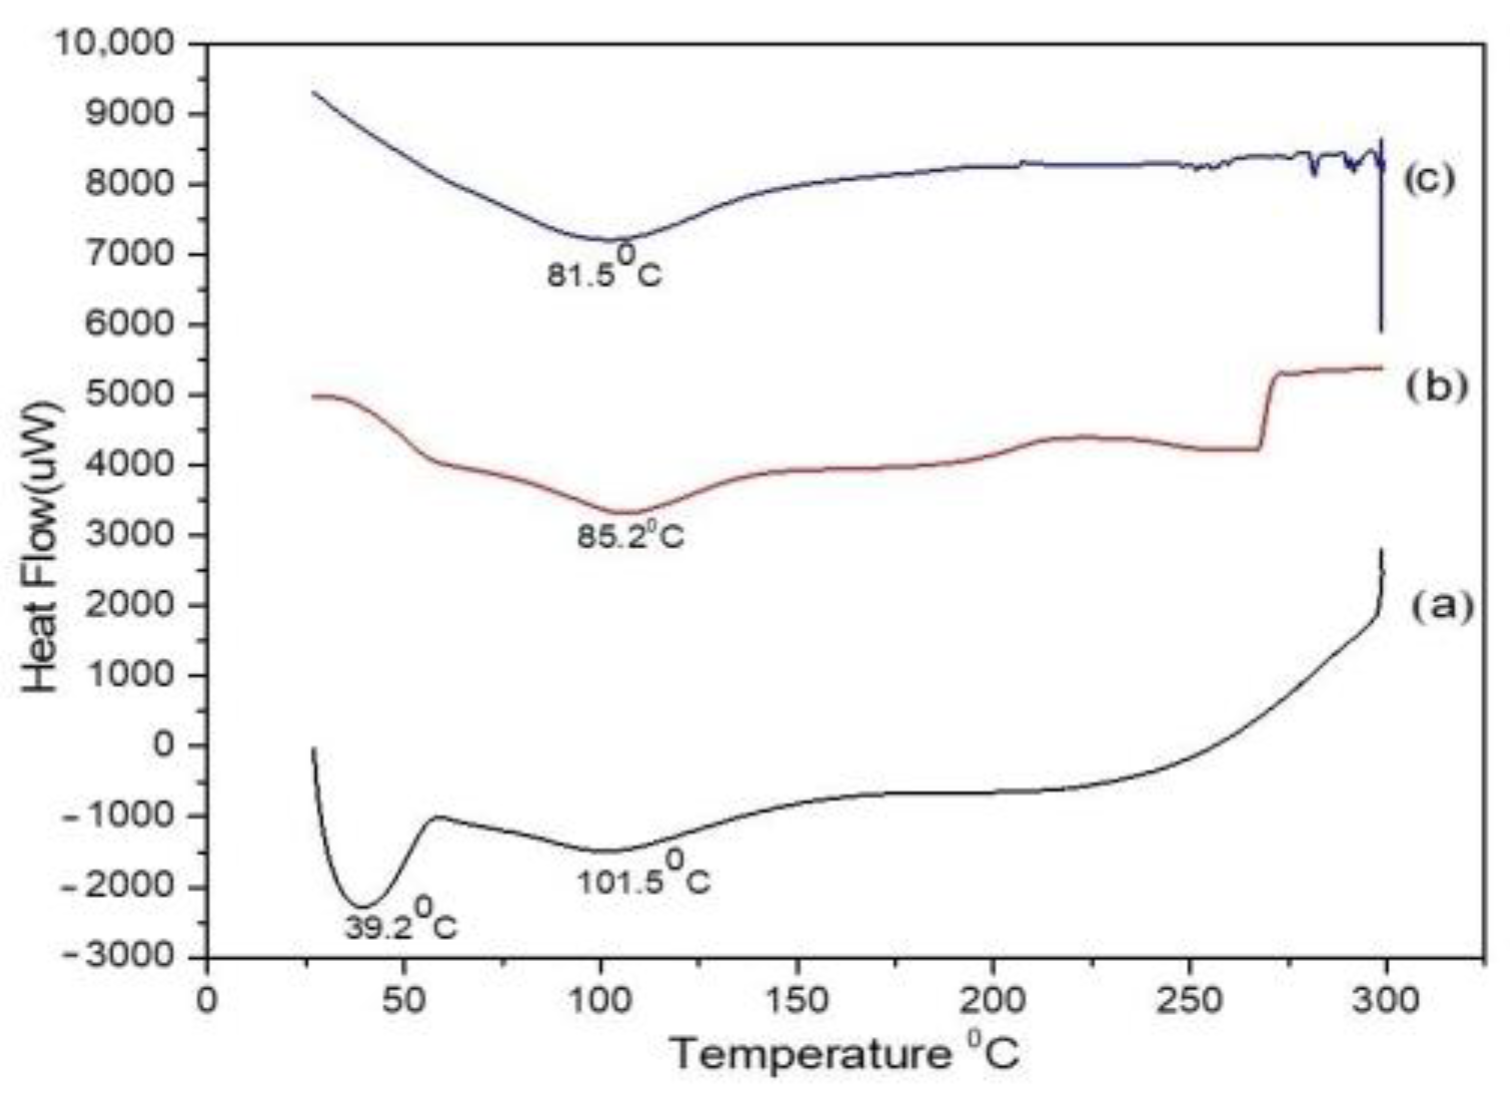
3.3.3. Differential Scanning Calorimetry

The DSC thermogram of GTE, Soluplus®, and GTE-SD is shown in Figure 6. GTE exhibits a broad peak at 101.5 °C, indicating its amorphous nature, and the peak observed at 39.2 °C is due to a loss of moisture from the GTE. The DSC thermogram of Soluplus® demonstrates a broad endothermic peak at 85.2 °C, representing its amorphous nature. The DSC thermogram of GTE-SD displays only one broad endotherm at 81.5 °C corresponding to Soluplus®, and the absence of a peak for the GTE indicates the uniform molecular dispersion of the GTE in the carrier (Soluplus®). The results from the DSC analysis signify that GTE was dispersed within the polymer matrix and did not exist as distinct drug crystals, confirming the formation of solid dispersion.

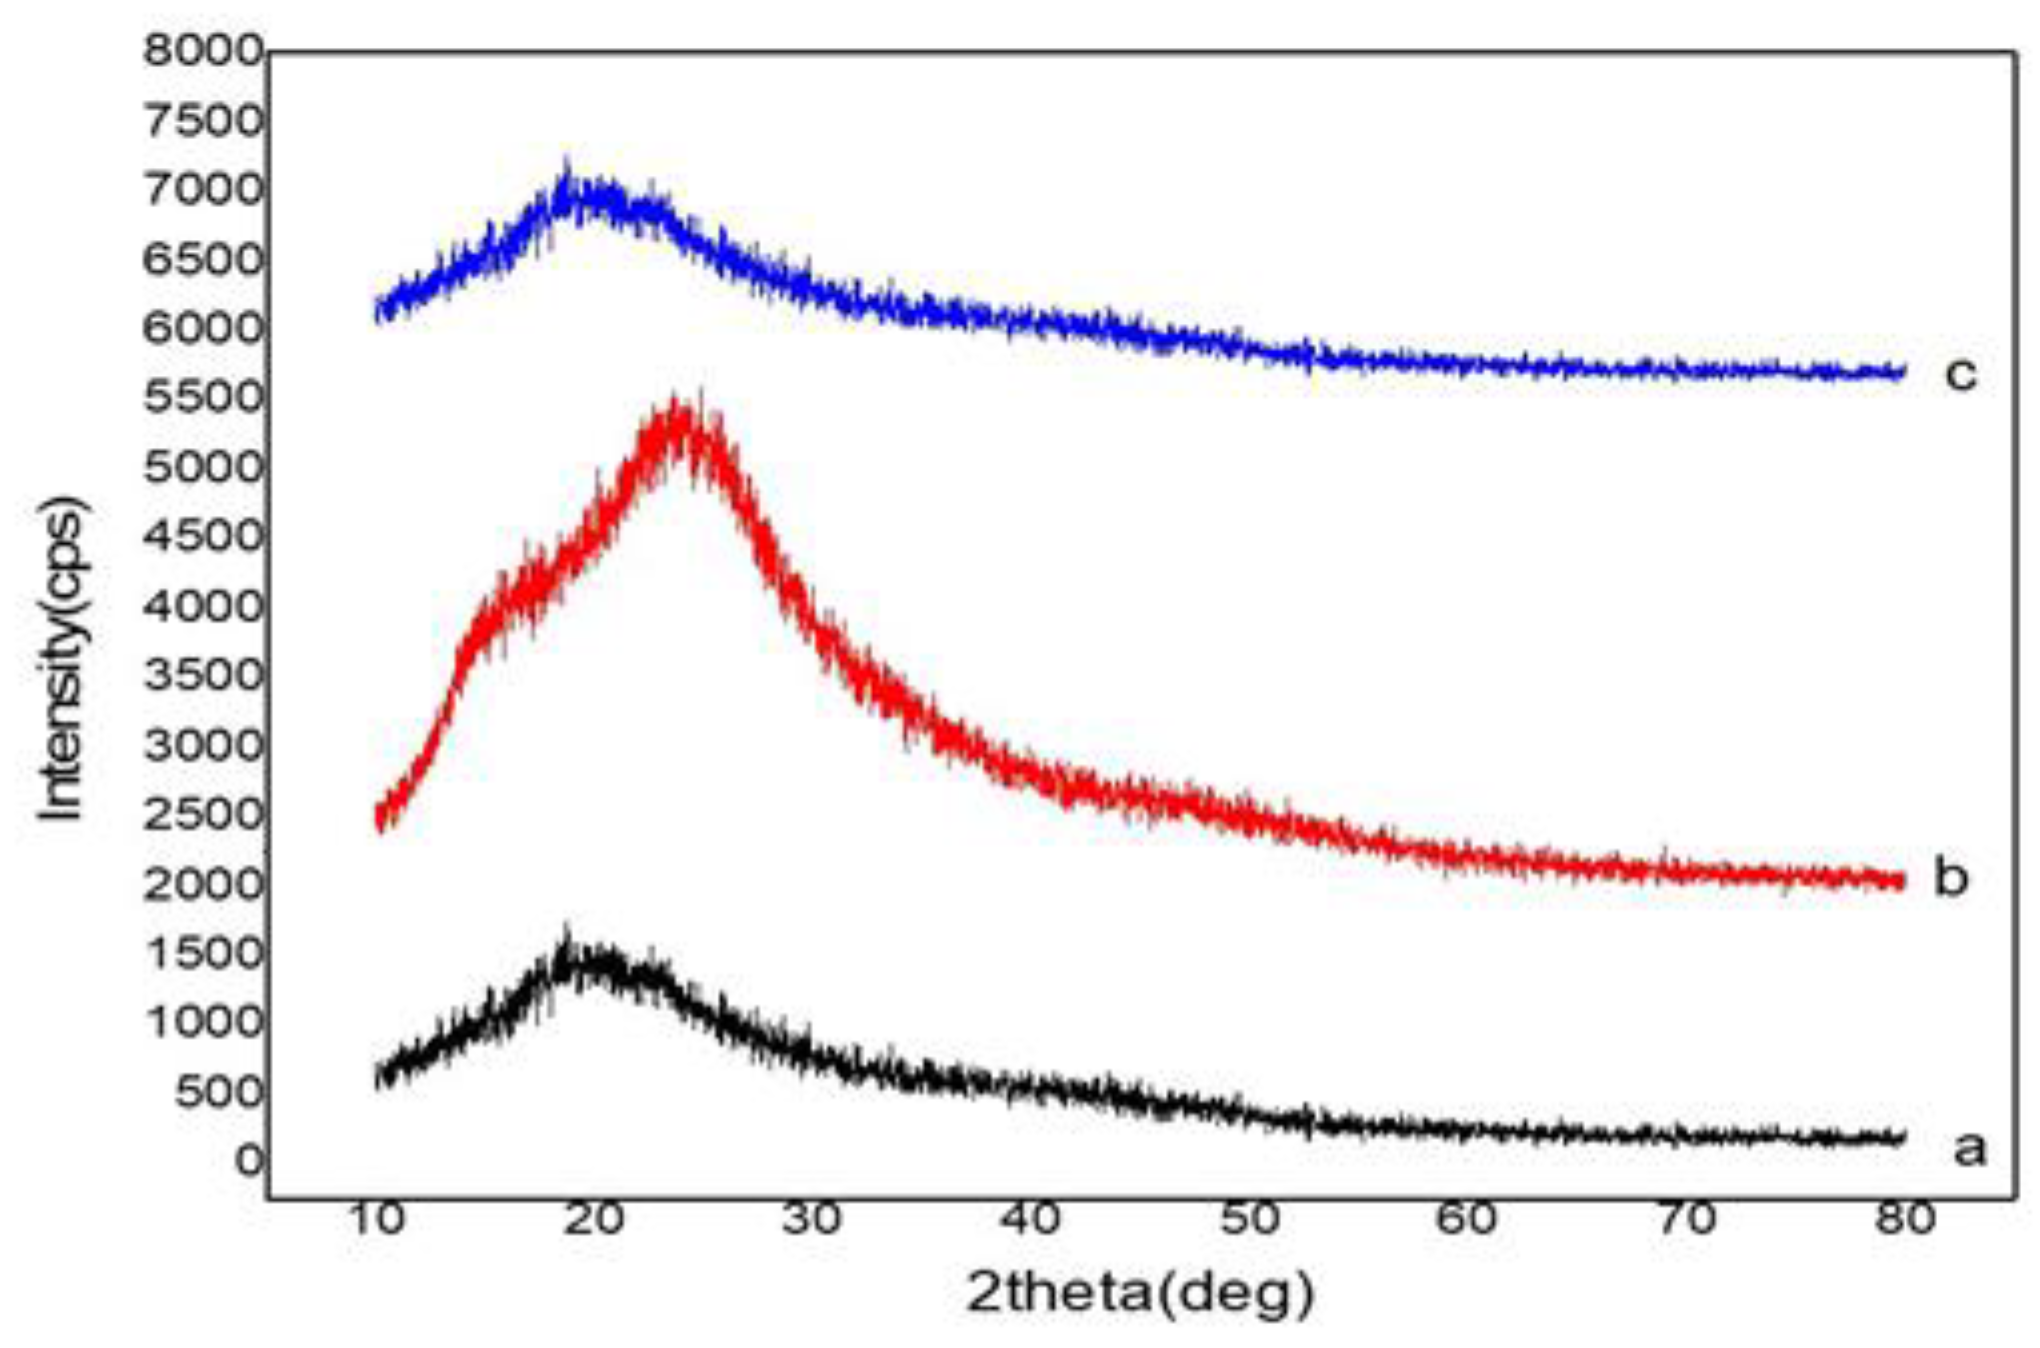
3.3.4. X-ray Diffraction

The X-ray diffraction pattern of GTE, Soluplus®, and GTE-SD is displayed in Figure 7. GTE exhibits broad principal peaks at 19.630, 24.0780, and 21.880, 2(θ), indicating its amorphous nature. The diffractogram of Soluplus® also displays broad peaks at 17.720, 18.600, and 19.160° 2(θ), which represents the amorphous nature of Soluplus®. The XRD pattern of GTE-SD exhibits an amorphous nature as in the diffractogram, broad peaks can beobserved, indicating the amorphous nature of the GTE-SD. The peaks in the GTE-SD can be observed at 12.500, 16.4000, 19.9800, 23.760, and 25.6002(θ). No extra peaks were observed in the XRD pattern of GTE-SD. Generally, in solid dispersions, a drug is dispersed in a polymer matrix, and the interaction between the drug and the polymer can lead to changes in its crystallinity. The amorphous form of GTE-SD in the XRD spectrum indicated the dispersion of GTE in Soluplus®, confirming the formation of SD.

3.3.5. Characterization of the Self-Micellizing Property and Drug Content of GTE-SD

Soluplus® consists of polyvinyl caprolactam, polyvinyl acetate, and polyethylene glycol. Its backbone is made of PEG 6000 and one or two of its side chains are made of vinyl acetate copolymers with vinyl caprolactam. It is amphiphilic in nature and is a polymeric solubilizer. Owing to its dual functionality, it has the ability to function as both a matrix polymer and a solubilizer for poorly soluble drugs in aqueous conditions by forming micelles [47]. The critical micelle concentration (CMC) of Soluplus® was determined to be 0.0007% (w/v) at 37 °C [48]. Once the formulation of SD was dispersed in water, aparticle size distribution analysis was performed to confirm the creation of micelles by Soluplus®. The solid dispersion formulation displayed mean micelle sizes between 198.0 nm and 403.5 nm and a PDI between 0.548 and 4.425. The drug content of all the SD formulations is shown in Table 3.

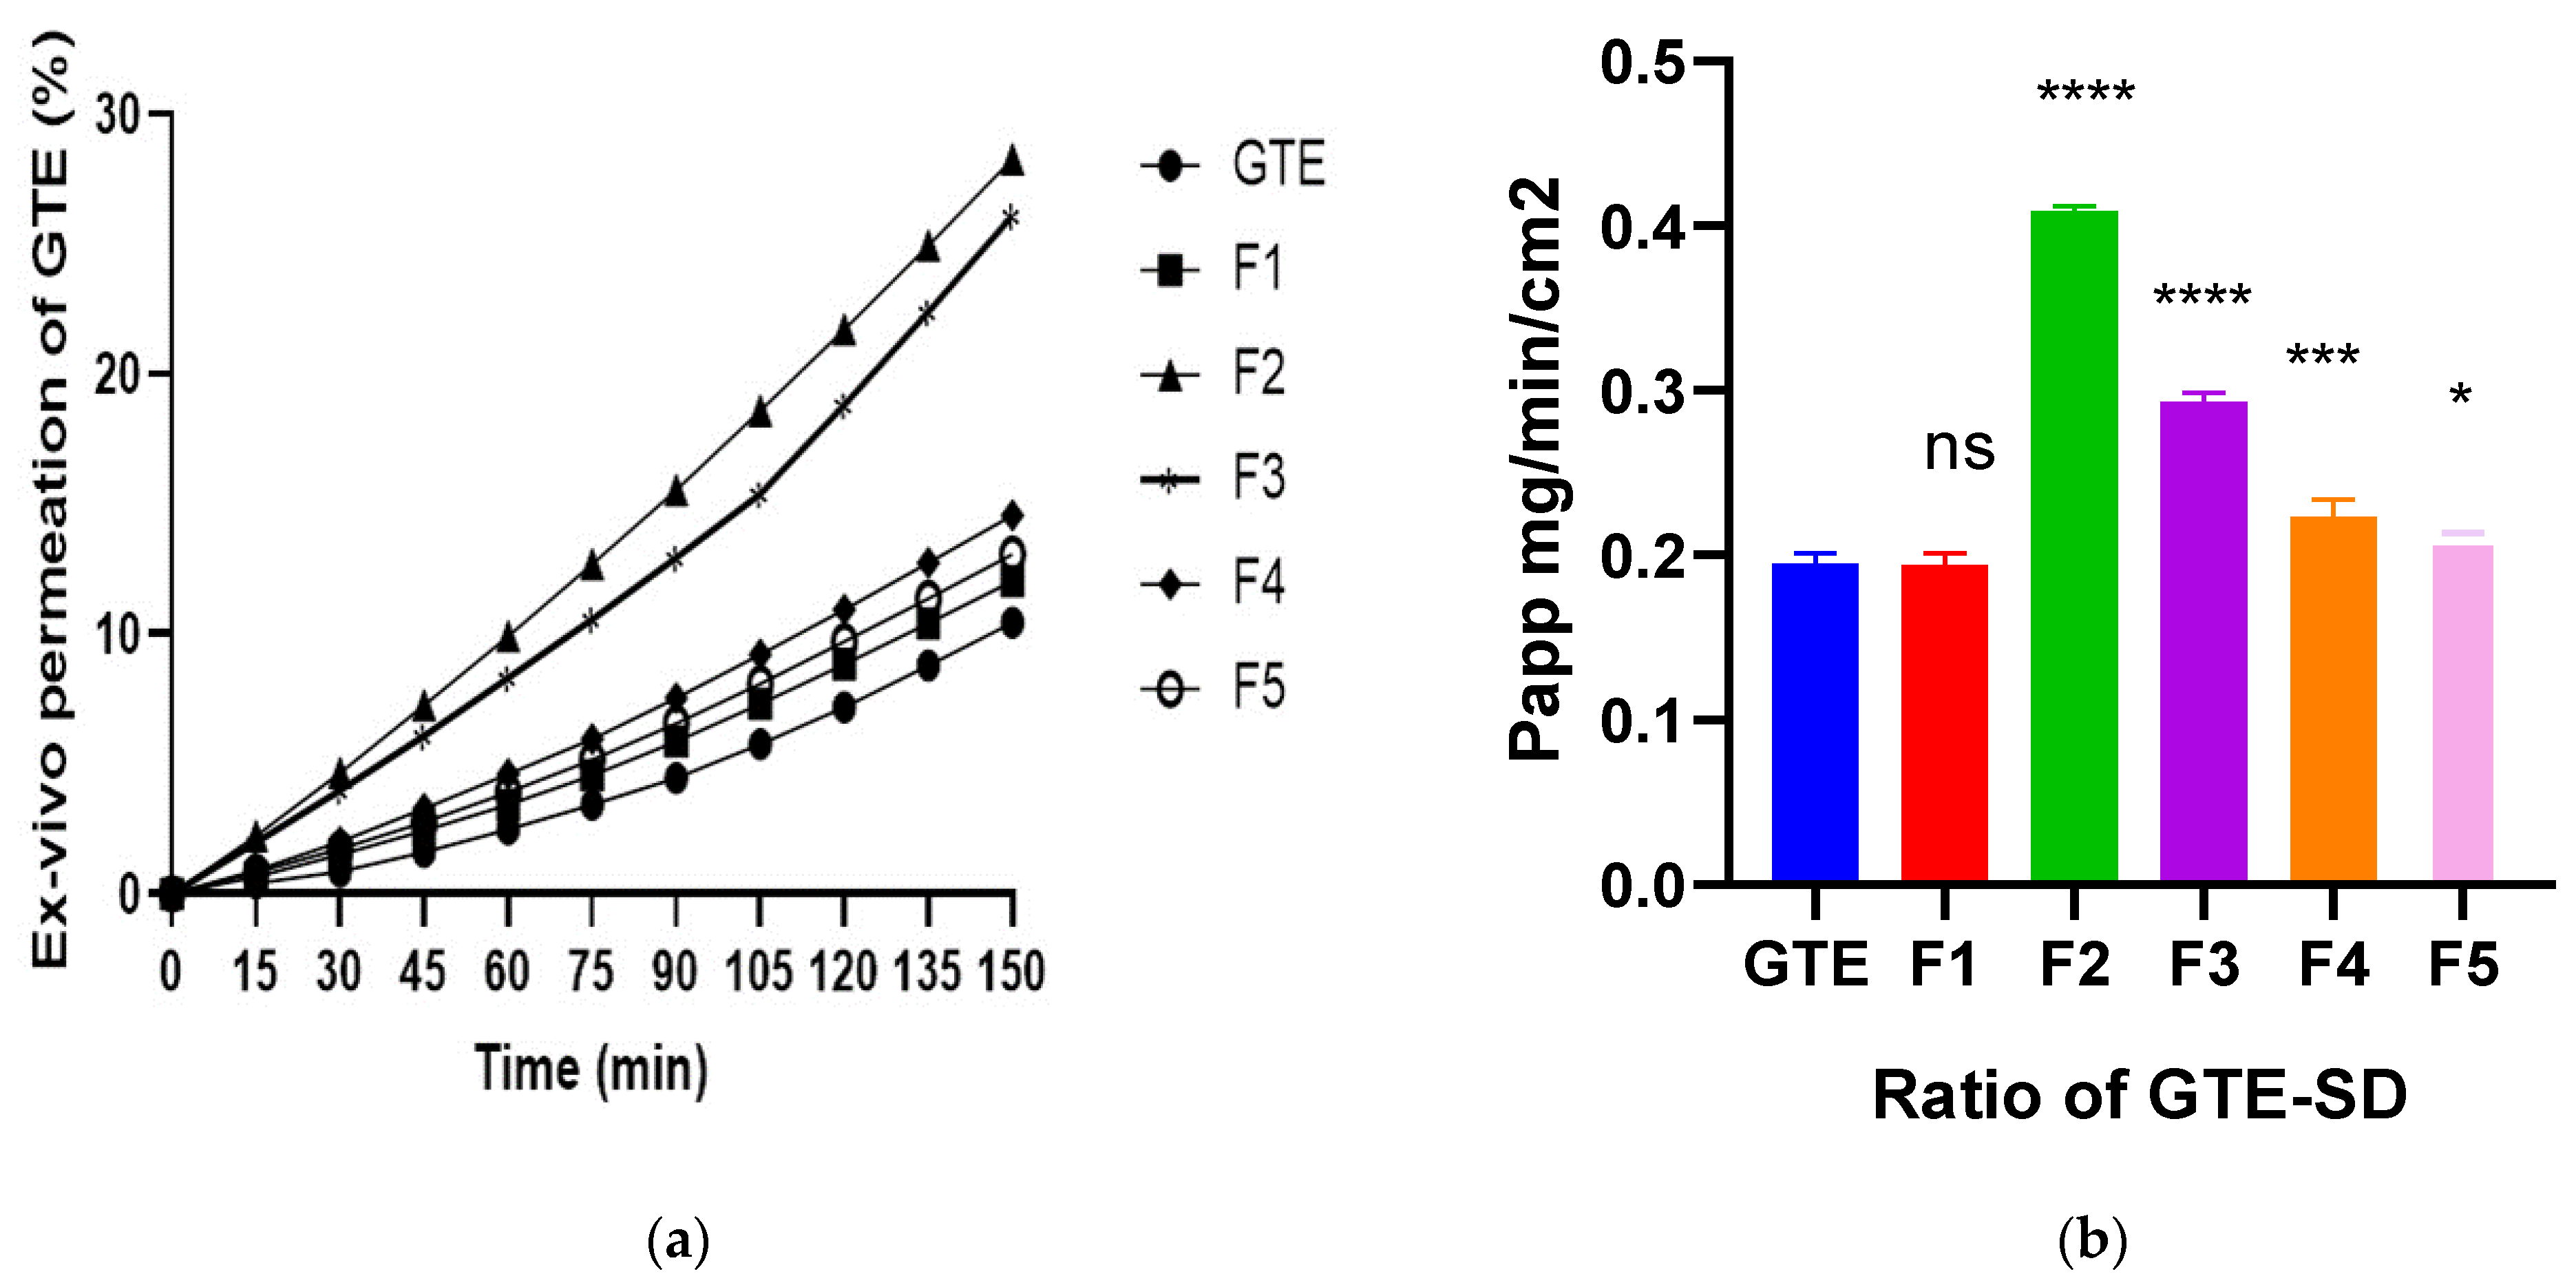
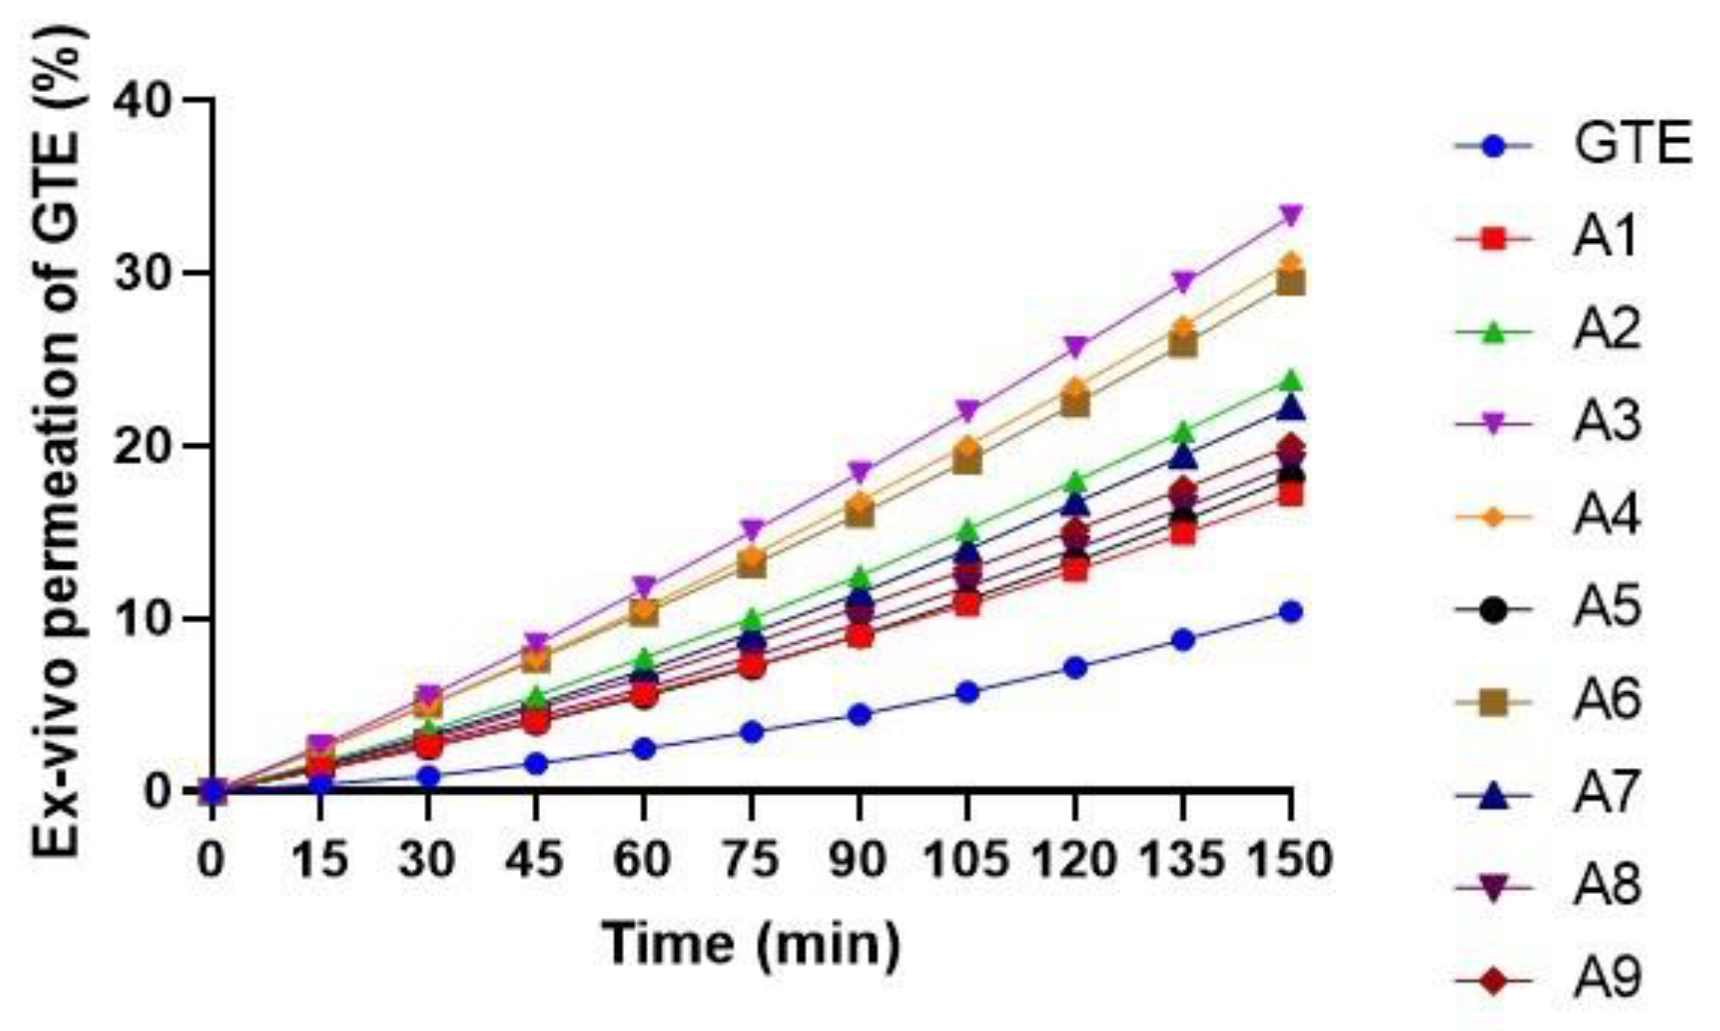
3.3.6. Ex Vivo Permeation of EGCG from GTE-SD

The ex vivo permeation of EGCG was carried out using HPLC analysis. The HPLC chromatogram displayed a sharp peak for ECGC at an average retention time of 3.23 min. The peak for EGCG in GTE and GTE-SD was displayed at the same retention time (3.17 min) and 3.26 min, respectively, thereby confirming its presence in the extract (Figure 8). The permeation of EGCG from GTE was found to be 10.43%. In the case of F1 (1:2), the permeation of EGCG was 12.03% and found to increase with the increase in the ratio of GTE-SD, as observed in F2 and F3 given in Figure 9. In the case of F2 and F3, the rate of permeation of ECGC was found to increase by 28.26% and 26.09%, respectively. The reason for this could be due to the formation of smaller micelles; this is because as the concentration of Soluplus® increased in the GTE-SD, the added molecules of Soluplus® might have become adsorbed onto the surface of existing micelles, thereby reducing their size by providing steric stabilization. Also, the smaller the size of the micelles, the higher their surface area, which allows more surface for more direct contact with the surrounding medium. This might have made it easier for the molecules of EGCG to permeate, thereby resulting in a higher permeation of EGCG. On the other hand, when the concentration of Soluplus® was increased further in F4 and F5, the permeation of EGCG was found to decrease. In the case of F4 and F5, the permeation of EGCG was 14.57% and 13.07%, respectively. The reason for this could be the formation of micelles with a large particle size; the addition of excess polymer might have resulted in the formation of larger aggregates. The larger micelles which formed in turn might have provided a smaller surface-area-to-volume ratio, thereby creating a large barrier for the diffusion of EGCG-encapsulated micelles, thus resulting in its lower permeation. Also, with the increase in the concentration of the polymer, an increase in the viscosity of the solution was observed, which additionally might have contributed to the lower permeation of EGCG. Hence, from the ex vivo permeation studies, it was clear that GTE-SD in the ratio of 1:4, 1:6, and 1:8 exhibited the permeation of EGCG due to the effect of micelle formation. Additionally, the apparent permeability coefficient of pure GTE and the various ratios of GTE-SD was also calculated using Equation (1). The results are shown in Figure 9a. The results obtained for Papp were analyzed using one-way ANOVA followed by Sidak’s multiple comparisons test, which also emphasized that the permeation of F2, F3, and F4 was statistically significant ((p < 0.0001), (p < 0.0001), (<0.001), respectively), as compared to the pure GTE.
From the results of ex- vivo permeation studies and apparent permeability coefficient, the solid dispersion ratios of 1:4, 1:6, and 1:8 were chosen for the formulation of GTE solid dispersion-loaded pellets using a 32 full factorial design.

3.4. Characterization of GTE-SD Pellets

By using the extrusion spheronization procedure, GTE-SD pellets were formulated. The size and shape of the pellets were optimized during preliminary testing. Very large, asymmetrical pellets were produced below 1100 rpm, while very fine pellets were produced above 1300 rpm. Therefore, based on preliminary investigations, the formulation of the pellets was carried out at 1100, 1200, and 1300 rpm. The effect of independent variables on the responses is given in Table 4. The micrometric properties of all the pellet formulations were evaluated, such as bulk density, tapped density, Hausner’s ratio, Carr’s index, and angle of repose. The micromeritic properties and drug content of all the batches were also evaluated and the results obtained for all these properties are given in Table 5.

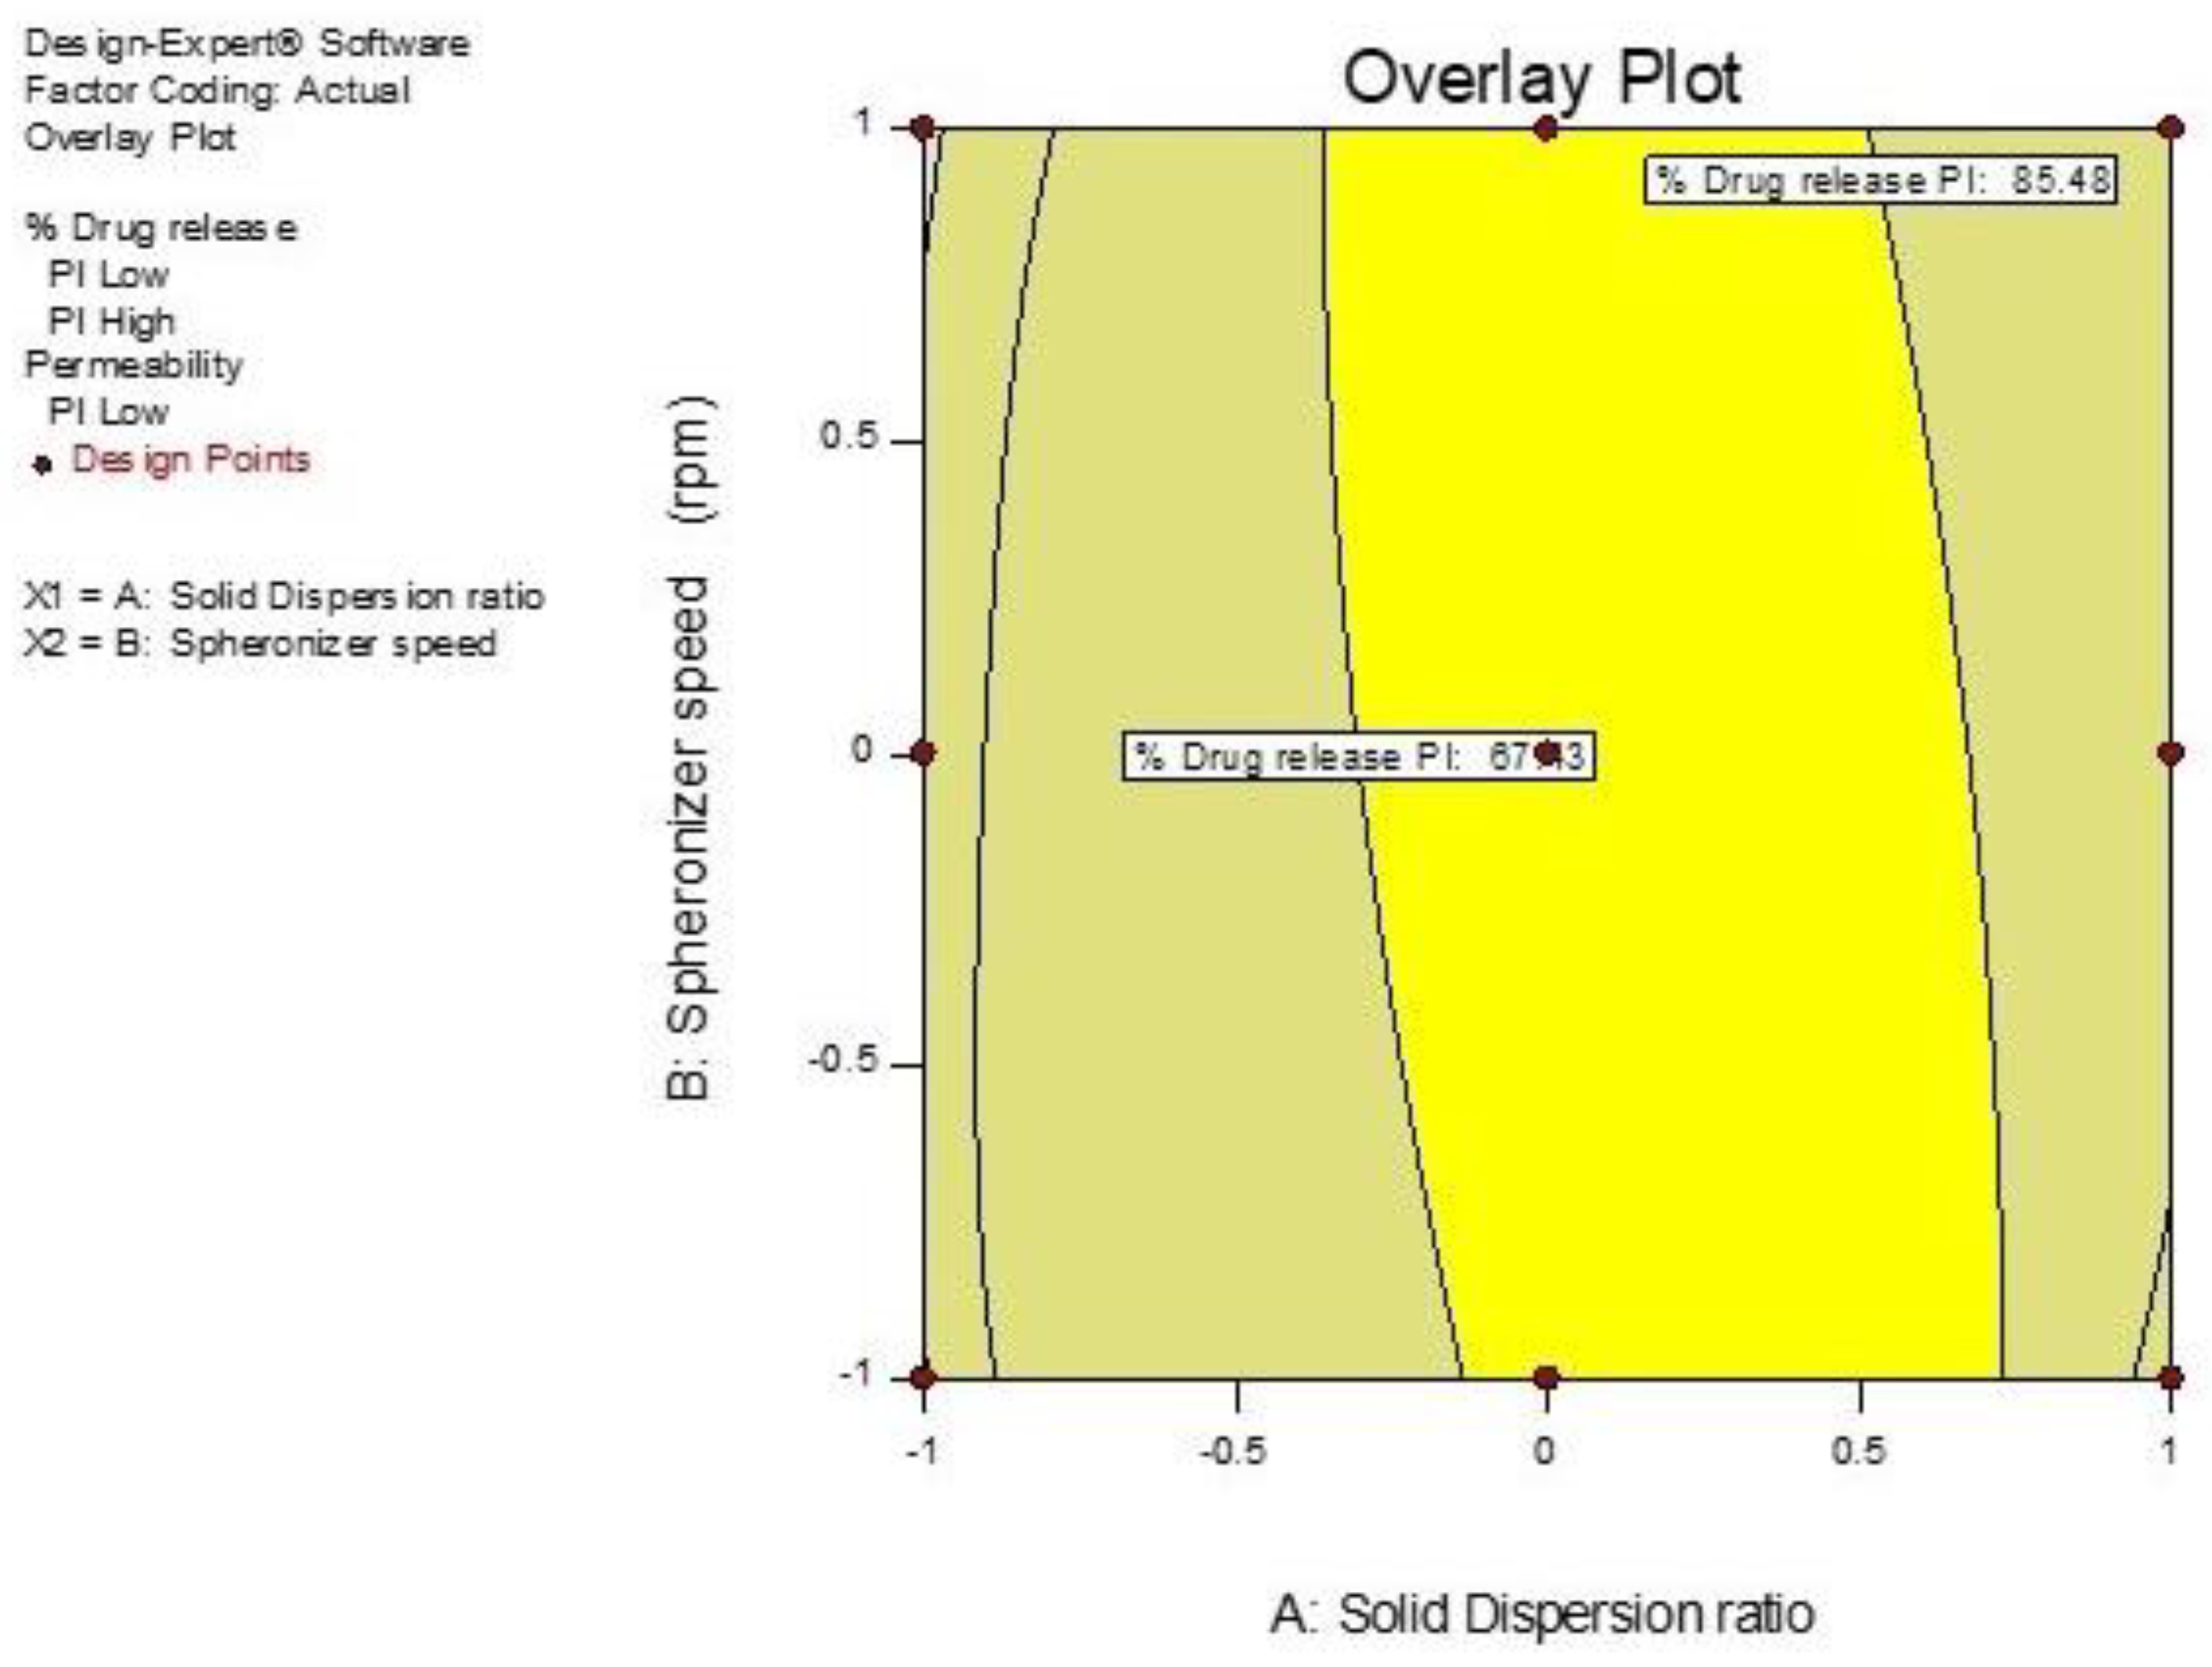
3.5. Optimization of GTE-SD Pellets

The design of experiments was used to examine the effectiveness of the extrusion spheronization method for the formulation of GTE-SD pellets. The pellets were prepared according to the batches suggested by factorial design. All the pellet formulations were spherical in shape and exhibited better flow properties, as evident from the values of Carr’s index, the angle of repose, and Hausner’s ratio. The drug content of all pellet formulations was in the range of 82.37 ± 0.82 to 90.47 ± 1.09%. The impact of the independent variables GTE-SD ratio (X1) and spheronization speed (X2) on the dependent variables (Y1) drug release after 150 min, (Y2) ex vivo permeation after 150 min, and (Y3) geometric mean diameter of the pellets was evaluated. The significance and magnitude of impacts of independent variables (X1) and (X2) and their interactions with the dependent variables (Y1), (Y2), and (Y3) were assessed using analysis of variance (ANOVA).

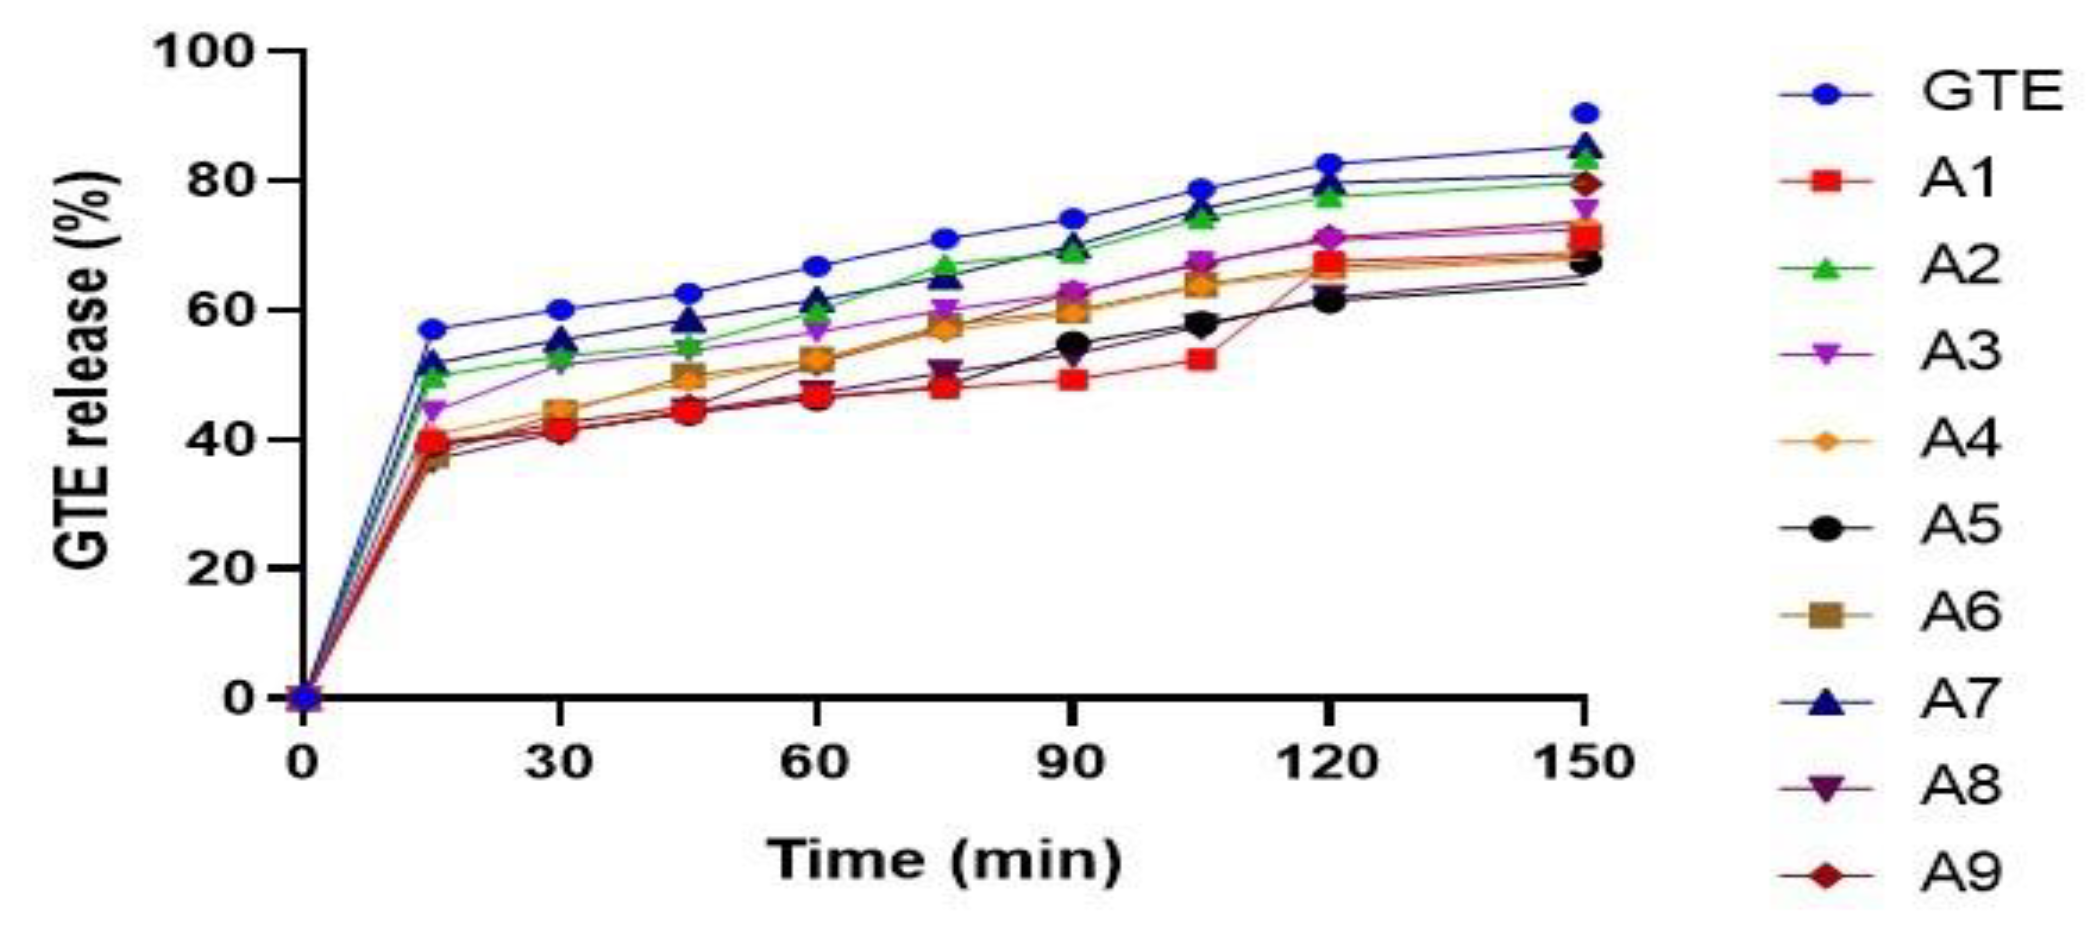
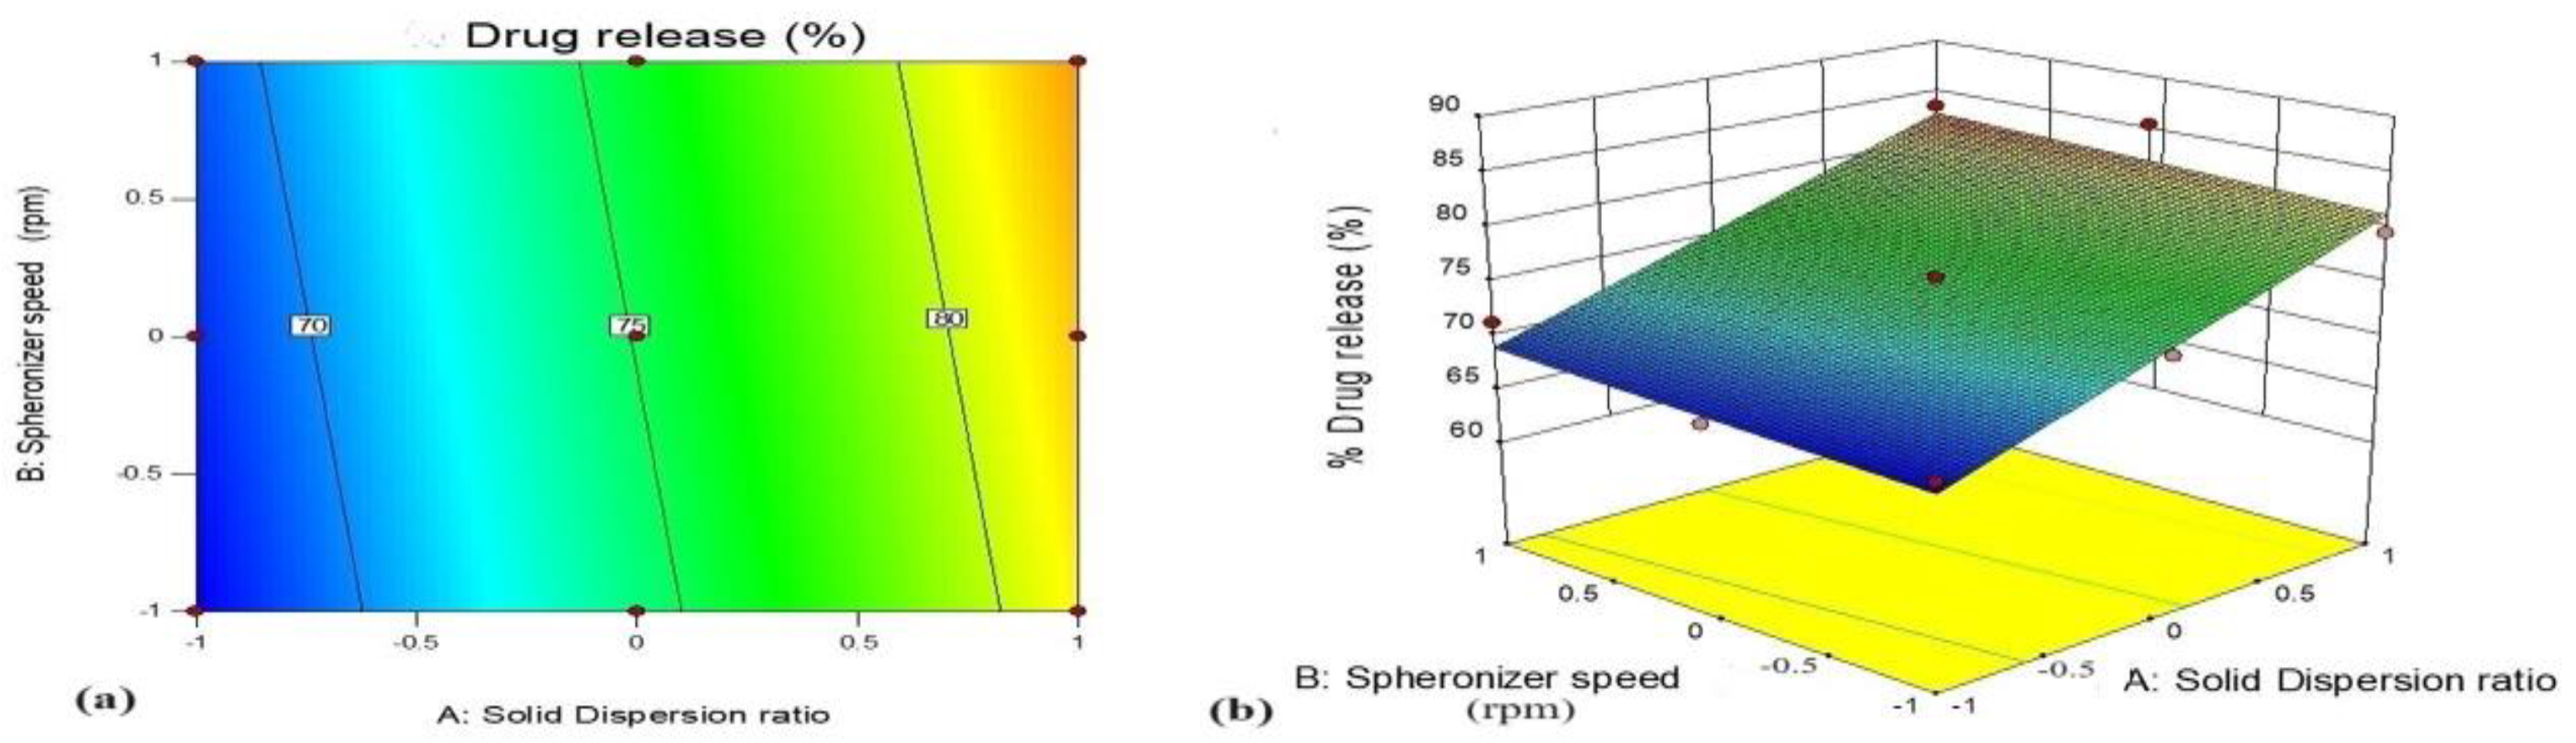
3.5.1. Effect of Variables X1 (GTE-SD Ratio) and X2 (Spheronizer Speed) on % Drug Release

The model for the response (Y1) can be given by the following equation:
( Y 1 ) = + 75.11 + 6.92 ( X 1 ) + 0.80 ( X 2 )
The significance of the model was established from the high F value (20.1) and the p-value of less than 0.05 (p = 0.0022). The predicted R2 (0.7126) and adjusted R2 (0.8262) were in reasonable agreement, with their differencebeing less than 0.2. Equation (2), a polynomial regression equation which was generated for the amount of drug released in 150 min, revealed the positive influence of both the parameters, i.e., X1: GTE-SD ratio and X2: spheronizerspeed.
The ANOVA statistical data for response Y1 indicate a significant impact of the GTE-SD ratio on drug release (p < 0.008), whereas in the case of spheronization speed, the p-value was higher (p > 0.1), showing that the speed of spheronization has no substantial impact on the release of a medication. A significant rise in the release of GTE from the pellet formulation was observed when the GTE-SD ratio was varied from 1:4 to 1:8. The reason for the increased solubility was due to the presence of Soluplus, which acts as a solubility enhancer. Soluplus solubilized the drug molecules through the formation of micelles or molecular dispersions, helping to keep them in a dissolved state and preventing their precipitation or aggregation. Also, the spherical shape of the pellets with a uniform size provided a significant surface area for dissolution, thereby increasing the drug release. The percent drug release of formulation of A1 to A9 was 67.43% to 85.48%, as shown in Figure 10. Formulation A7 (85.48%) showed the highest drug release, while formulation A5 (67.43%) showed the lowest drug release due to the lower amount of solubilizer present in it.

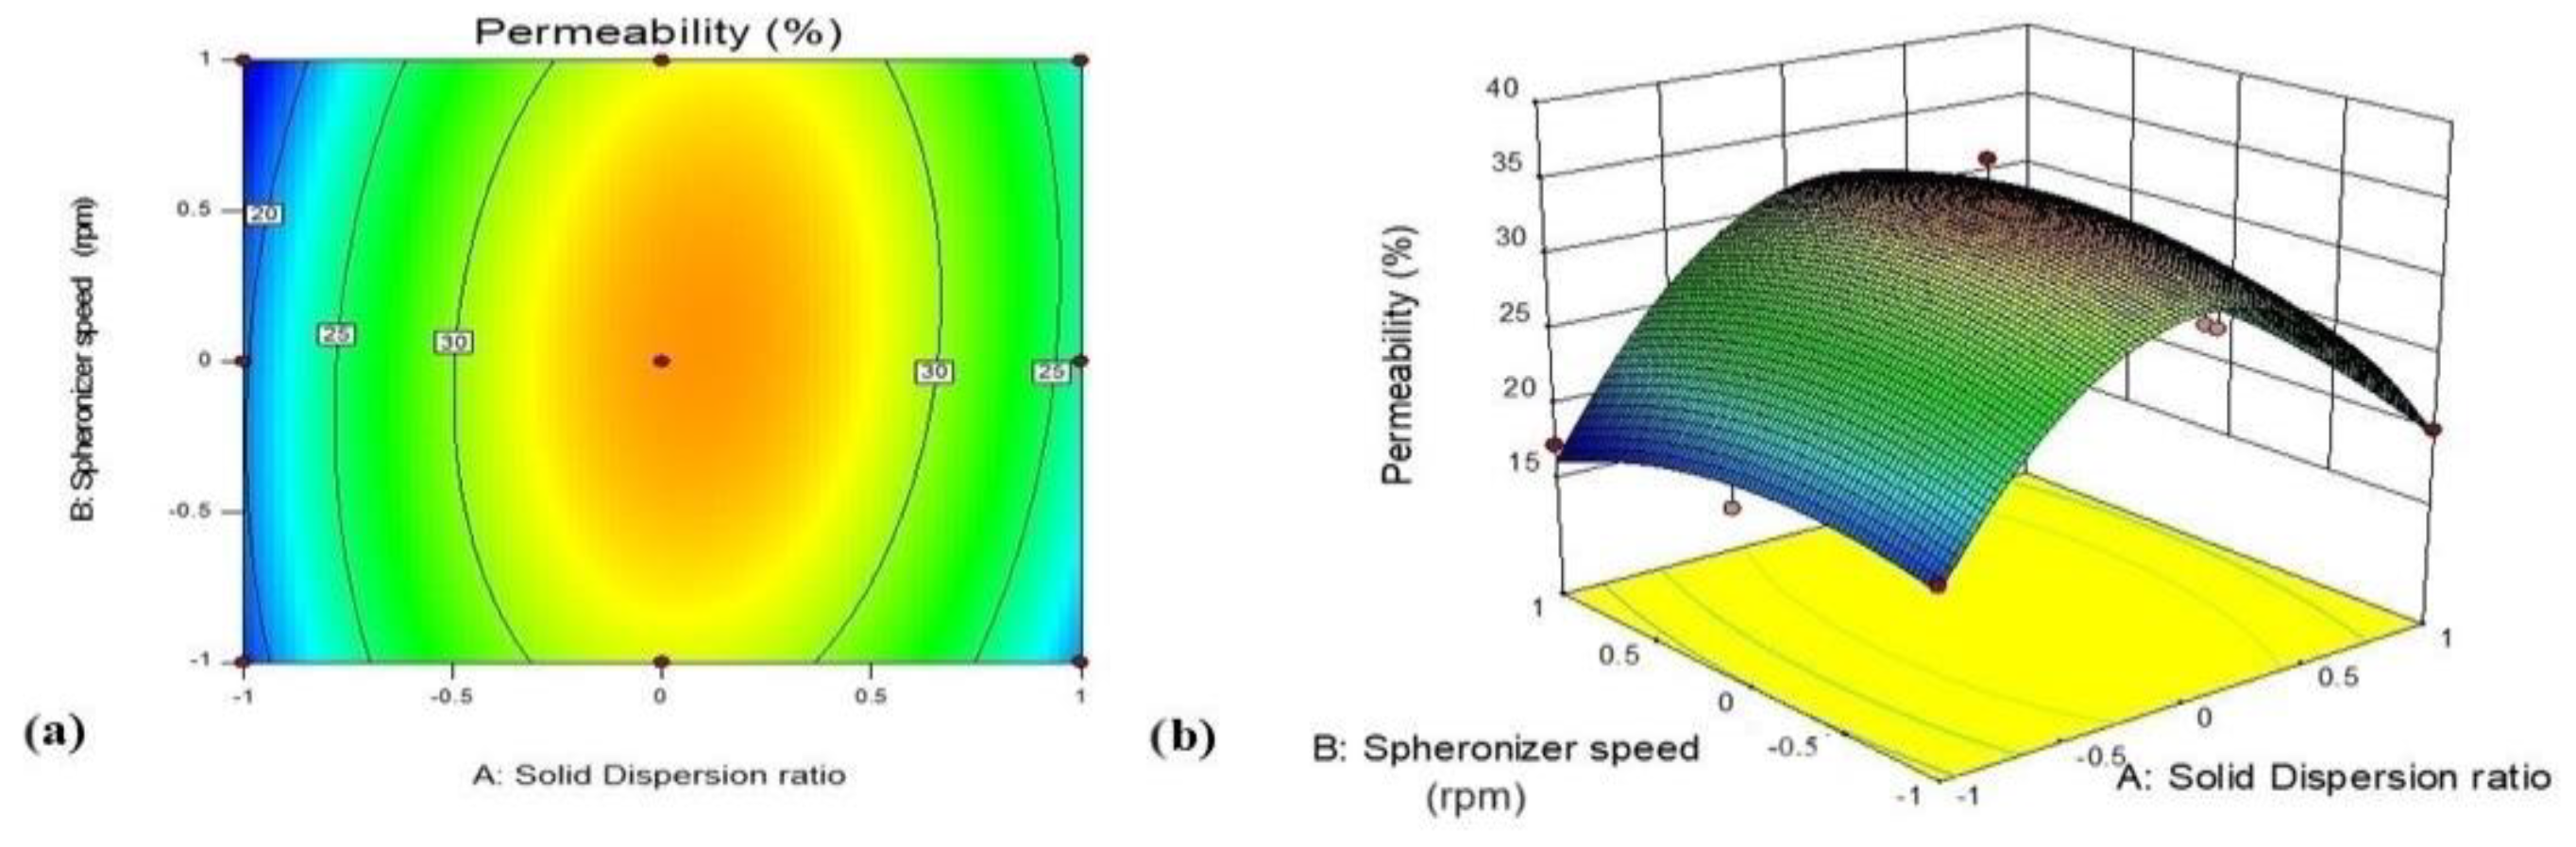
3.5.2. Effect of Variables X1 (GTE-SD Ratio) and X2 (Spheronizer Speed) on Ex Vivo Permeation (%)

The model for the response (Y2) can be given by the following equation:
Y 2 = + 31.95 + 1.98 X 1 + 0.15 X 2 + 1.38 X 1 X 2 11.07 X 1 2 1.22 X 2 2
A polynomial regression equation generated for in vitro permeation is shown in Equation (3). The model was significant, with a F value of 29.63 and a p-value of 0.0093. The ANOVA statistical data for response Y2 indicate a non significant impact of the GTE-SD ratio (p > 0.1) and spheronization speed on the ex vivo permeation of EGCG (p > 0.1). The permeation of EGCG from the pure GTE was found to be 10.43%. The ex vivo permeation of EGCG from the GTE-SD pellets is shown in Figure 11. Formulations A1 (17.18%), A5 (18.18%), and A8 (18.89%) showed the lowest permeation of EGCG, whereas formulation A3 (33.27%) showed the highest permeation as compared to the other batches. When the ratio of GTE-SD was 1:4, a negative impact on the ex vivo permeability of EGCG was observed, but at a particular concentration, when the ratio of GTE-SD was 1:6, a positive impact was observed on the ex vivo permeation of EGCG. At the higher ratio of GTE-SD (above 1:6), again, a negative impact the on ex vivo permeation of EGCG was observed. The results suggest that the ratio of GTE-SD of 1:6 was optimal, as at this ratio, the maximum permeation of EGCG was observed. Thus, this indicates that the concentration of Soluplus® was sufficient to form micelles with a smaller size, which might have presented a smaller barrier for the diffusion of EGCG and a higher surface area that allowed for more direct contact with the surrounding medium, thereby allowing an enhanced permeation of EGCG. The permeation of EGCG across the intestinal membrane from the GTE and from formulation A3 was found to be 10.70% and 33.55%, respectively. At a higher concentration (GTE-SD > 1:6), the addition of excess polymer might have resulted in the formation of larger aggregates. Also, with the increase in the concentration of the polymer, an increase in the viscosity of the solution was observed, which might have affected the permeation of EGCG, thereby lowering its influx.

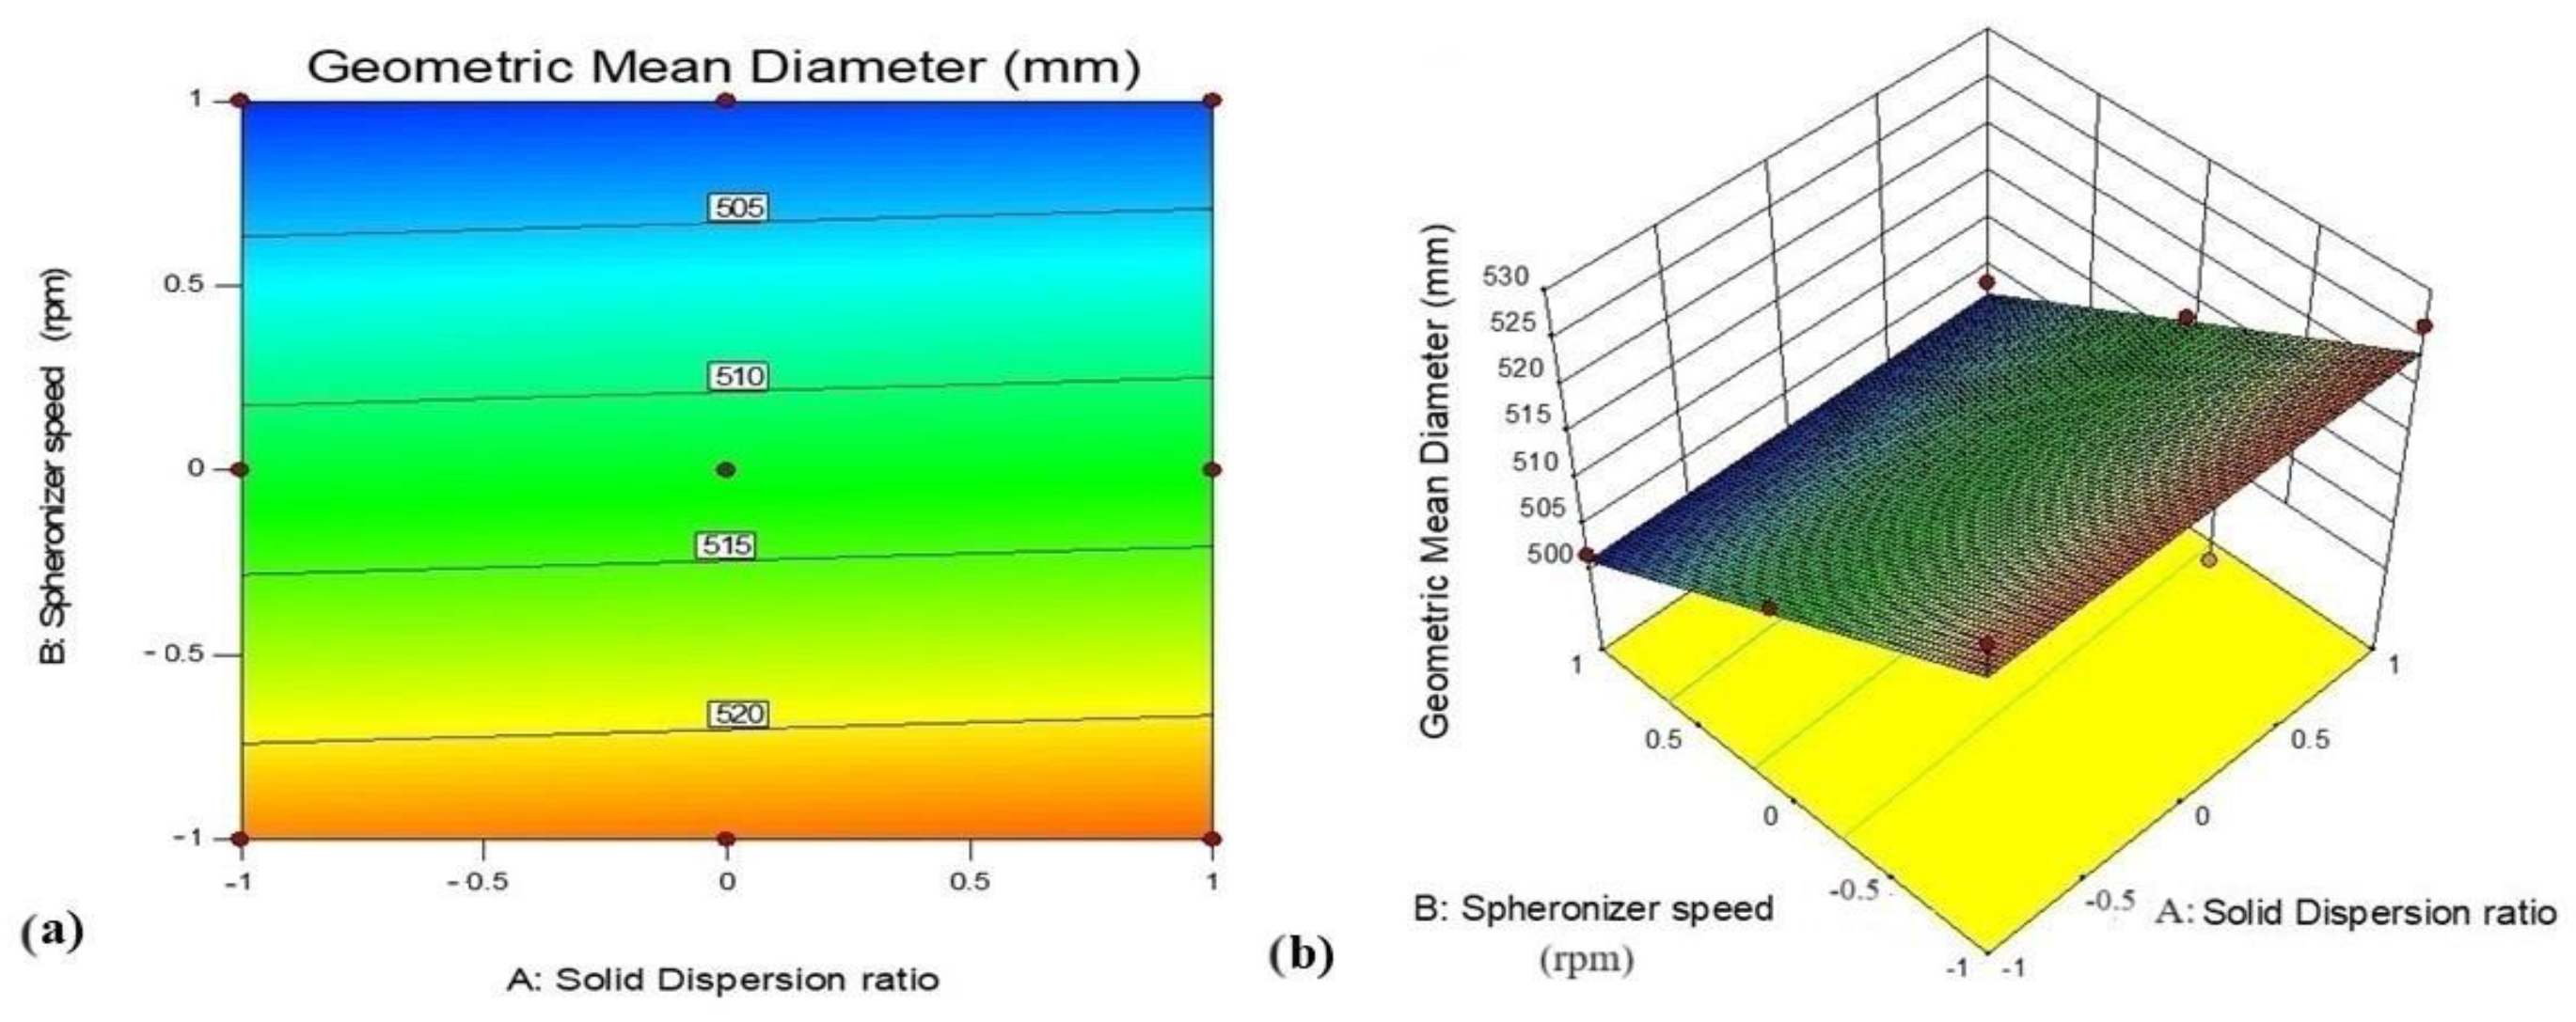
3.5.3. Effect of Variables X1 (GTE-SD Ratio) and X2 (Spheronizer Speed) on Geometric Mean Diameter

The model for the response (Y3) can be given by the following equation:
Y 3 = + 512.53 + 0.72 ( X 1 ) 11.23 ( X 2 )
The F value (32.89) and p-value smaller than 0.05 (p = 0.0006) suggest the model’s importance. The ANOVA statistical data indicate the importance of spheronization speed on the geometric mean diameter (p < 0.05), whereas the effect of the ratio of solid dispersion indicated a nonsignificant effect on drug release (p > 0.1). With the increase in the spheronization speed, ranging from 1100 to 1300 rpm, it was seen from the surface response plot that the pellet size was reduced with a decrease in the geometric diameter of the pellets. Smaller pellets may have resulted from a different breaking behavior of the extrudates due to the higher spheronization velocity. The results are in agreement with Broesder A et al. [49]. There was a positive impact on the geometric mean diameter with the increase in the ratio of solid dispersion due to the increase in the content of polymer, which might have increased the spheronizer load, thereby increasing the geometric diameter.
The target profile set for optimized pellet formulation was based on the maximum drug release (%), the maximum in vitro permeation (%), and the minimum geometric mean diameter. Considering the outcomes obtained from formulation A3 with a GTE-SD ratio of 1:6 and a spheronization speed 1200 rpm, it was observed that at this ratio, the percent release of EGCG was 75.45%, its ex vivo permeation was 33.27%, and the mean geometric diameter obtained for GTE-SD pellets was 510.4 µm, which was in close agreement with the set target profile as compared to the other batches. Hence, it was selected as the optimized batch. An overlay plot was used to indicate the performance metric for each optimization run and assist in converging the optimization algorithm towards an optimal solution. The 3D response plots for all the three responses (%drug release, % ex vivo permeation, and geometric mean diameter) and the overlay plot are depicted in Figure 12, Figure 13 and Figure 14, respectively. An overlay plot is depicted in Figure 15. Using the optimized parameters suggested by DOE, a fresh batch of GTE-SD pellets (1:6) was formulated and a comparison of expected and experimental outcomes was performed to validate the optimization parameters, as shown in Table 6. The percentage of projected values that differed from the experimental values was only 3.37%, 3.35%, and 8.76% for in vitro drug release, ex vivo permeation (%), and geometric mean diameter, respectively, suggesting the robustness of the pellet formulation, and thereby confirming the validation of the formulation process of the pellets.

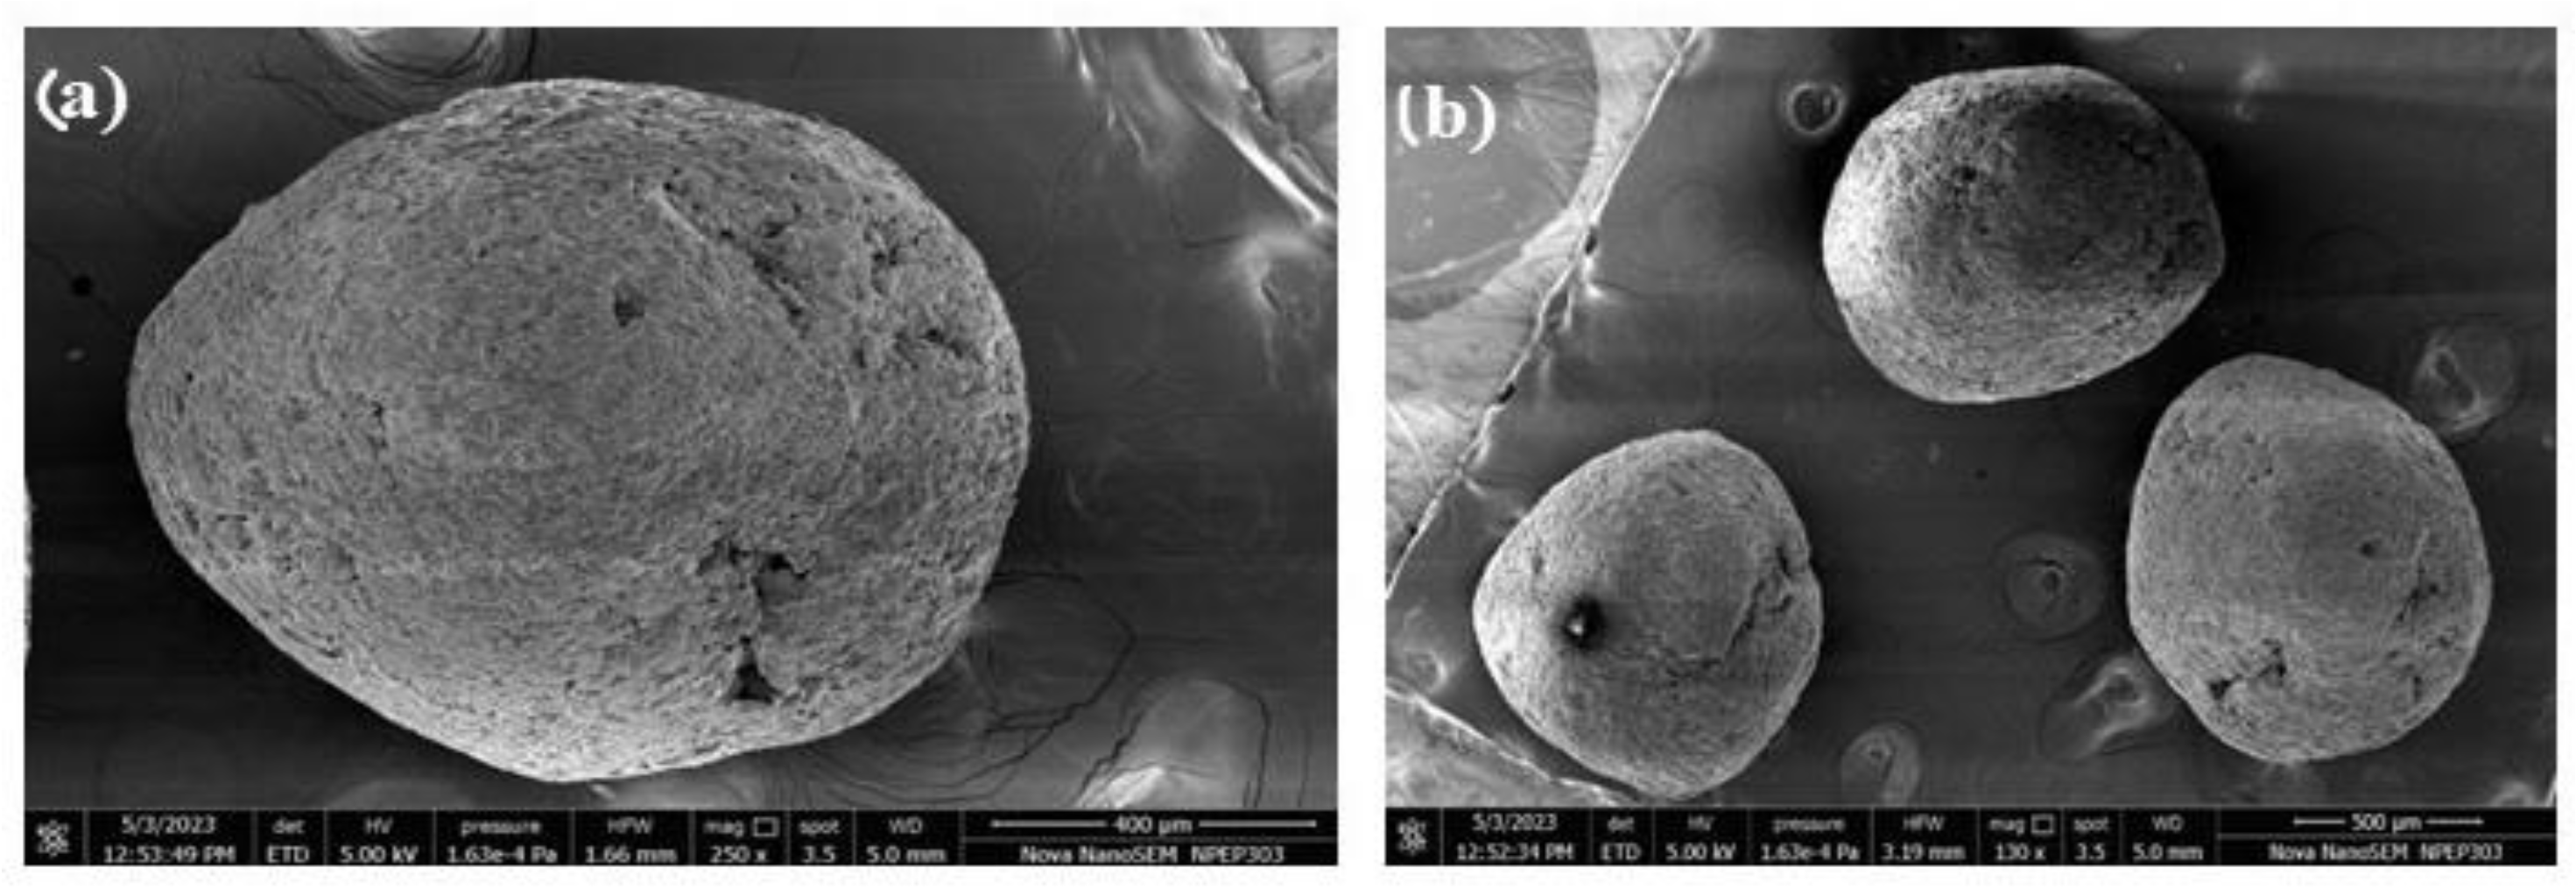
3.5.4. Scanning Electron Microscopy

The surface morphology of the selected batch of GTE-SD pellets (A3), studied using scanning electron microscopy, revealed that the surface of the pellets was rough and they were roughly spherical in shape with uniform size (Figure 16).

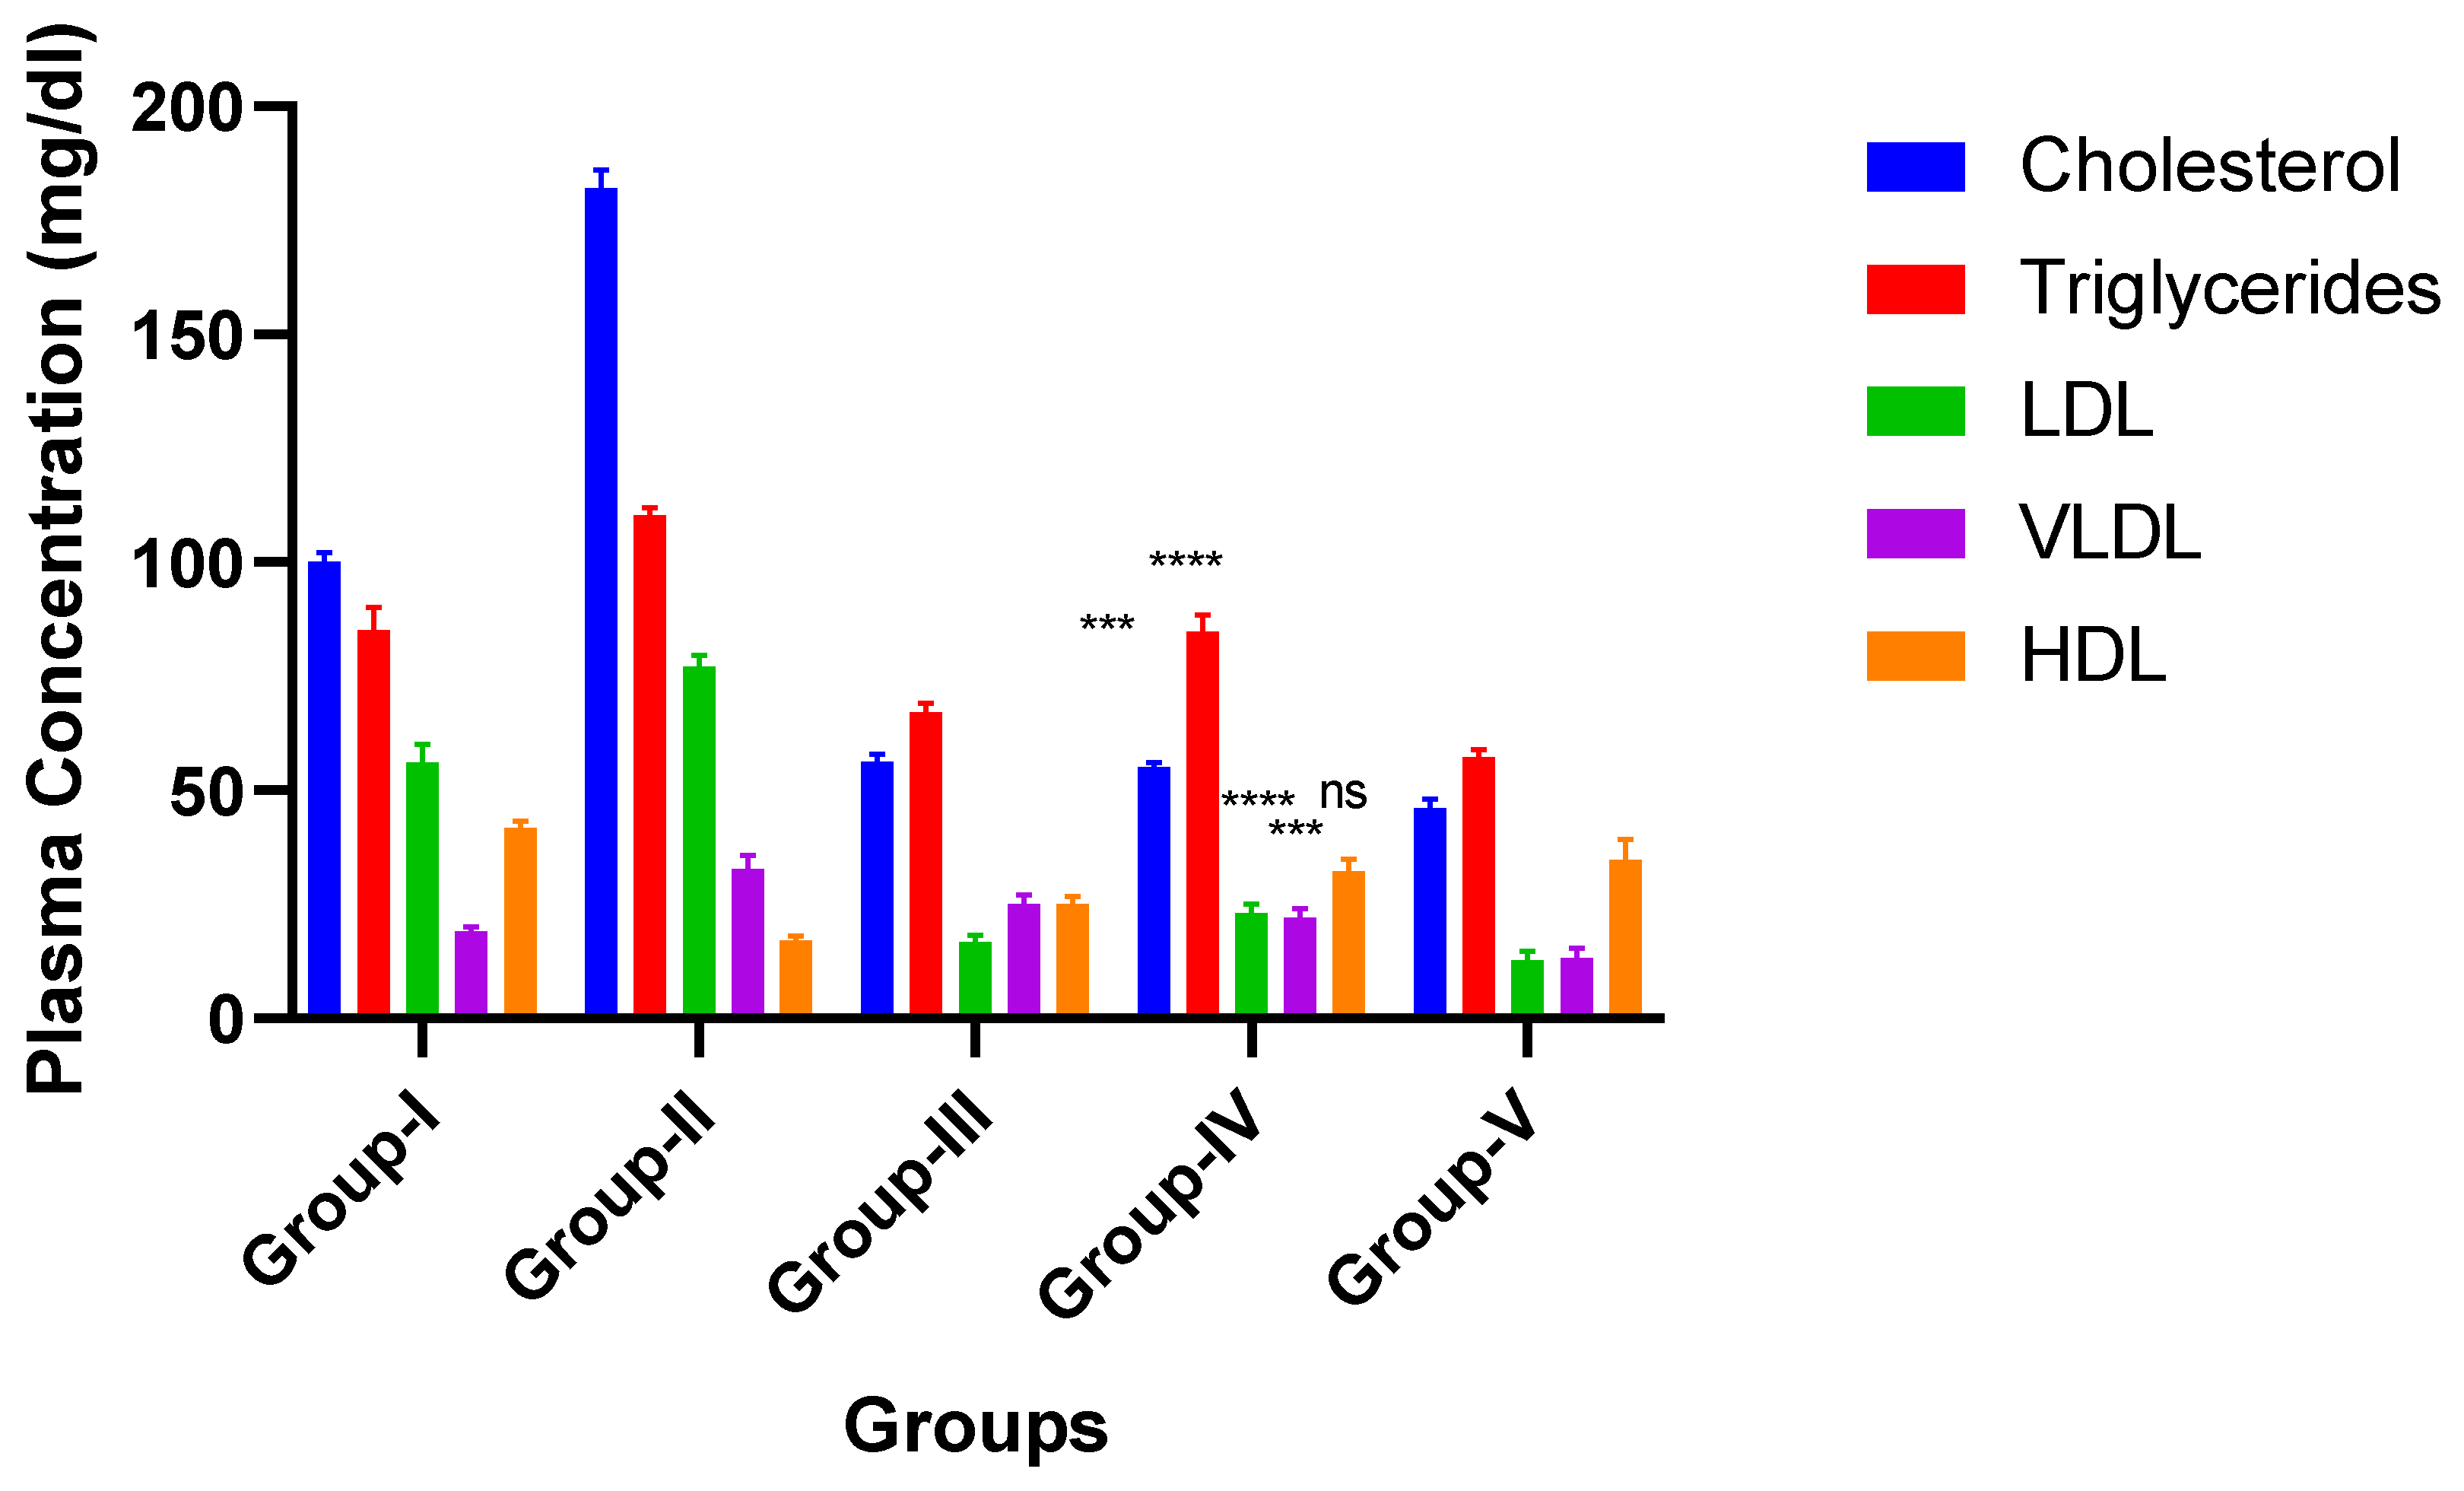
3.5.5. In Vivo Study

The findings from the examination of the blood sample for analysis of triglycerides, cholesterol, LDLs, HDLs, and VLDLs are shown in Figure 17. The serum lipid levels in Group II (the negative control) significantly increased, indicating the presence of hyperlipidemia. Group II had a serum cholesterol level of 89 mg/dL (p < 0.0001) and the following lipoprotein levels: LDL—43 mg/dL; VLDL—36 mg/dL;182 mg/dL for triglycerides; and a lower level of HDL of 16 mg/dL. In Group I (the control group), the serum cholesterol level was 64 mg/dL (p < 0.0001). In Group III, compared to the negative control group, reductions in the lipid levels were noted, with cholesterol levels of 58 mg/dL, triglyceride levels of 69 mg/dL, HDL levels of 24 mg/dL, LDL levels of 18 mg/dL, and VLDL levels of 27 mg/dL (p < 0.0001). Even in Group IV, significant lipid-regulating effects were observed, with cholesterol levels of 55 mg/dL, triglyceride levels of 83 mg/dL, HDL levels of 23 mg/dL, LDL levels of 23 mg/dL, and VLDL levels of 22 mg/dL. In Group V, the lipid-lowering effects were significantly higher, with acholesterol level of 44 mg/dL, triglyceride levels of 57 mg/dL, HDL levels of 30 mg/dL, LDL levels of 15 mg/dL, and VLDL levels of 11 mg/dL. The results of the comparison of the lipid profiles of Group IV with Group V indicated a significant lowering of cholesterol, LDLs, VLDLs, and triglycerides (p < 0.0001), whereas no significant change was observed in the levels of HDLs. The results indicated that Soluplus® at an adequate concentration can result in an improved permeation of EGCG, thereby helping to promote the anti-hyperlipidemic activity of GTE. EGCG inhibits dietary cholesterol absorption in the intestines and reduces cholesterol uptake into the bloodstream, resulting in decreased levels of total cholesterol and low-density lipoprotein cholesterol (LDL-C) in the blood. This effect may be attributed to the formation of a complex between EGCG and lipids. Additionally, it increases the level of good cholesterol (HDL-C levels) and enhances the activity of lipoprotein lipase, leading to the increased clearance of triglycerides from the bloodstream. The findings are supported by an in vivo study, wherein Group V treated with an optimized ratio of GTE-SD pellets exhibited a significant lipid-lowering effect (p < 0.0001), as compared to Group IV treated with GTE. The results from the ex vivo permeation studies clearly indicated an enhanced permeation of EGCG from GTE, which was confirmed in the in vivo studies in a hyperlipidemia-induced rat model, wherein significant lipid-lowering effects were observed in rats. The correlation obtained in the ex vivo and in vivo studies thereby confirmed the promising role of Soluplus® in enhancing the permeation of EGCG to exert anti-hyperlipidemic activity.

4. Conclusions

GTE-based solid dispersion pellets were formulated by employing Soluplus® as a permeation enhancer. The pellets formulated with GTE-SD with a ratio of 1:6 showed a considerable improvement in the permeation of GTE as compared to pure GTE. The permeability coefficient of the GTE-SD pellets (1:6) demonstrated a four-fold improvement in the rate of permeation of EGCG as compared to GTE. Soluplus® might have contributed to the enhanced permeation of EGCG from the GTE-SD pellets due to micellar solubilization. This enhanced permeation of GTE was evident from the significant lipid-lowering effects observed in the high-fat-diet-induced hyperlipidemia model in rats as compared to GTE. Pellets are commercially preferable formulations as they are easily scalable, simple, stable, and convenient to handle. Thus, GTE-based solid dispersion pellets present a convenient and effective way to improve the permeability of GTE, thereby increasing its bioavailability in order to enhance its anti-hyperlipidemia activity. Further, clinical studies are required to gain insights into the underlying mechanisms of enhancing the permeation of GTE to boost its anti-hyperlipidemia activity.

Author Contributions

Conceptualization, V.P., P.G. (Pranita Gaikwad) and P.G. (Prabhanjan Giram); methodology, V.P., P.G.(Pranita Gaikwad) and P.G. (Prabhanjan Giram); software, V.P.; validation, S.D., S.K. and P.J.; formal analysis, S.D. and P.J.; investigation, V.P., P.G. (Prabhanjan Giram) and P.G.(Pranita Gaikwad); resources, DYPIPSR, Pimpri, Pune; data curation, V.P., P.G. (PrabhanjanGiram) and P.G.(Pranita Gaikwad); writing—original draft preparation, V.P., P.G. (Prabhanjan Giram) and S.D.; writing—review and editing, V.P., P.G. (Prabhanjan Giram), P.G.(Pranita Gaikwad), S.D., P.J. and S.K.; visualization, S.D. and P.G. (Prabhanjan Giram); supervision, V.P. and P.G. (Prabhanjan Giram); project administration, V.P., P.G. (Prabhanjan Giram) and P.G.(Pranita Gaikwad). No funding was provided byany funding agency. All authors have read and agreed to the published version of the manuscript.

Funding

This research received no external funding.

Institutional Review Board Statement

The animal study protocol was approved by the Institutional Review Board (or Ethics Committee) of Dr. D. Y. Patil Institute of Pharmaceutical Sciences and Research Pune (protocol code DYPIPSR/IAEC/Feb/2022-23/P-3 and date of approval3 January 2023) for studies involving animals.

Informed Consent Statement

Not applicable.

Data Availability Statement

Not applicable.

Acknowledgments

The authors would like to thank BASF India Limited, Mumbai, India for providing the gift sample of Poloxomer 188 and Soluplus®.

Conflicts of Interest

The authors declare no conflict of interest.

References

  1. Lee, Y.; Siddiqui, W.J. Cholesterol Levels. In StatPearls; StatPearls Publishing: Treasure Island, FL, USA, 2023. Available online: https://www.ncbi.nlm.nih.gov/books/NBK542294/ (accessed on 3 March 2023).
  2. Fredrickson, D.S. An international classification of hyperlipidemias and hyperlipoproteinemias. Ann. Intern. Med. 1971, 75, 471–472. [Google Scholar] [CrossRef]
  3. Yao, Y.S.; Li, T.D.; Zeng, Z.H. Mechanisms underlying direct actions of hyperlipidemia on myocardium: An updated review. Lipids Health Dis. 2020, 19, 23. [Google Scholar] [CrossRef]
  4. Nelson, R.H. Hyperlipidemia as a risk factor for cardiovascular disease. Prim. Care 2013, 40, 195–211. [Google Scholar] [CrossRef]
  5. Hassani, H.; Huang, X.; MacFeely, S.; Entezarian, M.R. Big data and the United Nations sustainable development goals (UN SDGs) at a glance. Big Data Cogn. Comput. 2021, 5, 28. [Google Scholar] [CrossRef]
  6. Benjamin, E.J.; Virani, S.S.; Callaway, C.W.; Chamberlain, A.M.; Chang, A.R.; Cheng, S.; Chiuve, S.E.; Cushman, M.; Delling, F.N.; Deo, R.; et al. Heart disease and stroke statistics update: A report from the American Heart Association. Circulation 2018, 137, 67–492. [Google Scholar] [CrossRef]
  7. Golomb, B.A.; Evans, M.A. Statin adverse effects: A review of the literature and evidence for a mitochondrial mechanism. Am. J. Cardiovasc. Drugs 2008, 8, 373–418. [Google Scholar] [CrossRef]
  8. Hu, Y.; Chen, X.; Hu, M.; Zhang, D.; Yuan, S.; Li, P.; Feng, L. Medicinal and edible plants in the treatment of dyslipidemia: Advances and prospects. Chin. Med. 2022, 17, 113. [Google Scholar] [CrossRef]
  9. Tuhin, R.H.; Begum, M.; Rahman, M.S.; Karim, R.; Begum, T.; Ahmed, S.U.; Mostofa, R.; Hossain, A.; Abdel-Daim, M.; Begum, R. Wound healing effect of Euphorbia hirtalinn. (Euphorbiaceae) in alloxan induced diabetic rats. BMC Complement. Altern. Med. 2017, 17, 423. [Google Scholar] [CrossRef]
  10. Rudrapal, M.; Khairnar, S.J.; Khan, J.; Dukhyil, A.B.; Ansari, M.A.; Alomary, M.N.; Alshabrmi, F.M.; Palai, S.; Deb, P.K.; Devi, R. Dietary polyphenols and their role in oxidative stress-induced human diseases: Insights into protective effects, antioxidant potentials and mechanism(s) of action. Front. Pharmacol. 2022, 13, 283. [Google Scholar] [CrossRef]
  11. Gupta, A.U.; Jagadis, K. Reactive Oxygen and Nitrogen Species Signaling and Communication in Plants; Part of Signaling and Communication in Plants; Springer: Cham, Switzerland, 2015. [Google Scholar]
  12. Fujiki, H.; Suganuma, M.; Imai, K.; Nakachi, K. Green tea: Cancer preventive beverage and/or drug. Cancer Lett. 2002, 188, 9–13. [Google Scholar] [CrossRef]
  13. Zhao, T.; Li, C.; Wang, S.; Song, X. Green tea (Camellia sinensis): A review of its phytochemistry, pharmacology, and toxicology. Molecules 2022, 27, 3909. [Google Scholar] [CrossRef] [PubMed]
  14. Xu, R.; Yang, K.; Li, S.; Dai, M.; Chen, G. Effect of green tea consumption on blood lipids: A systematic review and meta-analysis of randomized controlled trials. Nutr. J. 2020, 19, 48. [Google Scholar] [CrossRef] [PubMed]
  15. Suzuki-Sugihara, N.; Kishimoto, Y.; Saita, E.; Taguchi, C.; Kobayashi, M.; Ichitani, M.; Ukawa, Y.; Sagesaka, Y.M.; Suzuki, E.; Kondo, K. Green tea catechins prevent low-density lipoprotein oxidation via their accumulation in low-density lipoprotein particles in humans. Nutr. Res. 2016, 36, 16–23. [Google Scholar] [CrossRef] [PubMed]
  16. Koo, S.I.; Noh, S.K. Green tea as inhibitor of the intestinal absorption of lipids: Potential mechanism for its lipid-lowering effect. J. NutrBiochem. 2007, 18, 179–183. [Google Scholar] [CrossRef]
  17. Cai, Z.Y.; Li, X.M.; Liang, J.P.; Xiang, L.P.; Wang, K.R.; Shi, Y.L.; Yang, R.; Shi, M.; Ye, J.H.; Lu, J.L.; et al. Bioavailability of tea catechins and its improvement. Molecules 2018, 23, 2346. [Google Scholar] [CrossRef]
  18. Krook, M.A.; Hagerman, A.E. Stability of polyphenols epigallocatechingallate and pentagalloyl glucose in a simulated digestive system. Food Res. Int. 2012, 49, 112–116. [Google Scholar] [CrossRef]
  19. Yin, Z.; Zheng, T.; Ho, C.T.; Huang, Q.; Wu, Q.; Zhang, M. Improving the stability and bioavailability of tea polyphenols by encapsulations: A review. Food Sci. Hum. Wellness 2022, 11, 537–556. [Google Scholar] [CrossRef]
  20. Cano, A.; Ettcheto, M.; Chang, J.H.; Barroso, E.; Espina, M.; Kühne, B.A.; Barenys, M.; Auladell, C.; Folch, J.; Souto, E.B.; et al. Dual-drug loaded nanoparticles of epigallocatechin-3-gallate (EGCG)/ascorbic acid enhance therapeutic efficacy of EGCG in a APPswe/PS1dE9 alzheimer’s disease mice model. J. Control. Release 2019, 301, 62–75. [Google Scholar] [CrossRef]
  21. Furniturewalla, A.; Barve, K. Approaches to overcome bioavailability inconsistencies of epigallocatechingallate, a powerful anti-oxidant in green tea. Food Chem. Adv. 2022, 1, 100037. [Google Scholar] [CrossRef]
  22. Nguyen, T.T.; Duong, V.A.; Maeng, H.J. Pharmaceutical formulations with P-glycoprotein inhibitory effect as promising approaches for enhancing oral drug absorption and bioavailability. Pharmaceutics 2021, 13, 1103. [Google Scholar] [CrossRef]
  23. Linn, M.; Collnot, E.M.; Djuric, D.; Hempel, K.; Fabian, E.; Kolter, K.; Lehr, C.M. Soluplus® as an effective absorption enhancer of poorly soluble drugs in vitro and in vivo. Eur. J. Pharm. Sci. 2012, 45, 336–343. [Google Scholar] [CrossRef] [PubMed]
  24. Hu, J.; Zhou, D.; Chen, Y. Preparation and antioxidant activity of green tea extract enriched in epigallocatechin (EGC) and epigallocatechingallate (EGCG). J. Agric. Food Chem. 2009, 57, 1349–1353. [Google Scholar] [CrossRef]
  25. Pandit, A.P.; Joshi, S.R.; Dalal, P.S.; Patole, V.C. Curcumin as a permeability enhancer enhanced the antihyperlipidemic activity of dietary green tea extract. BMC Complement. Altern. Med. 2019, 19, 129. [Google Scholar] [CrossRef] [PubMed]
  26. Dos Santos, C.; Del PilarBuera, M.; Mazzobre, M.F. Phase solubility studies of terpineol with β-cyclodextrins and stability of the freeze-dried inclusion complex. Procedia Food Sci. 2011, 1, 355–362. [Google Scholar] [CrossRef]
  27. Dhirendra, K.; Lewis, S.; Udupa, N.; Atin, K. Solid dispersions: A review. Pak. J. Pharm. Sci. 2009, 22, 234–246. [Google Scholar] [PubMed]
  28. Fule, R.; Amin, P. Development and evaluation of lafutidine solid dispersion via hot melt extrusion: Investigating drug-polymer miscibility with advanced characterisation. Asian J. Pharm. Sci. 2014, 9, 92–106. [Google Scholar] [CrossRef]
  29. Manea, A.M.; Vasile, B.S.; Meghea, A. Antioxidant and antimicrobial activities of green tea extract loaded into nanostructured lipid carriers. C. R. Chim. 2014, 17, 331–341. [Google Scholar] [CrossRef]
  30. Senthilkumar, S.R.; Sivakumar, T. Green tea (Camellia sinensis) mediated synthesis of zinc oxide (ZnO) nanoparticles and studies on their antimicrobial activities. Int. J. Pharm. Pharm. Sci. 2014, 6, 461–465. [Google Scholar]
  31. Fousteris, E.; Tarantili, P.A.; Karavas, E.; Bikiaris, D. Poly (vinyl pyrrolidone)–poloxamer-188 solid dispersions prepared by hot melt extrusion: Thermal properties and release behavior. J. Therm. Anal. Calorim. 2013, 113, 1037–1047. [Google Scholar] [CrossRef]
  32. Dhome, A.G.; Deshkar, S.S.; Shirolkar, S.V. Gliclazide solid lipid nanoparticles: Formulation, optimization and in vitro characterization. Pharm. Reason. 2018, 1, 8–16. [Google Scholar]
  33. Najmuddin, M.; Ahmed, A.; Shelar, S.; Patel, V.; Khan, T. Floating microspheres of ketoprofen: Formulation and evaluation. Int. J. Pharm. Pharm. Sci. 2010, 2, 83–87. [Google Scholar]
  34. Shelar, S.; Shirolkar, S.; Kale, N. Formulation optimization of promethazine theoclate immediate release pellets by using extrusion-spheronization technique. Int. J. Appl. Pharm. 2018, 10, 30–35. [Google Scholar]
  35. Singh, G.; Pai, R.S.; Devi, V.K. Optimization of pellets containing solid dispersion prepared by extrusion/spheronization using central composite design and desirability function. J. Young Pharm. 2012, 4, 146–156. [Google Scholar] [CrossRef] [PubMed]
  36. Pharmacopeia US. United States Pharmacopeia and National Formulary (USP 37–NF 32); Rockville, M.D., Ed.; US Pharmacopeia: North Bethesda, MD, USA, 2014. [Google Scholar]
  37. Ravella, V.N.; Nadendla, R.R.; Kesari, N.C. Design and evaluation of sustained release pellets of aceclofenac. J. Pharm. Res. 2013, 6, 525–531. [Google Scholar] [CrossRef]
  38. Sareen, S.; Mathew, G.; Joseph, L. Improvement in solubility of poor water-soluble drugs by solid dispersion. Int. J. Pharm. Investig. 2012, 2, 12. [Google Scholar] [CrossRef]
  39. Dixit, P.; Jain, D.K.; Dumbwani, J. Standardization of an ex vivo method for determination of intestinal permeability of drugs using everted rat intestine apparatus. J. Pharmacol. Toxicol. Methods 2012, 65, 13–17. [Google Scholar] [CrossRef]
  40. Karaca, T.; Bayiroglu, F.; Cemek, M.; Comba, B.; Ahmet, A.Y.; Karaboğa, İ. Effects of green tea extract and lactobacillus casei strain shirota on levels of serum minerals, cholesterol, triglycerides, glucose and lactate in rats fed on high-carbohydrate and high-lipid diets. KafkasTıpBilim. Derg. 2013, 1, 1–7. [Google Scholar] [CrossRef]
  41. Thirumalai, T.; Tamilselvan, N.; David, E. Hypolipidemic activity of Piper betel in high fat diet induced hyperlipidemic rat. J. Acute Dis. 2014, 3, 131–135. [Google Scholar] [CrossRef]
  42. Lee, S.M.; Kim, C.W.; Kim, J.K.; Shin, H.J.; Baik, J.H. GCG-rich tea catechins are effective in lowering cholesterol and triglyceride concentrations in hyperlipidemic rats. Lipids 2008, 43, 419–429. [Google Scholar] [CrossRef]
  43. Mokra, D.; Adamcakova, J.; Mokry, J. Green tea polyphenol (-)-epigallocatechin-3-gallate (EGCG): A time for a new player in the treatment of respiratory diseases? Antioxidants 2022, 11, 1566. [Google Scholar] [CrossRef]
  44. Naharros-Molinero, A.; Caballo-González, M.Á.; de la Mata, F.J.; García-Gallego, S. Direct and reverse pluronic micelles: Design and characterization of promising drug delivery nanosystems. Pharmaceutics 2022, 14, 2628. [Google Scholar] [CrossRef] [PubMed]
  45. Nandi, U.; Ajiboye, A.L.; Patel, P.; Douroumis, D.; Trivedi, V. Preparation of solid dispersions of simvastatin and soluplus using a single-step organic solvent-free supercritical fluid process for the drug solubility and dissolution rate enhancement. Pharmaceuticals 2021, 14, 846. [Google Scholar] [CrossRef] [PubMed]
  46. Dian, L.; Yu, E.; Chen, X.; Wen, X.; Zhang, Z.; Qin, L.; Wang, Q.; Li, G.; Wu, C. Enhancing oral bioavailability of quercetin using novel soluplus polymeric micelles. Nanoscale Res. Lett. 2014, 9, 684. [Google Scholar] [CrossRef] [PubMed]
  47. Kshirsagar, S.; Pandit, A.P. Curcumin pellets of carboxymethylated tamarind seed polysaccharide for the treatment of inflammatory bowel disease. Drug Deliv. Lett. 2018, 8, 29–40. [Google Scholar] [CrossRef]
  48. Shamma, R.N.; Basha, M. Soluplus®: A novel polymeric solubilizer for optimization of carvedilol solid dispersions: Formulation design and effect of method of preparation. Powder Technol. 2013, 237, 406–414. [Google Scholar] [CrossRef]
  49. Broesder, A.; Bircan, S.Y.; De Waard, A.B.; Eissens, A.C.; Frijlink, H.W.; Hinrichs, W.L. Formulation and in vitro evaluation of pellets containing sulfasalazine and caffeine to verify ileo-colonic drug delivery. Pharmaceutics 2021, 13, 1985. [Google Scholar] [CrossRef]
Figure 1. Overlay absorption spectra of standard (EGCG, gallic acid, caffeine, and quercetin) and GTE extract.
Futurepharmacol 03 00044 g001
Figure 2. The graph depicts the standard peaks of the biomarkers that match the test sample peak. At 254 m, the plate was scanned using the CAMAG TLC scanner 3 to provide three-dimensional pictures of all tracks.
Futurepharmacol 03 00044 g002
Figure 3. Phase solubility analysis of GTE in different polymers at concentration of 5 mM as compared to GTE.
Futurepharmacol 03 00044 g003
Figure 4. Saturation solubility of GTE and ratio of GTE-SD in water.
Futurepharmacol 03 00044 g004
Figure 5. Fourier-transform infrared spectroscopy of (a) GTE, (b) Soluplus®, (c) physical mixture of GTE and Soluplus®, and (d) GTE-SD.
Futurepharmacol 03 00044 g005
Figure 6. Differential scanning calorimetry of (a) GTE, (b) Soluplus®, and (c) GTE-SD.
Futurepharmacol 03 00044 g006
Figure 7. XRD spectra of (a) GTE, (b) Soluplus®, and (c) GTE-SD.
Futurepharmacol 03 00044 g007
Figure 8. The HPLC chromatogram showing the peak of (a) pure ECGC; (b) GTE extract; (c) GTE-SD.
Futurepharmacol 03 00044 g008aFuturepharmacol 03 00044 g008b
Figure 9. (a) Ex vivo permeation of GTE from GTE-SD; (b) the Papp of various ratios of GTE-SD. Data analyzed using one-way ANOVA followed by Sidak’s multiple comparison test (* p < 0.05, *** p < 0.001 **** p < 0.0001 and ns non significant).
Futurepharmacol 03 00044 g009
Figure 10. In vitro dissolution study of GTE-SD pellet formulation.
Futurepharmacol 03 00044 g010
Figure 11. Ex vivo permeation of EGCG from GTE-SD pellet formulation.
Futurepharmacol 03 00044 g011
Figure 12. (a) Counter plot; (b)surface response plot showing effect of GTE-SD and spheronizer speed on % drug release.
Futurepharmacol 03 00044 g012
Figure 13. (a) Counter plot; (b)surface response plot showing effect of GTE-SD and spheronizer speed on ex vivo% drug permeation.
Futurepharmacol 03 00044 g013
Figure 14. (a) Counter plot; (b)surface response plot showing effect of GT-SD and spheronizer speed on geometric mean diameter of pellets.
Futurepharmacol 03 00044 g014
Figure 15. Overlay plot indicating the optimized conditions for the formulation of GTE-SD pellets.
Futurepharmacol 03 00044 g015
Figure 16. Scanning electron microscopy images of optimized GTE-SD pellet formulation at (a) 250× magnification and (b) 130× magnification.
Futurepharmacol 03 00044 g016
Figure 17. Lipid blood profile in Wistar rats from in vivo study (The data are expressed as mean ± SD). Data analyzed using Dunnett’s multiple comparisons test (*** p = 0.0001 and **** p < 0.0001; ns, non significant; Group IV compared to Group V).
Futurepharmacol 03 00044 g017
Table 1. Composition of GTE-SD pellets.
Sr. NoIngredientsQuantity (%w/w)
1GTE-SD powder30
2Microcrystalline cellulose30
3Lactose30
4Sodium croscarmellose5
5Polyvinyl pyrrolidone K 305
6IPA and distilled Waterq.s. 1
1 Quantity sufficient
Table 2. 32 full factorial design for optimization of GTE-SD pellets.
RunBatchesX1 (GTE-SD Ratio)X2 (Spheronizer Speed (rpm))
1A1−1(1:4)1(1300)
2A21(1:8)1(1300)
3A30(1:6)0(1200)
4A40(1:6)−1(1100)
5A5−1(1:4)0(1200)
6A60(1:6)1(1300)
7A71(1:8)0(1200)
8A8−1(1:4)−1(1100)
9A91(1:8)−1(1100)
Table 3. Characterization of particle size and drug content ofGTE-SD.
SD RatioMean Particle Size (nm)PDIDrug Content (%)
F1219.11.19192.85 ± 0.715
1:4F2211.91.62895.47 ± 1.09
1:6F3198.00.54896.18 ± 0.409
1:8F4402.31.25997.14 ± 1.43
1:10F5403.54.42598.8 ± 0.409
Table 4. Effect of independent variables X1 and X2 on responses Y1, Y2, and Y3.
Factor 1Factor 2Response 1Response 2Response 3
RunBatchesX1: Solid Dispersion RatioX2: Spheronizer Speed (rpm)Y1 (Drug Release (%))Y2 (Drug Permeation (%))Y3 (Geometric Mean Diameter (µm))
1A1−1(1:4)1 (1300)71.3117.18501.6
2A21(1:8)1 (1300)83.5523.84503.1
3A30(1:6)0 (1200)75.4533.27510.4
4A40(1:6)−1 (1100)73.4630.67517.7
5A5−1(1:4)0 (1200)67.4318.18512.4
6A60(1:6)1 (1300)71.3529.46500
7A71(1:8)0 (1200)85.4822.24513.2
8A8−1(1:4)−1 (1100)68.3518.89526.2
9A91(1:8)−1 (1100)79.5820.03528.2
Table 5. Micromeritic properties and drug content of GTE-SD pellets.
BatchesBulk DensityTapped DensityHausner’s RatioCarr’s Index
(%)
Angle of Repose
(°)
Drug Content (%)
A10.883 ± 0.041.11 ± 0.071.25 ± 0.0520.45 ± 2.7422.56 ± 0.15282.85 ± 1.43
A20.912 ± 0.021.28 ± 0.061.40 ± 0.0528.76 ± 2.4330.11 ± 0.20390.47 ± 1.09
A30.837 ± 0.071.15 ± 0.081.37 ± 0.0527.25 ± 2.9022.33 ± 0.32583.56 ± 0.71
A40.849 ± 0.051.11 ± 0.011.30 ± 0.0623.20 ± 1.2129.98 ± 0.09183.80 ± 1.09
A50.837 ± 0.071.12 ± 0.121.33 ± 0.0325.11 ± 2.0927.29 ± 0.32383.33 ± 1.09
A60.883 ± 0.041.20 ± 0.081.36 ± 0.1426.78 ± 2.7728.32 ± 0.18789.04 ± 1.09
A70.837 ± 0.041.08 ± 0.071.28 ± 0.0222.14 ± 1.7735.21 ± 0.28187.85 ± 0.71
A80.845 ± 0.011.16 ± 0.041.37 ± 0.0527.1 ± 2.5125.54 ± 0.35282.37 ± 0.82
A90.787 ± 0.011.15 ± 0.051.46 ± 0.1231.46 ± 2.2629.94 ± 0.89286.18 ± 1.08
Table 6. Comparison of predicted values and experimental values of optimized formulation.
BatchFactorResponsesPredicted ValueExperimental Value
A3X1 GTE-SD ratio (1:6)% Drug release79.2375.45
X2 spheronizer speed (1200)% Drug permeation29.9233.27
Geometric mean diameter501.64510.4
Disclaimer/Publisher’s Note: The statements, opinions and data contained in all publications are solely those of the individual author(s) and contributor(s) and not of MDPI and/or the editor(s). MDPI and/or the editor(s) disclaim responsibility for any injury to people or property resulting from any ideas, methods, instructions or products referred to in the content.

