Article

Exploring the Intricate Connections between the Influence of Fishing on Marine Biodiversity and Their Delivery of Ecological Services Driven by Different Management Frameworks

by
Paloma Alcorlo
1,2,*,
Susana García-Tiscar
1,
María Rosario Vidal-Abarca
3,
María Luisa Suárez-Alonso
3,
Lucía Checa
1 and
Iratxe Díaz
1
1
Department of Ecology, Universidad Autónoma de Madrid, C/Darwin 2, Edificio de Biología, 28049 Madrid, Spain
2
Centro de Investigación en Biodiversidad y Cambio Global (CIBC), Universidad Autónoma de Madrid, C/Darwin 2, Edificio de Biología, 28049 Madrid, Spain
3
Department of Ecology and Hydrology, Regional Campus of International Excellence “Campus Mare Nostrum”—Universidad de Murcia, Campus de Espinardo, 30100 Murcia, Spain
*
Author to whom correspondence should be addressed.
Coasts 2024, 4(1), 168-197; https://doi.org/10.3390/coasts4010010
Submission received: 21 December 2023 / Revised: 16 February 2024 / Accepted: 27 February 2024 / Published: 1 March 2024

Abstract

:
The goal of this project is to assess the state of marine biodiversity in the Natura 2000 marine network in Spain and analyze the impact of fishing policies on it. The study focuses on three marine demarcations in Spain: North Atlantic, South Atlantic, and the Strait of Gibraltar and Alborán Sea. The research uses the DPSIR (Drivers of Change-Pressure-State-Impact-Response) framework, a multi-criteria analysis approach to understand the relationships between biodiversity loss, fishing, marine ecosystem integrity, and the provision of ecosystem services. Our results revealed a significant decline in biodiversity since 1985 in the four marine areas studied; this loss was more pronounced in the Gulf of Cadiz (in Andalusia) and less intense in the northern regions of Spain (Galicia and Asturias). This trend aligns with the global degradation of marine ecosystems and loss of biodiversity caused by human activities. The main drivers behind this decline are economic factors promoting industrial fishing and overexploitation. However, there has been a reduction in the industrial fishing fleet since the 2000s, supported by the European Maritime and Fisheries Fund for transitioning toward sustainable fishing methods. Despite the increase in regulations and the establishment of marine protected areas, these measures have not been effective enough to stop the loss of marine biodiversity. The results highlight the importance of combining administrative measures such as creating marine protected areas and implementing fisheries management regulations with the preservation of cultural services provided by these ecosystems. Successful governance models that involve collaboration between fishermen and decision-makers have been observed in northern Galicia and the Gulf of Cádiz.

1. Introduction

The progress of human societies and technologies has enabled the utilization of diverse coastal and pelagic ecosystems throughout the globe. The emergence of ecosystem services (ESs) associated with marine ecosystems are linked with the provisioning function, but also include regulating and cultural ESs that strongly bind natural systems to human societies such as global climate regulation, recreational activities, or artisanal fishing [1,2]. The importance of these ESs to human populations has increased exponentially over the last century. In 2018, the fishing industry globally achieved a significant milestone by recording the highest production level in history when a staggering 96.4 million tons of marine life including fish, mollusks, crustaceans, and other invertebrates were caught [3], with at least 34.2% of global stocks assessed to be overexploited [3]. This situation worsens considerably in the Mediterranean Sea, where an astounding 83% of the assessed fish stocks are deemed to be overexploited, according to the European Commission’s Scientific Technical Economic Committee for Fisheries (STECF) [4]. The level of exploitation, observed as both a cause and a result, stems from a management strategy centered around exclusively focusing on a “single species”. The primary aim of this approach is to sustainably harvest all populations at their maximum capacity simultaneously.
During the last decades, two main strategies have been implemented to deal with marine biodiversity loss: first (a) the declaration of MPAs, with different levels of permitted fishing activity and focusing on spaces and conservation efforts, and (b) the Ecosystems Approach to Fisheries Based Management (EAFM) for exploited stocks, focusing on fish stocks and resource management. For the last 25 years [5,6,7,8], the establishment of marine protected areas (MPAs) has been highlighted as one of the mechanisms that would allow the development of sustainable fishing [5], thus avoiding overexploitation that, together with the degradation and destruction of the habitat and the invasion of alien species, is one of the greatest threats to biodiversity. In the European Union, MAPs with different degrees of use and exploitation have been an important conservation tool for marine ecosystems as part of the programs established by the Convention on Biological Diversity [9], the United Nations Environment Program [10], the European Habitats Directive [11] and national governments (i.e., the Spanish marine protection law [12]). In addition to MPAs, the EAFM strategy has arisen as a response to the traditional “single-stock” management mode that focused exclusively on the supply service of the fishing activity. This ecosystem approach encompasses evaluating the population of various targeted species and examining potential connections within these populations as well as their interactions with other species. Additionally, it acknowledges the impacts of fishing activities on unexplored biodiversity, the functioning of the ecosystem, and other services provided by the ecosystem [13,14,15,16,17].
The impulse of the Natura 2000 network (Natura 2000) has also been extended to the marine environment. The marine Natura 2000 is made up of three protection figures, two of which were created in the Habitat Directive such as Sites of Community Importance (SCI) and Special Areas of Conservation (SAC), and another created through the Birds Directive known as Special Protection Areas for Birds (SPA). Framed within this legislative context, fishing in Spanish demarcations has been regulated since 1970 by the Common Fisheries Policy (CFP). This policy is periodically modified to mark the quotas that limit the number of each fish species that each country of the European Union can fish. The year 2020 was set as the deadline to achieve sustainable fisheries management. In this way, it should be guaranteed that the fishing sector remains competitive without posing a threat to the environment. However, even though the reformed CFP has led to improvements in the management of EU fisheries and the situation of some marine stocks and fishermen has improved, there has been a failure to meet key deadlines agreed to in the legislation of the EU in 2013, especially those aimed at ending overfishing by 2020; EU fisheries management continues to disregard scientific advice [18]. This is why, in order to achieve the Sustainable Development Goals (SDGs) proposed at Horizon 2030 and guarantee the good environmental status of the seas and oceans, it is necessary to address how to sustainably manage fisheries to allow, on the one hand, the supply of food, high-quality income, and livelihoods for human societies that depend on fisheries, and on the other hand, minimizing negative effects on biodiversity. In fact, the robustness of food webs facing certain disturbances determines the responses of the communities and the extinction of species, affecting to a greater or lesser extent the cascade of derived events [19]. Mapping the spatial structure of food webs can assist in predicting the impacts of global changes in biodiversity as most species exhibit irregular, unequal, and non-overlapping distributions across time, regions, and ecosystems. Varying interactions between species across these factors necessitate a comprehensive understanding of their distribution patterns [19].
The general objective of this work was to analyze the relationships between the state of marine biodiversity, its relationship with the supply of ecological services, and the impact of the different fisheries policies at the European, state, and regional level on the conservation of marine biodiversity. Specifically, we evaluate the fishing supply service and its trend in the Natura 2000 network sites of three marine demarcations of Spain from 1985 to the present and explore the effect of the trend of fishing policies implemented at different scales (European, national, and regional) on the state of marine biodiversity.

2. Materials and Methods
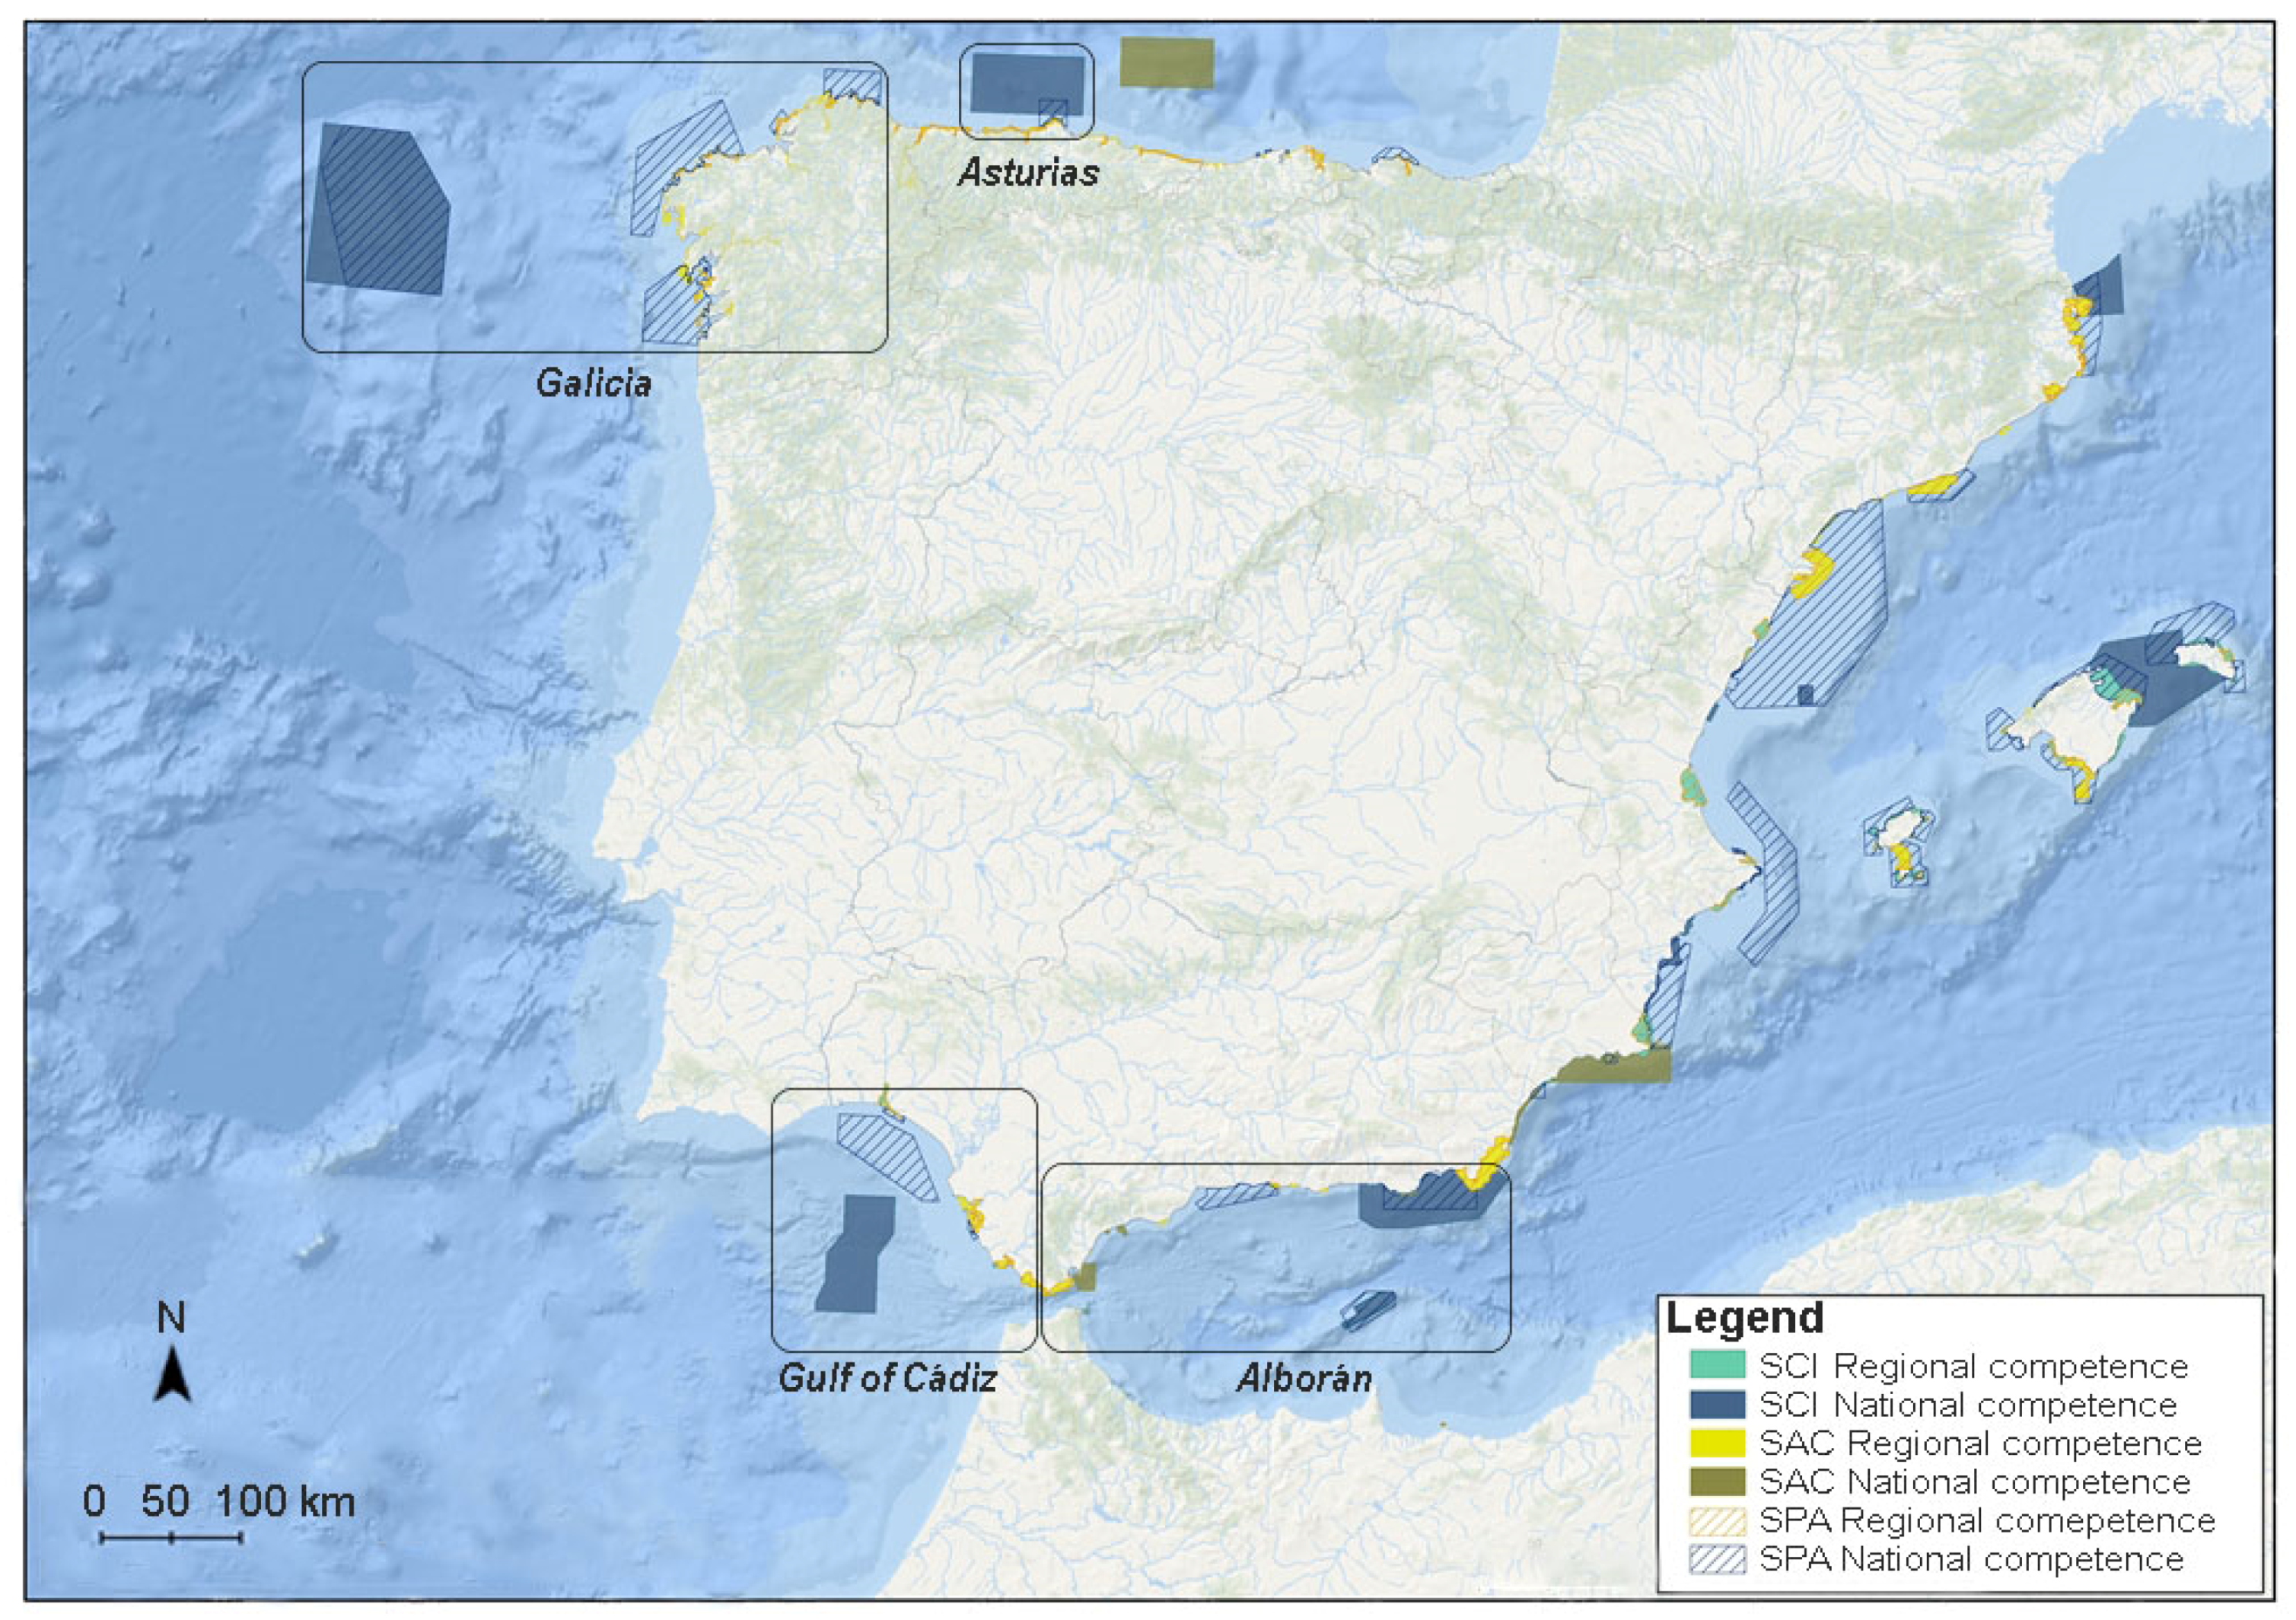
2.1. Study Area

This study was carried out in different protected areas of the Natura 2000 network belonging to four contrasting marine regions (i.e., Golfo de Cádiz, Alborán, Galicia, and Asturias, Figure 1) of three marine demarcations of the Iberian Peninsula (D. of Strait and Alborán, D. South Atlantic, and D. North Atlantic). The complete list of protected area spaces is summarized in Table 1.
The two areas included in Andalusia are critical hotspots for the conservation of biodiversity [20,21,22]: (i) the Alborán Sea, and (ii) the Gulf of Cádiz.
The Alborán Sea, situated in the far western part of the Mediterranean, is renowned for its exceptional productivity due to a combination of oceanographic, physiographic, and climatic factors. This is primarily due to its location between two bodies of water, the Atlantic Ocean and the Mediterranean Sea as well as its intricate landscape. The continental shelf in this area is relatively narrow, measuring about 5 km in width and having an average depth of 100 m. The sea is divided into two separate sections known as “sub-basins” by an underwater ridge that runs from southwest to northeast. This ridge emerges at the northeast end of the sea, creating the island of Alborán. The western sub-basin has an average depth of 500 m, with its deepest point reaching 1300 m. In contrast, the eastern sub-basin has depths ranging between 1800 and 2000 m and is separated from the Algerian-Balearic Basin by a steep slope measuring 500 m [23]. The Strait of Gibraltar connects the Alborán Sea with the Atlantic Ocean, the exchange of Atlantic and Mediterranean waters at different depths generates two anticyclonic gyres that act as the hydrological engine of the area. These conditions give rise to deep water masses that are consistently abundant in nutrients, varying in depth according to weather patterns but never completely disappearing. As a result, the Alborán Sea boasts regions of immense richness, making it one of the most productive areas in the entire Mediterranean. Its primary productivity can reach up to 150 mg/m2 [24,25,26,27].
The Gulf of Cádiz can be found on the Atlantic side of Andalusia. The width of its continental platform varies, being wider in the central area (around 50 km from the coast at a depth of 100 m) and narrower as it gets closer to Portugal and the Strait of Gibraltar. The continental slope follows a bathymetric curve of 200 m and is gently sloping, mostly composed of sandy materials. However, it also features more intricate terrain including canyons and ravines that correspond to the mouth of the Guadiana River. The Gulf of Cádiz is home to three abyssal plains that are over 4300 m deep, separated by seamounts. Two notable features of interest are the mud volcanoes located in the middle slope’s central sector at depths ranging between 700 and 1100 m and the carbonate deposits that form chimneys. These chimneys expel methane gas, creating unique ecosystems that predominantly rely on this gas for their metabolism [28].
The rocky and rugged Galician coast is furrowed by a series of estuaries delimited by inlets and cliffs. The continental platform extends about 40 km from the coast and from there, the continental slope appears, which increases in depth abruptly [29]. It is a very productive area due to the mixing of waters due to the outcrops that exist from May to September, accentuated by the confluence of two Atlantic currents, the subpolar and the subtropical, and the contributions of nutrients from the estuaries. In winter, the ocean currents are warm in the areas of the edge of the slope, which contributes to producing the pattern of the mixing of waters. The seabeds are home to well-developed and structured plant communities where kelp formations and fucal algae predominate.
The areas of Asturias included in the study present a very different geomorphology with respect to the Galician ones. The Avilés canyon system presents funds with a complex structure due to the tectonic activity that compresses the continental platform of the Cantabrian Sea, which has a variable width of 12 to 40 km, giving rise to three large submarine canyons, a marginal platform, and a rocky structural high [30]. Canyons are systems of high biological productivity because they play an important role in the transport mechanisms of sediments and organic matter from the continental platform to the deep areas of the abyssal basin of the Bay of Biscay and contribute to the existence of deep water upwellings. This resuspension of sediments favors the development of sessile communities characteristic of reefs, with numerous species of cold-water corals and sponges [31,32]. The high productivity makes it a breeding and recruitment area for numerous species of fishing interest [33], and it is an area exploited by predatory cetaceans [34].

2.2. Building the DPSIR Model

To explore the relationships and interconnections between the loss of biodiversity, fishing, integrity of the marine ecosystem, and provision of ecosystem services (ESs) of the Natura 2000 sites under in each study marine demarcation (North Atlantic, South Atlantic, Strait and Alborán) of the Peninsula, we used the conceptual framework of the ‘Drivers of Change-Pressure-State-Impact-Response’ multi-criteria analysis (hereinafter referred to as DPSIR). It is a very efficient method to evaluate the complex relationships between the descriptors of the environmental state (ecosystems and biodiversity) and human systems (human well-being), analyzing the causes, consequences, and responses to changes [35].
The DPSIR approach has provided a satisfactory ecosystem assessment tool for the last decade [35,36], especially for marine ecosystems [37,38,39,40,41,42,43]. It provides a methodology to analyze the causes, consequences, and responses to changes in ecosystems in an organized way [37,39]. Drivers are the factors that induce environmental change (for example, demographic, economic, and cultural). These drivers promote pressures that affect marine ecosystems (e.g., overexploitation and land use changes). These pressures alter the changes in the state of marine ecosystems and their biodiversity and affect the delivery of ESs to society (e.g., richness of fished species, richness of non-fished species, and number of species under conservation threatened in the categories of IUCN Red List; [44]). Consequently, impacts on human well-being are considered changes in ES delivery and human well-being. Finally, the answers are the institutional actions carried out to preserve the integrity of marine ecosystems and their biodiversity or to prevent and/or mitigate the effect of the drivers of change. It is expected that the increase in the number and type of fisheries management regulations and conservation policies over time will contribute to improving the global conservation status of biodiversity in the MPAs studied. To this end, it is necessary to carry out a review and inventory of the indicators related to the different thematic blocks of the DPSIR (Figure 2).

2.3. Data Acquisition

The collected indicators were chosen following these characteristics: (1) indicators that contain strict and contrasted information to detect changes; (2) explicit temporal indicators, which means that trends can be measured through a given time frame (1985–2019); (3) the indicators are scalable and quantifiable, and can be easily integrated and compared at different scale levels; (4) the indicators come from official and freely accessible databases and statistical repositories (Tables S1.1–S1.3 in File S1). Databases of different administrative entities (Ministries of Agriculture and Fisheries, of the Environment, and of the autonomous governments of Andalusia, Galicia, and Asturias), MITECO, MAPA, IEO, EU, INE, IUCN, and ICES were consulted. In some cases, data were requested from associations (e.g., CEMMA (Coordinadora para o Estudo dos Mamíferos Mariños) that facilitated the Banco de Galicia cetacean censuses).
For the fishing statistics, different databases were generated in Excel of the biomass that landed in the markets of the provinces in each study area (Andalusia separated into the Gulf of Cádiz and Alborán, Galicia, and Asturias). The database included the amount of total annual biomass fished (kg) by species from 1985 to 2019 in Andalusia, since there are accessible data for Galicia (2001) and Asturias (2004). The scientific name of each species, common name, FAO code, habitat it occupies, and functional trophic group to which it belongs were included. These data were contrasted with different sources such as the European search engine, the Official State Gazette (BOE), Fishbase, FAO (ASFIS), etc. In parallel, the data referring to the average annual price and total annual profits registered for each species per auction were obtained. These data were considered the provisioning service indicators.
The indicators of the industrial and artisanal fishing fleet were obtained from the European fishing registers, which list the number of fishing vessels, their power (amount of work that an engine can generate in one second of time, measured in kW) and its tonnage (total size of a ship, measured in GT). In all of these cases, the records began in 1990, so this is where the historical series began for this set of variables studied. These data were considered part of the cultural service indicators.
The data of the presence, abundance, distribution, and conservation status of the majority of the non-fishable taxonomic groups (i.e., vertebrate species: sea birds, sea turtles, and cetaceans) throughout the historical series under study were incomplete, which prevented the complete modeling of the ecosystem. Additionally, although we found little information of the presence of cetaceans, birds, and sea turtles in marine areas [34,45,46,47,48,49,50,51,52,53,54,55,56], we included them in the analysis when possible. It is important to note that all of the biomass data for exploited species utilized in this study solely represent the landings of commercially caught species and should not be considered an accurate reflection of the total biomass extracted from the ocean as it excludes discards, illegal, and recreational fishing due to the lack of official databases.
The temporal evolution of the fishermen’s confraternity and NGOs linked to the fishing sector was reconstructed from finding out what year each one was founded individually by means of telephone calls to the markets and/or bosses responsible for each of the fishermen’s confraternities, thus facilitating the general perspective and historical series of expansion of these local corporations and other associations of fishing professionals and aquaculture producers (Tables S1.1–S1.3 in File S1). Data regarding the presence of women in the fishing sector were very difficult to obtain. For this, a formal request was made to the Social Institute of the Navy. The data provided was completed and contrasted with other records obtained from the official statistical offices of each autonomous community as well as those provided by the different women’s associations (Tables S1.1–S1.3 in File S1). These data were considered part of the cultural service indicators.
Other indicators related to cultural services were identified with companies dedicated to whale watching and diving centers, and marine research centers, museums, and interpretation centers. On numerous occasions, it was necessary to resort to the individual contact of each entity to obtain data on the year of creation necessary to construct the time series under study. In other cases, it was easily obtained from the companies’ own web pages or from the official register of companies and centers of each autonomous community (Tables S1.1–S1.3 in File S1).
Information on the regulations, norms, and laws related to fisheries management at a European, national, and regional level were obtained from official legal search engines as well as from official bulletins: the Official State Gazette (BOE), the Official Gazette of the Principality of Asturias (BOPA), the Official Gazette of Galicia (DOG) and the Official Gazette of the Andalusian Government (BOJA). These regulations include closed seasons, catch quotas, minimum sizes, landing methods, aid programs, sector and worker regulations, regulations on permitted fishing gear, and censuses, among others (Tables S2.1–S2.9 in File S2).
The regulations, norms, and laws related to the conservation of species and spaces included were those related to MPAs, management plans, fishing restrictions for specific species as well as regulations that affect marine biodiversity in general. In addition, information was gathered on the Natura 2000 network areas included in the study area (year of creation, area included, governance) over time since 1985 as well as the legislation that established its inauguration and protection (Table S3.1–S3.4 in File S3).
Once the information on the fishable and non-fishable marine species in each study area had been compiled, the threat categories of each species were reviewed to analyze the evolution of the threat categories throughout the time series of the study (1985–2019). At the international level, the category was awarded according to the global, European, and Mediterranean IUCN Red List; at the national level according to the “List of Wild Species in Special Protection Regime Spanish Catalog of Threatened Wild Species” (LERSPE from now on); and at the regional level, the Red Lists and Catalogs of threatened species of the autonomous communities of Asturias, Galicia, and Andalusia were reviewed (Tables S1.1–S1.3 in File S1).
In total, we compiled a database with 58 indicators for Andalusia. Ten of the indicators were related to biodiversity loss, two to ecosystem integrity, five to SE (one supply, four cultural, and two regulatory), four to drivers (one demographic, two economic, and one cultural), and four with pressures (three from overexploitation and one from land use change). Finally, the indicators included in the responses were also compiled at the national (12) and international (14) scales, of which 14 were included in management responses and 17 in conservation responses (Figure 2 and Tables S1.1–S1.3 in File S1).
For Galicia, 100 indicators were collected: 33 drivers, 4 pressures, 22 on the state of biodiversity loss, 9 ecosystem services, and 29 responses (4 conservation and 25 management). For Asturias, 97 indicators were compiled: 30 drivers, 4 pressures, 33 on the state of biodiversity loss, 9 ecosystem services, and 18 responses (4 conservation and 14 management) (Figure 2 and Tables S1.1–S1.3 in File S1).

2.4. Analysis of the DPSIR Model

In each of the four marine areas under study, the interactions between indicators of the different components of the DPSIR were analyzed. From the list of available indicators explained in the former paragraph, the best ones were selected for each area including local and regional indicators (Figure 2 and Tables S1.1–S1.3 in File S1). In order to verify the ecological significance of the evaluated DPSIR component, all indicators were standardized by subtracting the mean from each value and dividing by the standard deviation. Subsequently, the overall trends of these indicators in the studied time series were analyzed to determine whether they consistently contributed to explaining the environmental impact. For example, the indicators selected for the state of biodiversity increased with the loss and degradation of biodiversity; in these cases, they were multiplied by (−1); in this way, the numerical tendencies coincided with the biological meaning. Afterward, linear regressions were performed for the time series of each indicator and the estimated slope was used to assess its trend. The trend of each indicator was classified into five categories based on the criteria established by Santos-Martín et al. [35]: (1) highly improved (↑↑) when the slope of the regression models was greater than 0.08; (2) improved (↑) when the slope of the regression models was between 0.08 and 0.04; (3) stable (↔) when the slope was between 0.04 and −0.04; (4) decreased or worsened (↓) when the slope was negative and between −0.04 and −0.08; (5) it became much worse (↓↓) when the slope was less than −0.08.
Subsequently, and following the suggestions of Floridi et al. [57] for the quantitative analysis of indicators, the set of indicators of each component of the DPSIR was added, calculating their arithmetic mean to reduce compensation for poor performance in specific indicators that showed high values in others (Figure 2). In total, 12 integrated indices were obtained. For the “driver” of the DPSIR dimension, we used three integrated indices: demographic, economic, and cultural. For the “pressures” of the DPSIR dimension, we used two integrated indices: overexploitation and land use change. To analyze the “status” of the DPSIR dimension expressed as biodiversity loss, we used two integrated indices: “exploited marine biodiversity” expressed as the richness of fished species and “threatened biodiversity” expressed as the number of species under threatened conservation categories in the IUCN Red List, national and regional red lists. For “impacts”, we explored the loss of ecosystem services (provisioning, regulating, and cultural). For the ‘responses’ of the DSIR dimension, two integrated indices were used: ‘management’ and ‘conservation’ (see Figure 2 and Tables S1.1–S1.3 in File S1 for more detail).
The relationships between the indicators (synergistic or antagonistic) included in the DPSIR dimensions were analyzed through multiple Pearson correlations performed between the mean values of the indicators of each DPSIR dimension. Then, the relationships between the aggregate indicators were analyzed using Pearson’s multiple correlations. Prior to analysis, all variables with no variation across the time series (i.e., all coding values were the same) were removed and missing data were imputed using the nearest neighbor algorithm. All statistical analyses were performed with XLSTAT 2020.4.1.
To facilitate the understanding of the results of the analysis, the marine areas of the south will be compared, and then those of the north; the Gulf of Cádiz and Alborán will be presented first, and then Galicia and Asturias.

3. Results

3.1. Results of the DPSIR Analysis for the Gulf of Cádiz and Alborán

Trends of the Mean Values of the Indicators of Each DPSIR Dimension

The results of the analysis of the indicators showed similar patterns in both marine areas for drivers and pressures, but they exhibited differences mainly in the dimensions of impacts and responses.
For the Gulf of Cádiz, the strongest and most negative correlation was found between the state of biodiversity and the responses given by society and policy-makers (−0.927; Table 2), which shows that there has been a continuous decline in the biodiversity despite increased management and conservation responses. Furthermore, the drivers were also negatively correlated with biodiversity (−0.726). The impacts and pressures were negatively correlated (−0.376), shedding light on the interactions between overexploitation and the transformation of the coast due to land use change in the provision of ecological services.
In the Alborán Sea, there was also a negative relationship between biodiversity and the responses and with the drivers, but in both cases, it was slightly weaker (−0.873 and −0.638, respectively, Table 2) than in the Gulf of Cádiz. The impacts and responses were also negatively correlated (−0.765), which indicates the lack of efficiency of management plans and conservation actions to preserve the supply of ecosystem services. In the Gulf of Cádiz, the drivers and responses improved throughout the time series studied; the pressures and impacts remained stable, and the state showed an extreme decreasing trend. In contrast, in the Alborán Sea, the drivers and pressures showed a stable trend throughout the time series, the state and impacts decreased, and the responses improved (Table 3).

3.2. Aggregated Indices Trend for the Gulf of Cádiz and Alborán

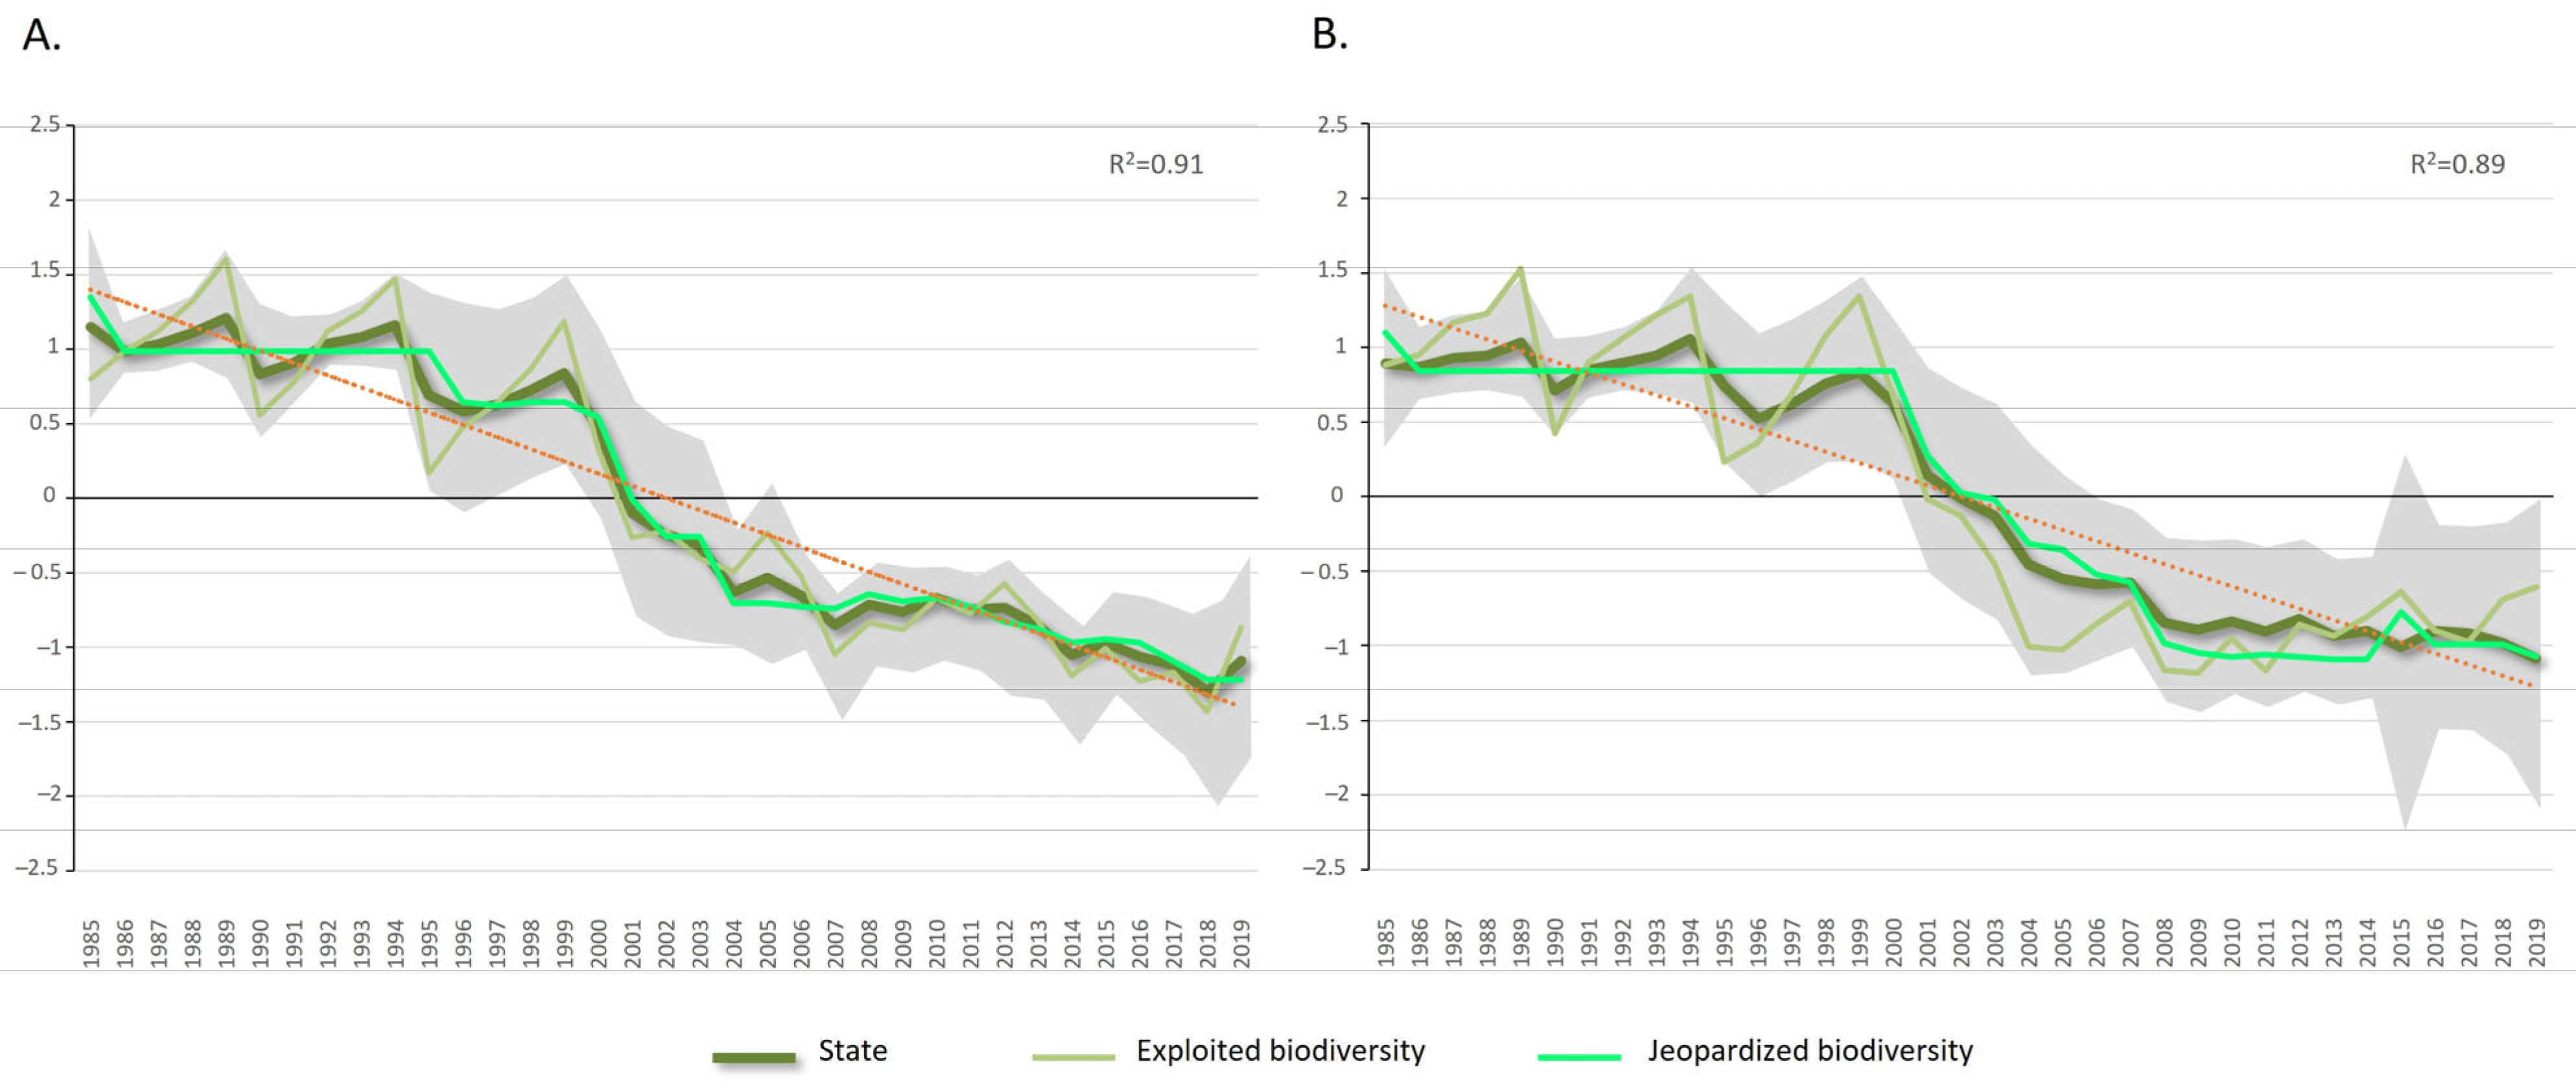
3.2.1. State of the Marine Biodiversity of the Gulf of Cádiz and Alborán

The state of biodiversity has greatly worsened in the Gulf of Cádiz and worsened in the Alborán Sea over the study period (Figure 3 and Table 4). In both marine regions, the integrated indices expressed as exploited biodiversity and threatened biodiversity have continuously decreased since 1985.

3.2.2. Impacts of the Gulf of Cádiz and Alborán Sea

The temporal trend of the ESs was stable in both areas but decreased or worsened in the Alborán Sea (Figure 4, Table 3). The ES supply decreased in the Gulf of Cádiz and strongly decreased in the Alborán Sea. The rest of the ESs remained stable in both areas except for the regulation ES in the Gulf of Cádiz, which also showed a strong downward trend (Table 4). The inflection point detected in 1999–2000 for the drivers was also found for the supply and regulation ES in the Gulf of Cádiz.

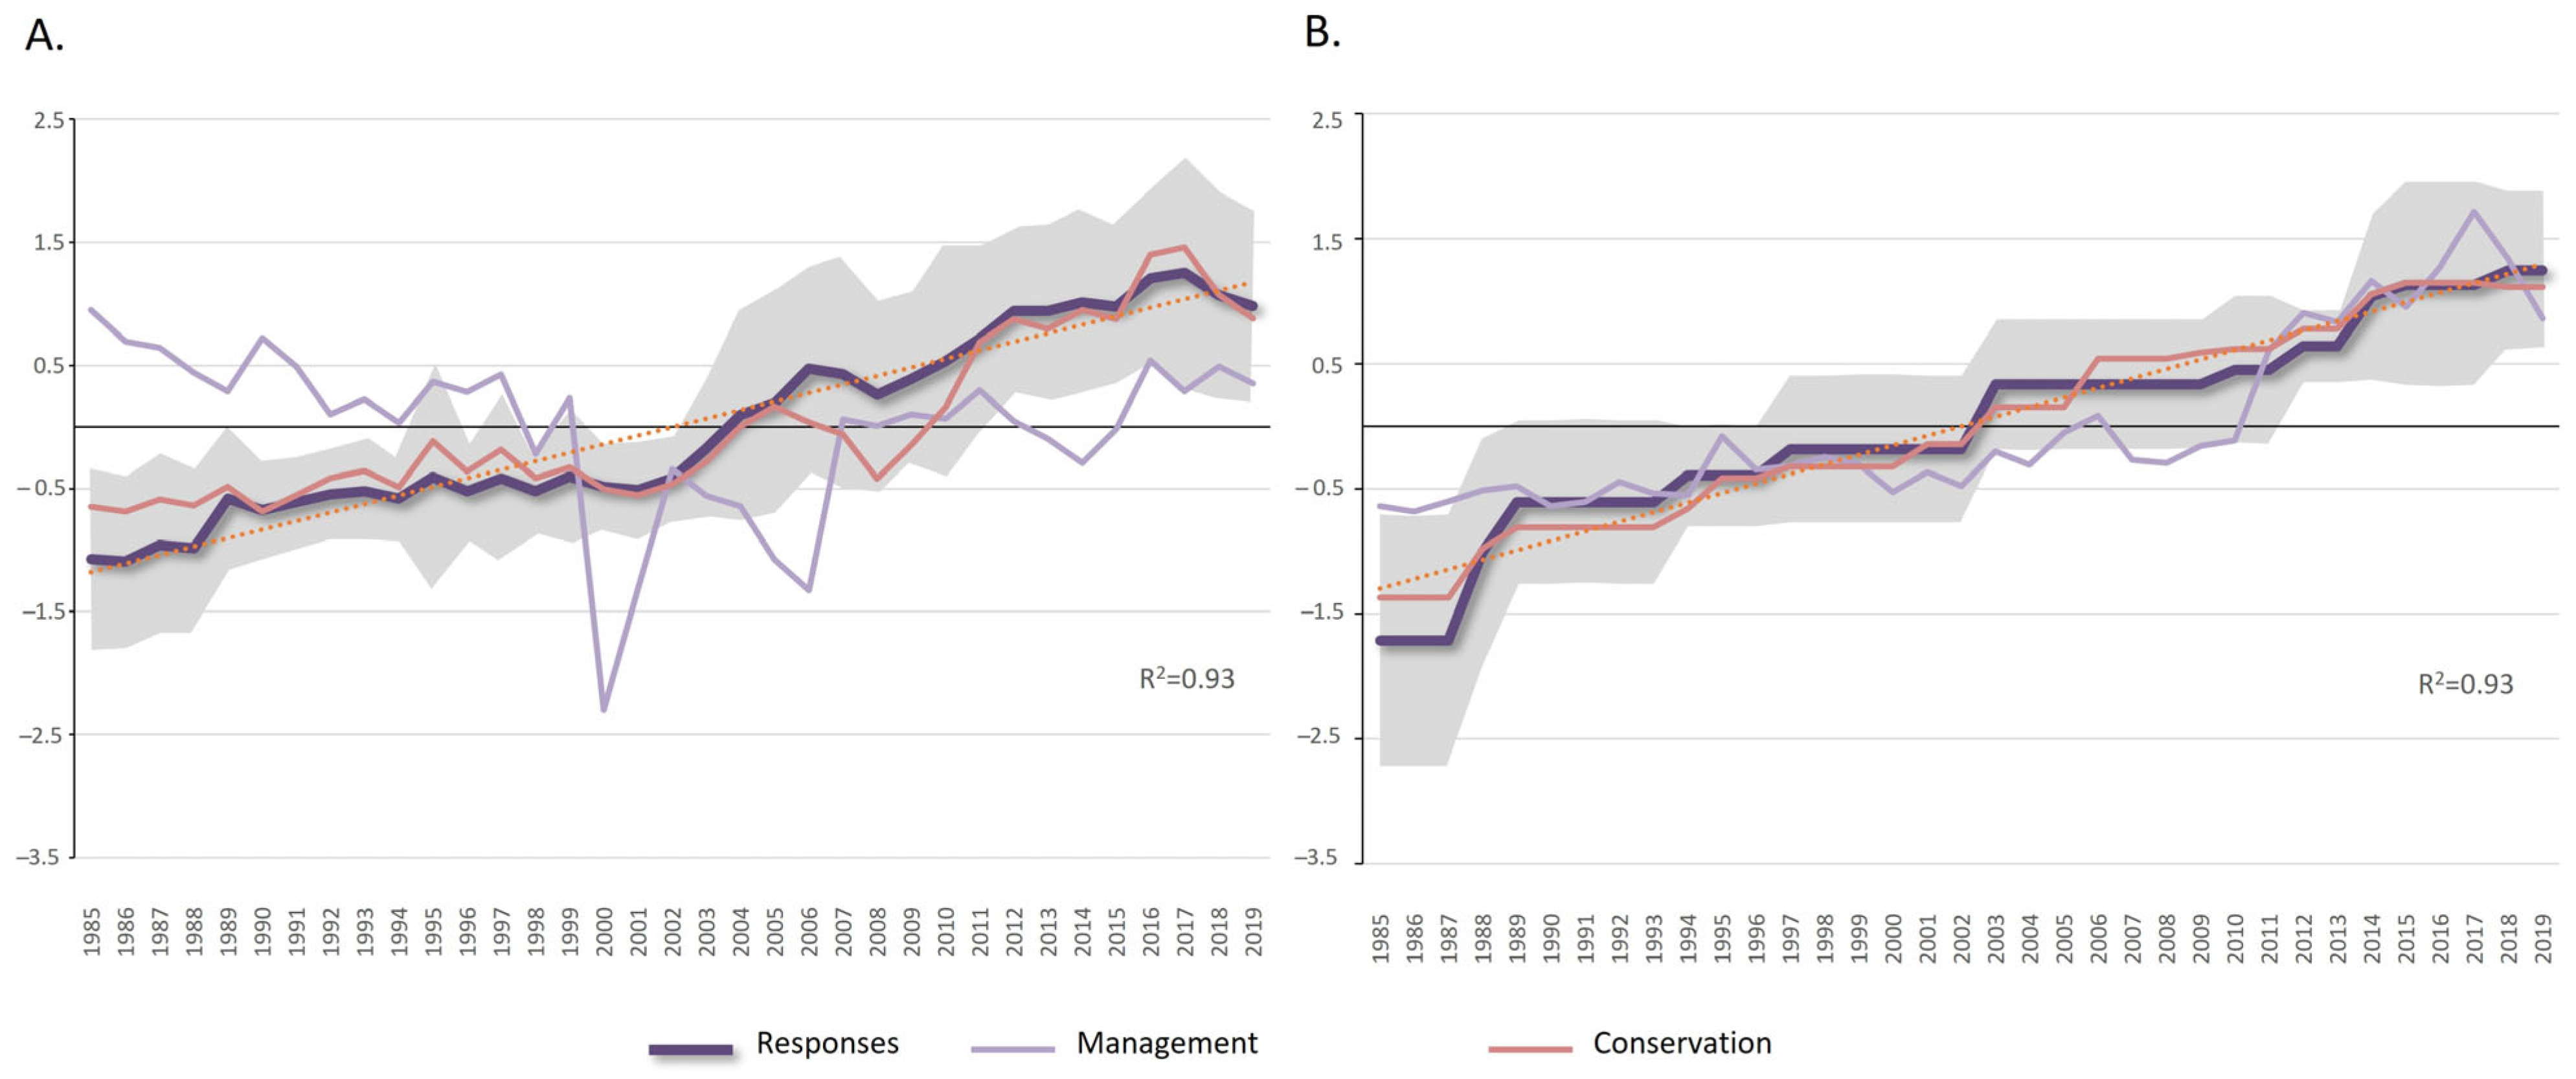
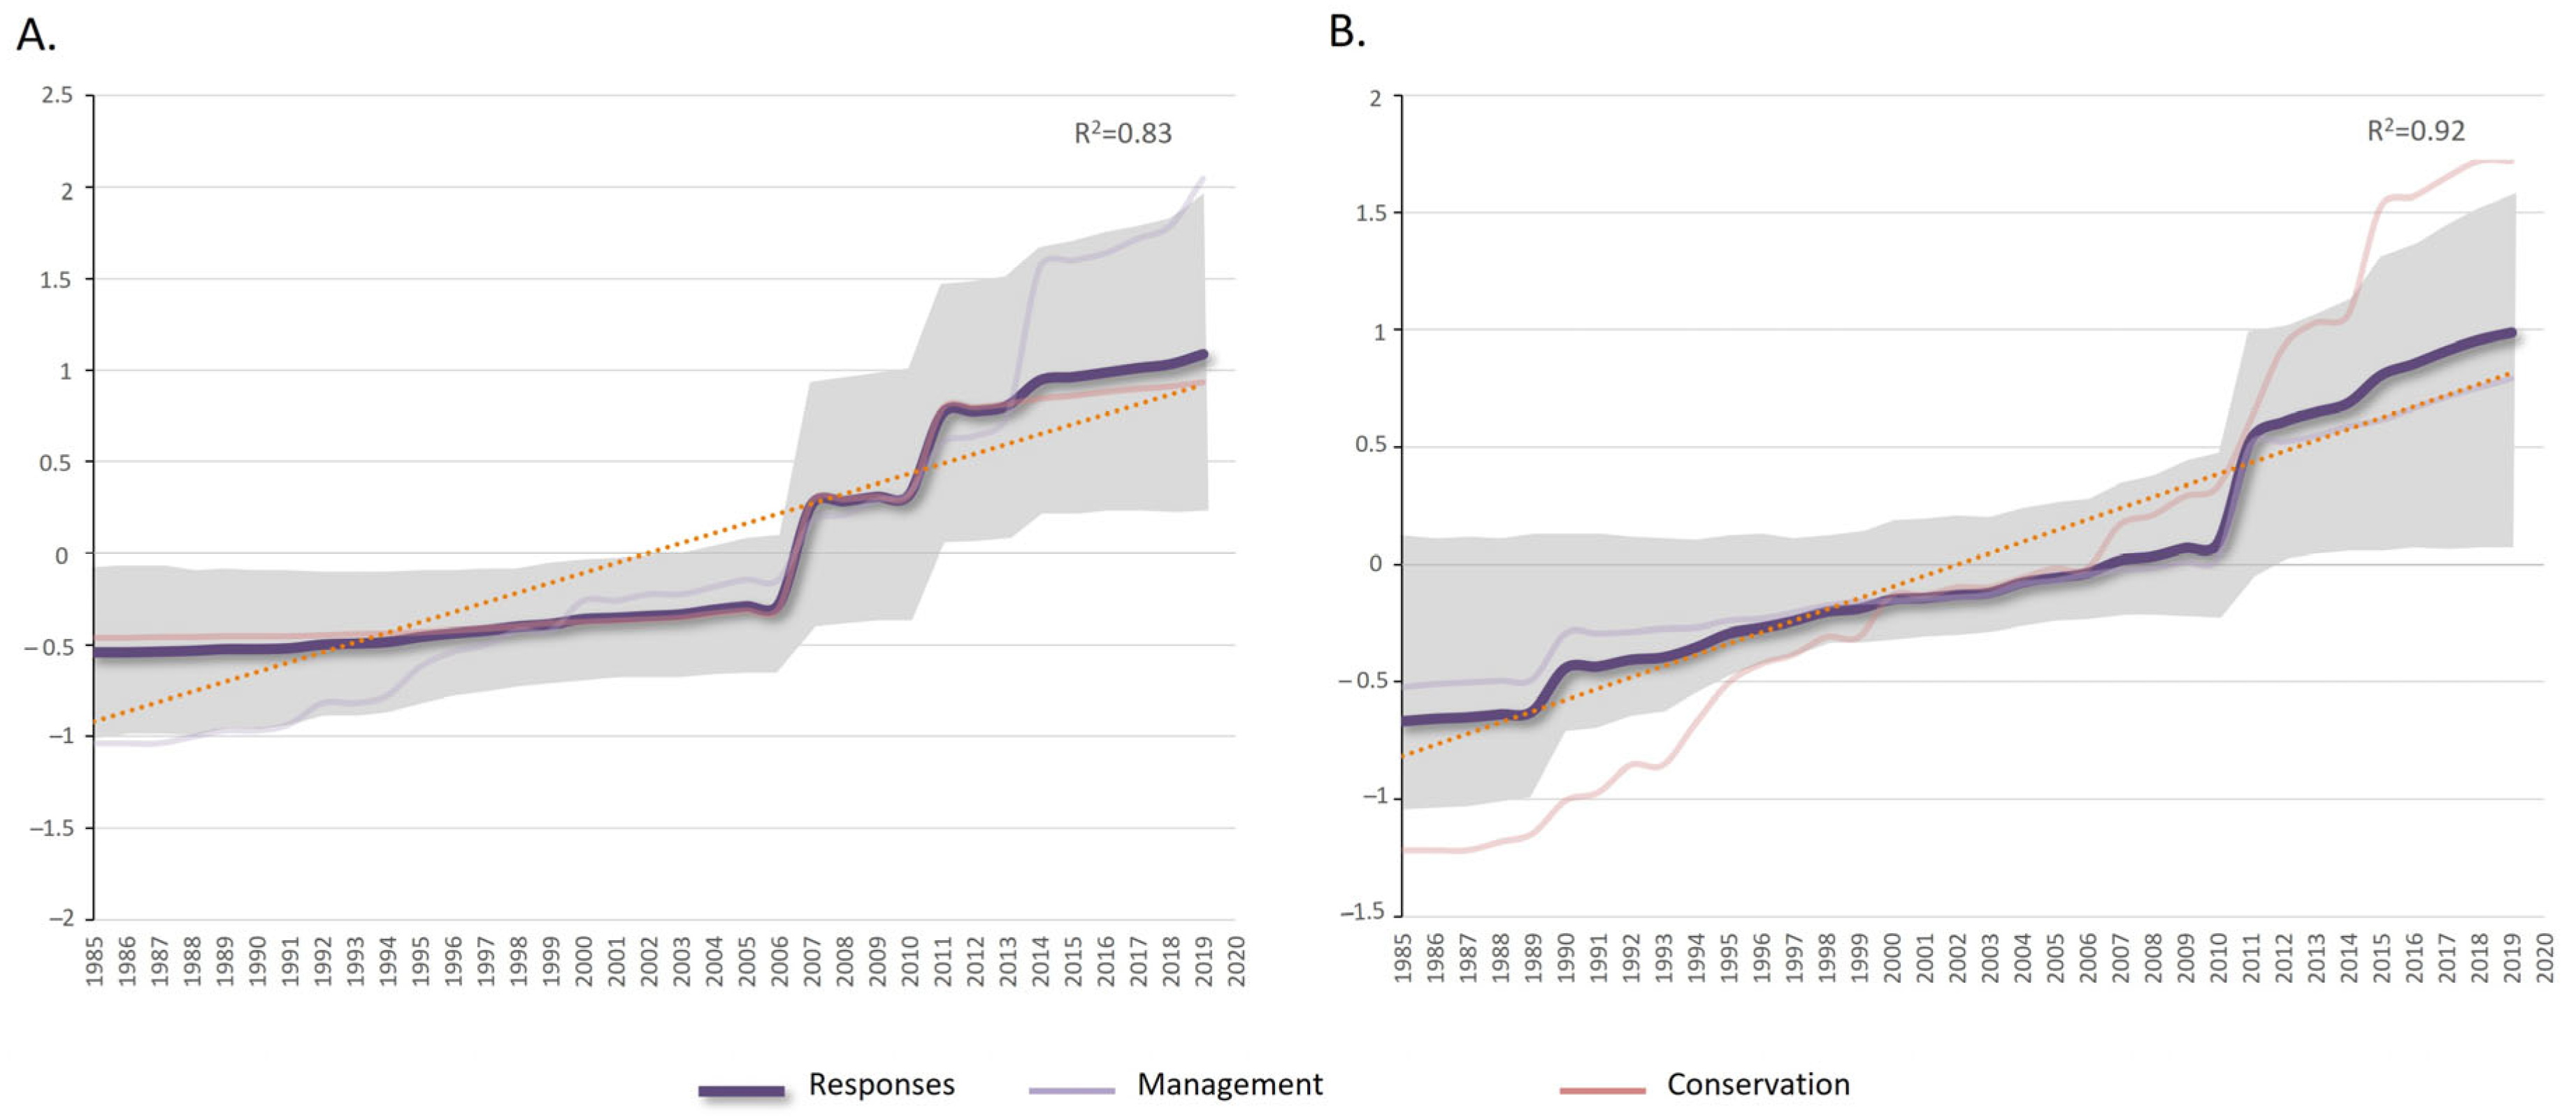
3.2.3. Responses of the Gulf of Cádiz and Alborán

In both areas, the overall trend of the indicators included in the responses improved over time, as did their integrated indices, except for the conservation responses based on the development of marine protected areas in the Gulf of Cádiz, which greatly improved (Figure 5 and Table 4). The integrated index that includes actions and management plans had a turning point in 2000 in the Gulf of Cádiz as a consequence of the non-renewal of the fishing agreement with Morocco and its relationship with the number of its species and the fishing regulations involved. In addition, another turning point was the period of 2009–2010, when the implementation of new protected marine areas belonging to Natura 2000 began including their corresponding Sites of Community Importance (hereinafter SCI), Special Protection Areas (SPA), and Special Areas of Conservation (SAC) (2009 in the Gulf of Cádiz and 2010 in the Alborán Sea as explained by the WWF (World Wildlife Fund) [58].

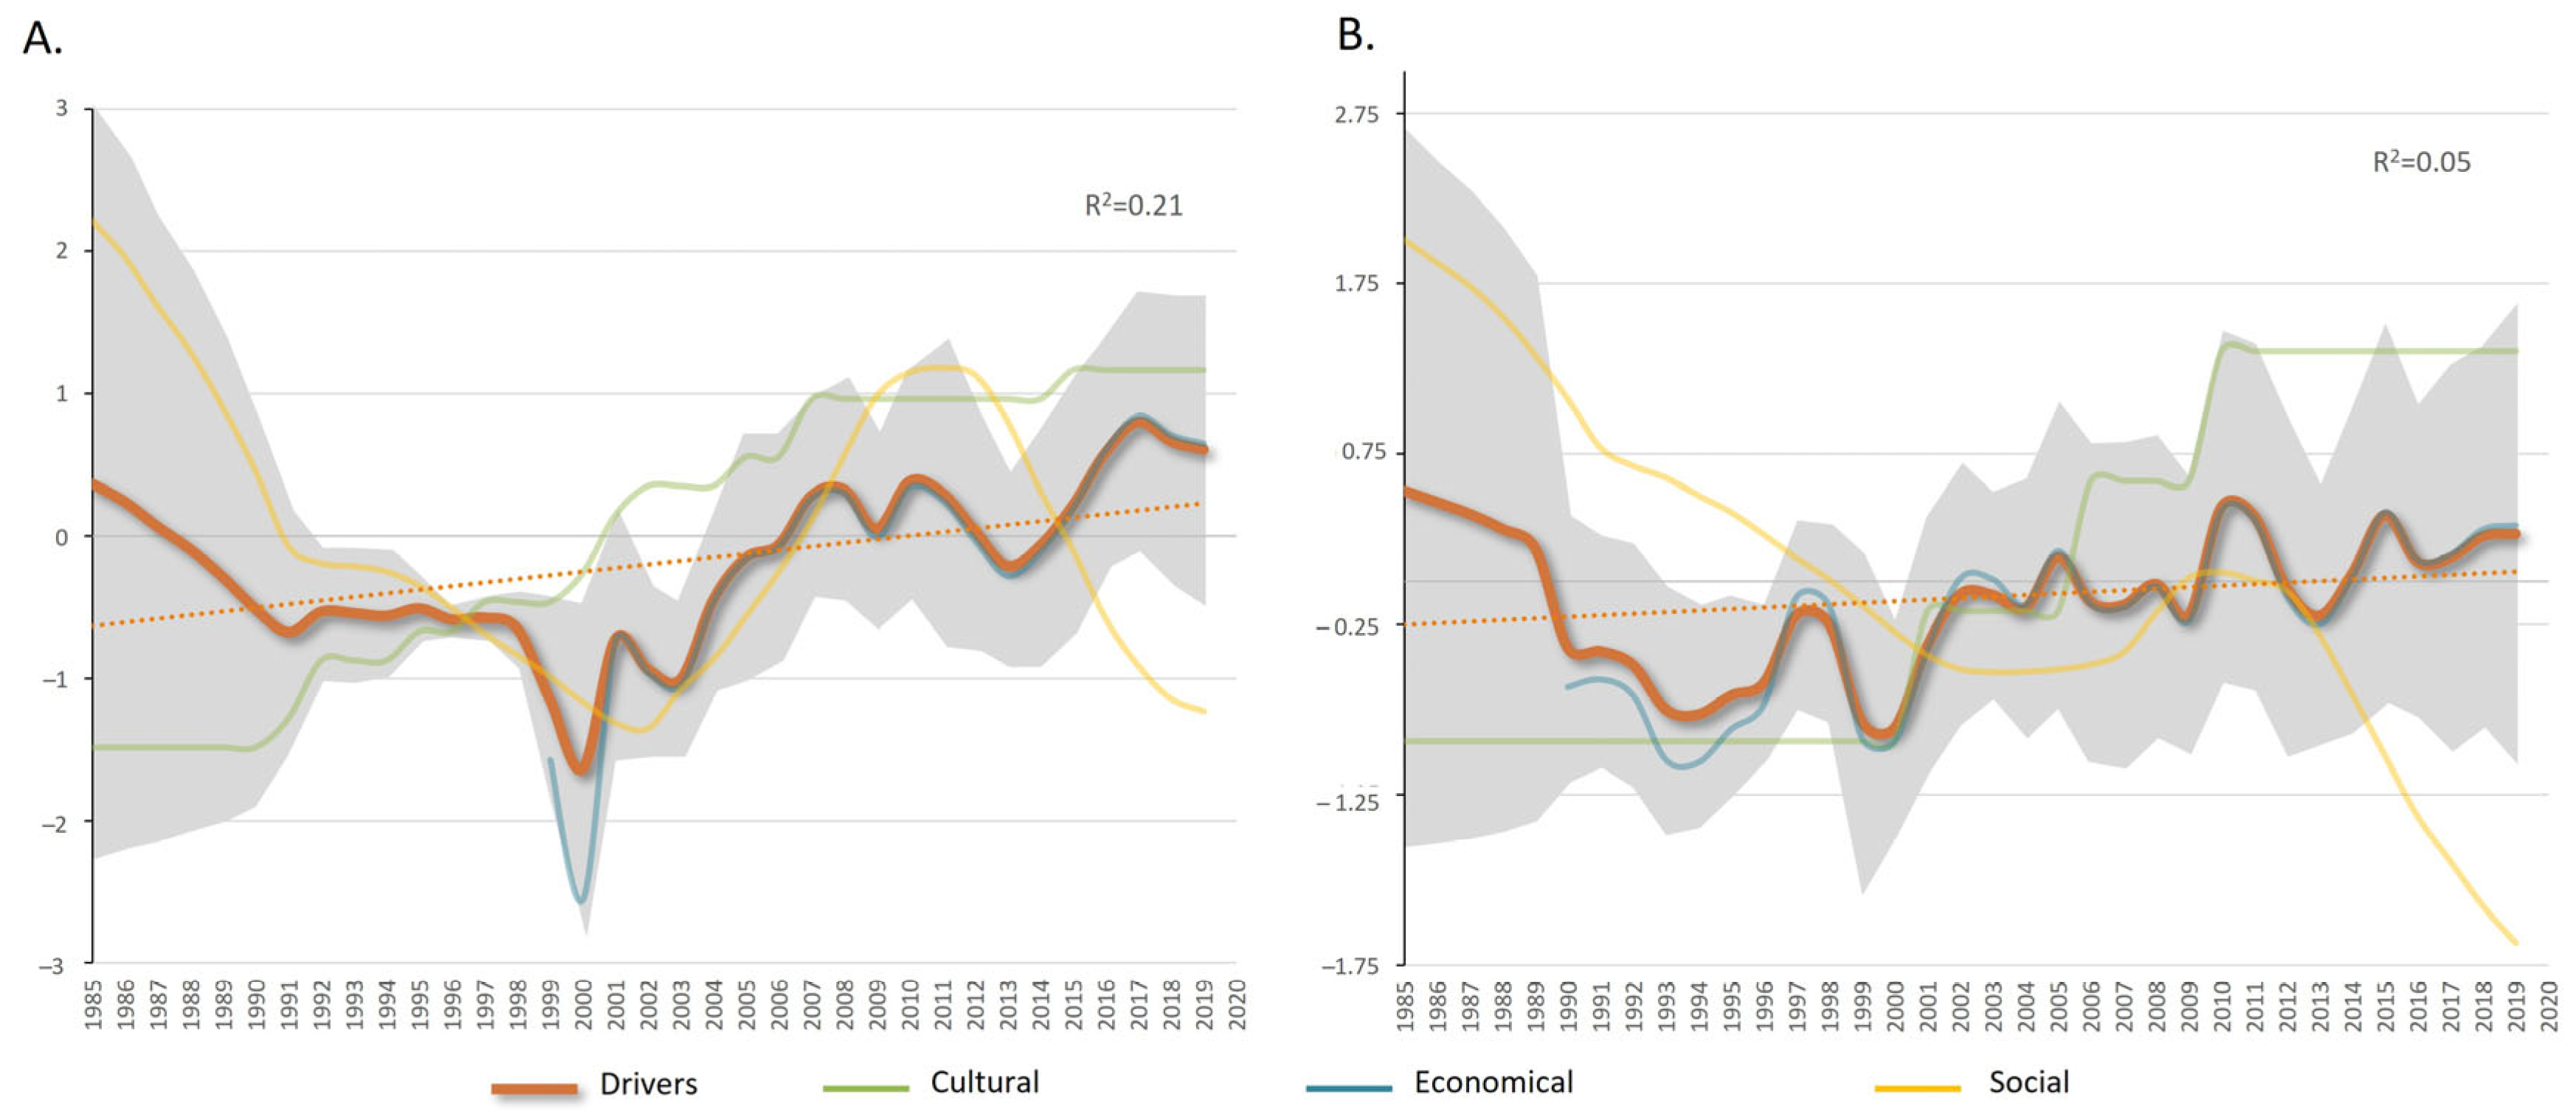
3.2.4. Drivers of the Gulf of Cádiz and Alborán

The overall trend of the mean indicators included in the drivers as well as the pattern of their aggregate social, economic, and cultural indices were similar, but when the slopes were considered (Table 3), we could appreciate differences. The drivers in the Gulf of Cádiz improved throughout the study period while they remained stable in the Alborán Sea (Figure 6). However, the pattern of improvement was shared in both places, with a notable decrease in economic and cultural factors with two contrasting turning points. Both indicators, the first, 1999–2000, and the second, since 2008, had a close relationship with the economic characteristics. The social drivers continued to increase following the trend of the population growth rate (Table 4).

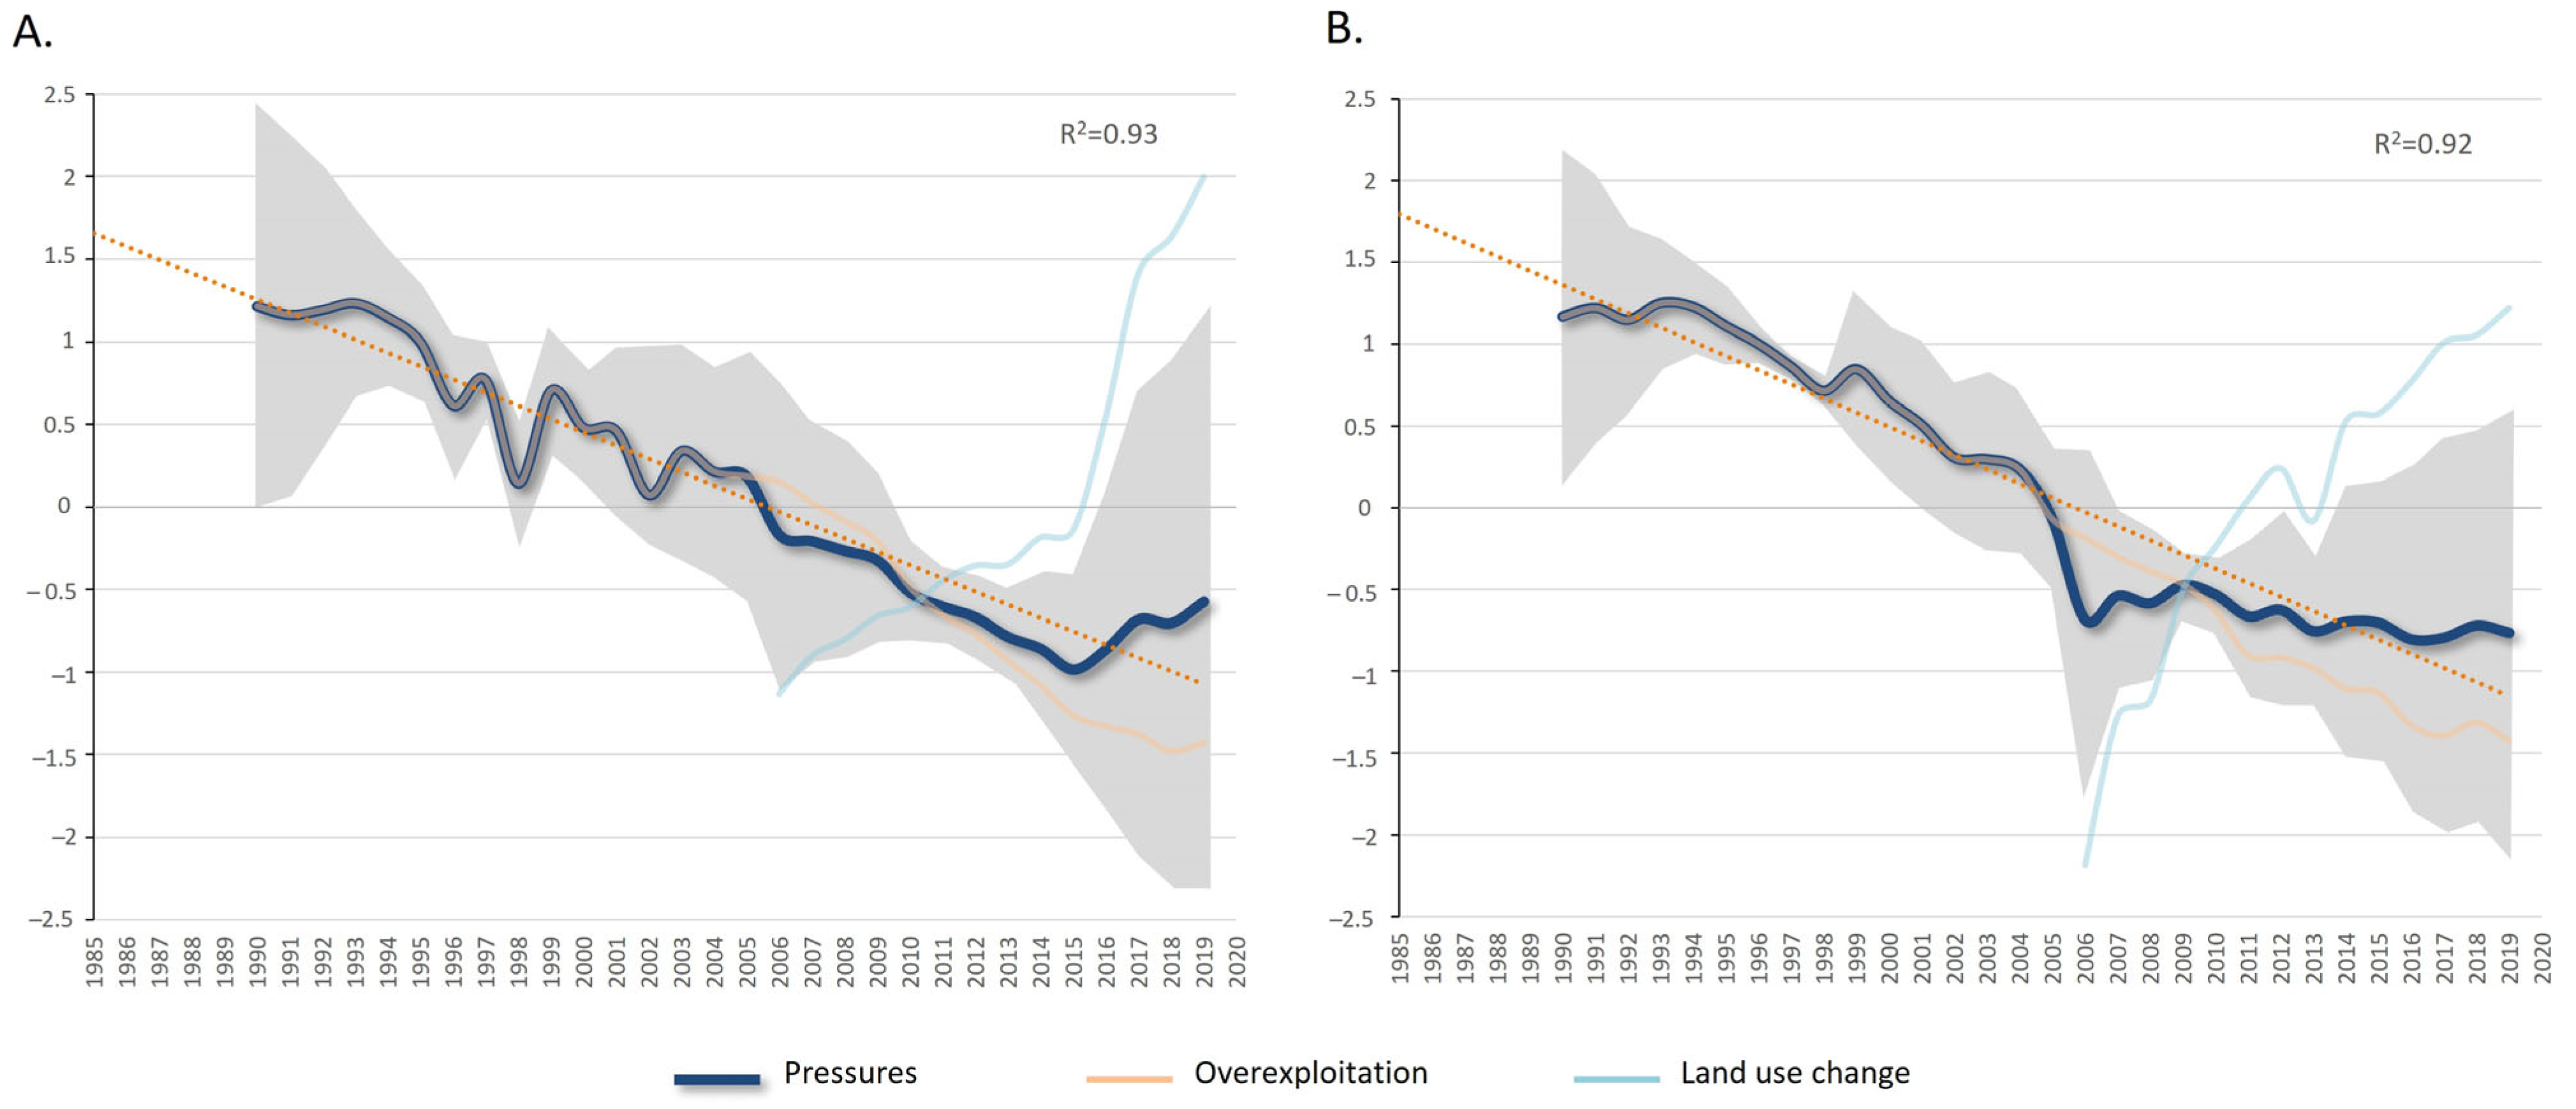
3.2.5. Pressures of the Gulf of Cádiz and Alborán

The general trend of the average indicators included in the pressures and the trend of the integrated ones in overexploitation (i.e., industrial fishing fleet) and spatial transformation of the coast (i.e., number of ports) followed the same stable pattern in both study areas (Table 3). The overexploitation indicator decreased over time, while the spatial transformation of the coast increased over time. As a result, no clear trend of pressures over time was found (Figure 7 and Table 4).

3.2.6. Correlation Analysis Results of the Gulf of Cádiz and Alborán

Pearson’s correlation analysis showed significant relationships between the integrated indicators of the DPSIR framework in each marine region studied (Table S4). In the Gulf of Cádiz (Table S4), threatened or jeopardized biodiversity presented a high negative correlation with both the actions carried out to improve the conservation of biodiversity, action and management plans (−0.808), and with the development of marine protected areas (−0.947). Overexploitation (i.e., industrial fishing fleet development) was positively correlated with exploited marine biodiversity (expressed as number of species, 0.75) and threatened biodiversity (expressed as number of conservation categories, 0.77). As a result, there was a decrease in the biomass caught but an increase in the number of species caught and in the number of threatened species. In addition, the spatial changes of the coast were positively correlated with demographic factors (0.915), but negatively correlated with both indicators of biodiversity loss, exploited biodiversity (−0.818) and threatened biodiversity (−0.867), and provisioning ES (−0.711). In addition, there was a negative correlation between the responses, the number of regulations (action and management plans, −0.822, and development of protected areas, −0.947), and the overexploitation and development of industrial fishing gear.
In contrast, across the Strait of Gibraltar, in the Alborán Sea, there were different interactions between the integrated DPSIR indicators (Table S1). Exploited biodiversity was negatively correlated with population (−0.89), land use changes (−0.795), and management and conservation responses (−0.718 and −0.907, respectively) and positively correlated with provisioning ES (0.753), resulting in both the state of biodiversity and the total captured biomass decreasing at the same time. Threatened biodiversity interactions had the same but stronger negative trends with population (−0.962), land use change (−0.844), and management and conservation responses (−0.774 and −0.929, respectively) and positively with the supply service (0.792). In fact, supply was negatively related to population (−0.862), changes in land use, and responses for biodiversity conservation.

3.3. Results of the DPSIR Analysis for Galicia and Asturias

Trends of the Mean Values of the Indicators of Each DPSIR Dimension

The results of the indicator analysis showed similar patterns in both marine areas for drivers and pressures and the relationship between biodiversity status and responses. However, there were small differences in the trends of the indicators of each block in both regions.
In Galicia, the loss of biodiversity was negatively correlated with the management and conservation responses (−0.96), something that also occurred in the Gulf of Cádiz and Alborán. Here, despite the increase in responses, there was still a continuous decrease in biodiversity (Table 5) and the trend in the historical series studied decreased (Table 6). Furthermore, drivers (−0.587) and impacts (−0.338) were also negatively correlated with biodiversity, indicating that there was a relative loss of ecosystem services delivery, even though their supply was relatively stable over time (Table 6). The pressures were inversely related to the drivers of change (−0.715) but positively related to the responses (0.659).
In Asturias, the same pattern existed, where biodiversity loss was negatively related to the responses (−0.958), drivers (−0.398) and impacts (−0.480) although the trend of biodiversity loss over time remained stable (Table 6). On the other hand, the relationship between the pressures and the drivers was more negative than in Galicia (−0.815, Table 5) and although the trend of the drivers was stable over time, that of the pressures worsened significantly (Table 6).

3.4. Aggregated Indices Trend for Galicia and Asturias

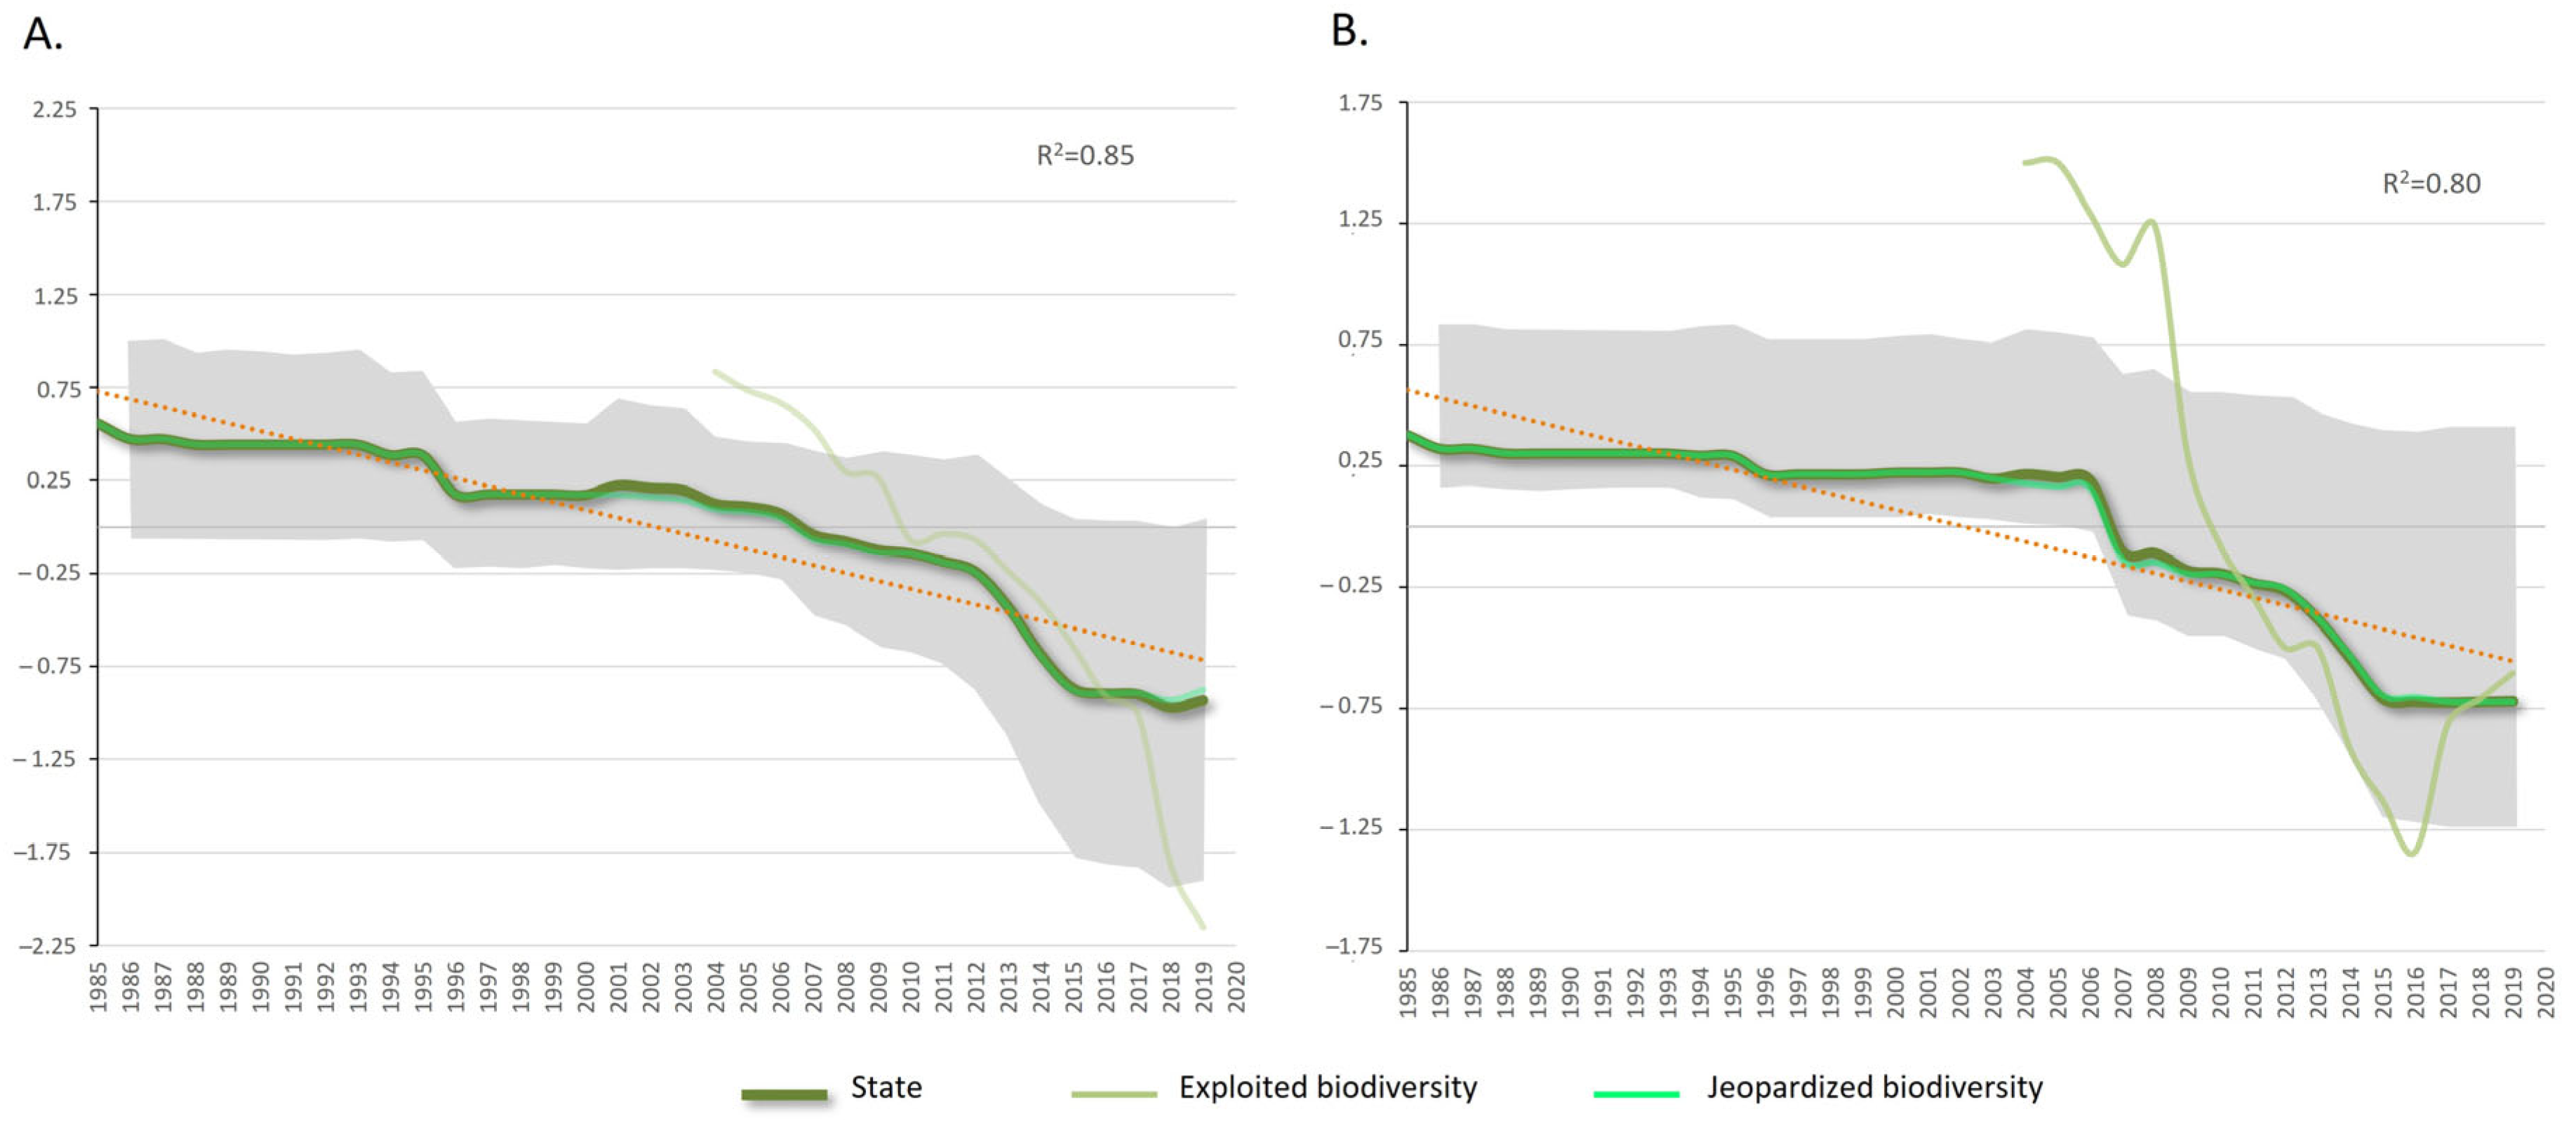
3.4.1. State of the Marine Biodiversity of Galicia and Asturias

There was a loss of marine biodiversity throughout the study period (1985–2019) in both Galicia and Asturias, although the trend was less pronounced than in the Gulf of Cádiz and Alborán (Figure 8). In Galicia, the two aggregated biodiversity indices showed a tendency to worsen, and in the case of exploited biodiversity, the worsening was especially worrying (Table 5). In Asturias, the exploited biodiversity behaved the same, but the threatened biodiversity showed a stable trend throughout the period studied.

3.4.2. Impacts of Galicia and Asturias

The supply of ecosystem services remained stable over time in both Galicia and Asturias (Figure 9 and Table 7). The provisioning ES fluctuated significantly in the time series, but the global trend was stable, as already previously mentioned. The regulation ES measured with the ITM and PPR indices showed that there was no overfishing in these areas.

3.4.3. Responses of Galicia and Asturias

The evolution of the management and conservation responses showed a growing trend in both marine areas. The management carried out through different action and management plans increased in Galicia, although it remained stable in Asturias (Figure 10 and Table 7). In contrast, the conservation of biodiversity through the creation of marine protected areas showed a trend of strong improvement in both regions (Table 7).

3.4.4. Drivers of Galicia and Asturias

The trend of the drivers in the two marine areas showed an increase, except for the social indicator, which is demographic and remained stable in Galicia (Figure 11 and Table 7). The aggregated cultural indicators referred to the creation and maintenance of a number of sea interpretation centers, research centers, museums related to the sea, fishing, etc. and showed a strong upward trend in both regions.

3.4.5. Pressures of Galicia and Asturias

The pressures showed a downward average trend (Table 7 and Figure 12), and when we looked at the trend of each aggregate indicator separately, they were the opposite: overexploitation (i.e., descriptive indicators of the industrial fishing fleet) showed a strong decline in both areas while land use change (i.e., number of building plots owned by coastal municipalities) increased dramatically in both areas.

3.4.6. Correlation Analysis Results of Galicia and Asturias

In both areas, exploited biodiversity had negative correlations with management and conservation responses, showing more negative values in Galicia (−0.749 and −0.715, respectively, Table S2). It also showed negative relationships in both zones with all driver indicators. Land use changes in both areas displayed negative correlations with pressures, highlighting the impact of coastal modifications on the integrity of marine ecosystems and their capacity to provide services. Moreover, exploited biodiversity showed a positive correlation in both areas with overexploitation, which had a strong downward trend (0.768 in Galicia and 0.792 in Asturias) over time, which implies that the decline in the industrial fleet is reflected in a smaller amount of biomass captured from marine biodiversity (Table S4.2). Jeopardized biodiversity showed the same relationships as exploited biodiversity with the DPSIR aggregated indices in the two areas, except for the negative relationship with regulation (−0.503) and cultural (−0.420) ESs in Asturias.

4. Discussion

4.1. Discussion of the Results of the DPSIR Analysis for the Gulf of Cádiz and Alborán

Our findings revealed a concerning decline in biodiversity in the two marine areas studied since 1985. These findings align with the global trend of ecological degradation and loss of biodiversity in marine ecosystems resulting from various human activities, as demonstrated in numerous studies conducted worldwide [59,60], within Europe [61,62,63,64,65], on a Mediterranean level [66,67,68,69,70], and locally such as the study by Torres et al. [71] in the Gulf of Cádiz and Tudela et al. [72] in the Alborán Sea. Interestingly, there has been a significant increase in the number of regulations introduced over time at various spatial levels (international, national, and regional) as well as in the establishment of marine protected areas. In response to the European Marine Strategy Framework Directive (MSFD), which calls for EU member states to achieve good environmental status for their seas by 2020, many measures have been implemented [73,74]. These measures include the establishment of marine protected areas (MPAs), which aim to meet the requirements set by the Convention on Biological Diversity (CBD) to protect and effectively manage 10% of the sea in AMP by 2020 [75]. The goal of these MPAs is to restore and conserve various aspects of marine life, including species, fisheries, habitats, ecosystems, and their sustainable exploitation. However, despite the Mediterranean Sea being a hotspot for marine biodiversity, the current coverage of MPAs in the region is only 6% of the basin, which falls short of the CBD’s 10% target. This information was highlighted in a study conducted by Claudet et al. [70]. In the marine areas of this study, we might expect that the responses given by the institutions could mitigate the pressures that trigger the loss of biodiversity, however, our results suggest that they are not capable of doing so (Table 2 and Table 3, Figure 3 and Figure 5, Tables S3.1–S3.4 in File S3).
The main drivers were related to the increase in population (social driver), which enhanced the consumption of fish and shellfish (economic driver) through the development of industrial fishing gear (pressure due to overexploitation) and caused a land use change on the coast through the construction of ports and other infrastructure (Figure 4 and Figure 7, Table S4.1 in File S4).
The results prompt the question of whether the responses in these areas are ineffective and/or inadequate in safeguarding the ecosystem’s integrity and biodiversity (Figure 3), or if other factors are contributing to this decline in biodiversity. Recent field studies have explored the efficacy of MPAs in mitigating biodiversity loss and found that their failure is due to their small size and/or suboptimal boundary design [76]. To protect and conserve marine metapopulations, it is essential to establish a network of MPAs that is sufficiently large to prevent the mortality of individuals crossing their borders and close enough to ensure connectivity between populations and the dispersal of their offspring [77,78,79,80,81,82]. In addition, in some western Mediterranean MPAs, other failures have been addressed regarding their form of governance management [83,84]. Moreover, the length of time that has passed since the establishment of MPAs has proven to be a significant factor influencing their ecological effectiveness. However, the impact of this time period varies among different species groups. For certain target species, a period of as short as 5 years may be sufficient, while for top predators, it could take several decades [85]. For instance, in the Cabo de Palos-Islas Hormigas MPA, Rojo et al. [86] conducted a study analyzing the recovery patterns after 23 years of protection. They observed that the biomass of fish that feed on other fish and macroinvertebrates increased over time, while their population density decreased. This suggests that control of the food-web dynamics is attributed to top–down mechanisms or consumer interactions. Thus, a similar delay in the effectiveness of regulations, actions, and management plans could have occurred in the marine areas of this study. The implementation of the Natura 2000 network for MPAs in Spain began in 2009 for the Atlantic region and in 2010 for the Mediterranean region [58,87]. However, a decade may not be sufficient time to achieve a good environmental status (Figure 5, Table 4, Files S2 and S3). Additionally, there is a need to enhance coordination between regional and national governments in order to improve the governance of MPAs. Some MPAs have shared authority, while others are governed either nationally (e.g., Isla de Alborán and Cabo de Gata Níjar marine reserves in the Alborán Sea area) or regionally (e.g., the Guadalquivir Mouth marine reserve in the Gulf of Cádiz) (Tables S3.1–S3.4 in File S3).
Additionally, achieving the global conservation of marine biodiversity requires the design and support of long-term management plans in marine protected areas (MPAs), improving compliance levels, and establishing a global network of MPAs [80,88,89,90]. In Europe, Katsanevakis et al. [65] suggested twelve measures for enhancing MPA management. These include implementing adaptive management plans at all Natura 2000 sites, improving mechanisms for public participation in MPA planning and management, and prioritizing conservation objectives through collaboration with relevant social actors. A study by Ban et al. [91] demonstrated the social effectiveness of large MPAs across 16 sites worldwide. Their findings revealed that low levels of participation among resource users and limited external recognition were associated with decreased well-being, while high participation in zoning, social monitoring, location selection, standards development, and environmental monitoring correlated with improved human well-being. The trend toward overexploitation has decreased considerably in both areas (Table 4), especially since the 2000s, when the European Maritime and Fisheries Fund (EMFF) started supporting different financial lines to help fishermen adapt their boats and industrial fishing gear toward sustainable fishing methods. The reconditioning of the industrial fishing fleet had an indirect collateral response in a slight improvement of the artisanal fishing fleet (Figure 4 and Table S4.1 in File S4), which was more pronounced in the Gulf of Cádiz (Pearson correlation index = 0.499, Table S4.1).
During the study period, the supply of ecosystem services (ESs) decreased in both marine areas, with a particularly significant decline observed in the Alborán Sea. This decrease was primarily attributed to the non-renewal of the Cooperation Agreement in the maritime fishing sector between the European Community and the Kingdom of Morocco in 1999–2000 [92], resulting in a significant decrease in the total biomass captured. In both areas, this decrease has been negatively correlated with the pressures of land use change, which increased the deterioration of the integrity of the coastal ecosystem due to the construction of ports and coastal development. Coastal habitats are known nurseries for fish and shellfish [93], and the destruction and alteration of these habitats could trigger a decrease in their population density. Furthermore, the supply of ESs in both areas showed a negative correlation with fishing regulations and management plans, indicating that these measures have not effectively ensured the long-term recovery and sustainable fishing of stocks. This fact, together with the positive interaction with exploited and threatened biodiversity, indicates that in both areas, there is a “fishing down the food web” effect as previously described by Pauly et al. [94], where overfishing decreases the total biomass of the catch (large commercial species, high trophic level predators, and carnivorous fish), whereas at the same time, there is also an increase in the number of small fish species (low trophic level herbivores) caught and/or included in the IUCN Red List catalog. Consequently, an overexploited food web is likely to have lower trophic levels of consumers compared to an undisturbed web (Figure 3 and Figure 4).
Furthermore, there are additional factors contributing to the loss of biodiversity that are not officially quantified. Poaching and recreational fishing have significant effects on biodiversity, but their impact is often underestimated. The illegal trade in fish is particularly difficult to identify and measure. A study by Coll et al. [95] suggested that up to 43% of catches in the areas studied could be illegal. The unreported catches primarily consist of discards and the by-catch of species along the Spanish Mediterranean coast. These unreported catches can make up between 13% and 67% of the total biomass catch [96,97], depending on the fishing gear and habitat. It is crucial to also consider other forms of extraction such as sport fishing vessels, black market fish trade, subsistence fishing, unrecorded artisanal fishing, and poaching. Unfortunately, existing estimates do not apply to our study as they only provide data for specific moments and not for the entire time series from 1985 to 2019. The lack of official fishing reports and their inclusion in our current regulations is a pressing issue, as highlighted by Giménez-Casalduero [98]. This author emphasizes the economic importance of recreational fishing, which in some areas like Malaga (Alborán Sea) contributes four times more to the commercial margin than professional fishing. However, recreational fishing also has other environmental impacts such as negative effects on the seagrass beds of the protected species Posidonia oceanica. These impacts including anchoring have also been observed in other marine areas in the Mediterranean [99]. The cultural and regulating ESs remained stable (Table 4) in both areas. Cultural ESs and human well-being, achieved as a result of the development of artisanal fishing fleets and the creation of organizations of fish producers, fishermen’s associations, and business associations representative of the fishing and aquaculture sectors showed an improvement trend since the late 1990s to 2004, reflecting the aforementioned EMFF effects.

4.2. Discussion of the Results of the DPSIR Analysis for the Galicia and Asturias

A severe loss of biodiversity was observed in both Galicia and in Asturias throughout the entire historical series, weighed down above all by the deterioration in the state of exploited biodiversity. Therefore, each year, more species exploited by fisheries are identified, which are in turn included in a threat category of the IUCN or LESPRE (List of Wild Species under Special Protection Regime).
In both regions, most of the non-fishable species (birds, cetaceans or sea turtles, for example) are evaluated by the IUCN at a global level the exception is the group of cnidarians and algae, which do not have any species evaluated at a global level by the IUCN. In the fishable species, we found more species that had not been evaluated, especially in the groups of mollusks and arthropods, where less than 30% of the species have been evaluated, so large quantities of biomass of species whose conservation status is unknown are landing at markets in both Asturias and Galicia.
The assessment of species and fish stocks at the European level is relatively recent, and in most groups, the first assessments date from 2007. The groups of arthropods and mollusks have species evaluated at a global level but not at the European level. The groups of cnidarians and algae that did not have an evaluation at a global level also did not have one at a European level. At the national level, the number of species included in the LESPRE was high for the most iconic and striking species, especially mammals and birds and other large vertebrates. The guiding criteria for the inclusion of a species in the LESPRE are described in a 2017 resolution [100]; it is a complex process for which a lot of information is needed, which, as previously mentioned, is much scarcer for certain less conspicuous groups. At the regional level, the number of species included is even lower, especially in Asturias, with a catalog that is more than 30 years old and has not been modified at any time. If legally-based documents are not kept up to date, it is much more difficult to carry out conservation actions at the regional level.
Regarding the specific analysis of endangered species landing at the markets, it is worth noting the contradictory results obtained for the two autonomous communities. Asturias complies with the hypothesis, by which it is understood that the imposed regulations are working in this area as the quantity of threatened species fished is reduced proportionally with respect to the total biomass of threatened species. However, in Galicia, the opposite result was obtained, where the proportion of fished threatened species with respect to the total number of threatened species increased with the number of regulations. Moreover, the provisioning ES (measured with the biomass landed at the market) showed a pattern of recovery and stabilization in recent decades (although with oscillations), which is probably related to the management measures of fishing stocks, and not so much to do with those that are launched when a species is classified as threatened. It is important to remember that in the North Atlantic demarcation, fishing exploitation is regulated with extraction quotas that are set according to the annual recommendations of the ICES (International Council for the Exploration of the Sea) which, although they are not conservation measures to use, and have a extractivist background vision, they also aim to achieve the maximum sustainable yield (MSY), that is, to maximize the amount of biomass extracted but taking into account the sustainability of the resource and the long-term viability of the exploited populations.
The two indices measured to assess the SE of regulation (ITM and PPR) remained stable (with oscillations) throughout the time series studied and did not detect alarming situations of overfishing. Both indices are especially sensitive to catches of small pelagic, planktophage, and low trophic level fish such as sardines (Sardina pilchardus) and anchovies (Engraulis encrasicolus). These species are of high commercial value and are of great importance in the functioning of the system since they are prey to a large number of predators in the ecosystem [101] and are also very sensitive to environmental variations since their reproductive processes and annual recruitment are linked to sea temperature and primary production of the ecosystem [102,103,104]. There is therefore the possibility that the oscillations observed in the regulation and provisioning ESs are ultimately due to the response of these species to more frequent climatic anomalies in recent decades [105,106,107].
Throughout the historical series analyzed in Galicia and Asturias, the increase in legislation has allowed most of the cultural services to improve, as evidenced by the large number of interpretation centers, research centers, and museums related to fishing in Galicia as in Asturias. However, the indicators related to artisanal fisheries decreased in both regions throughout the historical series studied.
The Galician artisanal fishing industry has undergone significant changes as a result of various ecological, economic, social, and institutional factors. These factors include overfishing [108], environmental changes in Galician bays [109], oil spills [110], pollution events, higher demand for shellfish [111], the introduction of new co-management systems [112], the establishment of marine protected areas (MPAs), and conflicts with recreational fishing [113]. Together or individually, these factors have posed challenges to the current state of the industry and have the potential to bring about positive transformative changes [111]. In Galicia, among the traditional fishing techniques, inshore fishing and shellfishing on foot stand out, which cause much less damage to marine systems than those caused by industrial fisheries in these same environments [114]. In this sense, the important role of women in the sector should also be mentioned, where the shellfish collectors, the majority of whom are women, are in charge of manually collecting and processing the fishing products from the moment they are extracted from the sea [115].
Regarding the responses, there is an unequal development between communities and type of response, so that in Galicia, both types of response increased over time, and in Asturias, the management measures remained stable, although an intense increase was observed in the number of conservation measures. In both communities, it seems clear that the implemented responses have not had the desired effect and are not capable of halting the loss of biodiversity, although they are capable of maintaining the provisioning ES and the amount of biomass extracted from marine ecosystems over time, at least in recent decades and with the oscillations previously mentioned in this same section. According to the results obtained, it seems that the management measures with a productivist philosophy and whose ultimate objective is to achieve MSY are fulfilling their function, but those aimed at improving the state of general biodiversity still have room for improvement, possibly for the same reasons as in the Gulf of Cádiz and Alborán.
This process of biodiversity loss, ES delivery, and conservation and management responses is also fundamentally driven by economic and cultural drivers of change in Galicia and Asturias by demographic changes. In both regions, economic and cultural drivers are closely linked. Fishing is a source of economic income in the study areas, mainly in Galicia.
In both communities, they registered the highest average prices in the taxonomic groups of fish, followed by crustaceans and cephalopods (also bivalves in the case of Galicia). The fishing sector in Galicia, at a socioeconomic level in 2016, according to the Ardan report [116], produced a volume of income of EUR 8857.3 million and employed 36,532 people. The artisanal fishing industry in Galicia is comprised of around 10,043 fishermen including 3724 women primarily involved in intertidal shellfishing. Additionally, there are over 16,460 indirect employees, accounting for over 60% of the total workforce in the fishing sector [117,118]. The artisanal fishing fleet operates in more than 80 municipalities, with over 3827 small fishing vessels documented in the official Galician fishing fleet census as of March 2021. These vessels engage in fishing activities in coastal inlets and shallow oceanic waters [119]. Shellfishing on foot, a traditional and artisanal activity focused on cultivating and extracting bivalve mollusks, contributes to 7% of the gross domestic product (GDP) and 17% of employment in the Galician fishing sector [120]. However, since the 1960s, efforts to regulate and modernize shellfishing on foot, predominantly carried out by women, have led to a significant decline in the number of female shellfish collectors. The implementation of regulations and professionalization of the sector has resulted in reduced female employment opportunities. Nevertheless, women involved in shellfishing feel empowered and view their work as dignified, despite the increasing trend of men entering the profession due to its growing economic and social prestige [121]. According to the most recent official surveys conducted in Galicia, the statistics indicate that there are 470 women employed in extractive fishing, 1118 employed in marine aquaculture, and 2633 employed in foot shellfishing. These numbers represent approximately 4.13% of total employment in Galicia for extractive fishing, 21.38% for marine aquaculture, and 69.7% for foot shellfishing within the fishing economy subsectors [118]. As a counterpoint, the industrial fishery, made up of, among others, trawlers and purse seiners, increasingly alters, depletes, and destroys both benthic and demersal communities in these marine areas, leading fisheries to a point of no return and sometimes to their end collapse [121,122].
In both autonomic governments, it was observed how the pressures decreased in response to the increase in management responses. Years later, in 2001, the Maritime Fishing of the Spanish State was regulated by means of Law 3/2001 [123], with the main objective of regulating maritime fishing and establishing regulations for the marketing of products from the fishing and fishing sector aquaculture. In consecutive years, more and more regulations have continued to be added, among which it is worth highlighting the updates to the PPC in 2002 and 2013, whose modifications alluded to the implementation of the concept of sustainability in the sector that facilitated economic and labor stability [124] as well as Law 41/2010 [125], which proposes improvements in the planning of fishing activities in order to ensure fishing. Moreover, taking up the sustainable framework proposed by the 2030 Agenda, in SDG 5, it describes the need to “achieve gender equality and empower all women and girls”. The “feminist economy” has been reaching an important degree of development in the last four decades, making clear the socioeconomic importance of women in the development of this activity [126]. As previously expressed by multiple authors [126,127], the lack of adequate information is the main cause of the invisibility of the work carried out by women in this sector as well as in many others. This fact is reflected in the search for information through the official statistical data websites, both national and local, which present very little information on the role of women in each of the seafaring activities. However, and unfortunately, it is not surprising that, in a maritime fishing sector, a masculinized sector, and despite the great historical relevance of the role of women, it is truly difficult to find a figure, from the official statistics, that estimates the number of women who are active in this fishing world. In an effort to achieve this information, it turned out that the apparently non-existent information does exist. This data collection is urged by multiple women’s associations, where day after day these professionals defend their rights and become involved in the regularization of their trades, leading to a process of individual and collective empowerment. With this objective, the “AKTEA” Foundation at a European level, the “Spanish Network of Women in the Fishing Sector (REMSP)” as well as many other local associations, among which “ANMUPESCA” in Galicia and “Fundación Mujeres” in Asturias are responsible for valuing and making visible the role of women in the maritime fishing sector, thus achieving a fundamental right such as gender equality.
To summarize, achieving a sustainable economy necessitates a reevaluation of the relationship between the economic system and the preservation of natural ecosystems and biodiversity. The DPSIR analysis showed the significant effect of economic drivers in the decline of biodiversity in the four studied areas and during the complete time series, but it was especially dramatic in the Gulf of Cádiz. The implementation of conservation and management plans are, right now, not enough to counteract the effects of these economic drivers (and possibly other external factors contributing to the biodiversity loss), and more efficient and holistic management approaches are needed to preserve biodiversity and its ability to provide essential ecosystem services that in turn allow for the development of human societies. These approaches should also acknowledge the importance of the economic and social factors affecting professional and recreational fisheries. Recognizing the importance of biodiversity conservation and sustainable use, various economic sectors are increasingly integrating biodiversity considerations into their policies, strategies, and actions. Successful examples of this approach are already working in some fishing grounds of Galicia [111,114] and the Gulf of Cádiz [128], where the local communities have realized the value of MPAs in the conservation of resources. This study highlights the usefulness of analytical approaches to better understand the complex interactions between biodiversity and the fisheries’ policies, filling the gaps left by years of single stock management approaches that ignored the role of different species in the ecosystem and the long-term effects of fishing policies that missed the connection between biodiversity and all the ecosystem services provided by marine systems. Future research should focus on understanding the food-web dynamics and integrity in protected and not protected areas and linking them with the ability of marine ecosystems to provide ESs. Ecosystem modeling such as Ecopath with Ecosim and Ecospace is now an efficient tool that allows for the integration of environmental factors, fishing policies, and food-web dynamics [129]. However, all of these analytical approaches are heavily dependent on quality and reliable data sources, so future actions should also ensure the collection of high-quality data, and the coordination of the different institutions implied in monitoring and managing marine ecosystems. As a conclusion, and in order to achieve a better protection of marine socio-ecosystems, we consider is essential for all stakeholders including fishermen, companies, and institutions at the regional, national, and international levels to collaborate. Promoting the conservation of marine biodiversity requires a stronger commitment from society, institutions, and businesses, with the inclusion of participatory strategies in the planning and utilization of ecosystem services within Natura 2000 network areas.

Supplementary Materials

The following supporting information can be downloaded at: https://www.mdpi.com/article/10.3390/coasts4010010/s1. We have four Supplementary Files. File S1: Summary of the dimensions in the DPSIR (Drivers-Pressures-State-Impacts-Responses) analysis, description of the indicators used and compilation of the documentation sources used for each marine area studied. It contains three tables: Table S1.1. DPSIR’s dimensions of Andalucía (Gulf of Cádiz and Alborán Sea); Table S1.2. DPSIR’s dimensions of Asturias; Table S1.3. DPSIR’s dimensions of Galicia. File S2: Summary of the regulations related to the conservation and management of fisheries in each study area. It contains nine tables: Table S2.1. Summary of the European Regulations on the management and regulation of fishing resources; Table S2.2. Summary of the Fisheries Regulations at the European level for Galicia and Asturias; Table S2.3. Summary of the Fisheries Regulations at the Spanish level; Table S2.4. Summary of the Spanish Fisheries Regulations concerning the marine areas of Galicia and Asturias; Table S2.5. Summary of Fishing Regulations for the Gulf of Cádiz; Table S2.6. Summary of Fishing Regulations for the Mediterranean Sea; Table S2.7. Summary of the Regulations related to the management of the marine protected areas of Andalucía; Table S2.8. Summary of the Fisheries Regulations at the regional level: Galicia; Table S2.9. Summary of the Fisheries Regulations at the regional level: Asturias. File S3: Summary of the Natura 2000 network marine protected in each study area. It contains four tables: Table S3.1. Summary of the marine protected areas (MPAs) of the marine areas of the Gulf of Cádiz; Table S3.2. Summary of the Marine Protected Areas (MPAs) of the marine areas of the Alborán Sea; Table S3.3. Summary of the marine protected areas (MPAs) of the marine areas of the Asturias; Table S3.4. Summary of the marine protected areas (MPAs) of the marine areas of the Galicia. File S4: it contains two tables. Table S4.1. Pearson correlation analysis showing the relationships between the integrated indices for the marine areas of the Gulf of Cádiz (GC) and the Alborán Sea (A). The significance level at 95% confidence is shown in bold; Table S4.2. Pearson correlation analysis showing the relationships between the integrated indices for the marine areas of the Galicia (G) and Asturias (As). The significance level at 95% confidence is shown in bold.

Author Contributions

Conceptualization, P.A., S.G.-T., M.R.V.-A. and M.L.S.-A.; Methodology, P.A., S.G.-T. and M.R.V.-A.; Data analysis and software, P.A. and S.G.-T.; Investigation, resources, and data curation, P.A., S.G.-T., M.R.V.-A., M.L.S.-A., L.C. and I.D.; Writing—original draft preparation, P.A. and S.G.-T.; Writing—review and editing, P.A., S.G.-T. and M.R.V.-A.; Supervision, P.A.; Project administration, P.A.; Funding acquisition, P.A. All authors have read and agreed to the published version of the manuscript.

Funding

This work was supported by the Biodiversity Foundation (http://www.fundacion-biodiversidad.es/) of the Spanish Ministry Ecological Transition (Projects: “Evaluación y valoración de los servicios de los ecosistemas marinos de la Red Natura 2000 de España—LIFE15 IP ES012—INTEMARES (FB2017APLI006)” and “Evaluación del impacto de la pesca sobre la biodiversidad marina: un análisis de la dinámica de sus redes tróficas en la Red Natura 2000 de España (CA_BM_2019)”.

Institutional Review Board Statement

Not applicable.

Informed Consent Statement

Not applicable.

Data Availability Statement

Data contained within the article and Supplementary Materials could be requested to the corresponding author by e-mail.

Acknowledgments

The authors would like to thank the researchers at several IEO headquarters: Marian Torres from the IEO of Cádiz, Izaskun Preciado from the IEO of Santander, and Alberto Serrano from the IEO of Vigo for facilitating access to the database and support in reorganizing the functional trophic groups, together with Joan Cartés from the Institut de Cienciès del Mar-CSIC of Barcelona; to CEMMA (Coordinator for the study of marine mammals of Galicia) for facilitating the cetacean censuses of the Bank of Galicia. We also acknowledge Oslin Franco and Miruna Bacaoanu, students of the Master in Ecology UAM-UCM, who carried out their external internships collecting part of the necessary information to generate the database of the indicators used in this study.

Conflicts of Interest

The authors declare no conflicts of interest.

References

  1. Liu, J.; Dietz, T.; Carpenter, S.R.; Folke, C.; Alberti, M.; Redman, C.L.; Schneider, S.H.; Ostrom, E.; Pell, A.N.; Lubchenco, J.; et al. Coupled Human and Natural Systems. AMBIO 2007, 36, 639–649. Available online: https://www.jstor.org/stable/25547831 (accessed on 23 August 2023). [CrossRef] [PubMed]
  2. Pope, K.L.; Pegg, M.A.; Cole, N.W.; Siddons, S.F.; Fedele, A.D.; Harmon, B.S.; Ruskamp, R.L.; Turner, D.R.; Uerling, C.C. Fishing for ecosystem services. J. Environ. Manag. 2016, 183, 408–417. [Google Scholar] [CrossRef]
  3. FAO. The State of World Fisheries and Aquaculture 2020. In Sustainability in Action; FAO: Rome, Italy, 2020; 244p. [Google Scholar]
  4. Scientific, Technical and Economic Committee for Fisheries (STECF 2021). Monitoring the Performance of the Common Fisheries Policy (STECF-Adhoc-21-01); EUR 28359 EN; Publications Office of the European Union: Luxembourg, 2021; ISBN 978-92-76-36155-8. [Google Scholar]
  5. Pauly, D.; Watson, R. Background and interpretation of the ‘Marine Trophic Index’ as a measure of biodiversity. Philos. Trans. R. Soc. B Biol. Sci. 2005, 360, 415–423. [Google Scholar] [CrossRef]
  6. Agardy, T.S. Marine Protected Areas and Ocean Conservation; R.G. Landes Company and Academic Press, Inc.: Austin, TX, USA, 1997; 244p, ISBN 1-57059-423-6. [Google Scholar]
  7. McCay, B.J.; Jones, P.J.S. Marine Protected Areas and the Governance of Marine Ecosystems and Fisheries. Conserv. Biol. 2011, 25, 1130–1133. Available online: https://www.jstor.org/stable/41315408 (accessed on 23 August 2023). [CrossRef] [PubMed]
  8. Edgar, G.J.; Stuart-Smith, R.D.; Willis, T.J.; Kininmonth, S.; Baker, S.C.; Banks, S.; Barrett, N.S.; Becerro, M.A.; Bernard, A.T.F.; Berkhout, J.; et al. Global conservation outcomes depend on marine protected areas with five key features. Nature 2014, 506, 216–220. [Google Scholar] [CrossRef] [PubMed]
  9. Convention on Biological Diversity. Decision adopted by the Conference of the Parties to the convention n biological diversity.VII/5. Marine and coastal biodiversity. In Proceedings of the Conference of the Parties to the Convention on Biological Diversity, Seventh Meeting, Kuala Lumpur, Malaysia, 9–20 February 2004; Available online: https://www.cbd.int/doc/decisions/cop-07/cop-07-dec-05-en.pdf (accessed on 1 November 2023).
  10. UN Environment. Enabling Effective and Equitable Marine Protected Areas—Guidance on Combining Governance Approaches; Jones, P.J.S., Murray, R.H., Vestergaard, O., Eds.; Regional Seas Reports and Studies: Nairobi, Kenya, 2019; Volume 203, 52p, Available online: https://wedocs.unep.org/bitstream/handle/20.500.11822/27790/MPA.pdf?sequence=1&isAllowed=y (accessed on 2 November 2023).
  11. European Union. Directive 2008/56/EC of the european parliament and of the council of 17 June 2008 establishing a framework for community action in the field of marine environmental policy (Marine Strategy Framework Directive). Off. J. Eur. Union 2008, 164, 19–40. Available online: https://eur-lex.europa.eu/legal-content/EN/TXT/?uri=celex%3A32008L0056 (accessed on 1 November 2023).
  12. BOE-A-2010-20050. Ley 41/2010, de 29 de Diciembre, de Protección Del Medio Marino. «BOE» Núm. 317, de 30 de Diciembre de 2010, pp. 108464–108488. Available online: https://www.boe.es/eli/es/l/2010/12/29/41 (accessed on 7 November 2023).
  13. Mace, P. A new role for MSY in single-species and ecosystem approaches to fisheries stock assessment and management. Fish Fish. 2001, 2, 2–32. [Google Scholar] [CrossRef]
  14. Arcos, J.M.; Louzao, M.; Oro, D. Fishery Ecosystem Impacts and Management in the Mediterranean: Seabirds Point of View. In Reconciling Fisheries with Conservation: Proceedings of the Fourth World Fisheries Congress, Vancouver, BC, Canada, 2–6 May 2004; Nielsen, J.L., Dodson, J.J., Friedland, K., Hamon, T.R., Musick, J., Verspoor, E., Eds.; American Fisheries Society: Bethesda, MD, USA, 2008; Symposium 49; pp. 587–595. [Google Scholar]
  15. Hilborn, R. Future directions in ecosystem based fisheries management: A personal perspective. Fish. Res. 2011, 108, 235–239. [Google Scholar] [CrossRef]
  16. Berg, T.; Fürhaupter, K.; Teixeira, H.; Uusitalo, L.; Zampoukas, N. The Marine Strategy Framework Directive and the ecosystem-based approach—Pitfalls and solutions. Mar. Pollut. Bull. 2015, 96, 18–28. [Google Scholar] [CrossRef]
  17. Hilborn, R.; Amoroso, R.O.; Anderson, C.M.; Baum, J.K.; Branch, T.A.; Costello, C.; de Moor, C.L.; Faraj, A.; Hively, D.; Jensen, O.P.; et al. Effective fisheries management instrumental in improving fish stock status. Proc. Natl. Acad. Sci. USA 2020, 117, 2218–2224. [Google Scholar] [CrossRef]
  18. Pew 2021. Lecciones de la Implementación de la Política Pesquera Común de la UE. Diversa Documentación Pone de Manifiesto que Sigue Siendo Necesario dar un Giro Hacia una Mejor Gestión. Available online: https://www.pewtrusts.org/es/research-and-analysis/reports/2021/03/lessons-from-implementation-of-the-eus-common-fisheries-policy (accessed on 7 November 2023).
  19. Albouy, C.; Archambault, P.; Appeltans, W.; Araújo, M.B.; Beauchesne, D.; Cazelles, K.; Cirtwill, A.R.; Fortin, M.J.; Galiana, N.; Leroux, S.J.; et al. The marine fish food web is globally connected. Nat. Ecol. Evol. 2019, 3, 1153–1161. [Google Scholar] [CrossRef] [PubMed]
  20. Coll, M.; Piroddi, C.; Steenbeek, J.; Kaschner, K.; Ben Rais Lasram, F.; Aguzzi, J.; Ballesteros, E.; Bianchi, C.N.; Corbera, J.; Dailianis, T.; et al. The Biodiversity of the Mediterranean Sea: Estimates, Patterns, and Threats. PLoS ONE 2010, 5, e11842. [Google Scholar] [CrossRef]
  21. UNEP-MAP RAC/SPA. The Mediterranean Sea Biodiversity: State of the Ecosystems, Pressures, Impacts and Future Priorities; Bazairi, H., Ben Ha, S., Boer, F., Cebria, D., De Jua, S., Lima, A., Lleonart, J., Torchi, G., Rais, C., Eds.; RAC/SPA: Tunis, Tunisia, 2010; 100p, Available online: https://www.rac-spa.org/sites/default/files/doc_cop/biodiversity.pdf (accessed on 31 October 2023).
  22. Abdul-Malak, D.; Livingstone, S.R.; Pollard, D.; Polidoro, B.-A.; Cuttelod, A.; Bariche, M.; Bilecenoglu, M.; Carpenter, K.E.; Collette, B.B.; Francour, P.; et al. Overview of the Conservation Status of the Marine Fishes of the Mediterranean Sea; IUCN: Gland, Switzerland; Malaga, Spain, 2011. [Google Scholar]
  23. Tintoré, J.; La Violette, P.E.; Blade, I.; Cruzado, A. A Study of an Intense Density Front in the Eastern Alboran Sea: The Almeria–Oran Front. J. Phys. Oceanogr. 1988, 18, 1384–1397. [Google Scholar] [CrossRef]
  24. Rubin, J.P.; Gil, J.; Ruiz, J.; Cortes, M.D.; Jiménez-Gómez, F.; Parada, M.; Rodríguez, J. La distribución ictioplanctónica y su relación con parámetros físicos, químicos y biológicos en el sector norte del Mar de Alboran. Inf. Tec. Inst. Esp. Oceanogr. 1992, 139, 49. Available online: http://hdl.handle.net/10261/320439 (accessed on 23 August 2023).
  25. Gil de Sola, L. Las pesquerías demersales del mar de Alborán, Submediterráneo ibérico: Evolución en los últimos decenios. Inf. Téc. Inst. Esp. Oceanogr. 1993, 142, 1–179. Available online: http://www.ieo.es/es/informes-tecnicos (accessed on 11 November 2023).
  26. Rodríguez, J. Las Reservas Marinas en el Marco Ecológico y Oceanográfico del Mediterráneo Occidental. In La Gestión de los Espacios Marinos del Mediterráneo Occidental; Guirado, J., Ed.; Instituto de Estudios Almerienses (Diputación de Almería): Almería, Spain, 1995; pp. 13–28. [Google Scholar]
  27. Llope, M.; de Carvalho-Souza, G.F.; Baldó, F.; González-Cabrera, C.; Jiménez, M.P.; Licandro, P.; Vilas, C. Gulf of Cadiz zooplankton: Community structure, zonation and temporal variation. Prog. Oceanogr. 2020, 186, 102379. [Google Scholar] [CrossRef]
  28. BOE-A-2023-5704, Real Decreto 150/2023, de 28 de Febrero, por el que se Aprueban los Planes de Ordenación del Espacio Marítimo de las Cinco Demarcaciones Marinas Españolas. Available online: https://www.boe.es/eli/es/rd/2023/02/28/150 (accessed on 23 September 2023).
  29. Banco de Galicia. Available online: https://www.indemares.es/areas-marinas/banco-de-galicia (accessed on 20 July 2023).
  30. Sistema de Cañones Submarinos de Avilés. Available online: https://www.indemares.es/areas-marinas/sistema-de-canones-submarinos-de-aviles (accessed on 20 July 2023).
  31. Ríos, P.; Prado, E.; Carvalho, F.C.; Sánchez, F.; Rodríguez-Basalo, A.; Xavier, J.R.; Ibarrola, T.P.; Cristobo, J. Community composition and habitat characterization of a rock sponge aggregation (Porifera, Corallistidae) in the Cantabrian Sea. Front. Mar. Sci. 2020, 7, 578. [Google Scholar] [CrossRef]
  32. Ríos, P.; Altuna, Á.; Frutos, I.; Manjón-Cabeza, E.; García-Guillén, L.; Macías-Ramírez, A.; Ibarrola, T.P.; Gofas, S.; Taboada, S.; Souto, J.; et al. Avilés Canyon System: Increasing the benthic biodiversity knowledge. Estuar. Coast. Shelf Sci. 2022, 274, 107924. [Google Scholar] [CrossRef]
  33. Punzón, A.; Arronte, J.C.; Sánchez, F.; García-Alegre, A. Spatial characterization of the fisheries in the Avilés Canyon System (Cantabrian Sea, Spain). Cienc. Mar. 2016, 42, 237–260. [Google Scholar] [CrossRef]
  34. Rogan, E.; Cañadas, A.; Macleod, K.; Santos, M.B.; Mikkelsen, B.; Uriarte, A.; Van Canneyt, O.; Vázquez, A.; Hammond, P.S. Distribution, abundance and habitat use of deep diving cetaceans in the North-East Atlantic. Deep Sea Res. Part II Top. Stud. Oceanogr. 2017, 141, 8–19. [Google Scholar] [CrossRef]
  35. Santos-Martín, F.; Martín-López, B.; García-Llorente, M.; Aguado, M.; Benayas, J.; Montes, C. Unraveling the relationships between ecosystems and human wellbeing in Spain. PLoS ONE 2013, 8, e73249. [Google Scholar] [CrossRef] [PubMed]
  36. Vidal-Abarca, M.R.; Suárez-Alonso, M.L.; Santos-Martín, F.; Martín-López, B.; Benayas, J.; Montes, C. Understanding complex links between fluvial ecosystems and social indicators in Spain: An ecosystem services approach. Ecol. Complex. 2014, 20, 1–10. [Google Scholar] [CrossRef]
  37. Atkins, J.P.; Burdon, D.; Elliott, M.; Gregory, A.J. Management of the marine environment: Integrating ecosystem services and societal benefits with the DPSIR framework in a systems approach. Mar. Pollut. Bull. 2011, 62, 215–226. [Google Scholar] [CrossRef]
  38. Kelble, C.R.; Loomis, D.K.; Lovelace, S.; Nuttle, W.K.; Ortner, P.B.; Fletcher, P.; Cook, G.S.; Lorenz, J.J.; Boyer, J.N. The EBM-DPSER conceptual model: Integrating ecosystem services into the DPSIR framework. PLoS ONE 2013, 8, e70766. [Google Scholar] [CrossRef]
  39. Patricio, J.; Elliott, M.; Mazik, K.; Papadopoulou, K.N.; Smith, C.J. DPSIR—Two decades of trying to develop a unifying framework for marine environmental management? Front. Mar. Sci. 2016, 3, 177. [Google Scholar] [CrossRef]
  40. Teixeira, H.; Berg, T.; Uusitalo, L.; Fürhaupter, K.; Heiskanen, A.S.; Mazik, K.; Lynam, C.P.; Neville, S.; Rodríguez, J.G.; Papadopoulou, N.; et al. A catalogue of marine biodiversity indicators. Front. Mar. Sci. 2016, 3, 207. [Google Scholar] [CrossRef]
  41. Elliott, M.; Burdon, D.; Atkins, J.P.; Borja, A.; Cormier, R.; De Jonge, V.N.; Turner, R.K. “And DPSIR begat DAPSI (W) R (M)!”-a unifying framework for marine environmental management. Mar. Pollut. Bull. 2017, 118, 27–40. [Google Scholar] [CrossRef] [PubMed]
  42. Balzan, M.V.; Pinheiro, A.M.; Mascarenhas, A.; Morán-Ordóñez, A.; Ruiz-Frau, A.; Carvalho-Santos, C.; Vogiatzakis, I.N.; Arends, J.; Santana-Garcon, J.; Roces-Díaz, J.V.; et al. Improving ecosystem assessments in Mediterranean social-ecological systems: A DPSIR analysis. Ecosyst. People 2019, 15, 136–155. [Google Scholar] [CrossRef]
  43. Bryhn, A.; Kraufvelin, P.; Bergström, U.; Vretborn, M.; Bergström, L. A model for disentangling dependencies and impacts among human activities and marine ecosystem services. Environ. Manag. 2020, 65, 575–586. [Google Scholar] [CrossRef] [PubMed]
  44. Baillie, J.E.M.; Hilton-Taylor, C.; Stuart, S.N. 2004 IUCN Red List of threatened species. In A Global Species Assessment; IUCN Press: Cambridge, MA, USA, 2004; Available online: https://portals.iucn.org/library/node/9830 (accessed on 23 August 2023).
  45. Bearzi, G.; Reeves, R.; Notarbartolo-Di-Sciara, G.; Politi, E.; Cañadas, A.; Frantzis, A.; Mussi, B. Ecology, status and conservation of short-beaked common dolphins Delphinus delphis in the Mediterranean Sea. Mammal Rev. 2003, 33, 224–252. [Google Scholar] [CrossRef]
  46. Báez, J.C.; Real, R.; Camiñas, J.A. Differential distribution within longline transects of Loggerhead and Swordfish captured by the Spanish Mediterranean surface longline fishery. J. Mar. Biol. Assoc. 2007, 87, 801–803. [Google Scholar] [CrossRef]
  47. Báez, J.C.; Real, R.; García-Soto, C.; De la Serna, J.M.; Macías, D.; Camiñas, J.A. Loggerhead turtle by-catch depends on distance to the coast, independent of fishing effort: Implications for conservation and fisheries management. Mar. Ecol. Prog. Ser. 2007, 338, 249–256. [Google Scholar] [CrossRef]
  48. Báez, J.C.; Camiñas, J.A.; Sagarminaga, R.; Torreblanca, D.; Real, R. Capturas no dirigidas de tortuga boba (Caretta caretta Linnaeus, 1758) en aguas de Andalucía y Murcia durante 2004. Munibe 2007, 25, 196–201. [Google Scholar]
  49. De Stephanis, R.; Garcia-Tiscar, S.; Verborgh, P.; Esteban-Pavo, R.; Pérez, S.; Minvielle-Sebastia, L.; Guinet, C. Diet of the social groups of long-finned pilot whales (Globicephala melas) in the Strait of Gibraltar. Mar. Biol. 2008, 154, 603–612. [Google Scholar] [CrossRef]
  50. Arcos, J.M.; Bécares, J.; Rodríguez, B.; Ruiz, A. Áreas Importantes para la Conservación de las Aves Marinas en España; LIFE04NAT/ES/000049-SEO/BirdLife; SEO/BirdLife, Madrid, Spain. 2009, pp. 198–224. Available online: https://www.researchgate.net/publication/229067402_Areas_Importantes_para_la_Conservacion_de_las_Aves_Marinas_en_Espana (accessed on 12 November 2023).
  51. Camiñas, J.A. Estatus y conservación de las Tortugas Marinas en España. In Libro Rojo de los Vertebrados Amenazados; de Andalucía Franco, A., Rodríguez, M., Eds.; Consejería de Medio Ambiente de la Junta de Andalucía: Sevilla, Spain, 2012; pp. 347–380. [Google Scholar]
  52. Croxall, J.P.; Butchart, S.H.M.; Lascelles, B.; Stattersfield, A.J.; Sullivan, B.; Symes, A.; Taylor, P. Seabird conservation status, threats and priority actions: A global assessment. Bird Conserv. Int. 2012, 22, 1–34. [Google Scholar] [CrossRef]
  53. Nicolau, L.; Marçalo, A.; Ferreira, M.; Sequeira, M.; Vingada, J.; Eira, C. Sea turtles in Iberian waters: Records from continental Portugal and Galicia. In Proceedings of the XIII Iberian Congress of Herpetology, Aveiro, Portugal, 30 September–4 October 2014. [Google Scholar]
  54. Covelo, P.; Nicolau, L.; López, A. Four new records of stranded Kemp’s ridley turtle Lepidochelys kempii in the NW Iberian Peninsula. Mar. Biodivers. Rec. 2016, 9, 1–5. [Google Scholar] [CrossRef]
  55. Jungblut, S.; Nachtsheim, D.A.; Boos, K.; Joiris, C.R. Biogeography of top predators–seabirds and cetaceans–along four latitudinal transects in the Atlantic Ocean. Deep Sea Res. Part II Top. Stud. Oceanogr. 2017, 141, 59–73. [Google Scholar] [CrossRef]
  56. Araújo, H.; Correia-Rodrigues, P.; Bastos-Santos, J.; Ferreira, M.; Pereira, A.T.; Martinez-Cedeira, J.; Vingada, J.; Eira, C. Seabird abundance and distribution off western Iberian waters estimated through aerial surveys. Mar. Ornithol. 2022, 50, 71–80. [Google Scholar]
  57. Floridi, M.; Pagni, S.; Falorni, S.; Luzzati, T. An exercise in composite indicators construction: Assessing the sustainability of Italian regions. Ecol. Econ. 2011, 70, 1440–1447. [Google Scholar] [CrossRef]
  58. WWF. Red Natura 2000 Marina en España. 2024. 151p. Available online: https://wwfes.awsassets.panda.org/downloads/libro_red_natura_200_marina_en_espana_c.pdf?ga=2.233157275.483627554.1580121547--1583122700.1572448035 (accessed on 9 November 2023).
  59. Jouffray, J.B.; Blasiak, R.; Norström, A.V.; Österblom, H.; Nyström, M. The Blue Acceleration: The Trajectory of Human Expansion into the Ocean. One Earth 2020, 2, 43–54. [Google Scholar] [CrossRef]
  60. Luypaert, T.; Hagan, J.G.; McCarthy, M.L.; Poti, M. Status of Marine Biodiversity in the Anthropocene. In YOUMARES 9—The Oceans: Our Research, Our Future; Jungblut, S., Liebich, V., Bode-Dalby, M., Eds.; Springer: Cham, Germany, 2020; pp. 57–82. [Google Scholar] [CrossRef]
  61. Abdulla, A.; Gomei, M.; Maison, E.; Piante, C. Status of Marine Protected Areas in the Mediterranean Sea; IUCN: Málaga, Spain; WWF: Gland, Switzerland, 2008; 152p. [Google Scholar]
  62. Borja, A.; Elliott, M.; Andersen, J.H.; Berg, T.; Carstensen, J.; Halpern, B.S.; Heiskanen, A.-S.; Korpinen, S.; Lowndes, J.S.S.; Martin, G.; et al. Overview of Integrative Assessment of Marine Systems: The Ecosystem Approach in Practice. Front. Mar. Sci. 2016, 3, 20. [Google Scholar] [CrossRef]
  63. Cochrane, S.K.J.; Andersen, J.H.; Berg, T.; Blanchet, H.; Borja, A.; Carstensen, J.; Elliott, M.; Hummel, H.; Niquil, N.; Renaud, P.E. What Is Marine Biodiversity? Towards Common Concepts and Their Implications for Assessing Biodiversity Status. Front. Mar. Sci. 2016, 3, 248. [Google Scholar] [CrossRef]
  64. Uusitalo, L.; Blanchet, H.; Andersen, J.H.; Beauchard, O.; Berg, T.; Bianchelli, S.; Cantafaro, A.; Carstensen, J.; Carugati, L.; Cochrane, S.; et al. Indicator-Based Assessment of Marine Biological Diversity–Lessons from 10 Case Studies across the European Seas. Front. Mar. Sci. 2016, 3, 159. [Google Scholar] [CrossRef]
  65. Katsanevakis, S.; Coll, M.; Fraschetti, S.; Giakoumi, S.; Goldsborough, D.; Mačić, V.; Mackelworth, P.; Rilov, G.; Stelzenmüller, V.; Albano, P.G.; et al. Twelve Recommendations for Advancing Marine Conservation in European and Contiguous Seas. Front. Mar. Sci. 2020, 7, 565968. [Google Scholar] [CrossRef]
  66. Vasilakopoulos, P.; Maravelias, C.D.; Tserpes, G. The Alarming Decline of Mediterranean Fish Stocks. Curr. Biol. 2014, 24, 1643–1648. [Google Scholar] [CrossRef] [PubMed]
  67. Piroddi, C.; Coll, M.; Steenbeek, J.; Moy, D.M.; Christensen, V. Modelling the Mediterranean marine ecosystem as a whole: Addressing the challenge of complexity. Mar. Ecol. Prog. Ser. 2015, 533, 47–65. [Google Scholar] [CrossRef]
  68. Piroddi, C.; Coll, M.; Liquete, C.; Macias, D.; Greer, K.; Buszowski, J.; Steenbeek, J.; Danovaro, R.; Christensen, V. Historical changes of the Mediterranean Sea ecosystem: Modelling the role and impact of primary productivity and fisheries changes over time. Sci. Rep. 2017, 7, srep44491. [Google Scholar] [CrossRef] [PubMed]
  69. Bevilacqua, S.; Katsanevakis, S.; Micheli, F.; Sala, E.; Rilov, G.; Sarà, G.; Malak, D.A.; Abdulla, A.; Gerovasileiou, V.; Gissi, E.; et al. The Status of Coastal Benthic Ecosystems in the Mediterranean Sea: Evidence from Ecological Indicators. Front. Mar. Sci. 2020, 7, 475. [Google Scholar] [CrossRef]
  70. Claudet, J.; Loiseau, C.; Sostres, M.; Zupan, M. Underprotected Marine Protected Areas in a Global Biodiversity Hotspot. One Earth 2020, 2, 380–384. [Google Scholar] [CrossRef]
  71. Torres, M.; Coll, M.; Heymans, J.J.; Christensen, V.; Sobrino, I. Food-web structure of and fishing impacts on the Gulf of Cadiz ecosystem (South-western Spain). Ecol. Model. 2013, 265, 26–44. [Google Scholar] [CrossRef]
  72. Tudela, S.; Kai, A.K.; Maynou, F.; El Andalossi, M.; Guglielmi, P. Driftnet fishing and biodiversity conservation: The case study of the large-scale Moroccan driftnet fleet operating in the Alborán Sea (SW Mediterranean). Biol. Conserv. 2005, 121, 65–78. [Google Scholar] [CrossRef]
  73. Commission Directive (EU) 2017/845 of 17 May 2017 Amending Directive 2008/56/EC of the European Parliament and of the Council as Regards the Indicative Lists of Elements to be Taken Into Account for the Preparation of Marine Strategies. Available online: http://data.europa.eu/eli/dir/2017/845/oj (accessed on 1 November 2023).
  74. Commission Decision (EU). 2017/848 of 17 May 2017 laying down criteria and methodological standards on good environmental status of marine waters and specifications and standardised methods for monitoring and assessment, and repealing Decision 2010/477/EU (Text with EEA relevance). C/2017/2901. Off. J. Eur. Union L 2017, 125, 43–74. Available online: https://eur-lex.europa.eu/legal-content/EN/TXT/?uri=CELEX%3A32017D0848 (accessed on 3 November 2022).
  75. Convention on Biological Diversity. CBD National Focal Points, Marine and Coastal Biodiversity Focal Points, SBSTTA Focal Points, Relevant United Nations/International Organizations, IPLCs and Other Relevant Organizations. CBD/EBSA/EM/2017/1/3. Available online: https://www.cbd.int/doc/c/6ac0/03a0/d4179dfc152efaeefd81d35e/ebsa-em-2017-01-03-en.pdf (accessed on 1 November 2023).
  76. Mora, C.; Sale, P. Ongoing global biodiversity loss and the need to move beyond protected areas: A review of the technical and practical shortcomings of protected areas on land and sea. Mar. Ecol. Prog. Ser. 2011, 434, 251–266. [Google Scholar] [CrossRef]
  77. Shanks, A.L.; Grantham, B.A.; Carr, M.H. Propagule dispersal distance and the size and spacing of marine reserves. Ecol. Appl. 2003, 13, 159–169. [Google Scholar] [CrossRef]
  78. Palumbi, S.R. Marine reserves and ocean neighborhoods: The Spatial Scale of Marine Populations and Their Management. Annu. Rev. Environ. Resour. 2004, 29, 31–68. [Google Scholar] [CrossRef]
  79. García-Charton, J.A.; Pérez-Ruzafa, A.; Sánchez-Jerez, P.; Bayle-Sempere, J.T.; Reñones, O.; Moreno, D. Multi-scale spatial heterogeneity, habitat structure, and the effect of marine reserves on Western Mediterranean rocky reef fish assemblages. Mar. Biol. 2004, 144, 161–182. [Google Scholar] [CrossRef]
  80. García-Charton, J.; Pérez-Ruzafa, A.; Marcos, C.; Claudet, J.; Badalamenti, F.; Benedetti-Cecchi, L.; Falcón, J.; Milazzo, M.; Schembri, P.J.; Stobart, B.; et al. Effectiveness of European Atlanto-Mediterranean MPAs: Do they accomplish the expected effects on populations, communities and ecosystems? J. Nat. Conserv. 2008, 16, 193–221. [Google Scholar] [CrossRef]
  81. Pérez-Ruzafa, A.; González-Wangüemert, M.; Lenfant, P.; Marcos, C.; García-Charton, J.A. Effects of fishing protection on the genetic structure of fish populations. Biol. Conserv. 2006, 129, 244–255. [Google Scholar] [CrossRef]
  82. Pérez-Ruzafa, A.; García-Charton, J.A.; Marcos, C. North East Atlantic vs. Mediterranean Marine Protected Areas as Fisheries Management Tool. Front. Mar. Sci. 2017, 4, 245. [Google Scholar] [CrossRef]
  83. Hogg, K.; Noguera-Méndez, P.; Semitiel-García, M.; Gray, T.; Young, S. Controversies over stakeholder participation in marine protected area (MPA) management: A case study of the Cabo de Palos-Islas Hormigas MPA. Ocean Coast. Manag. 2017, 144, 120–128. [Google Scholar] [CrossRef]
  84. Hogg, K.; Semitiel-García, M.; Noguera-Méndez, P.; García-Charton, J.A. A governance analysis of Cabo de Palos-Islas Hormigas and Cabo de Gata-Níjar Marine Protected Areas, Spain. Mar. Policy 2021, 127, 102944. [Google Scholar] [CrossRef]
  85. Fox, H.E.; Mascia, M.B.; Basurto, X.; Costa, A.; Glew, L.; Heinemann, D.; Karrer, L.B.; Lester, S.E.; Lombana, A.V.; Pomeroy, R.S.; et al. Reexamining the science of marine protected areas: Linking knowledge to action. Conserv. Lett. 2011, 5, 1–10. [Google Scholar] [CrossRef]
  86. Rojo, I.; Anadón, J.D.; García-Charton, J.A. Exceptionally high but still growing predatory reef fish biomass after 23 years of protection in a Marine Protected Area. PLoS ONE 2021, 16, e0246335. [Google Scholar] [CrossRef] [PubMed]
  87. Alonso, J.; García-Bellido, E.; Prados, S. La Red Natura 2000 marina. Ambienta 2017, 119, 82–95. Available online: https://www.mapa.gob.es/ministerio/pags/Biblioteca/Revistas/pdf_AM%2FPDF_AM_Ambienta_2017_119_82_95.pdf (accessed on 4 October 2023).
  88. Edgar, G.J.; Russ, G.R.; Babcock, R.C. Marine protected areas. In Marine Ecology; Connell, S.D., Gillanders, B.M., Eds.; Oxford University Press: Oxford, UK, 2007; pp. 534–565. ISBN 0195553020. [Google Scholar]
  89. Edgar, G.J. Does the global network of marine protected areas provide an adequate safety net for marine biodiversity? Aquatic Conserv. Mar. Freshw. Ecosyst. 2011, 21, 313–316. [Google Scholar] [CrossRef]
  90. Cabral, R.B.; Bradley, D.; Mayorga, J.; Goodell, W.; Friedlander, A.M.; Sala, E.; Costello, C.; Gaines, S.D. A global network of marine protected areas for food. Proc. Natl. Acad. Sci. USA 2020, 117, 28134–28139. [Google Scholar] [CrossRef] [PubMed]
  91. Ban, N.C.; Davies, T.E.; Aguilera, S.E.; Brooks, C.; Cox, M.; Epstein, G.; Evans, L.S.; Maxwell, S.M.; Nenadovic, M. Social and ecological effectiveness of large marine protected areas. Glob. Environ. Change 2017, 43, 82–91. [Google Scholar] [CrossRef]
  92. EC (1995) 95/540/EC: Council Decision of 7 December 1995 on the Conclusion of an Agreement in the Form of An Exchange of Letters Concerning the Provisional Application of the Agreement on Cooperation in the Sea Fisheries Sector between the European Community and the Kingdom of Morocco Initialled in Brussels on 13 November 1995. Available online: https://eur-lex.europa.eu/legal-content/EN/TXT/?uri=CELEX:31995D0540 (accessed on 3 November 2023).
  93. Airoldi, L.; Beck, M.W. Loss, Status and Trends for Coastal Marine Habitats of Europe. In Oceanography and Marine Biology: An Annual Review 45; Gibson, R.N., Atkinson, R.J.A., Gordon, J.D.M., Eds.; CRC Press: Boca Raton, FL, USA, 2007; Chapter 7; pp. 345–405. [Google Scholar]
  94. Pauly, D.; Christensen, V.; Dalsgaard, J.; Froese, R.; Torres, F., Jr. Fishing Down Marine Food Webs. Science 1998, 279, 860–863. [Google Scholar] [CrossRef]
  95. Coll, M.; Carreras, M.; Ciércoles, C.; Cornax, M.-J.; Gorelli, G.; Morote, E.; Sáez, R. Assessing Fishing and Marine Biodiversity Changes Using Fishers’ Perceptions: The Spanish Mediterranean and Gulf of Cadiz Case Study. PLoS ONE 2014, 9, e85670. [Google Scholar] [CrossRef]
  96. Carbonell, A.; Martín, P.; De Ranieri, S.; WEDIS Team. Discards of the Western Mediterranean Trawl Fleets. In Rapports et Procès- Verbaux des Réunions; Commission Internationale Pour L’Exploration Scientifique de la Mer Méditerranée: Issy-les-Moulineaux, France, 1998; Volume 35, pp. 392–393. Available online: http://hdl.handle.net/10508/6895 (accessed on 22 June 2023).
  97. Pauly, D.; Ulman, A.; Piroddi, C.; Bultel, E.; Coll, M. ‘Reported’ versus ‘likely’ fisheries catches of four Mediterranean countries. Sci. Mar. 2014, 78, 11–17. [Google Scholar] [CrossRef]
  98. Casalduero, M.G. La pesca marítima recreativa: En el marco de la política pesquera común. Rev. Catalan-Dret Ambient. 2021, 12, 1–36. [Google Scholar] [CrossRef]
  99. Francour, P.; Ganteaume, A.; Poulain, M. Effects of boat anchoring in Posidonia oceanica seagrass beds in the Port-Cros National Park (NW Mediterranean Sea). Aquat. Conserv. 1999, 9, 391–400. [Google Scholar] [CrossRef]
  100. BOE-A-2007-21490- Ley 42/2007, de 13 de Diciembre, del Patrimonio Natural y de la Biodiversidad. Available online: https://www.boe.es/eli/es/l/2007/12/13/42/con (accessed on 1 November 2023).
  101. Guidetti, P.; Di Franco, A.; Calò, A.; Belharet, M.; Claudet, J.; Carbonara, P.; Coll, M.; Corrales, X.; Font, T.; Ligas, A.; et al. Marine Protected Areas: Network(s) for Enhancement of Sustainable Fisheries in EU Mediterranean Waters Safe Net: Sustainable Fisheries in EU Mediterranean Waters through Network of MPAs; Publications Office of the EU: Luxembourg, 2019; Available online: https://op.europa.eu/fr/publication-detail/-/publication/d6a7167b-f17a-11ea-991b-01aa75ed71a1/language-en/format-PDF/source-153083541 (accessed on 16 November 2023).
  102. Lanz, E.; Nevarez-Martinez, M.; López-Martínez, J.; Dworak, J.A. Small pelagic fish catches in the Gulf of California associated with sea surface temperature and chlorophyll. CalCOFI Rep. 2009, 50, 134–146. [Google Scholar]
  103. Ottersen, G.; Stige, L.C.; Durant, J.M.; Kung-Sik, C.; Rouyer, T.A.; Drikwater, K.F.; Stenseth, N.C. Temporal shifts in recruitment dynamics of North Atlantic fish stocks: Effects of spawning stock and temperature. Mar. Ecol. Prog. Ser. 2013, 480, 205–225. [Google Scholar] [CrossRef]
  104. Pennino, M.G.; Coll, M.; Albo-Puigserver, M.; Fernández-Corredor, E.; Steenbeek, J.; Giráldez, A.; González, M.; Esteban, A.; Bellido, J.M. Current and future influence of environmental factors on small pelagic fish distributions in the Northwestern Mediterranean Sea Front. Mar. Sci. 2020, 7, 566340. [Google Scholar] [CrossRef]
  105. Chust, G.; Borja, Á.; Caballero, A.; Irigoien, X.; Sáenz, J.; Moncho, R.; Marcos, M.; Liria, P.; Hidalgo, J.; Valle, M.; et al. Climate change impacts on coastal and pelagic environments in the southeastern Bay of Biscay. Clim. Res. 2011, 48, 307–332. [Google Scholar] [CrossRef]
  106. Wazneh, H.; Gachon, P.; Laprise, R.; de Vernal, A.; Tremblay, B. Atmospheric blocking events in the North Atlantic: Trends and links to climate anomalies and teleconnections. Clim. Dyn. 2021, 56, 2199–2221. [Google Scholar] [CrossRef]
  107. Polo, J.; Punzón, A.; Vasilakopoulos, P.; Somavilla, R.; Hidalgo, M. Environmental and anthropogenic driven transitions in the demersal ecosystem of Cantabrian Sea. ICES J. Mar. Sci. 2022, 79, 2017–2031. [Google Scholar] [CrossRef]
  108. Freire, J.; García-Allut, A. Socio-economic and biological causes of management failures in European artisanal fisheries: The case of Galicia (NW Spain). Mar. Pol. 2000, 24, 375–384. [Google Scholar] [CrossRef]
  109. Álvarez-Salgado, X.A.; Labarta, U.; Fernández-Reiriz, M.J.; Figueiras, F.G.; Rosón, G.; Piedracoba, S.; Filgueira, R.; Cabanas, J.M. Renewal time and the impact of harmful algal blooms on the extensive mussel raft culture of the Iberian coastal upwelling system (SW Europe). Harmful Algae 2008, 7, 849–855. [Google Scholar] [CrossRef]
  110. Loureiro, M.L.; Ribas, A.; López, E.; Ojea, E. Estimated costs and admissible claims linked to the Prestige oil spill. Ecol. Econ. 2006, 59, 48–63. [Google Scholar] [CrossRef]
  111. Villasante, S.; Tubío, A.; Gianelli, I.; Pita, P.; García-Allut, A. Ever Changing Times: Sustainability Transformations of Galician Small-Scale Fisheries. Front. Mar. Sci. 2021, 8, 712819. [Google Scholar] [CrossRef]
  112. Macho, G.; Naya, I.; Freire, J.; Villasante, S.; Molares, J. The key role of the barefoot fisheries advisors in the co-managed TURF system of Galicia (NW Spain). AMBIO 2013, 42, 1057–1069. [Google Scholar] [CrossRef]
  113. Pita, P.; Villasante, S. The building of a management system for marine recreational fisheries in Galicia (NW Spain). Ocean Coast. Manag. 2019, 169, 191–200. [Google Scholar] [CrossRef]
  114. García-Allut, A. La pesca artesanal, el cambio y la patrimonialización del conocimiento. PH Bol. Instit. Andal. Patrim. Hist. 2003, 11, 74–83. [Google Scholar] [CrossRef]
  115. Frangoudes, K.; Marugán-Pintos, B.; Pascual-Fernández, J.J. From open access to co-governance and conservation: The case of women shellfish collectors in Galicia (Spain). Mar. Policy 2008, 32, 223–232. [Google Scholar] [CrossRef]
  116. Ardan Report. El Sector de la Pesca en Galicia. 2018. Available online: https://www.ardan.es/ardan/informe2018/CAPITULO_11.pdf (accessed on 12 June 2023).
  117. Xunta de Galicia. Enquisa Sobre a Poboación Ocupada nos Sectores da Pesca e da Acuicultura Mariña en Galicia (Ocupesca 2019). 2019. Available online: https://www.pescadegalicia.gal/Publicaciones/Ocupesca2019/index (accessed on 20 July 2023).
  118. IGE—Instituto Galego de Estatística Pesca y Acuicultura. 2020. Available online: https://www.ige.eu/web/mostrar_actividade_estatistica.jsp?idioma=gl&codigo=0301004# (accessed on 20 July 2023).
  119. Xunta de Galicia. Fisheries Yearbook 2021. Available online: https://www.pescadegalicia.gal/Publicaciones/AnuarioPesca2020/index.htm (accessed on 20 July 2023).
  120. Piñeiro-Antelo, M.Á.; Santos, X.M. Shellfishing on foot and the road to defeminization in Galicia (Spain). Marit. Stud. 2021, 20, 341–354. [Google Scholar] [CrossRef]
  121. Castro, J.J.; Incierta capacidad de regeneración del mar. La Vanguardia. 2004. Available online: http://hdl.handle.net/10553/1329 (accessed on 23 August 2023).
  122. Sommer, M. Pesca de arrastre. Aniquilación silencionsa. REDVET Rev. Electrón. Vet. 2005, 6, 4. Available online: https://www.redalyc.org/pdf/636/63612647016.pdf (accessed on 20 July 2023).
  123. BOE-A-2001-6008. Ley 3/2001, de 26 de Marzo, de Pesca Marítima del Estado. BOE 075 de 28/03/2001 Sec 1 Pag 11509 a 11532. Available online: https://www.boe.es/eli/es/l/2001/03/26/3/con (accessed on 20 July 2023).
  124. Nijibizi-Villacrés, N.C. Impacto Económico de la Política Pesquera Común en el Sector Pesquero Español; Trabajo Fin de Grado, Grado en Economía, Curso 2019–2020; Universidad de Cantabria: Santander, Spain, 2019; p. 45. Available online: http://hdl.handle.net/10902/17899 (accessed on 23 August 2023).
  125. BOE-A-2010-20050 Ley 41/2010, de 29 de Diciembre, de Protección del Medio Marino. Available online: https://www.boe.es/eli/es/l/2010/12/29/41/con (accessed on 20 July 2023).
  126. García-Negro, M.C.; Zotes, Y.N. El trabajo de las mujeres en el sector pesquero gallego: Análisis de los problemas relacionados con su tratamiento estadístico. Rev. Galega Econ. 2006, 15, 1–25. Available online: https://www.usc.es/econo/RGE/Vol15_1/castelan/art6c.pdf (accessed on 23 August 2023).
  127. Red Española de Mujeres en el Sector Pesquero (REMSP. Seguimiento Sobre la Situación de la Mujer en el Sector Pesquero y Acuícola. 2020. Available online: https://www.mapa.gob.es/es/pesca/temas/red-mujeres/1seguimiento-en-cifras-sobre-la-situacion-laboral-de-la-mujer-en-el-sector-mayo_tcm30-425320.pdf (accessed on 20 July 2023).
  128. Muñoz, J.L.; Cárdenas, S. La pesca artesanal en el caladero de Conil (Golfo de Cádiz). In Acuicultura, Pesca y Marisqueo en el Golfo de Cádiz, Sevilla; Morales, J.L., Mata, A.J., Rodríguez, A., Revilla, C.J., Eds.; Dirección General de Pesca y Acuicultura de la Junta de Andalucía: Sevilla, Spain, 2005; pp. 204–223. [Google Scholar]
  129. Coll, M.; Bellido, J.M.; Pennino, M.G.; Albo-Puigserver, M.; Báez, J.C.; Christensen, V.; Corrales, X.; Fernández-Corredor, E.; Giménez, J.; Julià, L.; et al. Retrospective analysis of the pelagic ecosystem of the Western Mediterranean Sea: Drivers, changes and effects. Sci. Total Environ. 2024, 907, 167790. [Google Scholar] [CrossRef]
Figure 1. Location of the four marine regions included in this study including their respective Natura 2000 marine protected areas. Modified from LIFE IP INTEMARES https://intemares-drupal.entorno-desarrollo.es/mapa (accessed 2 September 2023).
Coasts 04 00010 g001
Figure 2. Summary of the conceptual framework of the DPSIR analysis to study complex interrelationships between ecosystem services, human well-being, the loss of marine biodiversity, and the conservation and management responses by society to stop and/or mitigate this loss, showing the number of indicators included in each DPSIR block by marine region studied. See Annex 1 for a detailed list of indicators and their sources.
Coasts 04 00010 g002
Figure 3. Evolution of the temporal trends of the average indicators included in the state (dark green line) in the study areas: (A) Gulf of Cádiz and (B) Alborán Sea. The gray shade represents the standard deviation and the dotted line the trend. The mean values of the integrated indices are also shown: exploited marine biodiversity (dry green line) and jeopardized biodiversity (bright green line).
Coasts 04 00010 g003
Figure 4. Evolution of the temporal trends of the average indicators included in the impacts (burgundy line) in the study areas: (A) Gulf of Cádiz and (B) Alborán Sea. The gray shade represents the standard deviation and the dotted line the trend. Mean values of the integrated indices are also shown: provisioning ecosystem services (red line), cultural ecosystem services (blue line), and regulating ecosystem services (green line).
Coasts 04 00010 g004
Figure 5. Evolution of the temporal trends of the average indicators included in the responses (purple line) in the study areas: (A) Gulf of Cádiz and (B) Alborán Sea. The gray shade represents the standard deviation and the dotted line the trend. The mean values of the integrated indices are also shown: action plans and management responses (purple line) and the development of marine protected areas as conservation responses (pink line).
Coasts 04 00010 g005
Figure 6. Evolution of the temporal trends of the average indicators included in the drivers (orange line) in the study areas: (A) Gulf of Cádiz and (B) Alborán Sea. The gray shade represents the standard deviation and the dotted line the trend. The mean values of the integrated indices are also shown: social drivers (yellow line), economical drivers (blue line), and cultural drivers (green line).
Coasts 04 00010 g006
Figure 7. Evolution of the temporal trends of the mean indicators included in the pressures (dark blue line) in the study areas: (A) Gulf of Cádiz and (B) Alborán Sea. The gray shade represents the standard deviation. The mean values of the integrated indices are also shown: overexploitation (light orange line) and transformation of land use (light blue line).
Coasts 04 00010 g007
Figure 8. Evolution of the temporal trends of the average indicators included in the state (dark green line) in the study areas: (A) Galicia and (B) Asturias. The gray shade represents the standard deviation and the dotted line the trend. The mean values of the integrated indices are also shown: exploited marine biodiversity (dry green line) and threatened biodiversity (bright green line).
Coasts 04 00010 g008
Figure 9. Evolution of the temporal trends of the average indicators included in the impacts (burgundy line) in the study areas: (A) Galicia and (B) Asturias. The gray shade represents the standard deviation and the dotted line the trend. Mean values of the integrated indices are also shown: provisioning ecosystem services (red line), cultural ecosystem services (blue line), and regulating ecosystem services (green line).
Coasts 04 00010 g009
Figure 10. Evolution of the temporal trends of the average indicators included in the responses (purple line) in the study areas: (A) Galicia and (B) Asturias. The gray shade represents the standard deviation and the dotted line the trend. The mean values of the integrated indices are also shown: action plans and management responses (purple line) and the development of marine protected areas as conservation responses (pink line).
Coasts 04 00010 g010
Figure 11. Evolution of the temporal trends of the average indicators included in the drivers (orange line) in the study areas: (A) Galicia and (B) Asturias. The gray shade represents the standard deviation and the dotted line the trend. The mean values of the integrated indices are also shown: social drivers (yellow line), economic drivers (blue line), and cultural drivers (green line).
Coasts 04 00010 g011
Figure 12. Evolution of the temporal trends of the average indicators included in the pressures (dark blue line) in the study areas: (A) Galicia and (B) Asturias. The gray shade represents the standard deviation. The mean values of the integrated indices are also shown: overexploitation (light orange line) and transformation of land use (light blue line).
Coasts 04 00010 g012
Table 1. Summary of the Natura 2000 marine protected areas included in this study. Surface extracted from https://natura2000.eea.europa.eu/ (accessed 2 September 2023).
Natura 2000 Site CodeMarine DemarcationSurface (ha)Autonomous CommunityProvinceMarine Region
ES0000506 Bahía de AlmeríaStrait—Alborán126,791.49AndalusiaAlmeríaAlborán
ESZZ16005 Espacio marino de AlboránStrait—Alborán37,276.80AndalusiaAlmeríaAlborán
ES0000505 Espacio marino de la Isla de AlboránStrait—Alborán66,154.67AndalusiaAlmeríaAlborán
ESZZ16003 Sur de Almería—Seco de los OlivosStrait—Alborán283,081.01AndalusiaAlmeríaAlborán
ES0000504 Bahía de Málaga—Cerro GordoStrait—Alborán60,975.83AndalusiaMálagaAlborán
ES0000500 Golfo de CádizSouth Atlantic231,316.84AndalusiaCádiz/HuelvaGulf of Cádiz
ESZZ12002 Volcanes de fango del Golfo de CádizSouth Atlantic317,761.11AndalusiaCádiz/HuelvaGulf of Cádiz
ES0000501 Espacio marino del Tinto y del OdielSouth Atlantic4934.07AndalusiaHuelvaGulf of Cádiz
ESZZ12001 Banco de Galicia North Atlantic1,022,788.2GaliciaA CoruñaGalicia
ES0000498 ZEPA Banco de GaliciaNorth Atlantic872,270GaliciaA CoruñaGalicia
ES0000497 Espacio marino de la Costa da MorteNorth Atlantic316,516.57GaliciaA CoruñaGalicia
ES0000496 Espacio marino de la Costa de Ferrolterra-ValdoviñoNorth Atlantic6822.31GaliciaA CoruñaGalicia
ES0000499 Espacio marino de las Rías Baixas de Galicia North Atlantic222,020.30GaliciaA CoruñaGalicia
ES0000495 Espacio marino de Punta de Candelaria-Ría de Ortigueira-Estaca de BaresNorth Atlantic77,203.19GaliciaA Coruña/LugoGalicia
ESZZ12003 Sistema de cañones submarinos de AvilésNorth Atlantic338,770.59AsturiasAsturiasAsturias
ES0000494 Espacio marino de Cabo PeñasNorth Atlantic32,045.79AsturiasAsturiasAsturias
Table 2. Pearson correlation analysis showing the associations between the mean value of the indices of each DPSIR dimension for the marine areas of the Gulf of Cádiz and Alborán Sea. The significance level at 95% confidence is shown in bold.
DPSIR Indicators BlockDrivers (Average)Pressures (Average)State
(Average)
Impacts (Average)Responses (Average)
Gulf of Cádiz
Drivers (average)-
Pressures (average)0.201-
State (average)−0.7260.042-
Impacts (average)−0.023−0.3760.257-
Responses (average)0.761−0.040−0.927−0.053-
Alborán Sea -
Drivers (average)
Pressures (average)0.228-
State (average)−0.6380.059-
Impacts (average)−0.4440.2330.692-
Responses (average)0.5580.198−0.873−0.765-
Table 3. Mean value trends of all indicators included in each DPSIR dimension for the Gulf of Cádiz and Alborán Sea.
DPSIR
Dimension
Slope Gulf of CádizTrend Gulf of CádizSlope Alborán SeaTrend Alborán Sea
DRIVERS0.0540.034
PRESSURES0.0040.006
STATE−0.082↓↓−0.075
IMPACTS−0.006−0.026
RESPONSES0.0690.076
Table 4. Trends of the aggregated indicators for the Gulf of Cádiz and Alborán Sea.
DPSIR
Dimension
TypeTrend in Gulf of CádizTrend in Alborán Sea
DRIVERSDemographic↑↑↑↑
Economical
Cultural
PRESSURESOverexploitation↓↓↓↓
Land use change↑↑↑↑
STATEExploited biodiversity↓↓
Jeopardized biodiversity↓↓
IMPACTSProvisioning ES↓↓
Cultural ES
Regulating ES↓↓
RESPONSESBiodiversity management (action and management plans)
Biodiversity conservation (development of marine protected areas)↑↑
Table 5. Pearson correlation analysis showing the associations between the mean value of the indices of each DPSIR dimension for the marine areas of Galicia and Asturias. The significance level at 95% confidence is shown in bold.
DPSIR Indicators BlockDrivers (Average)Pressures (Average)State
(Average)
Impacts (Average)Responses (Average)
Galicia
Drivers (average)-
Pressures (average)−0.715
State (average)−0.5870.633
Impacts (average)−0.2640.320−0.338
Responses (average)0.659−0.692−0.9550.257-
Asturias
Drivers (average)-
Pressures (average)−0.815
State (average)−0.3980.641
Impacts (average)−0.3200.111−0.480
Responses (average)0.268−0.543−0.9580.640-
Table 6. Mean value trends of all indicators included in each DPSIR dimension for Galicia and Asturias.
DPSIR
Dimension
Slope GaliciaTrend GaliciaSlope Asturias Trend Asturias
DRIVERS0.0250.009
PRESSURES−0.0800.048↓↓
STATE−0.042−0.032
IMPACTS0.0260.034
RESPONSES0.05−0.086
Table 7. Trends of the aggregated indicators for Galicia and Asturias.
DPSIR
Dimension
TypeTrend in GaliciaTrend in Asturias
DRIVERSDemographic↑↑
Economical↑↑
Cultural↑↑↑↑
PRESSURESOverexploitation↓↓↓↓
Land use change↑↑↑↑
STATEExploited biodiversity↓↓↓↓
Jeopardized biodiversity
IMPACTSProvisioning ES
Cultural ES
Regulating ES
RESPONSESBiodiversity management (action and management plans)
Biodiversity conservation (development of marine protected areas)↑↑↑↑
Disclaimer/Publisher’s Note: The statements, opinions and data contained in all publications are solely those of the individual author(s) and contributor(s) and not of MDPI and/or the editor(s). MDPI and/or the editor(s) disclaim responsibility for any injury to people or property resulting from any ideas, methods, instructions or products referred to in the content.

