Article

Forty Years of No-Take Protection Preserves Local Fish Diversity in a Small Urban Marine Protected Area

1
Fisheries Research, Marine Ecosystems, NSW Department of Primary Industries, Coffs Harbour 2450, Australia
2
Fisheries Research, Marine Ecosystems, NSW Department of Primary Industries, Taylors Beach 2316, Australia
*
Author to whom correspondence should be addressed.
Coasts 2023, 3(4), 401-413; https://doi.org/10.3390/coasts3040024
Submission received: 5 September 2023 / Revised: 18 October 2023 / Accepted: 3 November 2023 / Published: 6 November 2023

Abstract

:
Small no-take marine protected areas (MPAs) in urban settings can fail to adequately protect biodiversity due to the combined effects of illegal fishing and species emigrating outside the protected area boundaries. Further assessment of the effectiveness of these areas is needed to provide insights into how they can best be managed to generate conservation benefits. The Fly Point no-take MPA in Port Stephens, New South Wales, Australia, was used as a case study, with the objective of examining whether a small urban no-take MPA can produce conservation benefits, despite the handicaps imposed by its size and location. Diver-based underwater visual census data, recording fish species and abundances, was obtained from 434 surveys conducted in Port Stephens (2009–2022) at three sites within the Fly Point no-take MPA and at three surrounding sites open to fishing. These data were analysed using permutational multivariate analysis of variance to determine whether no-take protection significantly benefited fish species richness and diversity. We found significantly higher species richness for sites in the no-take MPA than in surrounding areas and significant differences in assemblages between no-take and fished areas, driven in part by greater abundances of two fishery-targeted species in the no-take MPA (Acanthopagrus australis and Scorpis lineolata). Generally, fish diversity was also significantly higher for sites within the no-take MPA, although diversity was also high in fished sites adjacent to the no-take MPA. Study results demonstrate that small urban no-take MPAs can provide conservation benefits, especially when these areas have been protected for more than a decade and where high visibility and local stewardship enable adequate enforcement of no-take restrictions. Consequently, planning for MPAs in urban areas should endeavour to ensure high levels of public support and, ideally, should situate MPAs in highly visible locations, in order to maximise their conservation outcomes.

1. Introduction

Globally, marine ecosystems are important and are being subjected to increased pressure from a range of stressors, including overfishing, climate change and pollution [1,2,3]. These pressures have led to global declines in fish stocks and marine biodiversity [4,5]. Marine protected areas (MPAs) have been promoted as a mechanism to address these declines and protect biodiversity, particularly through the implementation of no-take MPAs where all extractive fishing activities are prohibited [6,7]. However, a pivotal study by Edgar et al. (2014) [8] identified that, to be effective, MPAs need to incorporate five key features: they need to be no-take, and they should be large (>100 km2), well enforced, isolated and protected over a long period (>10 y).
MPAs that do not meet these criteria often fail to adequately protect biodiversity and abundance [8,9,10]. This poor performance can occur due to a range of factors; for example, if MPAs are not no-take, then over-harvesting can reduce their ability to protect biodiversity and abundance [11,12]. Similarly, even if MPAs are no-take, illegal harvesting can reduce effectiveness, particularly for MPAs close to urban centres or MPAs where there is inadequate enforcement of no-take restrictions [13]. Additionally, small MPAs can experience increased levels of emigration compared to larger MPAs, reducing conservation benefits due to animals leaving in pursuit of essential resources (e.g., food and living space [14]). The accrued benefits of implementing MPAs generally increase with MPA age [15]. However, this accrual of benefits is influenced by the size and location of the MPAs [16] and depends on enforcement of no-take restrictions [13]. The effectiveness of small urban no-take MPAs in protecting biodiversity is therefore highly variable, with examination of the performance of examples of this type of MPA needed to guide management actions to increase their effectiveness.
Here, we use the Fly Point no-take MPA in the Port Stephens Great Lakes Marine Park (PSGLMP) in New South Wales (NSW), Australia, as a case study, with the objective of examining whether a small urban no-take MPA can, contrary to expectations, provide conservation benefits in terms of preserving fish diversity. The performance of small urban MPAs in this region is not well documented in the existing literature and, based on the key features listed by Edgar et al. (2014) [8], the Fly Pt no-take MPA could be expected to perform poorly due to its small size (0.75 km2) and lack of isolation, with further information needed to ascertain its actual performance relative to surrounding fished areas. In 1983, the Fly Point–Halifax Park aquatic reserve was established based on its unique estuarine biodiversity, particularly for invertebrate and fish fauna, and its popularity with recreational scuba divers [17], with the taking of any fish or other marine life prohibited. The MPA was established to protect, manage and conserve the aquatic environment at Fly Point and Halifax Park in order to ensure that the ecological diversity and significance of the area is maintained, with MPA boundaries defined after public consultation to minimise conflict between user groups [17]. Subsequently, the aquatic reserve was incorporated as a marine park ‘sanctuary’ zone in the PSGLMP established in 2008, which continued the prohibition of any taking of fish or marine life. Consequently, Fly Point has been a no-take MPA for over 40 years and is sufficiently old to have generated substantial conservation benefits [8] and to have garnered high levels of public support, due to perceived higher recreational and environmental importance [18,19].
However, the no-take MPA is small, with just 0.75 km2 protected since 1983, either as an aquatic reserve or as part of the sanctuary zone within the PSGLMP. Additionally, the no-take MPA lies within an embayment that is heavily urbanised along its southern shoreline. Consequently, although the no-take MPA is old enough to show the benefits of protection, it is neither large enough nor sufficiently isolated to meet the criteria for effectiveness identified by Edgar et al. (2014) [8]. Conversely, the MPA’s urban setting enables increased enforcement effort, which may offset any impacts from illegal fishing [20]. Furthermore, diversity of habitat types will potentially have increased the performance of the Fly Pt no-take MPA, with the Port Stephens estuary sheltering diverse rocky reef, seagrass, macroalgae and sponge habitats [21] and with habitat diversity strongly linked to increased fish diversity [22]. Therefore, further assessment of the effectiveness of the no-take MPA at Fly Point is needed to provide new insights into whether small urban no-take MPAs can generate conservation benefits and into the factors influencing the performance of these MPAs, with this information essential for guiding ongoing management of the PSGLMP and other similar MPAs within NSW and elsewhere in the world.

2. Materials and Methods
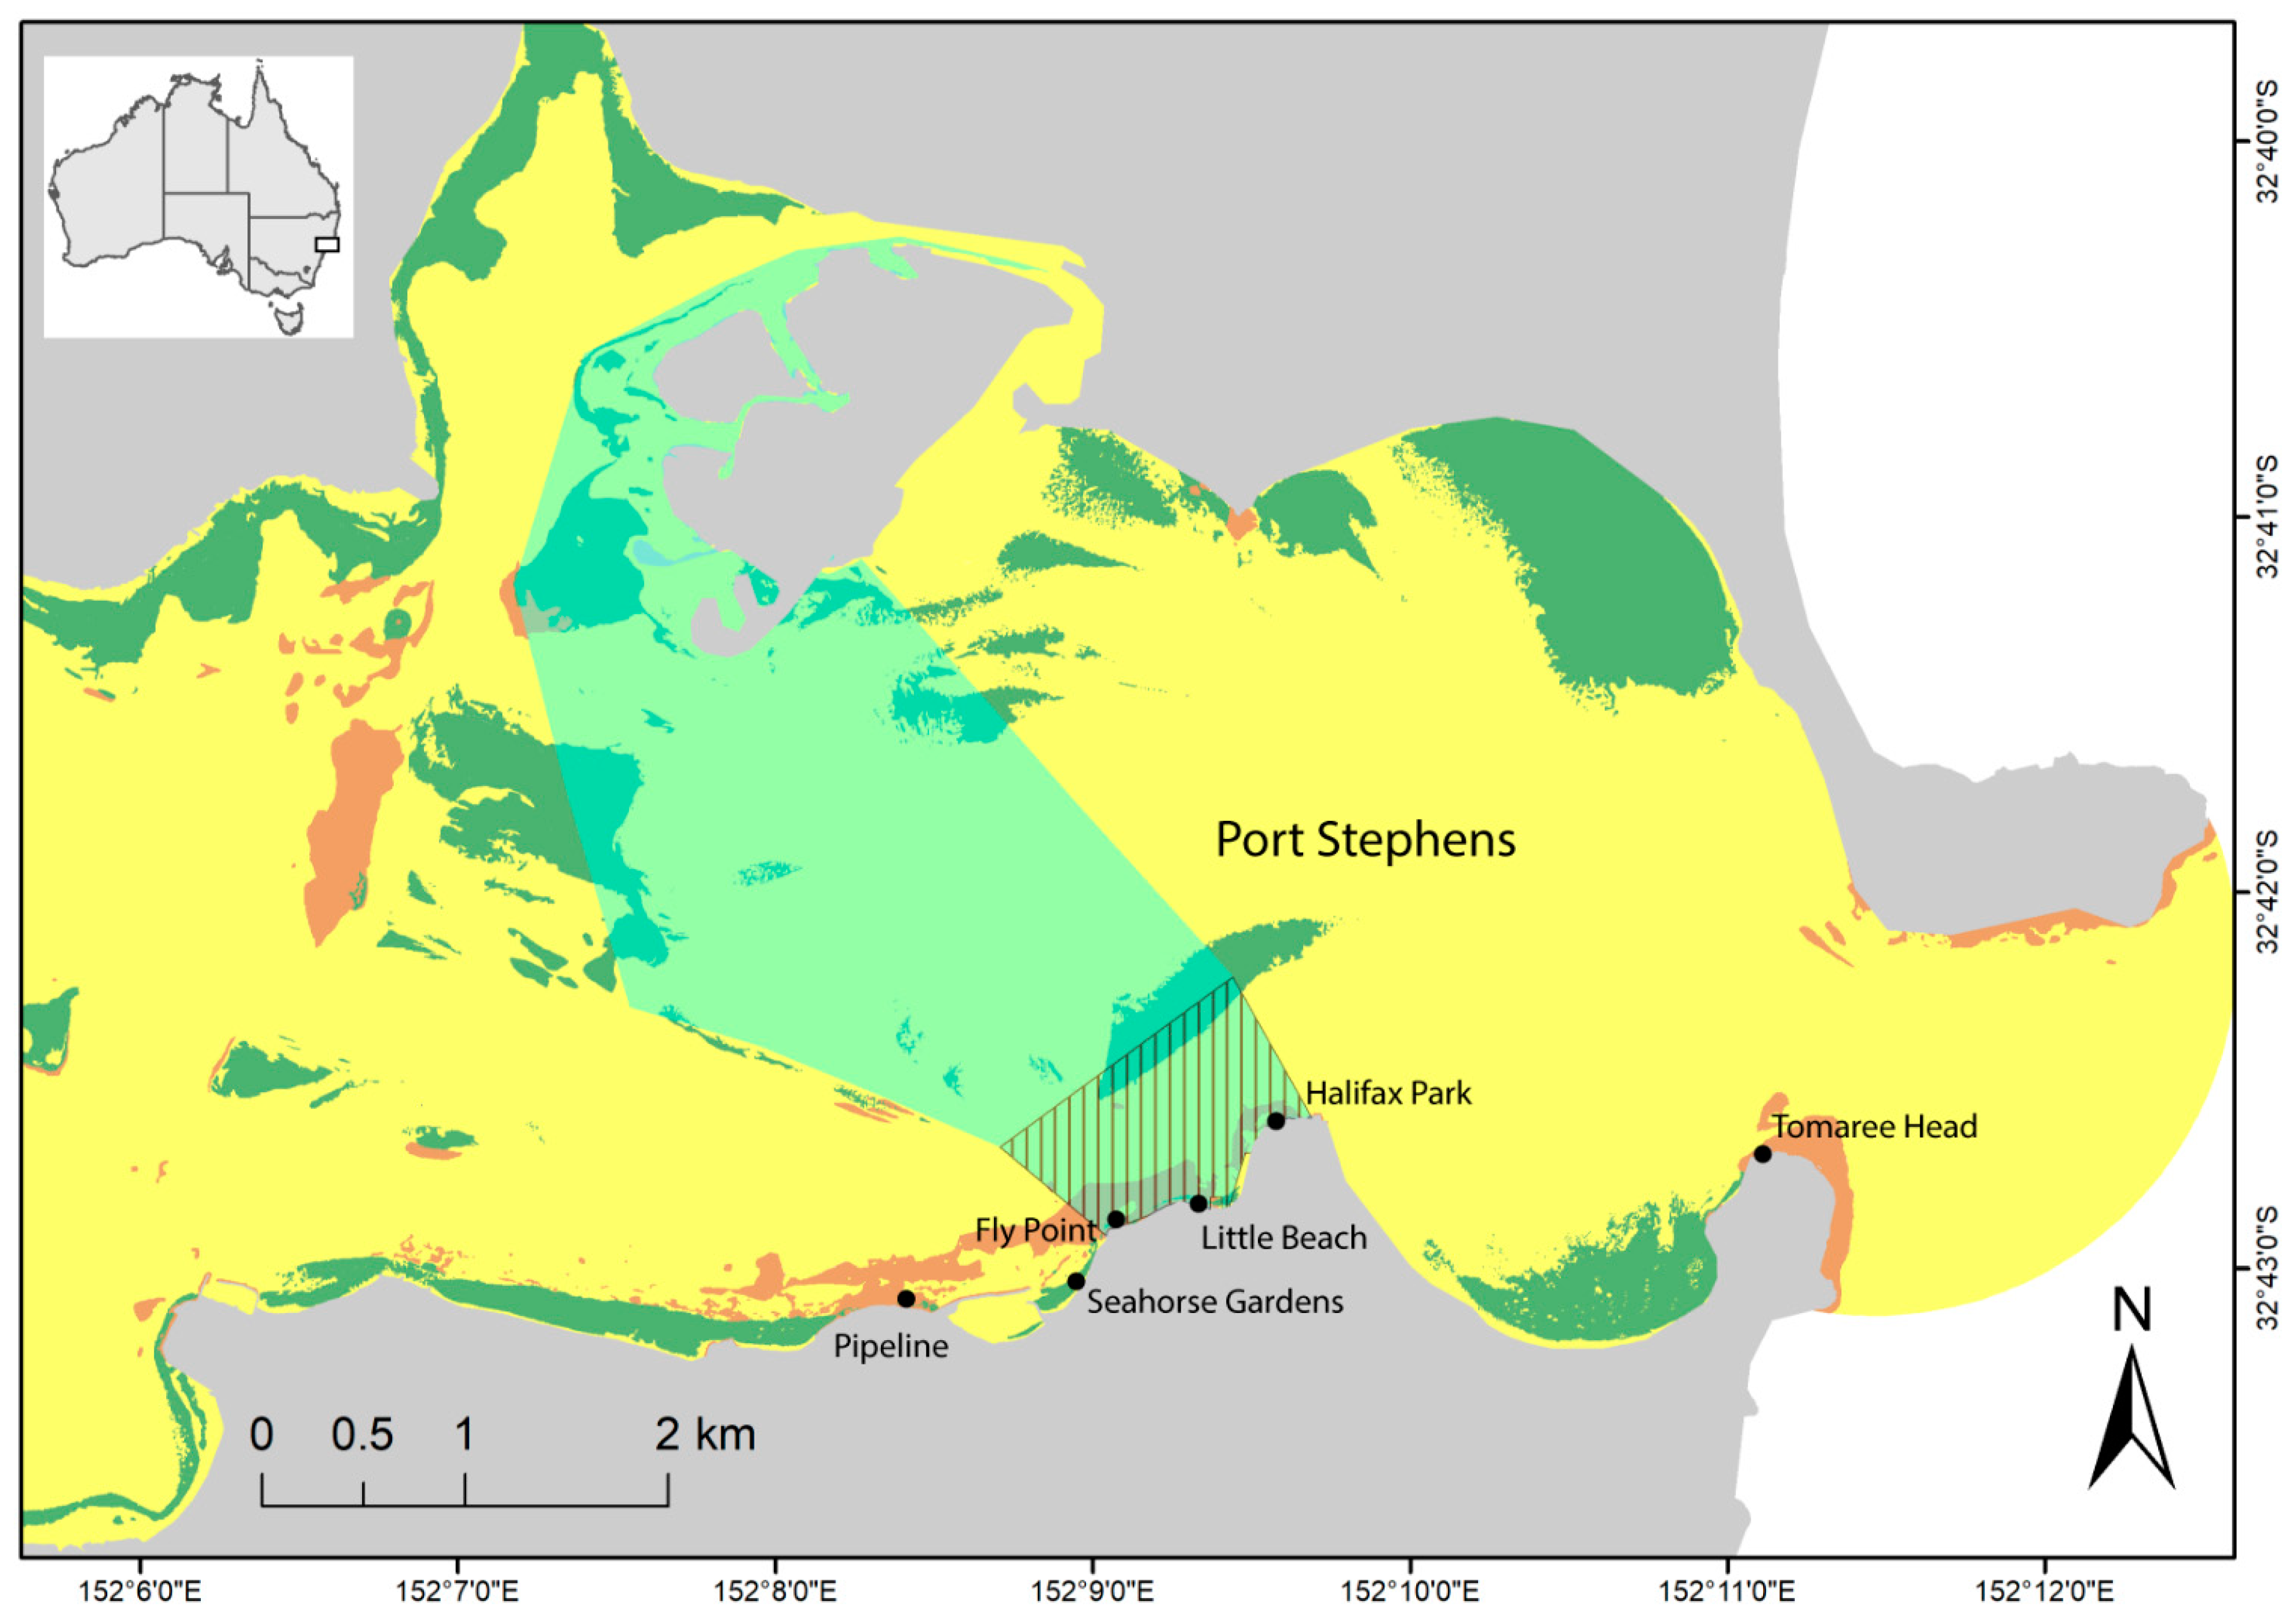
2.1. Study Area

Fish species and abundance data were collected using diver-based underwater visual censuses (UVCs) at six sites in the Port Stephens estuary (Figure 1). The study used a balanced design with three sites situated within the Fly Point no-take MPA (Fly Point, Little Beach and Halifax Park) and three sites outside this area and open to fishing (Pipeline, Seahorse Gardens and Tomaree Head). All sampling sites were chosen to be as similar as possible, being situated along the southern shoreline of the estuary on rocky reef covered predominantly by sponge and macro-algae habitats. Sites were influenced by strong tidal currents [21] and were in a narrow depth range from 5 to 12 m.
The Fly Point no-take MPA has been protected by no-take fishing restrictions since 1983, first as part of the Fly Point–Halifax Park Aquatic Reserve and then, in 2008, as a sanctuary zone within the PSGLMP [23] with the reserve boundary expanded across the Port Stephens estuary to the northern shoreline (Figure 1). All extractive activities have been prohibited within the aquatic reserve since 1983 and within the sanctuary zone since 2008. Within fished areas, both commercial and recreational fishing are permitted, although trawling is prohibited, reducing the benthic impacts from commercial fishing. All sites examined were on the southern shore, where most rocky reef habitats are concentrated. Sites were situated immediately adjacent to the shoreline (i.e., within 100 m), with no-take sampling sites situated so that they were within the boundaries of the 1983 aquatic reserve and thus protected by no-take restrictions for >40 years (Figure 1).

2.2. Sampling Methods

Data were collected by the Reef Life Survey Foundation (RLS) from 2008 to 2022. No prior survey data for fish assemblages were available at the survey sites, with RLS data not available before 2008, as the RLS program was not running prior to this date [24]. The RLS data, therefore, provided the only available baseline data against which changes in fish assemblages could be measured. RLS is a citizen science program that collects high-quality underwater visual census data in close collaboration with university ecologists [25]. Volunteer-generated data from the RLS program are comparable to those obtained by scientific dive teams due to the rigorous selection and training of volunteers, with variation between individual divers contributing little to the total estimated variance between transects when compared to residual variation between replicate transects and variation between sites [24]. Data were predominantly collected during the Austral summer–autumn period (December–May), when water temperatures and species richness are generally at their highest levels [22], with citizen science surveys targeted in this period to increase comparability among data. Preferential collection of citizen science data during the summer–autumn period will have introduced some unavoidable bias, especially to estimates of overall fish diversity, as data for species present predominantly during the winter–spring period will have been underrepresented.
The RLS methodology is based on underwater visual censuses along 50 m transects, conducted on hard reef along a depth contour (generally at depths < 20 m). Divers undertake three survey methods along each transect to capture the majority of large biota that can be surveyed visually: fish species richness and abundance (method 1), mobile invertebrates and cryptic fishes (method 2) and photoquadrats of the substrate (method 3). Method 1 data were used in study analyses, with method 1 surveys quantifying fish species and their abundances by combining data from duplicate 5 m wide belts on either side of transects. Each RLS survey consisted of a single 50 m transect, conducted from a haphazardly selected starting location, with all surveys conducted during daylight hours, when visibility was >5 m. Method 1 fish counts were conducted immediately after transects were laid to minimise diver disturbances of fish assemblages. Surveys with missing data or outliers were screened out during RLS quality assurance procedures. Details of RLS survey methods, diver training and data quality assessment are described in Edgar and Stuart-Smith (2009) [24] and Edgar and Stuart-Smith (2014) [26]. Method 1 data from 434 RLS surveys at the study sites were downloaded from the Australian Open Data Network (AODN) web portal (portal.aodn.org.au, accessed on 11 May 2023), with the number of surveys at sites and during each year varying due to differences in citizen scientist survey efforts (Table 1).

2.3. Statistical Analysis

Metric multidimensional scaling (mMDS) analyses were conducted using the PRIMER 7 software package [27] to examine differences in average fish assemblages among area types (no-take vs. fished). For all analyses, similarity matrices were constructed using the Bray–Curtis index [28] using data that were square-root transformed to reduce the influence of abundant species. Permutational multivariate analysis of variance (PERMANOVA) analyses were used to test for significant differences among fish assemblages and fish species richness in surveys (survey species richness) using a three-factor design with factors of area type (fixed, no-take or fished), sites nested within area type (random) and year (random). PERMANOVA analyses were used as they provide a robust and flexible method for analysing multivariate data, even with complex sampling structures and experimental designs [29]. Species driving dissimilarities among the areas were identified using the SIMPER routine within PRIMER [27]. The effects of variations in environmental variables among surveys and variations in habitat and structural complexity among sites were not considered in the analyses.
The overall fish diversity for Port Stephens (gamma diversity) and fish diversity at each site (alpha diversity) were estimated through extrapolation of species accumulation curves using EstimateS Version 9.1.0 software [30], with upper and lower 95% confidence intervals calculated using the non-parametric, individual-based, species richness estimation technique (Chao-1) [31]. This method extrapolates the species accumulation curve obtained from samples in order to predict its asymptote, which provides an estimate of species richness that is independent of sampling effort. Significant differences among sites (p < 0.05) were conservatively established by comparing 95% confidence intervals for alpha diversity among sites, with non-overlap of 95% confidence intervals indicating a significant difference as per Colwell (2013) [30].

3. Results

3.1. Variations in Fish Assemblages among Area Types

Across all 434 RLS surveys, 321 species of fish were detected using UVC, with 121 species (38%) found only in the no-take MPA, 32 only in the fished area (10%) and 168 species in both areas (52%). Overall, a total of 273,025 fish were detected with the most abundant species being the small schooling planktivores Trachurus novaezelandiae (46,796) and Atypichthys strigatus (49,106).
Significant differences in fish assemblages were detected between the no-take MPA and the surrounding fished area (p = 0.041) with mMDS analyses showing a distinct separation between the average assemblages from these two areas (Figure 2). Significant differences were also detected among sites within areas (p < 0.001) and among years (p < 0.001). Differences in assemblages between areas were primarily driven by higher abundances of the small schooling planktivores T. novaezelandiae and A. strigatus in the fished areas and higher abundances of fishery-targeted species Acanthopagrus australis and Scorpis lineolata within the no-take MPA (Table 2). The abundances of recreationally and commercially targeted A. australis were 11 times greater in the no-take MPA than in the surrounding fished area, while the abundances of the slow-growing and long-lived fisheries-targeted species S. lineolata were more than two times greater in the no-take MPA (Table 2).

3.2. Variations in Survey Species Richness among Areas and Sites

Survey species richness was significantly higher (p = 0.024) in the no-take MPA (32.3 ± 0.5, mean ± S.E) than in the surrounding fished areas (25.9 ± 0.7). Significant differences were also detected among sites within areas (p < 0.001) and among years (p = 0.004). Examining survey-species richness at individual sites (Figure 3) identified that Fly Point in the no-take MPA had significantly higher average survey-species richness than all other sites (p < 0.003), that sites in the no-take MPA generally had higher average survey-species richness than sites in the fished areas and that Pipeline, in the fished areas, had the lowest average survey-species richness (Figure 3).

3.3. Temporal Trends in Survey-Species Richness

Examining changes in survey-species richness over time, for no-take and fished areas separately, identified that no significant changes in survey-species richness occurred over time within the no-take MPA (p = 0.465, Figure 4a), whereas survey-species richness declined significantly over time in the fished areas (p = 0.006, Figure 4b). Declines in survey-species richness at fished sites were due to a combination of reduced detections of some fisheries-targeted species in later years (i.e., Achoerodus viridis, Girella tricuspidata and Platycephalus fuscus) and reductions in the numbers of tropical-associated species that were observed.

3.4. Fish Regional (Gamma) Diversity and Site (Alpha) Diversity

Based on the sites surveyed, the total diversity for fish species in Port Stephens (gamma diversity) was estimated as 315–401 species (Chao 1, 95% confidence interval). The total diversity of fish species at individual sites (alpha diversity) varied among sites, being highest at Fly Point in the no-take MPA (234–295 species) and lowest at Tomaree Head in the fished areas (98–150 species, Figure 5). Generally, alpha diversity was significantly higher for sites in the no-take MPA than for sites in the fished areas (p < 0.05, Figure 5). The exception to this trend was the Pipeline site in the fished areas, which had alpha diversity that was not significantly different to the no-take sites (Figure 5). The Pipeline site is heavily targeted by fishermen due to its close proximity to the Nelson Bay Marina Breakwall; hence, the observed high diversity at this site cannot be attributed to lower fishing effort. Rather, high diversity is likely due to the diverse habitats at this site, with rocky reef, seagrass, macroalgae and sponge habitats all present [21], and due to the proximity of the marina breakwall, with artificial reef structures known to provide shelter to a diverse range of fish species in Port Stephens [32]. The lowest alpha diversity occurred for the fished site farthest from the no-take zone (i.e., Tomaree Head).

4. Discussion

4.1. MPA Age and No-Take Effects

This study demonstrates that a small-scale no-take MPA in an urban setting can provide substantial conservation benefits. The Fly Point no-take MPA in Port Stephens showed significant benefits from >40 years of no-take protection, with sites within this area having significantly higher fish survey species richness than surrounding fished sites. Differences between the no-take and fished sites were partly due to significant declines in survey-fish species richness at fished sites since 2008, whereas the no-take MPA preserved survey-species richness over the same period, with no significant declines in survey-species richness recorded. The observed declines in survey-species richness at the fished sites may have partly been driven by the increased urbanisation of Port Stephens, with an associated increase in the human population (+10% from 2006–2021, www.abs.gov.au, accessed on 11 July 2023). The increased human population will have generated increased fishing pressure on the sites open to fishing, particularly through the increasing number of anglers living in the surrounding region. Additionally, urbanisation will have increased non-fishing-related pressures on the estuary, in both no-take and fished areas, including increased pollution from runoff and boating, negative impacts from the creation of new foreshore structures and moorings and damage from anchors and recreational diving activities [17]. However, within the no-take area, some of these pressures may have been reduced by other effective conservation measures (OECM), which can contribute to conserving biodiversity in protected areas [33]. Other effective conservation measures currently implemented in the no-take area include restrictions on new moorings and on anchoring in seagrass, with further research needed to determine whether OECM can further contribute to maintaining fish diversity and abundance within the no-take area.
Increasing human populations have led to global declines in many fish stocks [4,34], with increased fishing pressure, combined with displaced fishing efforts, potentially contributing to the lower abundances of the fishery-targeted species A. australis and S. lineolata at the sites open to fishing, as both of these species are regularly caught and kept by fishers in the region. Given that populations in NSW are projected to increase further over the coming decades (www.abs.gov.au, accessed on 11 July 2023), fishing pressures are likely to further increase in the future. This may exacerbate the current differences between fished and no-take areas, both in terms of fish diversity and abundances of fisheries-targeted species.
To date, climate-change-induced ocean warming is unlikely to have contributed to the observed differences in fish diversity between areas or to the changes in biodiversity detected in the fished area, as changes to water temperatures have been relatively small, compared to seasonal temperature variations. However, some impacts are likely to have occurred from increased severe weather events, but these will have impacted fish assemblages in both fished and no-take areas relatively equally, as was observed with impacts to benthic habitats, which occurred throughout the estuary following recent severe flooding [35]. It should be noted, however, that sites with lower levels of disturbance generally have increased resilience to natural disturbances [36], and this may enhance the ability of sites in the no-take area to resist any future impacts of climate change.

4.2. MPA Isolation and Enforcement Effects

Previous studies have shown that increased isolation of no-take protected areas contributes to their effectiveness, with more isolated no-take sites generally protected from illegal fishing by the difficulty and expense associated with accessing them [20,37]. Consequently, no-take MPAs farther from large population centres generally perform better than those closer to human populations [38]. However, increased isolation can also hinder enforcement efforts and where enforcement is hindered by isolation, this can, contrary to expectations, lead to increases in illegal fishing. For example, the Seal Rocks no-take MPA in NSW was found to have high levels of illegal fishing, even though it is considered a remote location, resulting in significant impacts on a fishery-targeted species [13].
Conversely, where no-take MPAs are near compliance operations, a greater level of protection is to be expected, even for those no-take sites within urban settings that are potentially exposed to high levels of illegal fishing. We hypothesise that this is the scenario experienced by the Fly Point MPA in the current study, with performance limitations imposed by the site’s lack of isolation and high human population offset by the site’s proximity to compliance operations. Additionally, Fly Point benefits from almost continuous public scrutiny, with the no-take MPA visible from shore, exposing illegal fishing activities to public view. In NSW there is a general public acceptance of the need for no-take MPAs [18,19], with local stewardship of these areas resulting in active reporting of illegal fishing activities using a government hotline (https://www.dpi.nsw.gov.au/fishing/compliance/report-illegal-activity, accessed on 17 July 2023). This local stewardship has potentially helped to ensure effective enforcement and low levels of noncompliance at Fly Point, which will have contributed to preserving the high species richness and diversity observed at the three sites within the no-take MPA. Similar public adoption of no-take MPAs, leading to good conservation outcomes, has occurred for other well-established MPAs, such as Goat Island in New Zealand [39] and in Hawaii [40]. Long-established and highly visible no-take MPAs are perceived by the public to provide access to pristine marine environments, which would otherwise be absent from the seascape and which are therefore deserving of high levels of protection [41,42].

4.3. MPA Size and Habitat Effects

Generally, small no-take MPAs tend to underperform, with numerous studies questioning the effectiveness of small no-take MPAs for protecting biodiversity and abundance [8,14]. Poor performance can occur due to mobility of targeted fish species, with mobile fish species able to move outside the boundaries of no-take MPAs to areas where they are subject to fishing pressures, thereby counteracting the benefits provided by no-take fishing restrictions. Additionally, small MPAs can perform poorly where they have poor connectivity to other MPAs, especially where they have limited self-recruitment or where their size is insufficient to maintain a viable population [43]. However, examples of small no-take MPAs providing conservation benefits do exist (e.g., [44,45,46,47]), with their success generally linked to good site selection, high levels of local stewardship, effective enforcement and MPAs being of sufficient size to protect a particular species’ home range [48,49]. Previous studies examining the effectiveness of other small but more isolated no-take MPAs within the PSGLMP have shown mixed results, with increases in fisheries-targeted species recorded at some sites [15,16], while little detectable change was observed at others [13,16]. These mixed performances are potentially due to variations in the speed of recovery following protection among these no-take sites but may also be due to other factors, such as their size, connectivity, habitat availability and level of enforcement. For example, within the Fingal Island no-take MPA in the PSGLMP, a lack of increases in fish abundance and diversity was attributed to poor site selection, due to the limited reef extent and low habitat complexity in the MPA [16], with other research indicating that species diversity is strongly influenced by habitat diversity [22] and structural complexity [32,50] within the PSGLMP.
Conversely, where no-take sites are situated so that they protect diverse reef systems, they can provide striking conservation outcomes, even if the no-take sites are relatively small [51,52]. The Fly Point no-take MPA provides a good example of this type of outcome, with this site initially protected due to the high diversity of habitats and the complex reef systems occurring at the site [17]. The current study demonstrates that no-take protection has achieved positive conservation outcomes, despite the small size of the no-take MPA, by preserving fish diversity and maintaining species richness over an extended period, while species richness has generally declined at surrounding fished sites. Additionally, Fly Point may have provided spill-over benefits to the Port Stephens estuary more generally, with fish diversity generally higher at fished sites closer to the no-take MPA than at those farther away. This indicates that fish may be beneficially emigrating from the no-take area, potentially increasing diversity and fishing opportunities for targeted species in the surrounding fished area. However, spill-over effects may also be negatively impacting some smaller species by increasing predator numbers, as has been observed for the endangered White’s seahorse in Port Stephens [53].
Finally, it should be noted that habitat diversity and structural complexity may have contributed to the variations in fish diversity observed among the sites, with research examining these factors in MPAs showing that they influence fish diversity and abundance [54,55]. Other potential confounding factors that may have influenced study results include variations in the numbers of surveys conducted at each site due to variations in citizen scientist sampling efforts and variations in the time of day and time of year when surveys were conducted. These issues could potentially be addressed through the implementation of a more rigorous sampling program, although it might be difficult to obtain adequate quantities of data from citizen scientist volunteers if excessive constraints are applied to sample locations and timings.

5. Conclusions

Study results demonstrate that small urban no-take MPAs can provide conservation benefits, especially when these areas have been protected for more than a decade and where high visibility and local stewardship enable adequate enforcement of no-take restrictions. It should be noted that our conclusions were based on citizen science data, which have a greater sampling intensity at no-take sites than at fished sites. Additionally, the effects of variations in habitat complexity and structural complexity among sampling sites were not considered in the analyses. Further research is needed to disentangle the relative contributions to fish diversity and abundance made by no-take restrictions, habitat diversity and structural complexity. This could be achieved by conducting targeting surveys in areas with differing protection levels, habitat types and levels of structural complexity and using modelling to determine the relative contributions of these factors to overall fish diversity.

Author Contributions

Conceptualisation, T.R.D. and D.H.; methodology, T.R.D.; validation, D.H.; formal analysis, T.R.D.; investigation, T.R.D.; resources, T.R.D.; data curation, T.R.D.; writing—original draft preparation, T.R.D.; writing—review and editing, D.H.; visualisation, T.R.D. and D.H.; supervision, D.H.; project administration, T.R.D.; funding acquisition, T.R.D. and D.H. All authors have read and agreed to the published version of the manuscript.

Funding

This research received no external funding.

Institutional Review Board Statement

Not applicable.

Informed Consent Statement

Not applicable.

Data Availability Statement

Data from surveys at the study sites are available from the Australian Open Data Network (AODN) web portal (portal.aodn.org.au, accessed on 11 May 2023).

Acknowledgments

We thank the large number of volunteer citizen scientist divers who collected the data used for this study. We also thank the RLS scientists who collated and managed the data used. Thanks also to Curtis Champion and Rachel Przeslawski for their valuable feedback, which greatly improved the final manuscript. Data were sourced from Australia’s Integrated Marine Observing System (IMOS)—IMOS is funded by the National Collaborative Research Infrastructure Strategy (NCRIS).

Conflicts of Interest

The authors declare no conflict of interest. The funders had no role in the design of the study, in the collection, analyses, or interpretation of data, in the writing of the manuscript, or in the decision to publish the results.

References

  1. Doney, S.C.; Ruckelshaus, M.; Emmett Duffy, J.; Barry, J.P.; Chan, F.; English, C.A.; Galindo, H.M.; Grebmeier, J.M.; Hollowed, A.B.; Knowlton, N. Climate Change Impacts on Marine Ecosystems. Ann. Rev. Mar. Sci. 2012, 4, 11–37. [Google Scholar] [CrossRef] [PubMed]
  2. Islam, M.S.; Tanaka, M. Impacts of Pollution on Coastal and Marine Ecosystems Including Coastal and Marine Fisheries and Approach for Management: A Review and Synthesis. Mar. Pollut. Bull. 2004, 48, 624–649. [Google Scholar] [CrossRef] [PubMed]
  3. Davidson, L.N.K.; Krawchuk, M.A.; Dulvy, N.K. Why Have Global Shark and Ray Landings Declined: Improved Management or Overfishing? Fish Fish. 2016, 17, 438–458. [Google Scholar] [CrossRef]
  4. Limburg, K.E.; Hughes, R.M.; Jackson, D.C.; Czech, B. Human Population Increase, Economic Growth, and Fish Conservation: Collision Course or Savvy Stewardship? Fisheries 2011, 36, 27–35. [Google Scholar] [CrossRef]
  5. Gray, J.S. Marine Biodiversity: Patterns, Threats and Conservation Needs. Biodivers. Conserv. 1997, 6, 153–175. [Google Scholar] [CrossRef]
  6. Kroodsma, D.A.; Mayorga, J.; Hochberg, T.; Miller, N.A.; Boerder, K.; Ferretti, F.; Wilson, A.; Bergman, B.; White, T.D.; Block, B.A. Tracking the Global Footprint of Fisheries. Science 2018, 359, 904–908. [Google Scholar] [CrossRef] [PubMed]
  7. Grorud-Colvert, K.; Sullivan-Stack, J.; Roberts, C.; Constant, V.; Horta e Costa, B.; Pike, E.P.; Kingston, N.; Laffoley, D.; Sala, E.; Claudet, J. The MPA Guide: A Framework to Achieve Global Goals for the Ocean. Science 2021, 373, eabf0861. [Google Scholar] [CrossRef]
  8. Edgar, G.J.; Stuart-Smith, R.D.; Willis, T.J.; Kininmonth, S.; Baker, S.C.; Banks, S.; Barrett, N.S.; Becerro, M.A.; Bernard, A.T.F.; Berkhout, J. Global Conservation Outcomes Depend on Marine Protected Areas with Five Key Features. Nature 2014, 506, 216. [Google Scholar]
  9. Di Cintio, A.; Niccolini, F.; Scipioni, S.; Bulleri, F. Avoiding “Paper Parks”: A Global Literature Review on Socioeconomic Factors Underpinning the Effectiveness of Marine Protected Areas. Sustainability 2023, 15, 4464. [Google Scholar] [CrossRef]
  10. Iacarella, J.C.; Clyde, G.; Bergseth, B.J.; Ban, N.C. A Synthesis of the Prevalence and Drivers of Non-Compliance in Marine Protected Areas. Biol. Conserv. 2021, 255, 108992. [Google Scholar] [CrossRef]
  11. Rife, A.N.; Erisman, B.; Sanchez, A.; Aburto-Oropeza, O. When Good Intentions Are Not Enough… Insights on Networks of “Paper Park” Marine Protected Areas. Conserv. Lett. 2013, 6, 200–212. [Google Scholar]
  12. Agardy, T.; Di Sciara, G.N.; Christie, P. Mind the Gap: Addressing the Shortcomings of Marine Protected Areas through Large Scale Marine Spatial Planning. Mar. Policy 2011, 35, 226–232. [Google Scholar] [CrossRef]
  13. Harasti, D.; Davis, T.R.T.R.; Jordan, A.; Erskine, L.; Moltschaniwskyj, N. Illegal Recreational Fishing Causes a Decline in a Fishery Targeted Species (Snapper: Chrysophrys auratus) within a Remote No-Take Marine Protected Area. PLoS ONE 2019, 14, e0209926. [Google Scholar] [CrossRef]
  14. Novaczek, E.; Howse, V.; Pretty, C.; Devillers, R.; Edinger, E.; Copeland, A. Limited Contribution of Small Marine Protected Areas to Regional Biodiversity: The Example of a Small Canadian No-Take MPA. Front. Mar. Sci. 2017, 4, 174. [Google Scholar]
  15. Harasti, D.; Williams, J.; Mitchell, E.; Lindfield, S.; Jordan, A. Increase in Relative Abundance and Size of Snapper Chrysophrys auratus within Partially-Protected and No-Take Areas in a Temperate Marine Protected Area. Front. Mar. Sci. 2018, 5, 20. [Google Scholar] [CrossRef]
  16. Harasti, D.; Davis, T.R.; Mitchell, E.; Lindfield, S.; Smith, S.D.A. A Tale of Two Islands: Decadal Changes in Rocky Reef Fish Assemblages Following Implementation of No-Take Marine Protected Areas in New South Wales, Australia. Reg. Stud. Mar. Sci. 2018, 18, 229–236. [Google Scholar]
  17. Pollard, D.A. A Review of Marine and Estuarine Protected Areas in NSW, with Emphasis on Research and Monitoring as a Basis for Their Scientific Management; New South Wales Fisheries: Cronulla, Australia, 1997.
  18. Navarro, M.; Kragt, M.E.; Hailu, A.; Langlois, T.J. Recreational Fishers’ Support for No-Take Marine Reserves Is High and Increases with Reserve Age. Mar. Policy 2018, 96, 44–52. [Google Scholar] [CrossRef]
  19. Martin, C.L.; Momtaz, S.; Jordan, A.; Moltschaniwskyj, N.A. Exploring Recreational Fishers’ Perceptions, Attitudes, and Support towards a Multiple-Use Marine Protected Area Six Years after Implementation. Mar. Policy 2016, 73, 138–145. [Google Scholar]
  20. Byers, J.E.; Noonburg, E.G. Poaching, Enforcement, and the Efficacy of Marine Reserves. Ecol. Appl. 2007, 17, 1851–1856. [Google Scholar]
  21. Davis, T.R.R.; Harasti, D.; Smith, S.D.A.D.A. Developing a Habitat Classification Typology for Subtidal Habitats in a Temperate Estuary in New South Wales, Australia. Mar. Freshw. Res. 2016, 67, 1186–1195. [Google Scholar] [CrossRef]
  22. Davis, T.R.R.; Harasti, D.; Kelaher, B.; Smith, S.D.A.D.A. Diversity Surrogates for Estuarine Fish Assemblages in a Temperate Estuary in New South Wales, Australia. Reg. Stud. Mar. Sci. 2016, 7, 55–62. [Google Scholar] [CrossRef]
  23. NSWMPA. Port Stephens-Great Lakes Marine Park Zoning Plan 2007; New South Wales Marine Parks Authority: Sydney, Australia, 2007.
  24. Edgar, G.J.; Stuart-Smith, R.D. Ecological Effects of Marine Protected Areas on Rocky Reef Communities-a Continental-Scale Analysis. Mar. Ecol. Prog. Ser. 2009, 388, 51–62. [Google Scholar]
  25. Edgar, G.J.; Cooper, A.; Baker, S.C.; Barker, W.; Barrett, N.S.; Becerro, M.A.; Bates, A.E.; Brock, D.; Ceccarelli, D.M.; Clausius, E. Reef Life Survey: Establishing the Ecological Basis for Conservation of Shallow Marine Life. Biol. Conserv. 2020, 252, 108855. [Google Scholar]
  26. Edgar, G.J.; Stuart-Smith, R.D. Systematic Global Assessment of Reef Fish Communities by the Reef Life Survey Program. Sci. Data 2014, 1, 140007. [Google Scholar] [CrossRef]
  27. Clarke, K.R.; Gorley, R.N. PRIMER v7: User Manual/Tutorial; PRIMER-E Ltd.: Plymouth, UK, 2015. [Google Scholar]
  28. Clarke, K.R. Non-Parametric Multivariate Analyses of Changes in Community Structure. Aust. J. Ecol. 1993, 18, 117–143. [Google Scholar] [CrossRef]
  29. Anderson, M.J.; Gorley, R.N.; Clarke, K.R. PERMANOVA+ for PRIMER: Guide to Software and Statistical Methods; PRIMER-E Ltd.: Plymouth, UK, 2008. [Google Scholar]
  30. Colwell, R.K. EstimateS: Statistical Estimation of Species Richness and Shared Species from Samples. Version 9. 2013. Available online: http://purl.oclc.org/estimates (accessed on 18 May 2023).
  31. Chao, A. Nonparametric Estimation of the Number of Classes in a Population. Scand. J. Stat. 1984, 11, 265–270. [Google Scholar]
  32. Davis, T.R.; Smith, S.D.A. Proximity Effects of Natural and Artificial Reef Walls on Fish Assemblages. Reg. Stud. Mar. Sci. 2017, 9, 17–23. [Google Scholar] [CrossRef]
  33. Jonas, H.D.; MacKinnon, K.; Marnewick, D.; Wood, P. Site-Level Tool for Identifying Other Effective Area-Based Conservation Measures (OECMs); IUCN (International Union for Conservation of Nature): Gland, Switzerland, 2023. [Google Scholar]
  34. Worm, B.; Hilborn, R.; Baum, J.K.; Branch, T.A.; Collie, J.S.; Costello, C.; Fogarty, M.J.; Fulton, E.A.; Hutchings, J.A.; Jennings, S. Rebuilding Global Fisheries. Science 2009, 325, 578–585. [Google Scholar]
  35. Davis, T.R.; Larkin, M.F.; Forbes, A.; Veenhof, R.J.; Scott, A.; Coleman, M.A. Extreme Flooding and Reduced Salinity Causes Mass Mortality of Nearshore Kelp Forests. Estuar. Coast. Shelf Sci. 2022, 275, 107960. [Google Scholar]
  36. Folke, C.; Carpenter, S.; Walker, B.; Scheffer, M.; Elmqvist, T.; Gunderson, L.; Holling, C.S. Regime Shifts, Resilience, and Biodiversity in Ecosystem Management. Annu. Rev. Ecol. Evol. Syst. 2004, 35, 557–581. [Google Scholar]
  37. Gill, D.A.; Mascia, M.B.; Ahmadia, G.N.; Glew, L.; Lester, S.E.; Barnes, M.; Craigie, I.; Darling, E.S.; Free, C.M.; Geldmann, J. Capacity Shortfalls Hinder the Performance of Marine Protected Areas Globally. Nature 2017, 543, 665–669. [Google Scholar]
  38. Stuart-Smith, R.D.; Edgar, G.J.; Barrett, N.S.; Bates, A.E.; Baker, S.C.; Bax, N.J.; Becerro, M.A.; Berkhout, J.; Blanchard, J.L.; Brock, D.J. Assessing National Biodiversity Trends for Rocky and Coral Reefs through the Integration of Citizen Science and Scientific Monitoring Programs. Bioscience 2017, 67, 134–146. [Google Scholar]
  39. Wolfenden, J.; Cram, F.; Kirkwood, B. Marine Reserves in New Zealand: A Survey of Community Reactions. Ocean Coast. Manag. 1994, 25, 31–51. [Google Scholar]
  40. Rossiter, J.S.; Levine, A. What Makes a “Successful” Marine Protected Area? The Unique Context of Hawaii′ s Fish Replenishment Areas. Mar. Policy 2014, 44, 196–203. [Google Scholar]
  41. Chaigneau, T.; Brown, K. Challenging the Win-Win Discourse on Conservation and Development: Analyzing Support for Marine Protected Areas. Ecol. Soc. 2016, 21, 36. [Google Scholar]
  42. Edgar, G.J.; Barrett, N.S.; Stuart-Smith, R.D. Exploited Reefs Protected from Fishing Transform over Decades into Conservation Features Otherwise Absent from Seascapes. Ecol. Appl. 2009, 19, 1967–1974. [Google Scholar]
  43. Balbar, A.C.; Metaxas, A. The Current Application of Ecological Connectivity in the Design of Marine Protected Areas. Glob. Ecol. Conserv. 2019, 17, e00569. [Google Scholar]
  44. Lee, K.A.; Huveneers, C.; Macdonald, T.; Harcourt, R.G. Size Isn’t Everything: Movements, Home Range, and Habitat Preferences of Eastern Blue Gropers (Achoerodus viridis) Demonstrate the Efficacy of a Small Marine Reserve. Aquat. Conserv. 2015, 25, 174–186. [Google Scholar]
  45. Afonso, P.; Fontes, J.; Santos, R.S. Small Marine Reserves Can Offer Long Term Protection to an Endangered Fish. Biol. Conserv. 2011, 144, 2739–2744. [Google Scholar] [CrossRef]
  46. Rojo, I.; Anadón, J.D.; García-Charton, J.A. Exceptionally High but Still Growing Predatory Reef Fish Biomass after 23 Years of Protection in a Marine Protected Area. PLoS ONE 2021, 16, e0246335. [Google Scholar]
  47. Giakoumi, S.; Scianna, C.; Plass-Johnson, J.; Micheli, F.; Grorud-Colvert, K.; Thiriet, P.; Claudet, J.; Di Carlo, G.; Di Franco, A.; Gaines, S.D. Ecological Effects of Full and Partial Protection in the Crowded Mediterranean Sea: A Regional Meta-Analysis. Sci. Rep. 2017, 7, 8940. [Google Scholar]
  48. Harasti, D.; Lee, K.A.; Gallen, C.; Hughes, J.M.; Stewart, J. Movements, Home Range and Site Fidelity of Snapper (Chrysophrys auratus) within a Temperate Marine Protected Area. PLoS ONE 2015, 10, e0142454. [Google Scholar] [CrossRef]
  49. Ferguson, A.M.; Harvey, E.S.; Taylor, M.D.; Knott, N.A. A Herbivore Knows Its Patch: Luderick, Girella Tricuspidata, Exhibit Strong Site Fidelity on Shallow Subtidal Reefs in a Temperate Marine Park. PLoS ONE 2013, 8, e65838. [Google Scholar]
  50. Quaas, Z.; Harasti, D.; Gaston, T.F.; Platell, M.E.; Fulton, C.J. Influence of Habitat Condition on Shallow Rocky Reef Fish Community Structure around Islands and Headlands of a Temperate Marine Protected Area. Mar. Ecol. Prog. Ser. 2019, 626, 1–13. [Google Scholar]
  51. Pereira, T.J.; Silva, A.F.; de Almeida, P.R.; Belo, A.F.; Costa, J.L.; Castro, N.; Quintella, B.R. Assessing the Size Adequacy of a Small No-Take Marine Protected Area (MPA) for Mediterranean Moray and European Conger. Mar. Ecol. Prog. Ser. 2017, 584, 213–227. [Google Scholar]
  52. Rojo, I.; Sánchez-Meca, J.; García-Charton, J.A. Small-Sized and Well-Enforced Marine Protected Areas Provide Ecological Benefits for Piscivorous Fish Populations Worldwide. Mar. Environ. Res. 2019, 149, 100–110. [Google Scholar]
  53. Harasti, D.; Martin-Smith, K.; Gladstone, W. Does a No-Take Marine Protected Area Benefit Seahorses? PLoS ONE 2014, 9, e105462. [Google Scholar] [CrossRef]
  54. Komyakova, V.; Munday, P.L.; Jones, G.P. Relative Importance of Coral Cover, Habitat Complexity and Diversity in Determining the Structure of Reef Fish Communities. PLoS ONE 2013, 8, e83178. [Google Scholar]
  55. Darling, E.S.; Graham, N.A.J.; Januchowski-Hartley, F.A.; Nash, K.L.; Pratchett, M.S.; Wilson, S.K. Relationships between Structural Complexity, Coral Traits, and Reef Fish Assemblages. Coral Reefs 2017, 36, 561–575. [Google Scholar]
Figure 1. Study area in Port Stephens estuary, Australia. Black dots indicate study sites. Shading indicates habitat type: sand (yellow), seagrass (green) and rocky reef (brown). Cross-hatched area indicates the Fly Point–Halifax Park no-take aquatic reserve protected since 1983 (0.75 km2). Cyan overlay indicates the extended no-take MPA protected within the Port Stephens–Great Lakes Marine Park since 2008 (8.2 km2).
Coasts 03 00024 g001
Figure 2. Metric multi-dimensional scaling plot showing relative similarity of average assemblages at no-take sites (green triangle) and fished sited (red square). Ellipses indicate a 95% confidence limit on the locations of mean assemblages.
Coasts 03 00024 g002
Figure 3. Average survey-species richness from 50 m underwater visual-census Reef Life Survey Foundation surveys conducted at no-take sites (green) and fished sites (red) from 2008 to 2022. Sites ordered from east to west. Error bars indicate standard error.
Coasts 03 00024 g003
Figure 4. Pearson’s correlation between fish survey-species richness and sample year for (a) sites in the no-take fishing area and (b) sites open to fishing. Points indicate survey-species richness from individual Reef Life Survey Foundation surveys. Line indicates Pearson’s correlation best fit to data, and shaded area indicates standard error on best fit.
Coasts 03 00024 g004
Figure 5. Estimated total diversity of fish species at sites in the Port Stephens estuary (alpha diversity, no-take sites = green dots, fished sites = red dots). Estimates calculated using the Chao-1 species richness estimation technique [31]. Bars indicate 95% confidence intervals on estimated alpha diversity. Letters indicate groups of sites with no significant difference in alpha diversity (p < 0.05).
Coasts 03 00024 g005
Table 1. Number of reef life surveys conducted at monitoring sites from 2008 to 2022, separated by level of site protection (fished or no-take) and site name. “--“ indicates no data available at the site in that year.
Protection/Site200820092010201120122013201420152016201720182019202020212022Total
Fished--9131161644811107666117
    Pipeline--7633634398763674
    Seahorse Gardens--14625----422----3--29
    Tomaree Head--132151--1------------14
No-take6302330212381628242723172219317
    Fly Point4144551134111076698107
    Halifax Park29162111737981010564128
    Little Beach--73455258610767782
Grand Total63936412739122036353730232825434
Table 2. Fish species making the largest contribution to differences between no-take and fished areas in the Port Stephens Estuary, Australia. Abundance data are from Reef Life Survey Foundation surveys conducted at sites in each area.
SpeciesAvg. Abundance FishedAvg. Abundance No-TakeRatio
No-Take/Fished
Contribution to Differences (%)
Atypichthys strigatus149.899.60.716.0
Trachurus novaezelandiae202.972.70.48.4
Acanthopagrus australis4.347.511.06.6
Scorpis lineolata14.736.62.55.4
Disclaimer/Publisher’s Note: The statements, opinions and data contained in all publications are solely those of the individual author(s) and contributor(s) and not of MDPI and/or the editor(s). MDPI and/or the editor(s) disclaim responsibility for any injury to people or property resulting from any ideas, methods, instructions or products referred to in the content.

