1. Introduction
Cattle performance and profitability can, at least theoretically, be related to animals receiving a correctly formulated ration, being fed at the appropriate amount, and at the correct time. For years, cattle feeders have used these techniques to ensure the well-being and performance of their cattle. The basic premise used by all nutritionists when formulating rations is that each aliquot (mouthful) of the diet is balanced with respect to the known requirement of the target animal. Uniformity is a crucial factor that may often be overlooked within the cattle feeding industry with most benchmarks used were created by studies with monogastric species [
1,
2]. However, if nutrient levels are inadequate, either above or below animal requirements, animal performance can be affected. Improper feed conversion and inconsistent intake results in an added cost of production, waste, and in extreme cases, toxicity to the animal resulting in illness or even death [
3]. Because ruminants within feed yards often consume feed in large mouthfuls across multiple meals, poorly mixed rations may not be readily apparent. However, when cattle are being pushed to their near genetic potential and large amounts of grains are added, a poorly mixed or non-uniform ration could be the cause of rumen disfunction. High-concentrate diets have a great economic value for feedlots on improving animal efficiency; however, they can pose a challenge on animal health, particularly digestive disorders. The rumen is remarkable in that it can adapt from a mainly forage-based diet to one of mainly grains. Nevertheless, because of the rapid fermentation process of grain, there are still many digestive disorders (e.g., acidosis and bloat) that feedlot producers must deal with, particularly during adaptation to high-concentrate diets. These digestive disorders have been reported to comprise between 19.5% and 28.4% of mortalities within the feedlot industry [
4].
The objective of these experiments was to evaluate strategies that Northern Plains cattle feeders could implement to fully optimize production responses in a feedlot setting. In doing so, two feedlot finishing experiments were conducted over the course of 2 years. These experiments were conducted to investigate the effect that varying degrees (highly variable at random or 0.454 kg as-fed tolerance for each ingredient) of accuracy on ingredient inclusion have on growth performance, carcass traits, feedlot animal behavior, and efficiency of dietary NE utilization. The hypothesis was that variability would decrease growth performance compared to non-variable cattle in the finishing phase.
2. Materials and Methods
2.1. Institutional Animal Care and Use Approval
These studies were conducted at the Ruminant Nutrition Center (RNC) in Brookings, SD, USA, between August 2021 and July 2022. The animal care and handling procedures used within these studies were approved by the South Dakota State University Animal Care and Use Committee (Approval Numbers: 2108-043E and 2203-017E for Exp. 1 and Exp. 2, respectfully).
2.2. Animals, Initial Processing, and Study Initiation
In Exp. 1, 60 single-sourced Angus heifers (initial shrunk body weight = 460 ± 26.2 kg) were used in a 112 d feedlot finishing experiment at the Ruminant Nutrition Center (RNC) located in Brookings, SD. Heifers were procured from a South Dakota auction facility and received two weeks prior to study initiation. Upon arrival, heifers were placed into 10 concrete-surface pens (9.7 m2/heifer; 127 cm of bunk space/heifer; n = 6 heifers/pen) at the RNC and provided ad libitum access to long-stem grass hay and water upon arrival. Heifers were weighed and processed 3 d after arrival with initial processing including an individual BW measurement (scale readability 0.454 kg), application of a unique individual ear tag, vaccination against viral respiratory diseases (Bovishield Gold 5; Zoetis, Parsippany, NJ, USA), clostridial species (Ultrabac 7/Somubac, Zoetis, Parsippany, NJ, USA), and administration of pour on moxidectin (Cydectin, Elanco). Heifers were also administered a terminal implant on d 1 (200 mg trenbolone acetate and 28 mg estradiol benzoate; Synovex Plus, Zoetis). To ensure there were no pregnancies two weeks prior to study initiation, each heifer was ultra-sounded and given a 2 mL dose of prostaglandin F2 alpha (Lutalyse; HighCon, Zoetis). Heifers were weighed and allotted to their study pens (n = 10) 2 weeks after dosage of prostaglandin. To allow for proper replication, heifers were blocked by location (n = 5) and assigned to one of two dietary treatments.
In Exp. 2, 128 single-source Charolais–Angus crossbred beef steers (initial shrunk body weight = 505 ± 32.1 kg) were enrolled into a 94 d finishing experiment at the RNC. This study used 8 replicate pens (16 total pens; 7.25 m2/steer; 95.3 cm of bunk space/steer; n = 8 steers/pen) assigned to one of two dietary treatments.
Steers were vaccinated for viral respiratory pathogens, clostridial diseases, and were also treated for internal and external parasites approximately 175 d and again for external parasites 35 d before study initiation. On d 1 (study initiation), all steers were individually weighed (readability 0.454 kg) and administered a terminal implant (200 mg trenbolone acetate and 28 mg estradiol benzoate; Synovex Plus, Zoetis, Parsippany, NJ, USA). The afternoon following initial processing, all steers were allotted to their study pens (n = 8 steers/pen and 8 pens/treatment).
2.3. Experimental Design and Treatments
In both experiments, variability was applied with the necessary goal of providing variation to each ingredient that would commonly be seen within the industry. The extent of variability introduced is expressed as a potential variation of up to 20% in each ingredient (
Tables S1–S3) are provided as an example of variation). This was determined daily at random with a random number generator. The targeted goal of each experiment was to randomly alter each ingredient proportions by up to 20% to determine if variable diet inclusion has any effect on live animal performance, efficiency measures, or carcass characteristics.
In Exp. 1, pens were assigned to 1 of 2 dietary treatments (n = 5 pens/treatment): (1) normal feeding of 0.454 kg tolerance for all ingredients (CON) or (2) variable inclusion strategy where each ingredient was randomly increased or decreased but the targeted as-fed quantity for the daily delivery was met (VAR). A random number generator was used to determine variations each day with variations up to 20% applied to dried distillers grains (DDGS) and liquid supplement (LS). High-moisture ear corn (HMEC) was used to adjust the targeted as-fed amount or scale total of that feed delivery. In Exp. 2, pens were assigned to the same two dietary treatments only differing in number of pens (n = 8 pens/treatment) and ingredients used within the variation. Within Exp. 2, from days 1 to 41, ingredient variations were applied to high-moisture corn (HMC), DDGS, and oat hay (OH). Dry-rolled corn (DRC) was used to adjust the delivered feed quantity to meet the targeted as-fed amount or to scale the total feed delivery accordingly. From day 42 to harvest, variations were applied to DRC, DDGS, and OH. CRNSIL was used to adjust the delivered feed quantity to match the targeted as-fed amount or to scale the total feed delivery accordingly.
2.4. Dietary Management
Composition of the finishing diet fed in Exp. 1 from d 1 to harvest is presented in
Table 1. The finishing diet consisted of HMEC, DDGS, which included 30 g/907 kg of monensin sodium per diet dry matter (DM), along with supplemental vitamins and minerals to meet the requirements outlined by the National Academies of Sciences and Medicine [
5].
Composition of the finishing diets fed in Exp. 2 from d 1 to 41 and d 42 to harvest is presented in
Table 2. The finishing diet from d 1 to 41 consisted of high-moisture ear corn (HMC), oat hay (OH), dry-rolled corn (DRC), and dried distiller’s grains (DDGS). From d 42 to 94, HMC was replaced with corn silage (CRNSIL) and DRC as well as lesser inclusion of OH. Similar to Exp. 1, steers in Exp. 2 also received a liquid supplement (LS) provided to add 30 g/907 kg of monensin sodium to diet DM along with supplemental vitamins and minerals to meet National Academies of Sciences and Medicine [
5] requirements.
Bunks were managed using a slick bunk management strategy for both Exp. 1 and 2. Bunks were visually assessed for residual feed daily at 0700 to determine the amount of feed to provide animals. Bunk management amongst studies and treatments was identical for the duration of each finishing experiment. In Exp. 1, fresh feed was manufactured once daily at 0800 h for each treatment in a single batch using a mixing feed wagon (2.35 m3; scale readability 0.454 kg). For Exp. 2, fresh feed was manufactured twice daily at 0800 h and 1400 h using the same stationary mixer as for Exp. 1. Heifers and steers in both experiments were given (Optaflexx 45, Elanco, Indianapolis, IN, USA) at a rate of 300 mg/hd·d−1 for the final 28 d prior to harvest. When necessary, orts were collected, weighed, and dried in a forced air oven at 100 °C for 24 h to determine DM content if carryover feed went out of condition, or was present on weigh days. If carryover feed was present on weigh days, the residual feed was removed prior to the collection of BW measurements. The dry matter intake (DMI) of each pen was adjusted to reflect the total DM delivered to each pen after subtracting dry orts for each interim period.
Diets presented are actual diet formulation and composition are based upon weekly ingredient DM analyses (drying at 60 °C until no weight change); actual assayed nutrient concentrations from weekly commodity ingredient sampling of dry-rolled corn, dried distillers grains, plus soluble; and each experiments forage source for crude protein (CP), neutral detergent fiber (NDF), acid detergent fiber (ADF), ash, and ether extract (EE). Method no. and tabular energy values are as per reference [
6].
2.5. Growth Performance Calculations
In Exp. 1, heifer BW was recorded every 28 days with study termination on d 112. In Exp. 2, steer BW was recorded every 30 days with study termination on d 94. BW of each study was recorded during these timeframes for the calculation of average daily gain (ADG) and feed conversion efficiency (gain:feed; G:F). Average daily gain (ADG) was calculated as the difference between final BW (FBW) and initial shrunk BW, divided by days on feed. Efficiency of weight gain (G:F) was calculated by dividing the period ADG by the period daily DMI. Body weights were measured before the morning feeding and a 4% pencil shrink was applied (to account for digestive tract fill) to the initial BW and final BW. Carcass-adjusted final BW was calculated from hot carcass weight (HCW)/0.625.
Carcass-adjusted growth performance was used to calculate performance based dietary NE to determine the efficiency of dietary utilization. The performance-based dietary NE was calculated from daily energy gain (EG; Mcal/d): EG = ADG
1.097 × 0.557W
0.75, where W is the mean equivalent shrunk BW in kilograms National Academies of Sciences and Medicine [
5] from median feeding shrunk BW. Final BW at 28% estimated empty body fatness (AFBW) calculated as: [median feeding shrunk BW × (478/AFBW), kg [
5]]. Maintenance energy (EM) was calculated by the following equation: EM = 0.077 × BW
0.75. Dry matter intake is related to energy requirements and dietary NEm (Mcal/kg) according to the following equation: DMI = EG/(0.877NEm − 0.41) and can be resolved for the estimation of dietary NEm by means of the quadratic formula x = −b ± b2−4ac
, where
a = −0.41EM,
b = 0.877EM + 0.41DMI + EG, and
c = −0.877DMI [
7]. Dietary NEg was derived from NEm using the following equation: NEg = 0.877NEm − 0.41 [
8]. Intake variation was determined based upon Euclidean distance determination, where [(x2 − x1)
2 + (y2 − y1)
2]
0.50, and where x2 and x1 are 2 successive days and y2 and y1 are 2 successive DMI values, with the daily distance values summed to yield the total distance over the feeding period [
9]. Euclidean distance was regressed against gain to feed ratio and the slopes and intercepts of each line were evaluated according to the methods described by [
10].
2.6. Management of Pulls and Removals
In both experiments, all animals that were pulled from their home pen for health evaluation were then monitored in individual hospital pens. When an animal was moved to a hospital pen, the appropriate amount of feed from the home pen was removed and transferred to the hospital pen. If the animal in the hospital returned to their home pen, this feed remained credited to the home pen. If the animal did not return to their home pen, all feed that was delivered to the hospital pen was deducted from the feed intake record for that pen back to the date the animal was hospitalized.
2.7. Carcass Trait Determination
In Exp. 1, heifers were harvested after 112 d on feed. Heifers were shipped the afternoon following final BW determination and harvested the next day at a commercial abattoir when the population reached sufficient fat cover to grade USDA Choice. Heifers were comingled at the time of shipping and remained this way until 0700 h the morning after shipping. Hot carcass weight and liver abscess scores were recorded during the harvest procedure. Liver scores were classified according to the Elanco Liver Scoring System: normal (no abscesses), A− (one or two small abscesses or abscess scars), A (two to four well-organized abscesses less than 2.54 cm diameter), or A+ (one or more large active abscesses greater than 2.54 cm diameter with inflammation of surrounding tissue). Video image data were obtained from the packing plant for rib-eye area (REA), rib fat (RF), and USDA marbling scores. A common kidney, pelvic, heart (KPH) fat percentage of 2.5% was applied to all calculations requiring a KPH%. Yield grade (YG) was calculated according to the USDA regression equation [
11]. Dressing percentage (DP) was calculated as HCW/(final BW × 0.96). Estimated empty body fat (EBF) percentage and final BW at 28% EBF (AFBW) were calculated from observed carcass traits [
12], and estimated proportion of closely trimmed boneless retail cuts from carcass round, loin, rib, and chuck (retail yield, RY; [
13]). Carcass data were available for all but one heifer within the variable inclusion treatment.
In Exp. 2, all steers were shipped the same day as study termination (d 94) and harvested the following day at a commercial abattoir when the population reached sufficient fat cover to grade USDA Choice. Steers carcass data collection followed the same guidelines as the heifers from Exp. 1.
2.8. Statistical Analysis
Growth performance data from both experiments were analyzed as a randomized complete block design using the GLIMMIX procedure of SAS 9.4 (SAS Inst. Inc., Cary, NC, USA) with pen as the experimental unit. The model in Exp. 1 included the fixed effect of dietary treatment; block (BW) was included as a random effect. The pen served as an experimental unit for all analyses in both studies. Exp. 2 mimicked the statistical analysis of Exp. 1; however, animals in Exp. 2 were not blocked by BW but rather pen location within the feedlot.
4. Discussion
4.1. Animal Growth Performance—Experiment 1
Previous growth performance data investigating the effects of varying diet inclusion levels are limited. Under the parameters of Exp. 1 varying diet inclusion levels did not influence animal growth performance. Previous studies have reported interim data that can be used to compare growth performance results seen in the present study. In a 138 day finishing study involving varying dietary inclusions using Holstein cattle with an initial body weight of 363 kg, Zinn [
14] also reported no appreciable differences for growth performance. This response is inconsistent with some previous work by Galyean, et al. [
15] where reduced ADG and poor efficiency were observed in cattle fed a variable dietary treatment. Perhaps daily fluctuation in feed intake by 20% may not be sufficient to adversely affect growth performance in feedlot heifers within the finishing phase.
However, other possible explanations for this lack of response between CON and VAR treatments in Exp. 1 may be attributed to management techniques that were kept consistent. These factors include mixing time, order of delivery, bunk management, time of feeding, feed manufacturing, and uniformity. Uniformity can be defined as having the same manner or degree of consistency allowing for each animal within a feedlot to consume the same balanced diet [
16]. Errors in mixing time and order are also critical as they tend to be the leading contributors to non-uniformity within a ration. Rations that are often over mixed can cause considerable break down of fiber particles, while rations that are under mixed can impact cow consumption and gain. Manufactures recommend that a ration should be mixed for 3 to 6 minutes [
3]. Possibly, by having a more uniform management system that accounts for mixing time, order of delivery, bunk management, etc., this allowed for minimal variation to be imposed as animals physiological and behavioral responses were anticipated [
17].
As a consequence, heifers within Exp. 1 that received the varying inclusion level of either −20, −15, −10, −5, 0, +5, +10, +15, or +20% may have not been a sufficient enough variation with all other management factors being held constant. These results are consistent with the findings of several other studies documenting the effects of intake fluctuation on performance [
14,
18,
19]. Although the imposed fluctuations within this study are of similar magnitude to natural fluctuations observed in large-scale finishing operations [
20], it is possible that the lack of response in growth performance from ingredient inclusion can likely be explained by the ingredients used within the finishing diet. This is because the ingredients within the heifer’s diet may play a pivotal role in the occurrence or lack of magnitude of the performance results.
Heifers within Exp. 1 received a diet consisting of HMEC, DDGS, and an LS where DDGS and LS varied each day by either −20, −15, −10, −5, 0, +5, +10, +15, or +20% with the daily targeted as-fed amount met by HMEC. As noted from the NASEM 2016 feed library, HMEC has a DM % of 62.54 ± 6.89 with starch DM % of 60.16 ± 6.03 and TDN values consisting of 84.3 ± 3.12. Although DDGS and LS may have been altered dramatically, the variation did not substantially change nutrient composition because HMEC provided both an energy and roughage source for those animals. More variation between treatment groups is likely when animals are not provided adequate roughage or energy source.
4.2. Carcass Characteristics—Experiment 1
The previous literature data investigating the effects of varying inclusion levels on carcass characteristics of feedlot cattle are limited. In Exp. 1, dietary treatment had no influence on any carcass characteristics including hot carcass weight, dressing percent, rib-eye area, rib fat, marbling, KPH, yield grade, and empty body fat. Lack of response within carcass characteristics was expected as heifers’ growth performance and dietary intake showed no differences. Although no differences were detected amongst any carcass characteristics, it is worth noting that within this experiment an unexpected amount of liver abscesses was noticed for both CON and VAR.
4.3. Growth Performance—Experiment 2
In the present study, varying dietary inclusion did not influence final BW (
p = 0.86). This agrees with the findings from Exp. 1 where VAR heifers showed no difference in final BW. However, although no significance was noted in final BW for steers, varying ingredient inclusion accuracy caused greater DMI with similar ADG, resulting in poorer G:F ratios. These results are consistent with the findings reported by Galyean, Malcom, Garcia, and Polsipher [
15] where a 10% daily variation in feed intake relative to control was imposed. In that experiment, the pattern for fluctuating feed intake relative to constant was as follows: 10% greater, equal, 10 % less, equal, 10% greater, thus making the net intake variation 20% every third interval.
It is possible that the differing response in DMI between the two experiments that were conducted is because of the variable roughage inclusion amount found within each treatment. This is because CON steers consistently received a 12% roughage inclusion rate for the duration of the finishing period. However, VAR steers who were subject with up to +/−20% ingredient deviations within ingredients never met a 12% roughage concentration rate. From weeks 7 to 16, when most DMI deviations occurred, VAR steers received on average a diet containing 9% roughage. As it relates to feedlot cattle, an increase in roughage within high concentrate diets is well known to prevent digestive upsets and maximize energy (NEg) intake [
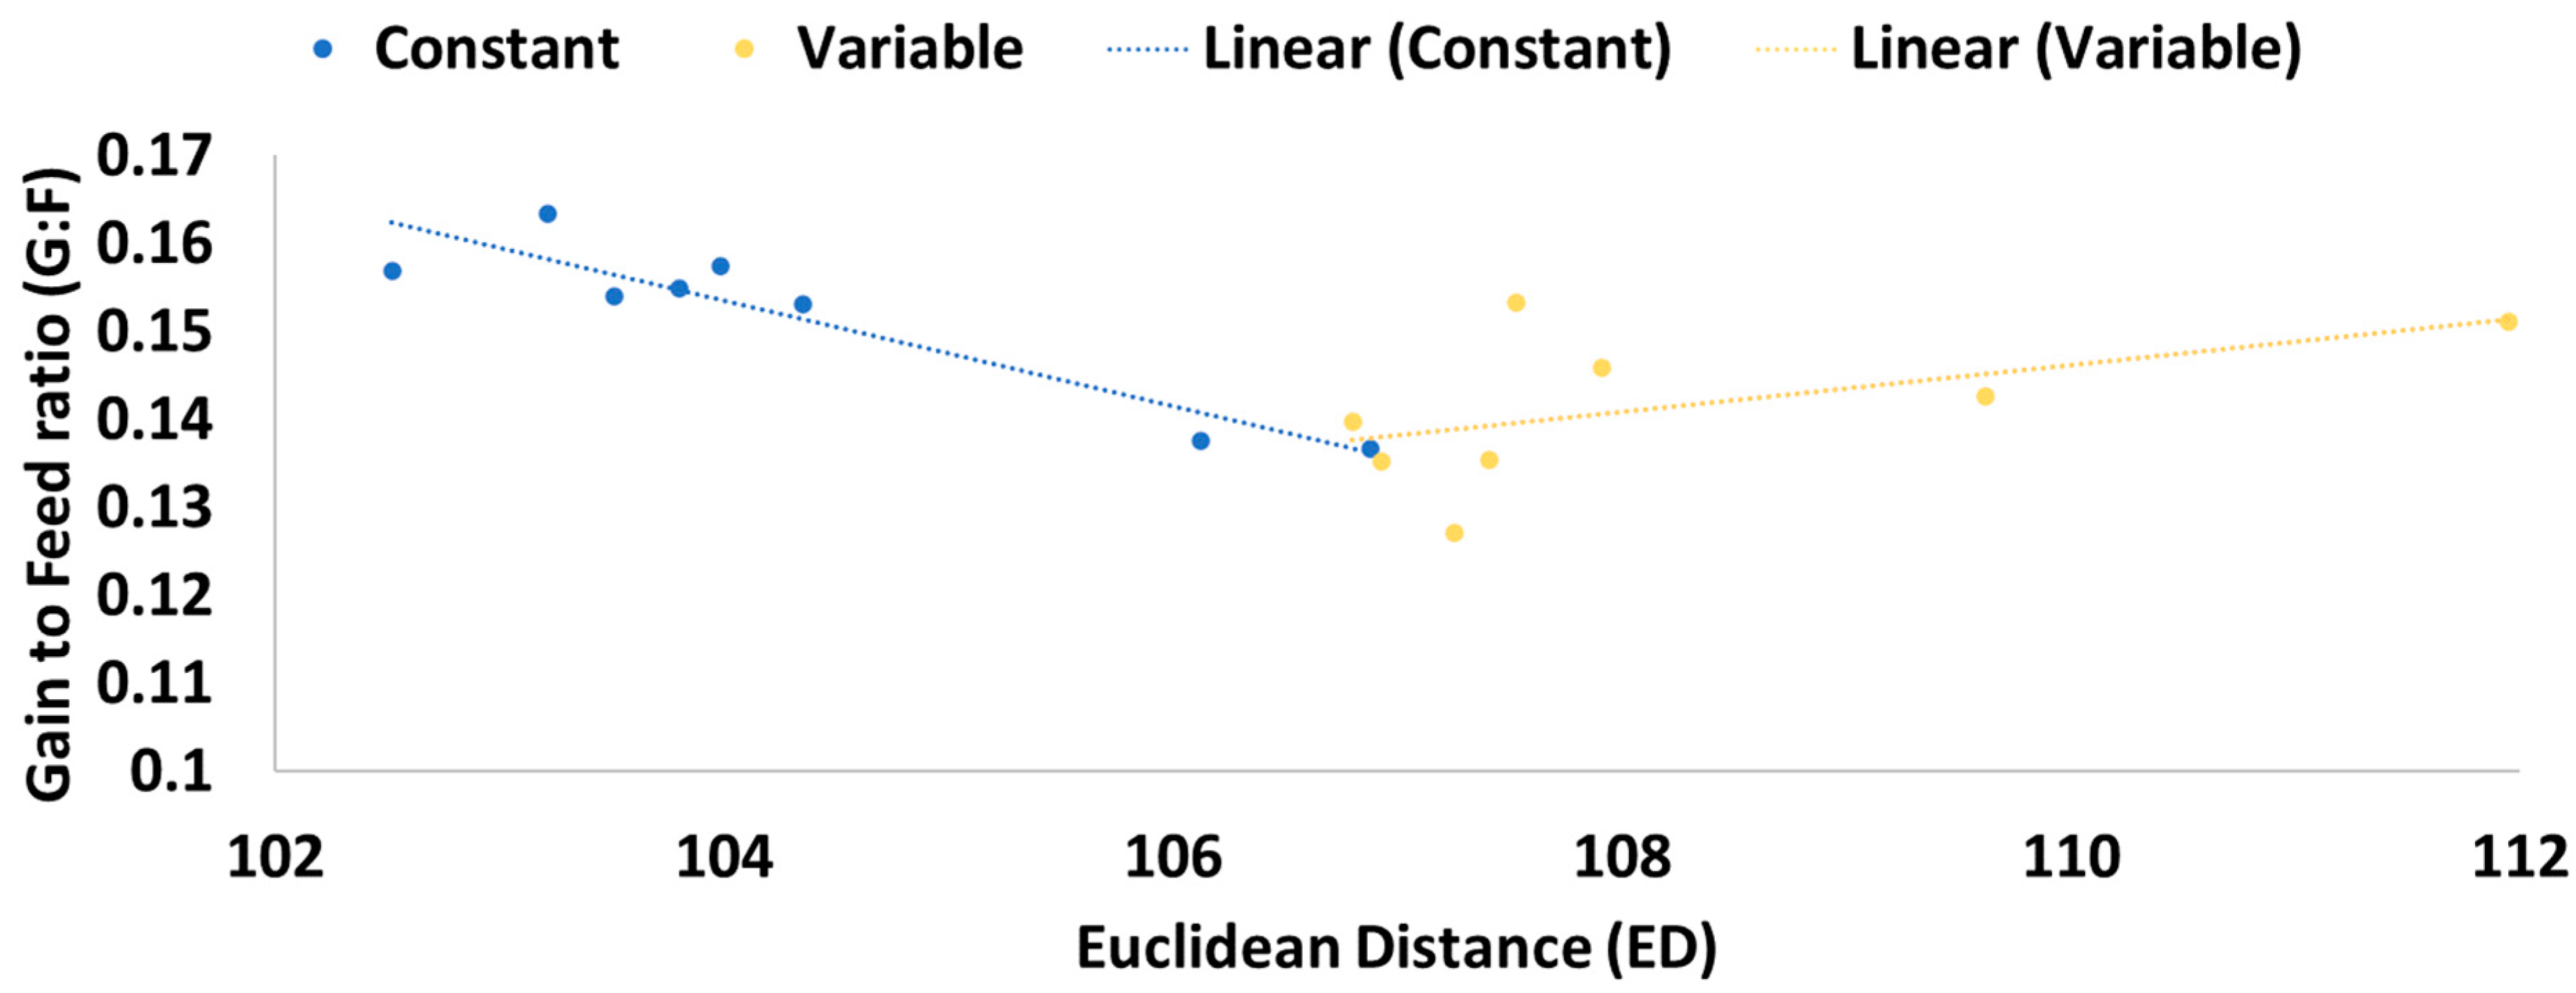
21]. By random alterations of CRNSIL and OH, VAR steers consequently received fluctuations in both roughage and energy sources, resulting in altering both DMI and G:F ratios of VAR. These variations may have altered ruminal pH resulting in sub-clinical digestive upsets reducing apparent dietary net energy for maintenance and grain. That in turn could have been easily masked by slick bunk management. As daily intake variation increased in CON steers, G:F worsened, but as daily intake variation in VAR increased, G:F was not impacted (
Figure 1). Under the conditions of this experiment, randomly altering ingredient proportions can impact growth performance and efficiency measures and as intake variation increases in properly-managed groups of steers, G:F measures worsen, but greater intake variation in poorly-managed steers does not impact feed efficiency.
4.4. Carcass Characteristics—Experiment 2
There was a tendency for VAR steers to have greater marbling compared to CON steers within Exp. 2. The previous literature data investigating the effects of varying inclusion levels on carcass characteristics of feedlot cattle is limited. In Exp. 1, dietary treatment had no influence on any carcass characteristics and was largely true for steers fed in Exp. 2. These results are consistent with the carcass characteristics reported by Zinn [
14] in a study evaluating the influence of a 20% variation in daily feed intake on Holstein steers. Variable steers within that study were fed in a cycle of 10% more followed by 10% less than the constant group. Thus, the change in feed intake from day to day was 20%. This variation in daily intake did not affect carcass characteristics. A possible explanation for the tendency for greater marbling in the VAR steers from Exp. 2 was the difference in DMI. As cattle begin to consume more feed later in the finishing period, this energy is stored in the form of adipose tissue. Although it has long been thought that marbling is a late developing tissue, Bruns [
22] has found that marbling is an intrinsic component of growth throughout an animal’s life and often one poor decision within management can have detrimental effects on genetic progress. This can easily be seen within Exp. 2, as although CON steers received a more consistent diet formulation, it is possible that due to bunk management, cattle may have been limit-fed or perhaps not pushed to their near genetic potential like the VAR group.
Although it should be noted that the data showed no treatment effect for QG or YG outcomes within this experiment, a clear economical difference was noted with the VAR group having an increased amount of prime graded carcass’s resulting in fewer select grades. This outcome is also true for the distribution of yield grade. In the VAR group, there was a higher proportion of carcasses with yield grade 3, while no carcasses were categorized as yield grade 1 or 5. In addition, although not significant, the VAR group also had fewer liver abscesses then that of the CON group.
5. Conclusions
In Experiment 1, daily random altering of ingredient proportions by up to 20% did not affect heifers’ growth performance, efficiency measures, or carcass characteristics. However, in Experiment 2, applying daily random ingredient variability to crossbred beef steers at a rate of up to 20% showed an increase in DMI by 8.0% in VAR compared to CON. Cumulative ADG showed no difference between CON and VAR treatments resulting in poorer G:F ratios by 7.1% in CON compared to VAR. These results indicate that randomly altering of daily ingredient proportions that in turn affect roughage inclusion may be detrimental to finishing feedlot cattle performance. Finally, from Exp. 2, as daily intake variation increased in CON steers, G:F worsened, but as daily intake variation in VAR increased, G:F was not impacted. Under the conditions of this experiment, randomly altering ingredient proportions can impact growth performance and efficiency measures and as intake variation increases in properly managed groups of steers, G:F measures worsen, but greater intake variation in poorly managed steers does not impact feed efficiency.


