Article

Ruminal Bacterial Communities and Metabolome Variation in Beef Heifers Divergent in Feed Efficiency

1
Department of Animal Science, University of Tennessee, Knoxville, TN 37996, USA
2
Department of Large Animal Clinical Sciences, College of Veterinary Medicine, University of Tennessee, Knoxville, TN 37996, USA
3
Department of Entomology and Plant Pathology, University of Tennessee, Knoxville, TN 37996, USA
4
Department of Nutrition, University of Tennessee, Knoxville, TN 37996, USA
5
Department of Chemistry, University of Tennessee, Knoxville, TN 37996, USA
*
Author to whom correspondence should be addressed.
Current Address: Department of Agriculture, Texas A&M University, Commerce, TX 75428, USA.
Ruminants 2022, 2(2), 282-296; https://doi.org/10.3390/ruminants2020019
Submission received: 28 March 2022 / Revised: 2 June 2022 / Accepted: 6 June 2022 / Published: 14 June 2022
(This article belongs to the Special Issue Feature Papers of Ruminants 2021-2022)

Abstract

:
This study determined potential microbial and metabolic biomarkers of feed efficiency in Angus heifers. Seventeen ruminal cannulated Angus heifers underwent a 70-day feed efficiency trial. Residual feed intake was used to determine high and low feed efficient heifers. On day 70 of the trial, rumen content and blood were collected and used for microbial and metabolomic analyses, respectively. Bacterial populations were examined by targeting the V4 region of the 16S rRNA gene and analyzed using QIIME and SAS. Rumen fluid and serum metabolites were analyzed using MetaboAnalyst. No microbial taxa differed after false discovery rate correction, but seven did differ (p ≤ 0.05) prior to correction, including Lachnospiraceae (Other), Desulfobulbaceae, Neisseriaceae, Shuttleworthia, Corynebacterium, p-75-a5, and L7A-E11. No differences were observed in alpha diversity metrics. Beta diversity utilizing unweighted UniFrac distances analyzed via PERMANOVA was significant (p = 0.03). Several metabolites in rumen fluid metabolites were correlated with bacteria that differed by feed efficiency phenotype. The metabolites correlated with bacteria were primarily involved in nutrient signaling and microbial crude protein availability. These data suggest variation in the availability of nutrients, primarily amino acids, as well as a relationship among microbiota, metabolome, and host feed efficiency phenotypes in heifers.

1. Introduction

Beef cattle are the primary agricultural commodity in Tennessee and account for a multi-billion dollar industry worldwide [1]. The greatest input costs for the beef industry are feed costs, accounting for 40–70% of the total cost of production [2,3]. Given this, finding methods to reduce input costs through improved feed efficiencies stands to provide millions of dollars in savings to industry stakeholders. This is particularly important in heifers and cows, given that they are the members primarily responsible for the propagation of genotypes and phenotypes. In order to select more efficient animals, methods must be identified to detect efficient animals. Current methods for evaluating feed efficiency are often expensive, time-intensive, or require contemporary groups of similar animals. Biomarkers that can be readily measured in the blood or other easily-accessible body fluid may provide a more effective method for producers to evaluate feed efficiency phenotypes. A biomarker may be defined as “any substance, structure, or process that can be measured in the body or its products and influence or predict the incidence of outcome or disease” [4]. In agriculture, biomarkers may be developed for producers to make management decisions [5]. In order to accomplish this, biomarkers must be first identified and then tests developed that are economically feasible to producers [5]. Several methods may be used in order to do this, including microbiomics and metabolomics.
One of the primary contributors to variation in feed efficiency is the rumen microbiome. The rumen microbiota provide the majority of energy precursors required by the host animal as well as many of the required nutrients, such as all water-soluble vitamins [6,7]. Several studies have been conducted to examine the relationship between the rumen microbiome and feed efficiency in beef cattle. Myer and colleagues found several bacterial populations that were associated with variation in feed efficiency in beef steers, including Prevotella, the predominant genus within the rumen [8]. Other studies have supported these data in other beef cattle production classes, including in bulls [9,10] and steers [11], as well as in dairy cattle and other ruminants [12,13,14,15]. However, few, if any, studies have examined the rumen microbiome and feed efficiency in female beef cattle. Given that these cattle contribute to the propagation of genetics in the herd, understanding feed efficiency in female beef cattle is imperative for improving feed efficiency in the herd.
Although the rumen microbiome is strongly associated with feed efficiency in ruminants, the rumen microbiome is not readily available to producers and those without access to research equipment. Therefore, identifying readily accessible and inexpensive methods for examining the rumen microbiome as well as host physiology that contribute to variations in feed efficiency phenotypes are necessary. Measuring how serum metabolites are associated with the ruminal microbiome and metabolites could serve as a method of identifying more feed-efficient cattle [5]. Further understanding of the relationships among the rumen microbiome and metabolome, blood metabolome, and cattle feed efficiency is expected to lead to improved selection criteria and overall herd feed efficiency. To date, most studies conducted to understand variation in feed efficient phenotypes have thus far been conducted in beef steers and bulls. Therefore, this study was conducted to establish the relationship among the rumen fluid and serum metabolomes, rumen microbiome, and feed efficiency in female cattle. The hypothesis was that there would be differences in the rumen microbiome and metabolomes of heifers that differed in feed efficiency, leading to the objective to determine potential biomarkers of feed efficiency in heifers.
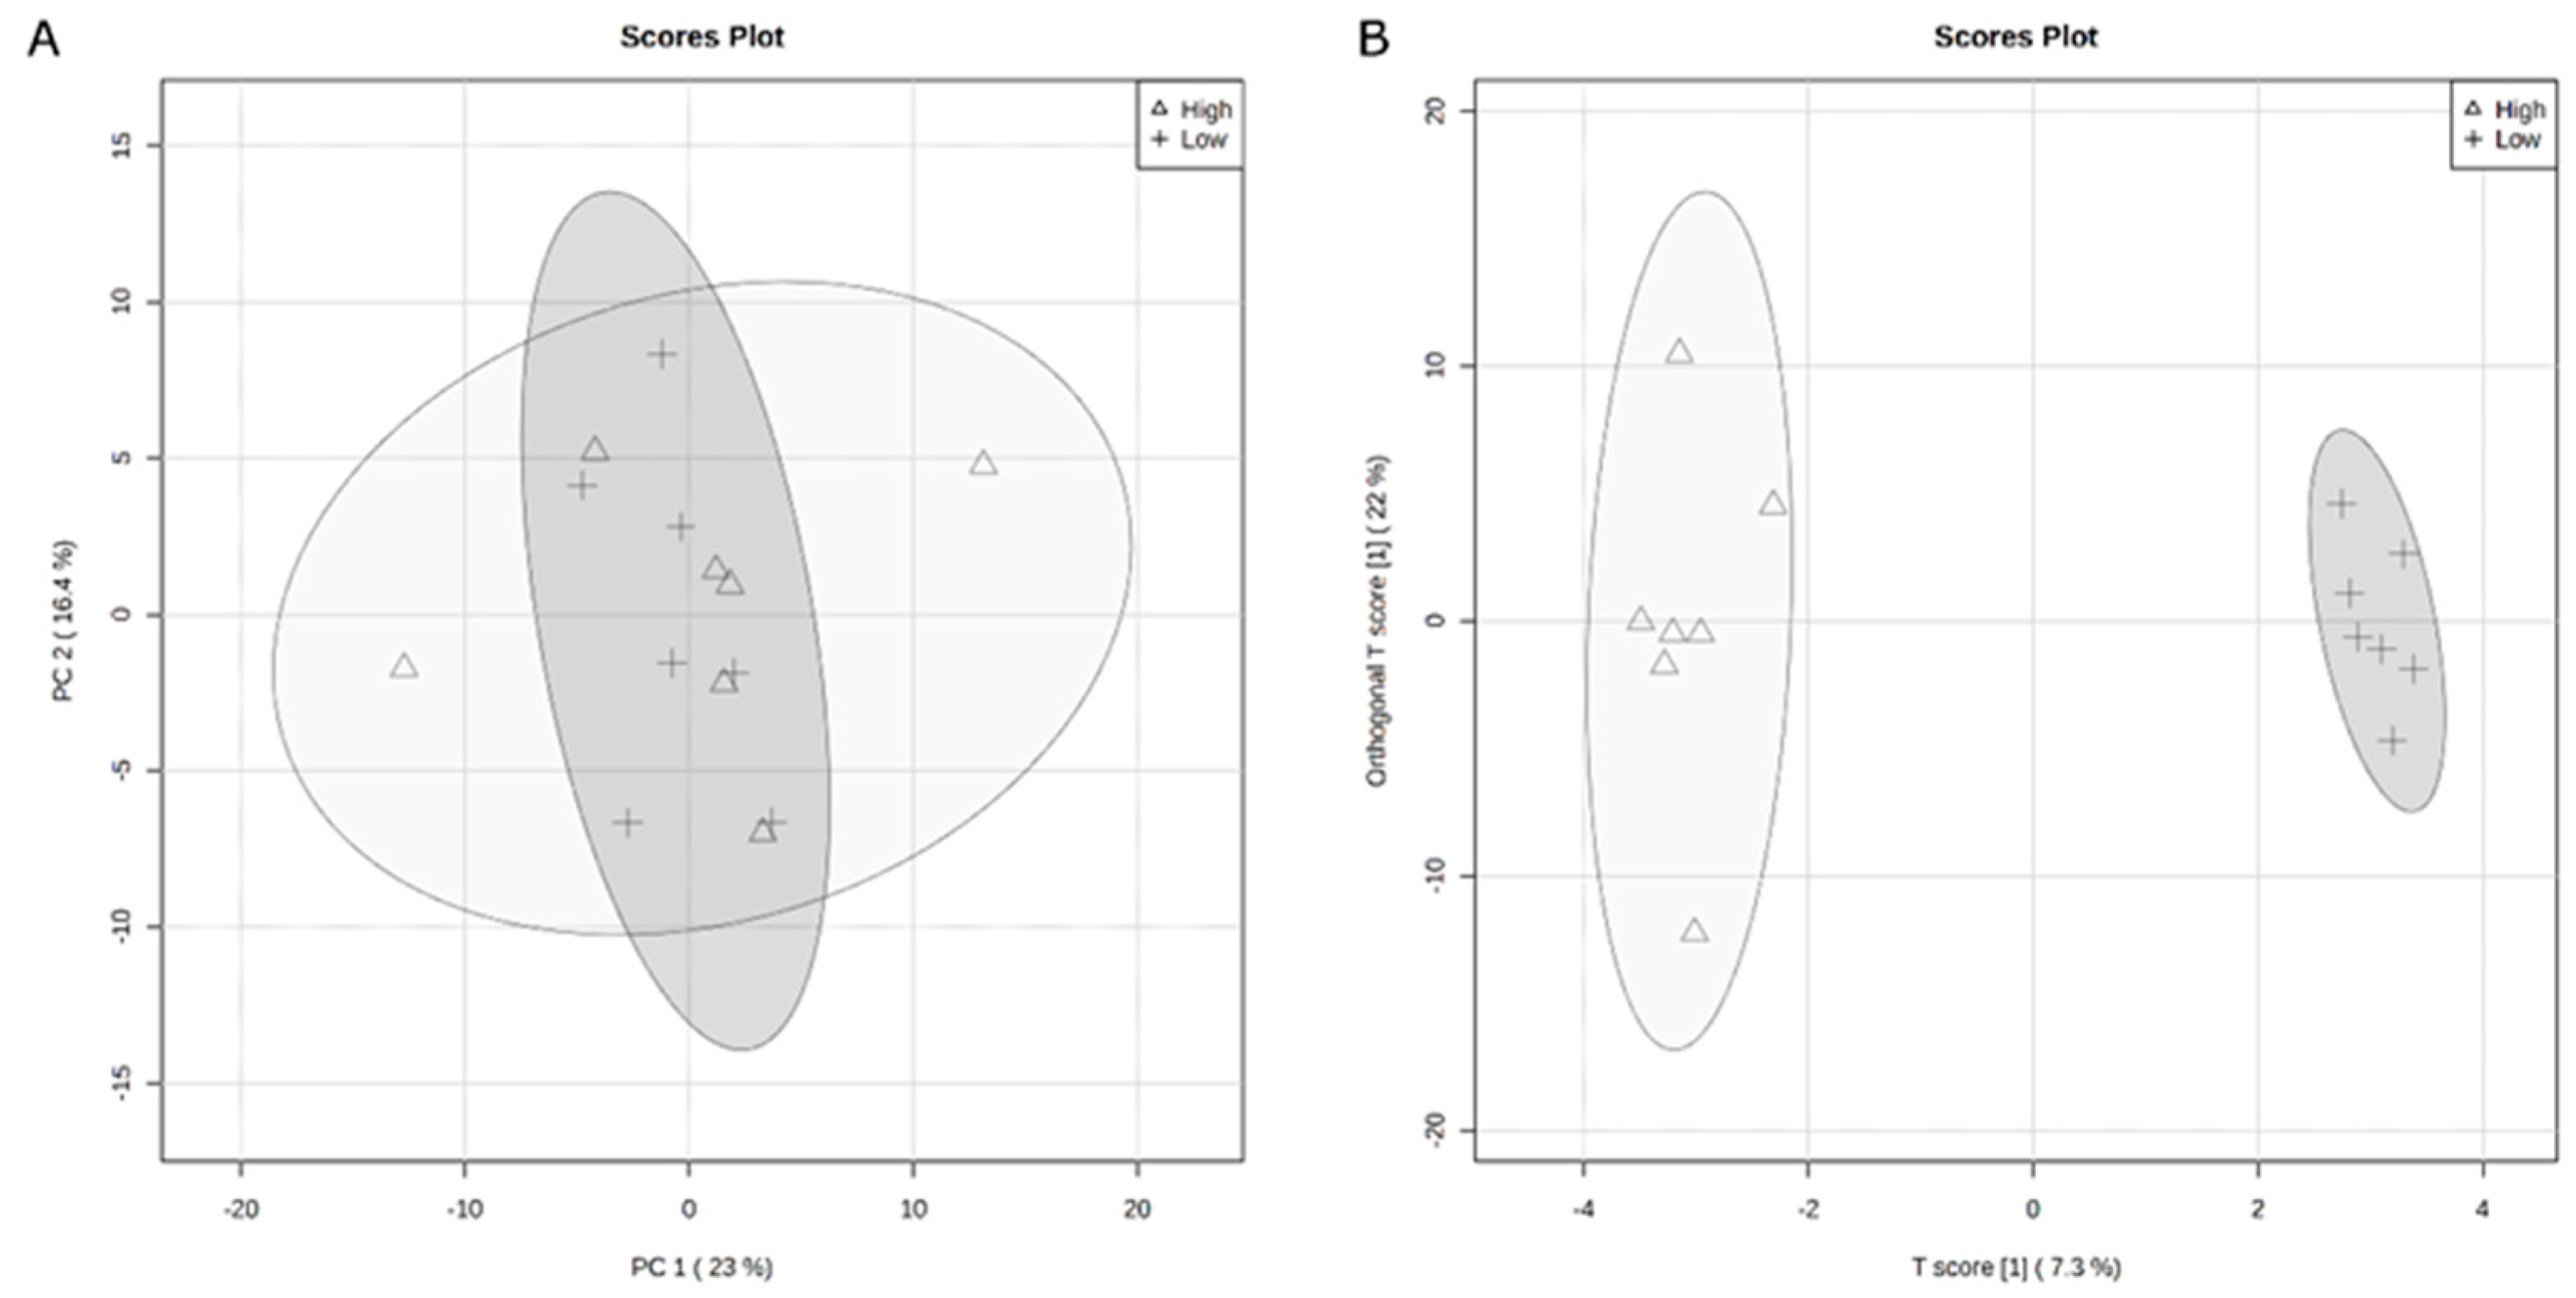
2. Materials and Methods

2.1. Experimental Design and Sample Collections

This study was carried out in accordance with the recommendations of the Institutional Animal Care and Use Committee at the University of Tennessee, Knoxville. The protocol was approved by the University of Tennessee, Knoxville Institutional Animal Care and Use Committee protocol number 2639–0818.
In this study, 17 previously cannulated Angus heifers of approximately two years of age weighing 563 ± 12 kg were chosen for a feed efficiency trial. Animals were cannulated approximately one year prior to the initiation of this study. The heifers underwent a two-week adaptation period to the GrowSafe System© prior to the 70-day feed efficiency trial. The diet was a two-component ration, with one of those components being corn silage and the other being a custom blend. A total of 50% consisted of corn silage. The second 50% component consisted of 30% soybean hull pellets, 32.5% cottonseed hulls pellets, 35% dried corn gluten feed pellets, and 2.5% limestone on an as-fed basis. The ration was developed based on National Research Council guidelines for growth. Body weight was taken on days −1, 0, 35, 70, and 71 of the feed efficiency trial, with day 0 denoting the first day of the feed efficiency trial and used to estimate average daily gain (ADG). Average daily feed intake (ADFI) based on dry matter intake and ADG were used to determine residual feed intake (RFI) as a measurement of feed efficiency [16]. On day 70, rumen content, including both solid and liquor content, was collected via the cannula from the dorsal sac, the ventral sac, and the caudoventral sac within the rumen. Rumen content was placed in a 50 mL conical tube, and pH was measured using a portable pH meter (Denver Instruments, Arvada, CO, USA). After pH was measured, two mL aliquots of rumen fluid were removed and processed for metabolomic analysis. Rumen content was immediately frozen and stored at −80 °C. Approximately 9 mL of blood was collected via coccygeal venipuncture into serum separator tubes (Corvac, Kendall Health Care, St. Louis, MO, USA). Blood samples were centrifuged at 2000× g and 4 °C for 20 min. Serum was transferred to 5 mL plastic culture tubes, and a 100 uL aliquot was removed for untargeted metabolomic analysis. Serum samples were then frozen at −80 °C. After determining ADFI and ADG, one heifer had a negative ADG and was thus eliminated from subsequent analyses.

2.2. DNA Extraction, Sequencing, and Analysis

Microbial DNA was extracted from rumen content using methods described by Yu and Morrison [17]. Briefly, approximately 0.2 g of rumen content was transferred to a lysis tube and underwent a modified repeated bead beating plus column method with an isopropanol nucleic acid precipitation. Microbial DNA was purified using the QIAamp Fast DNA Stool Mini Kit (Qiagen, Hilden, Germany) and quantified using a DeNovix DS-11+ (DeNovix Inc., Wilmington, DE, USA). Metagenomic DNA was amplified using a two-step polymerase chain reaction (PCR). The V4 hypervariable region of the 16 S rRNA gene was targeted using primers described by Parada [18] and Apprill [19] under the following conditions for the first step of PCR: initial denaturation step of 95 °C for 5 minutes; then 25 cycles of denaturation for 30 s at 95 °C, annealing for 60 s at 55 °C, and elongation for 90 s at 72 °C; followed by a final elongation step at 72 °C for 10 minutes. Gel electrophoresis was used to ensure correctly-sized DNA was amplified, then DNA was purified using AMPure XP beads (Beckman Coulter, Inc., Brea, CA, USA) per manufacturer protocol. Unique indices (Nextera, Illumina Inc., San Diego, CA, USA) were added to the purified amplified bacterial and archaeal 16 S DNA via PCR using the following conditions: initial denaturation at 95 °C for 5 min followed by eight cycles with a denaturation step of 30 s at 95 °C, annealing at 55 °C for 30 s, and an elongation step at 72 °C for 30 s, followed by a final elongation step at 72 °C for 10 min. Amplified, barcoded DNA was again purified using AMPure XP beads per manufacturer protocol. The amplicons were quantified and quality-checked using spectrophotometry with a DeNovix DS-11+ and a Bioanalyzer (Agilent Technologies, Santa Clara, CA, USA). Bacterial and archaeal amplicons were then sequenced on the Illumina MiSeq (Illumina Inc., San Diego, CA, USA) using a v2, 2 × 250 kit per manufacturer protocol at the University of Tennessee Genomics Core.

2.3. Microbial Sequence Processing

Bacterial and archaeal sequences were processed using the Galaxy server [20] and Quantitative Insights Into Microbial Ecology v.1.9 [21]. First, Illumina adapters were trimmed using TrimGalore! [22]. Trimmed sequences were then quality filtered to 90% sequences at Q ≥ 30. Chimeric sequences were identified and filtered from sequences using usearch61 [23], and then operational taxonomic units (OTUs) were identified using uclust using the Silva v138 [23]. Operational taxonomic units identified as Cyanobacteria were filtered from the OTU table, and then each sample was subsampled to 25,000 sequences based on the lowest number of sequences in a single sample. To be retained in the dataset, OTUs had to be observed in at least two samples.

2.4. Metabolomics Processing and Analysis

Metabolites were extracted from serum, and filtered rumen fluid (100 µL) at the University of Tennessee, Knoxville Biological and Small Molecule Mass Spectrometry Core using protocols previously described [24,25]. Briefly, metabolites were extracted using 0.1% formic acid in acetonitrile:water:methanol (2:2:1). Metabolites were separated using a Synergy Hydro-RP column (100 × 2 mm, 2.5 μm particle size) at 25 °C and a constant flow rate of 0.200 mL/min. Mobile phases of A: 97:3 H2O:MeOH with 11 mM tributylamine and 15 mM acetic acid and B: MeOH with a gradient consisted of the following: 0.0 min, 0% B; 2.5 min 0% B; 5.0 min, 20% B; 7.5 min, 20% B; 13 min, 55% B; 15.5 min, 95% B; 18.5 min, 95% B; 19 min, 0% B, and 25 min, 0% B. The sample (10 µL) was introduced into the Dionex UltiMate 3000 UPLC system (Thermo Fisher Scientific, Waltham, MA, USA), and electrospray ionization was used to introduce the samples into an Exactive Plus Orbitrap MS (Thermo Fisher Scientific, Waltham, MA) using methods previously described [25,26].
The raw files from Xcalibur (Thermo Fisher Scientific, Waltham, MA, USA) were converted to the mzML format using ProteoWizard [27] and imported into (Metabolomic Analysis and Visualization Engine for LC–MS Data (MAVEN) [28]. Peaks were picked in MAVEN with a preliminary mass error of ±20 ppm and a retention time window of five minutes. The final metabolite annotations were based on MS1 spectra that have been previously verified using pure standards. For final metabolite annotation, the eluted peak of the metabolite would be identified as ±2 min of anticipated retention time as well as ±5 ppm of expected mass. Metabolites were then identified in MAVEN, and the Quan Browser function of the Xcalibur MS Software (Thermo Electron Corp., Waltham, MA, USA) was used to integrate peak areas. The identified metabolites were then analyzed using MetaboAnalyst 4.0 [29]. The peak intensities were median-normalized, log-transformed, and range-scaled prior to analysis in MetaboAnalyst 4.0.

2.5. Statistical Analyses

2.5.1. Bacteria and Archaea

First, heifers were classified as high- or low-RFI based on ±0.25 standard deviations about the mean RFI, which resulted in 14 total heifers for analysis (high n = 6; low n = 8). Alpha diversity metrics, including chao1, Faith’s Phylogenetic Diversity, Good’s coverage, Shannon’s Diversity Index, and Simpson’s Evenness E, as well as phylum-and genus-level taxa data, were analyzed for normal distribution using the PROC UNIVARIATE procedure in SAS 9. Data were considered to follow a normal distribution or approximately normal based on a visual histogram and a Shapiro–Wilk statistic ≥ 0.90. Those following normal distribution were analyzed using a one-way ANOVA in SAS 9.4. Those data not following a normal distribution were first transformed using log, square root, or ranked transformations in SAS 9.4. The transformation that resulted in the greatest Shapiro–Wilk statistic was selected for use in subsequent analysis, then analyzed using a one-way ANOVA. p-values were corrected for multiple testing using the Benjamini–Hochberg false discovery rate (FDR) correction [30]. Beta-diversity was analyzed using analysis of similarity (ANOSIM) and permutational multivariate analysis of variance (PERMANOVA) based on unweighted and weighted UniFrac distances [31]. Linear discriminant analysis effect size (LeFSe) was used to identify potential microbial biomarkers of RFI in Galaxy using the tools developed by Segata and others [32]. Significance was determined at p ≤ 0.05.

2.5.2. Metabolomics

Differences in metabolites by high- and low-RFI were analyzed using a t-test for rumen fluid, and serum metabolomes were analyzed individually in MetaboAnalyst 4.0 using Benjamini–Hochberg FDR corrected p-values. Principal components analyses (PCA) and orthogonal partial least squares discriminant analyses (O-PLS-DA) were used to visualize differences in biofluid metabolites by high- and low-RFI based on 2000 permutations. Supervised random forests were used to generate variable importance in projection (VIP) plots in MetaboAnalyst 4.0. To determine relationships between rumen metabolites and microbiota, Spearman correlation analyses were performed using the PROC CORR procedure in SAS. Significance was determined at p ≤ 0.05. Additionally, the relationship between the rumen and serum metabolomes was visualized using PCA and O-PLS-DA. Variable importance in projection plots were utilized to identify metabolites contributing the most to observed differences by biofluid.

3. Results

3.1. Microbiome

A total of 917,433 quality-filtered sequences were generated, with 20,919 total OTU across all samples. All significant bacterial taxa prior to FDR are presented in Table 1. No significant archaeal taxa were observed and thus not reported. Alpha-diversity metrics did not differ by RFI (Table 2). The unweighted UniFrac distances analyzed via PERMANOVA did differ by high-and low-RFI, although no other beta-diversity metrics differed (Table 3). Principal coordinates analyses were used to visualize beta-diversity by RFI based on unweighted (Figure 1A) and weighted (Figure 1B) UniFrac distances. Bacteria identified as significant by LeFSe are presented in Figure 2.

3.2. Rumen Metabolome

No metabolites differed by t-test; however, 21 metabolites had a >2-fold difference between high- and low-RFI heifers (Table 4). Although no differences between low- and high-RFI metabolomes in the PCA (Figure 3A) were observed, the O-PLS-DA (Figure 3B) illustrated two distinct metabolomes by RFI. The top 15 metabolites driving those differences are presented in a VIP score plot (Figure 4A). In the rumen, the only pathway that was impacted as a result of differences in RFI phenotype was primary bile acid synthesis (p = 0.02, impact = 0.04).

3.3. Serum Metabolome

No differences were determined by t-test between low- and high-RFI serum metabolites, but 15 serum metabolites had a >2-fold difference between high- and low-RFI heifers (Table 5). No separation was observable in PCA (Figure 5A), but the separation was apparent in O-PLS-DA (Figure 5B). The top 15 metabolites that drove differences in metabolomes by RFI are presented in a VIP score plot in Figure 4B.

3.4. Rumen Microbiome and Metabolome

Relationships between the rumen microbiome and rumen metabolome were examined by performing correlation analyses of significant bacteria by RFI phenotype with rumen metabolites that differed ≥2-fold between low- and high-RFI heifers. Significant metabolites are presented in Table 6.

4. Discussion

Globally, beef consumption is rising, as beef provides an excellent source of animal protein [33]. The United States is one of the largest exporters of beef, exporting more than one million tons of beef annually [33,34]. In the United States beef industry, feed costs account for upwards of 70% of the total input costs of production [3,34]. Thus, identifying methods for improving feed efficiency would decrease production costs as well as allow for greater amounts of animal protein available for global consumption. The rumen microbiome contributes to the variation in feed efficiency phenotypes. However, typically, studies focus on terminal beef cattle instead of reproductive members of the herd. Therefore, this study examined the variation in feed efficiency of heifers related to serum and rumen fluid metabolomes as well as rumen bacterial populations.
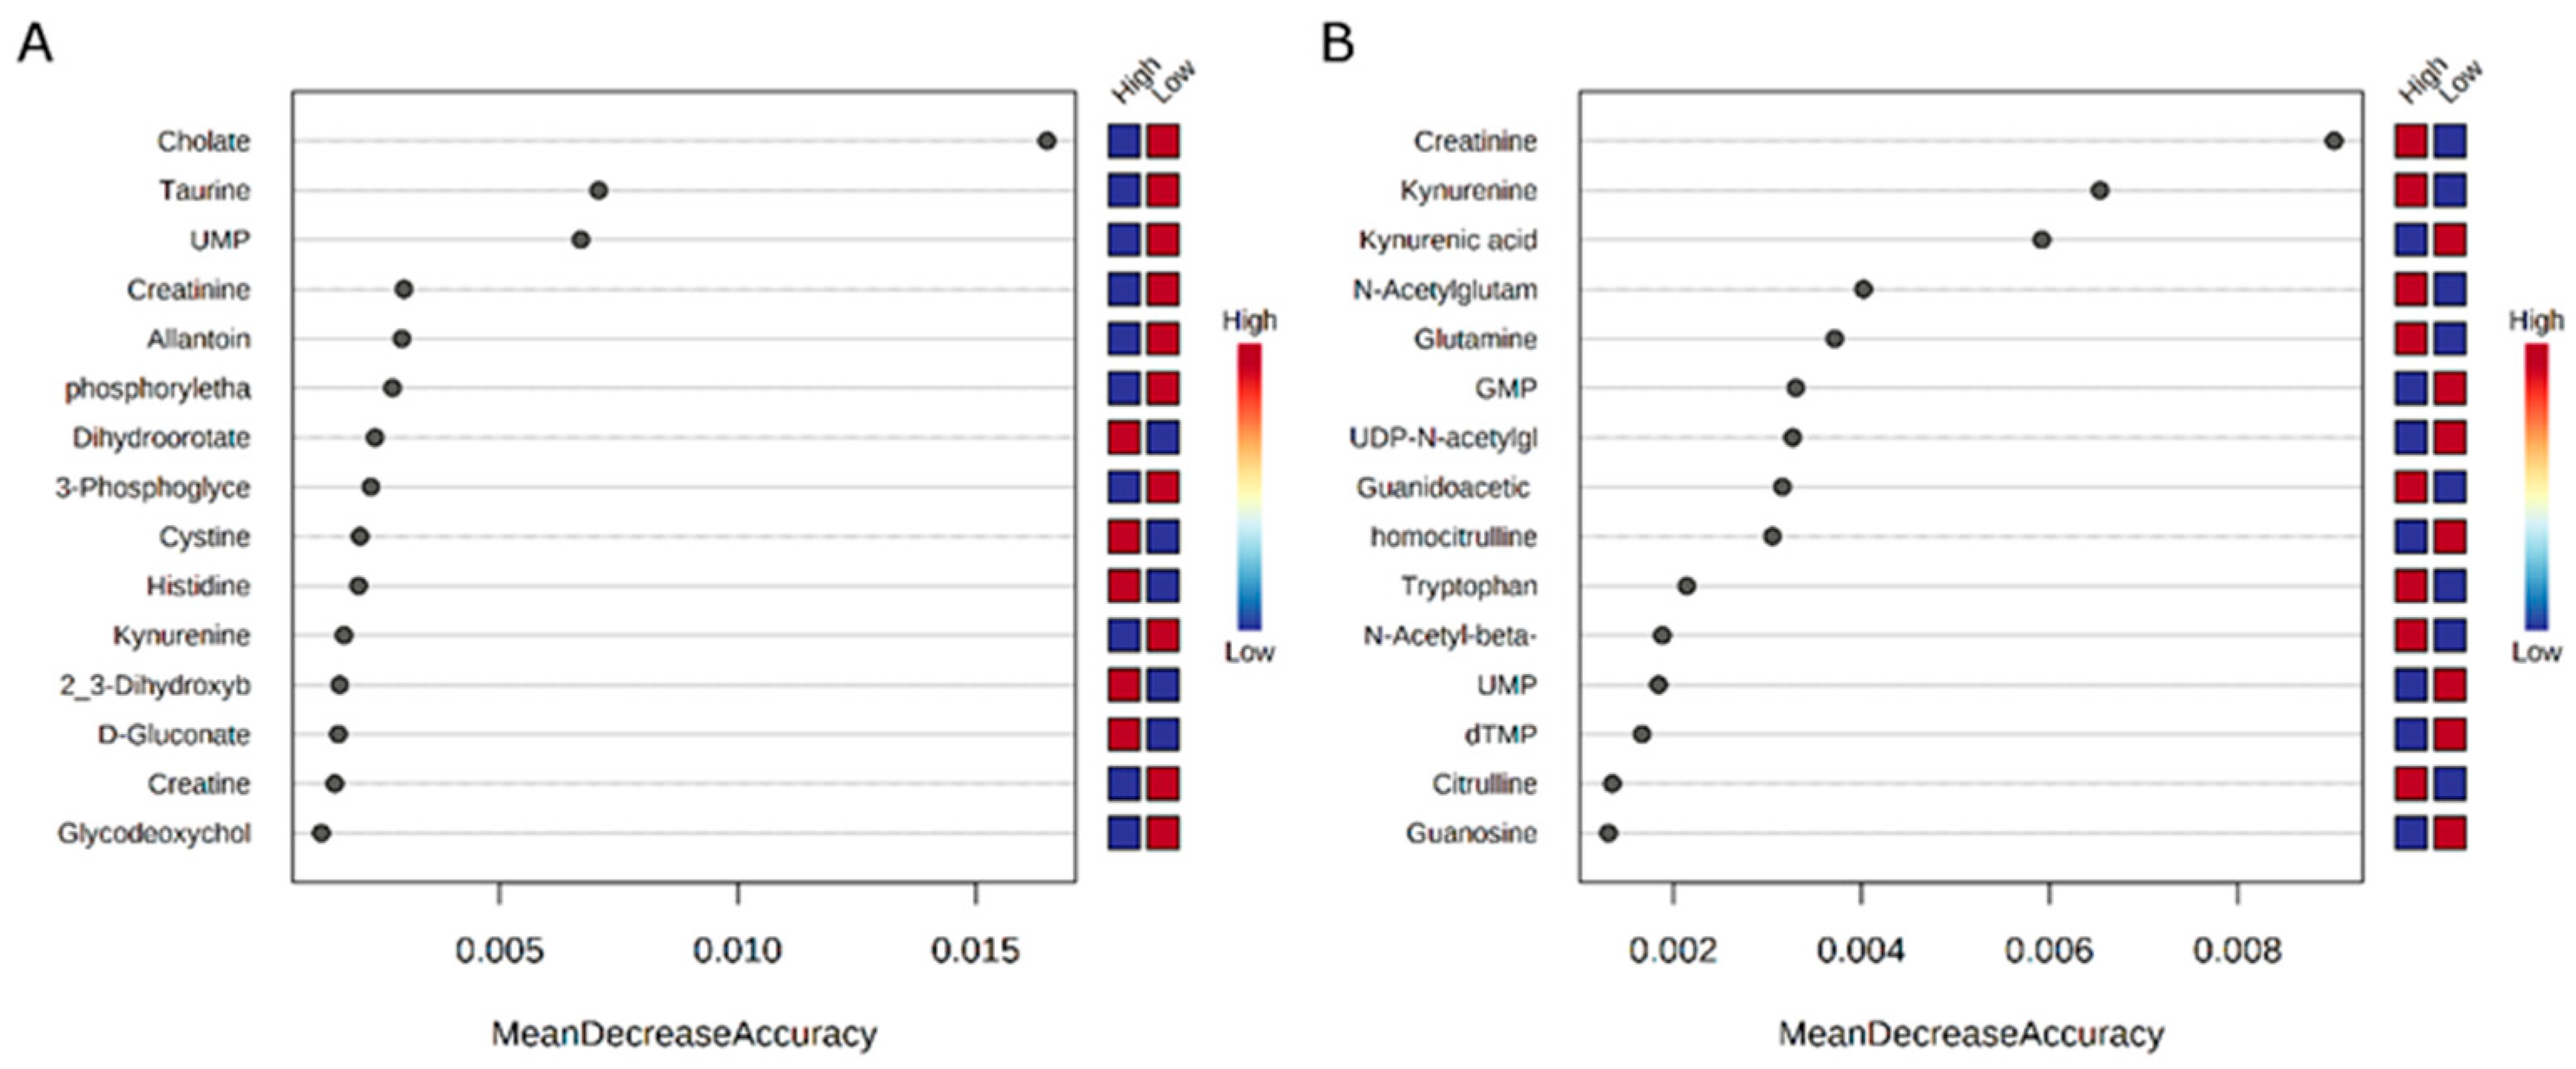
In this study, several relationships were detected between the bacterial communities and host metabolic physiology. A relationship observed among feed efficiency, the rumen microbiome, and rumen metabolome was a positive correlation between asparagine concentrations and Shuttleworthia. Furthermore, there were greater relative abundances of Shuttleworthia as well as asparagine in the rumen of low-RFI heifers. Asparagine, though not considered an essential amino acid, is required for proper brain development in mammals as well as several other biological functions [35]. It can become essential in specific situations, such as in periods of gestation, when animals are consuming low-quality forages, or in diseased states [36]. In the rumen, asparagine can be rapidly degraded by the rumen microbiota, although it has been demonstrated rates of degradation may differ. Warner examined the rate of degradation of asparagine, glutamine, nicotinamide, and formamide in sheep at various time points [37]. Warner observed that asparagine was primarily degraded by bacterial populations, but rates of degradation were affected by time or individual animals, possibly suggesting that different bacterial populations may result in variation in rates of asparagine degradation [37]. The results from Warner, coupled with the results from the present study, illustrate that there are likely differences in asparagine and other amino acid degradation in the rumen as a result of divergent microbial populations. This is of particular interest and importance for ruminant production because microbial utilization of amino acids results in fewer amino acids available to the host ruminant for muscle growth, neurotransmission and development, and other biological activities, as amino acids are catabolized to ammonia which is excreted in the urine as urea [38].
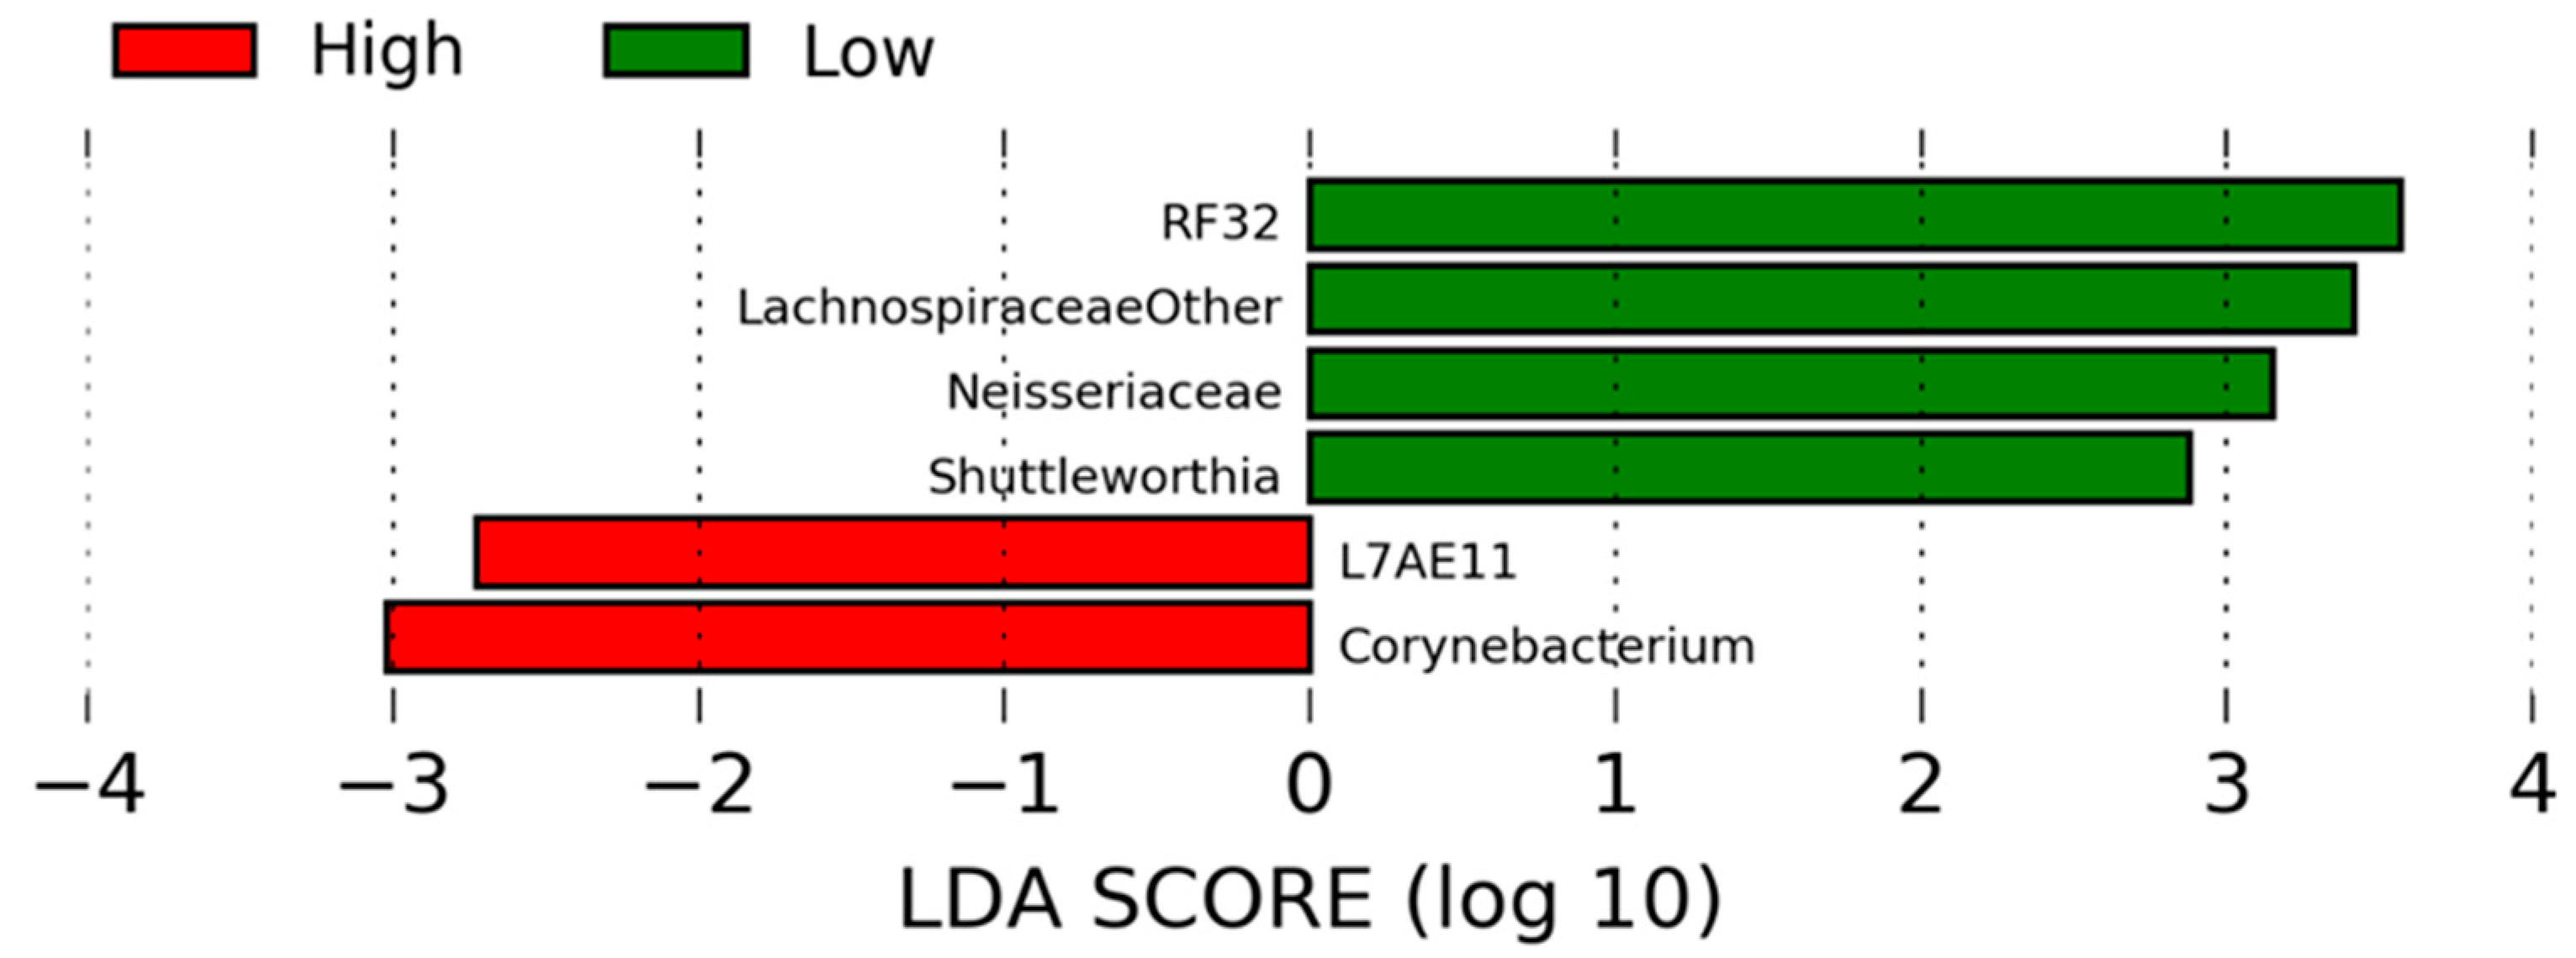
Furthermore, relationships between bile acid products and bacterial taxa that differed by RFI phenotype were observed. Bacteria that were present in greater relative abundance in high-RFI heifers, including Corynebacterium and L7A-E11, were both negatively correlated with taurine, a component for the generation of secondary bile acids. The microbiota found in greater relative abundance in low-RFI heifers, which were positively correlated with metabolites associated with secondary bile acid formation, included Lachnospiraceae, Neisseriaceae, and Shuttleworthia. These bacteria were positively correlated with taurine, glycodeoxycholate, and taurodeoxycholate. The dynamics between bile acids and gut microbiota are interesting and could account for some of the variation observed in feed efficiency phenotypes in cattle. Bile acids are known regulators of gut microbial populations in the mammalian gut as well as host metabolism [39]. Interestingly, microbially-conjugated bile acids (such as glycodeoxycholate and taurodeoxycholate) rapidly activate insulin regulation pathways via G-protein coupled receptors (GPCR) as well as activate gluconeogenic pathways via FOX01, CEBPα, and HNF4α [40] in vitro and in monogastric species. Although these specific genes do not appear to be up-or-down-regulated in cattle divergent in feed efficiency, feed efficiency is associated with differential expression in genes related to energy metabolism [11,41,42]. Lachnospiraceae, in particular, is known to produce microbial-derived secondary bile acids [43,44]. Lachnospiraceae, as well as the other bacteria found to be associated with differences in RFI and the secondary bile acids, could be altering host gene expression related to metabolism. The relationship between Lachnospiraceae and RFI in the heifers, as well as with the bile acids, may contribute to variation in feed efficiency phenotypes.
In this study, several microbial taxa of interest were correlated with 2-oxoisovalerate, including those with negative correlations (p-75-a5 and Corynebacterium) and those with positive correlations (Lachnospiraceae [Other] and Shuttleworthia). Interestingly, those microbes that were negatively correlated with 2-oxoisovalerate were present in greater abundances in high-RFI heifers. Additionally, bacteria positively correlated with 2-oxoisovalerate were observed in greater abundance in the low-RFI heifers. The metabolite 2-oxoisovalerate is involved in several vital metabolic reactions, including valine, leucine, and isoleucine biosynthesis, as well as pantothenate and coenzyme A biosynthesis. Primarily, it is involved in branched-chain amino acid (BCAA) metabolism via the branch chain α-keto acid dehydrogenase (BCKDH) complex as a product of transamination of valine [45]. The production of α-keto acids, such as 2-oxoisovalerate, results in allosteric inhibition of the BCKDH kinase [45]. The inhibition of the BCKDH kinase prevents activation of the BCKDH, resulting in conserved BCAA [45]. Branched-chain amino acids are important for muscle growth, particularly in growing cattle. A study conducted by Li and others examined the effects of BCAA supplementation during nursing on the ADG of growing dairy cattle from three to twenty-eight days after birth [46]. The authors observed that the steers that received the treatment during the first four weeks of life had sustained greater ADG than the control group starting at two months of age through slaughter at eighteen months of age [46]. The treatment group had, on average, a 14.8% greater final body weight at slaughter than the control group [46]. The greater availability of BCAA to the growing animal may provide greater muscle growth potential [46]. Some bacteria possess the ability to degrade BCAA into byproducts, including 2-oxoisovalerate, that can subsequently be absorbed by the ruminant [47]. The greater production and absorption of 2-oxoisovalerate could potentially result in some decreased transamination of BCAA, allowing for greater muscle development in low-RFI heifers. This is further supported by other results observed in this study, including the negative correlation of p-75-a5 with valine and the positive correlation of Shuttleworthia with 2-oxo-4-methylthiobutanoate, an additional intermediate of BCKDH.
Another metabolic pathway that is associated with RFI, as well as specific microbiota in the rumen, is that involved in the amino acid metabolism of serine and the homocysteine cycle. In the production of serine, 3-phosphoglycerate is converted through a series of enzymatic processes to serine. Serine can, in turn, be converted into glycine, cysteine, and homocysteine. Additionally, serine is a precursor for sphingolipids. In the present study, 3-phosphoglycerate was negatively correlated with p-75-a5 and Corynebacterium, both of which were present in greater abundances in high-RFI heifers. Lachnospiraceae (Other), found in greater abundances in low-RFI heifers, was positively correlated with 3-phosphoglycerate, as well as cysteine and phosphorylethanolamine, a sphingolipid precursor. Rumen bacteria possess the ability to break down cysteine and serine into smaller components [48], which may make the 3-phosphoglycerate available to the host animal for use, as cattle possess the ability to produce serine and cysteine from 3-phosphoglycerate [49]. Indeed, Shabat et al. found that amino acid/protein metabolism was upregulated in the rumen of high-RFI cattle, indicating that less feed efficient cattle possess rumen microbiota that may decrease the availability of amino acids or amino acid precursors available to the animal [11].
Relationships were also observed among glutathione, cysteine, and various bacteria with RFI, in which glutathione and cysteine were positively associated with RFI, as well as bacteria present in greater abundance in high-RFI heifers. The opposite trend was also observed with bacteria present in low-RFI heifers. Glutathione and cysteine are vital antioxidants that reduce the presence of destructive reactive oxygen species (ROS). Low abundances of glutathione and cysteine have been implicated in increased oxidative stress, which is interesting given that greater amounts of glutathione and cysteine were observed in the high-RFI heifers in this study. However, previous studies have demonstrated that antioxidant species may decrease during the depletion of ROS as well as the release of glutathione into media during the loss of intracellular glutathione in vitro [50]. Kizil and others examined the response of plasma markers of oxidative stress in response to subclinical and clinical mastitis infection [51]. The authors found that plasma glutathione levels increased with the severity of mastitis infection, indicating increased oxidative stress during mastitis [51]. The increased levels of glutathione and cysteine in the serum of high-RFI heifers in this study, as well as the negative correlation of various bacteria with cysteine in the rumen of low-RFI heifers, suggest a potential increased oxidative stress in high-RFI. However, the underlying cause of this is yet unknown but warrants further investigation.
Feed efficiency is an incredibly complex phenotypic trait, can be measured using several different methods, and can change based on time of year, production stage, and diet, among others. In ruminants, this is further compounded by the fact that the animal relies substantially on the gut microbiome, primarily the rumen microbiome, as the primary source of energy precursors, vitamins, and other nutrients [6,7]. Physiologically, feed efficiency, including RFI, is associated with differences in energy partitioning and methane production [52]. Researchers have also demonstrated that beef cattle with decreased feed efficiency have altered liver function, the primary site of gluconeogenesis. Alexandre and others examined the liver transcriptome in 16 beef steers differing in feed efficiency using a residual intake and body weight gain (RIG) method [53]. The authors observed that in the low feed efficient group, cattle had greater fat deposition and as well as increased transcripts for inflammatory responses, the result of which was corroborated using histological methods [53]. Additionally, the low feed efficient steers demonstrated an upregulation of genes associated with saturated fatty acid synthesis and processes involving lipid metabolism [53]. The results have been further supported using other methods in beef cattle in further studies [54,55,56,57,58]. However, one significant factor that is largely ignored in most studies is the effect of sex on the relationships between physiological differences and feed efficiency. Little is currently known about variation in the metabolome and microbiome in relation to feed efficiency as an effect of sex in cattle. The majority of beef cattle studies regarding feed efficiency are conducted in steers and occasionally bulls, but very few, if any, focus solely on female cattle or examine sex as a factor affecting feed efficiency.

5. Conclusions

To increase global protein supply, tools must be developed to quickly, efficiently, and cost-effectively assess feed efficiency to inform selection decisions. This study found several potential biomarkers of feed efficiency in both low and high feed efficient cattle. Additionally, this study found correlations between rumen bacteria and metabolites found in the rumen fluid. Of note is the identification of the relationship among feed efficiency, rumen bacteria, and secondary bile acids. The conjugated bile acids are exclusively exogenous metabolites that can be absorbed by the animal and may impact the genetic expression involved in nutrient utilization. More work needs to be conducted to validate any potential biomarkers identified in this study. However, identifying biomarkers that can be readily measured on-farm or chute-side could be used to improve management and animal selection decisions. Additionally, this is particularly important as it was conducted in heifers which demonstrated different biomarkers of feed efficiency than steers.

Author Contributions

Conceptualization, B.A.C., P.-Y.M., L.G.S., B.H.V., M.S., D.R.D. and K.J.M.; methodology, B.AC., P.-Y.M., L.G.S., M.S. and S.R.C.; formal analysis, B.A.C.; investigation, B.A.C., T.B.A.-S., M.T.H. and P.R.M.; resources, P.-Y.M. and D.E.A.; data curation, all authors; writing—original draft preparation, B.A.C.; writing—review and editing, all authors; supervision, P.R.M.; funding acquisition, P.-Y.M. All authors have read and agreed to the published version of the manuscript.

Funding

This research was funded by the Tennessee Beef Promotion Board and the USDA National Institute of Food and Agriculture, Hatch/Multistate Project W4177-TEN00524 Enhancing the Competitiveness and Value of U.S. Beef; Accession Number: 1016984.

Institutional Review Board Statement

This study was carried out in accordance with the recommendations of the Institutional Animal Care and Use Committee at the University of Tennessee, Knoxville. The protocol was approved by the University of Tennessee, Knoxville Institutional Animal Care and Use Committee protocol number 2639–0818.

Informed Consent Statement

Not applicable.

Data Availability Statement

Acknowledgments

The authors would like to thank the farm staff at the East Tennessee Research and Education Center as well as the farm staff at the Plateau Research and Education Center for their support throughout this project.

Conflicts of Interest

The authors declare no conflict of interest.

References

  1. Davis, C. Cattle & Beef Statistics and Information. Available online: https://www.ers.usda.gov/topics/animal-products/cattle-beef/sector-at-a-glance (accessed on 23 March 2022).
  2. Herd, R.M.; Archer, J.A.; Arthur, P.F. Reducing the Cost of Beef Production through Genetic Improvement in Residual Feed Intake: Opportunity and Challenges to Application. J. Anim. Sci. 2003, 81, E9–E17. [Google Scholar]
  3. Montaño-Bermudez, M.; Nielsen, M.K.; Deutscher, G.H. Energy Requirements for Maintenance of Crossbred Beef Cattle with Different Genetic Potential for Milk. J. Anim. Sci. 1990, 68, 2279–2288. [Google Scholar] [CrossRef] [Green Version]
  4. Strimbu, K.; Tavel, J.A. What Are Biomarkers? Curr. Opin. HIV AIDS 2010, 5, 463–466. [Google Scholar] [CrossRef]
  5. Fontanesi, L. Metabolomics and Livestock Genomics: Insights into a Phenotyping Frontier and Its Applications in Animal Breeding. Anim. Front. 2016, 6, 73–79. [Google Scholar] [CrossRef] [Green Version]
  6. Young, J.W. Gluconeogenesis in Cattle: Significance and Methodology. J. Dairy Sci. 1977, 60, 1–15. [Google Scholar] [CrossRef]
  7. Hungate, R.E. The Rumen and Its Microbes; Elsevier: Amsterdam, The Netherlands, 2013; ISBN 1483263622. [Google Scholar]
  8. Myer, P.R.; Smith, T.P.; Wells, J.E.; Kuehn, L.A.; Freetly, H.C. Rumen Microbiome from Steers Differing in Feed Efficiency. PLoS ONE 2015, 10, e0129174. [Google Scholar] [CrossRef] [Green Version]
  9. McCann, J.C.; Wiley, L.M.; Forbes, T.D.; Rouquette, F.M., Jr.; Tedeschi, L.O. Relationship between the Rumen Microbiome and Residual Feed Intake-Efficiency of Brahman Bulls Stocked on Bermudagrass Pastures. PLoS ONE 2014, 9, e91864. [Google Scholar] [CrossRef] [PubMed] [Green Version]
  10. McGovern, E.; Kenny, D.A.; McCabe, M.S.; Fitzsimons, C.; McGee, M.; Kelly, A.K.; Waters, S.M. 16S RRNA Sequencing Reveals Relationship between Potent Cellulolytic Genera and Feed Efficiency in the Rumen of Bulls. Front. Microbiol. 2018, 9, 1842. [Google Scholar] [CrossRef] [PubMed]
  11. Shabat, S.K.B.; Sasson, G.; Doron-Faigenboim, A.; Durman, T.; Yaacoby, S.; Miller, M.E.B.; White, B.A.; Shterzer, N.; Mizrahi, I. Specific Microbiome-Dependent Mechanisms Underlie the Energy Harvest Efficiency of Ruminants. ISME J. 2016, 10, 2958–2972. [Google Scholar] [CrossRef] [PubMed] [Green Version]
  12. Jewell, K.A.; McCormick, C.A.; Odt, C.L.; Weimer, P.J.; Suen, G. Ruminal Bacterial Community Composition in Dairy Cows Is Dynamic over the Course of Two Lactations and Correlates with Feed Efficiency. Appl. Environ. Microbiol. 2015, 81, 4697–4710. [Google Scholar] [CrossRef] [Green Version]
  13. Pitta, D.W.; Indugu, N.; Kumar, S.; Vecchiarelli, B.; Sinha, R.; Baker, L.D.; Bhukya, B.; Ferguson, J.D. Metagenomic Assessment of the Functional Potential of the Rumen Microbiome in Holstein Dairy Cows. Anaerobe 2016, 38, 50–60. [Google Scholar] [CrossRef] [PubMed]
  14. Jami, E.; White, B.A.; Mizrahi, I. Potential Role of the Bovine Rumen Microbiome in Modulating Milk Composition and Feed Efficiency. PLoS ONE 2014, 9, e85423. [Google Scholar] [CrossRef] [PubMed]
  15. Ellison, M.J.; Conant, G.C.; Lamberson, W.R.; Cockrum, R.R.; Austin, K.J.; Rule, D.C.; Cammack, K.M. Diet and Feed Efficiency Status Affect Rumen Microbial Profiles of Sheep. Small Rumin. Res. 2017, 156, 12–19. [Google Scholar] [CrossRef]
  16. Koch, R.M.; Swiger, L.A.; Chambers, D.; Gregory, K.E. Efficiency of Feed Use in Beef Cattle. J. Anim. Sci. 1963, 22, 486–494. [Google Scholar] [CrossRef]
  17. Yu, Z.; Morrison, M. Improved Extraction of PCR-Quality Community DNA from Digesta and Fecal Samples. Biotechniques 2004, 36, 808–812. [Google Scholar] [CrossRef] [PubMed]
  18. Parada, A.E.; Needham, D.M.; Fuhrman, J.A. Every Base Matters: Assessing Small Subunit RRNA Primers for Marine Microbiomes with Mock Communities, Time Series and Global Field Samples. Environ. Microbiol. 2016, 18, 1403–1414. [Google Scholar] [CrossRef]
  19. Apprill, A.; McNally, S.; Parsons, R.; Weber, L. Minor Revision to V4 Region SSU RRNA 806R Gene Primer Greatly Increases Detection of SAR11 Bacterioplankton. Aquat. Microb. Ecol. 2015, 75, 129–137. [Google Scholar] [CrossRef] [Green Version]
  20. Afgan, E.; Baker, D.; Batut, B.; Van Den Beek, M.; Bouvier, D.; Čech, M.; Chilton, J.; Clements, D.; Coraor, N.; Grüning, B.A. The Galaxy Platform for Accessible, Reproducible and Collaborative Biomedical Analyses: 2018 Update. Nucleic Acids Res. 2018, 46, W537–W544. [Google Scholar] [CrossRef] [Green Version]
  21. Caporaso, J.G.; Kuczynski, J.; Stombaugh, J.; Bittinger, K.; Bushman, F.D.; Costello, E.K.; Fierer, N.; Peña, A.G.; Goodrich, J.K.; Gordon, J.I. QIIME Allows Analysis of High-Throughput Community Sequencing Data. Nat. Methods 2010, 7, 335–336. [Google Scholar] [CrossRef] [Green Version]
  22. Krueger, F. Trim Galore. A Wrapper Tool Cutadapt FastQC Consistently Apply Qual. Adapt. Trimming FastQ Files 2015, 516, 517. [Google Scholar]
  23. Edgar, R.C. Search and Clustering Orders of Magnitude Faster than BLAST. Bioinformatics 2010, 26, 2460–2461. [Google Scholar] [CrossRef] [Green Version]
  24. Clemmons, B.A.; Mihelic, R.I.; Beckford, R.C.; Powers, J.B.; Melchior, E.A.; McFarlane, Z.D.; Cope, E.R.; Embree, M.M.; Mulliniks, J.T.; Campagna, S.R. Serum Metabolites Associated with Feed Efficiency in Black Angus Steers. Metabolomics 2017, 13, 147. [Google Scholar] [CrossRef]
  25. Kamphorst, J.J.; Fan, J.; Lu, W.; White, E.; Rabinowitz, J.D. Liquid Chromatography–High Resolution Mass Spectrometry Analysis of Fatty Acid Metabolism. Anal. Chem. 2011, 83, 9114–9122. [Google Scholar] [CrossRef] [Green Version]
  26. Lu, W.; Clasquin, M.F.; Melamud, E.; Amador-Noguez, D.; Caudy, A.A.; Rabinowitz, J.D. Metabolomic Analysis via Reversed-Phase Ion-Pairing Liquid Chromatography Coupled to a Stand Alone Orbitrap Mass Spectrometer. Anal. Chem. 2010, 82, 3212–3221. [Google Scholar] [CrossRef] [Green Version]
  27. Chambers, M.C.; Maclean, B.; Burke, R.; Amodei, D.; Ruderman, D.L.; Neumann, S.; Gatto, L.; Fischer, B.; Pratt, B.; Egertson, J. A Cross-Platform Toolkit for Mass Spectrometry and Proteomics. Nat. Biotechnol. 2012, 30, 918–920. [Google Scholar] [CrossRef] [PubMed]
  28. Clasquin, M.F.; Melamud, E.; Rabinowitz, J.D. LC-MS Data Processing with MAVEN: A Metabolomic Analysis and Visualization Engine. Curr. Protoc. Bioinforma. 2012, 37, 1–14. [Google Scholar]
  29. Chong, J.; Soufan, O.; Li, C.; Caraus, I.; Li, S.; Bourque, G.; Wishart, D.S.; Xia, J. MetaboAnalyst 4.0: Towards More Transparent and Integrative Metabolomics Analysis. Nucleic Acids Res. 2018, 46, W486–W494. [Google Scholar] [CrossRef] [Green Version]
  30. Benjamini, Y.; Hochberg, Y. Controlling the False Discovery Rate: A Practical and Powerful Approach to Multiple Testing. J. R. Stat. Soc. Ser. B Methodol. 1995, 57, 289–300. [Google Scholar] [CrossRef]
  31. Lozupone, C.; Lladser, M.E.; Knights, D.; Stombaugh, J.; Knight, R. UniFrac: An Effective Distance Metric for Microbial Community Comparison. ISME J. 2011, 5, 169–172. [Google Scholar] [CrossRef] [Green Version]
  32. Segata, N.; Izard, J.; Waldron, L.; Gevers, D.; Miropolsky, L.; Garrett, W.S.; Huttenhower, C. Metagenomic Biomarker Discovery and Explanation. Genome Biol. 2011, 12, R60. [Google Scholar] [CrossRef] [PubMed] [Green Version]
  33. Smith, S.B.; Gotoh, T.; Greenwood, P.L. Current Situation and Future Prospects for Global Beef Production: Overview of Special Issue. Asian-Australas. J. Anim. Sci. 2018, 31, 927. [Google Scholar] [CrossRef] [PubMed] [Green Version]
  34. USDA ERS. Cattle & Beef Statistics & Information; US Department of Agriculture: Washington, DC, USA, 2015.
  35. Ruzzo, E.K.; Capo-Chichi, J.-M.; Ben-Zeev, B.; Chitayat, D.; Mao, H.; Pappas, A.L.; Hitomi, Y.; Lu, Y.-F.; Yao, X.; Hamdan, F.F. Deficiency of Asparagine Synthetase Causes Congenital Microcephaly and a Progressive Form of Encephalopathy. Neuron 2013, 80, 429–441. [Google Scholar] [CrossRef] [Green Version]
  36. Pavlova, N.N.; Hui, S.; Ghergurovich, J.M.; Fan, J.; Intlekofer, A.M.; White, R.M.; Rabinowitz, J.D.; Thompson, C.B.; Zhang, J. As Extracellular Glutamine Levels Decline, Asparagine Becomes an Essential Amino Acid. Cell Metab. 2018, 27, 428–438.e5. [Google Scholar] [CrossRef] [PubMed] [Green Version]
  37. Warner, A.C.I. Production of Volatile Fatty Acids in the Rumen: Methods of Measurement. Nutr. Abstr. Rev. 1964, 34, 339–352. [Google Scholar] [PubMed]
  38. Pathak, A.K. Various Factors Affecting Microbial Protein Synthesis in the Rumen. Vet. World 2008, 1, 186. [Google Scholar]
  39. Ridlon, J.M.; Kang, D.J.; Hylemon, P.B.; Bajaj, J.S. Bile Acids and the Gut Microbiome. Curr. Opin. Gastroenterol. 2014, 30, 332. [Google Scholar] [CrossRef] [Green Version]
  40. Yamagata, K.; Daitoku, H.; Shimamoto, Y.; Matsuzaki, H.; Hirota, K.; Ishida, J.; Fukamizu, A. Bile Acids Regulate Gluconeogenic Gene Expression via Small Heterodimer Partner-Mediated Repression of Hepatocyte Nuclear Factor 4 and Foxo1. J. Biol. Chem. 2004, 279, 23158–23165. [Google Scholar] [CrossRef] [Green Version]
  41. Chen, Y.; Penner, G.B.; Li, M.; Oba, M.; Guan, L.L. Changes in Bacterial Diversity Associated with Epithelial Tissue in the Beef Cow Rumen during the Transition to a High-Grain Diet. Appl. Environ. Microbiol. 2011, 77, 5770–5781. [Google Scholar] [CrossRef] [Green Version]
  42. Tizioto, P.C.; Coutinho, L.L.; Decker, J.E.; Schnabel, R.D.; Rosa, K.O.; Oliveira, P.S.; Souza, M.M.; Mourão, G.B.; Tullio, R.R.; Chaves, A.S. Global Liver Gene Expression Differences in Nelore Steers with Divergent Residual Feed Intake Phenotypes. BMC Genom. 2015, 16, 242. [Google Scholar] [CrossRef] [Green Version]
  43. Weingarden, A.R.; Chen, C.; Bobr, A.; Yao, D.; Lu, Y.; Nelson, V.M.; Sadowsky, M.J.; Khoruts, A. Microbiota Transplantation Restores Normal Fecal Bile Acid Composition in Recurrent Clostridium Difficile Infection. Am. J. Physiol.-Gastrointest. Liver Physiol. 2014, 306, G310–G319. [Google Scholar] [CrossRef] [Green Version]
  44. Devlin, A.S.; Fischbach, M.A. A Biosynthetic Pathway for a Prominent Class of Microbiota-Derived Bile Acids. Nat. Chem. Biol. 2015, 11, 685–690. [Google Scholar] [CrossRef] [Green Version]
  45. Brosnan, J.T.; Brosnan, M.E. Branched-Chain Amino Acids: Enzyme and Substrate Regulation. J. Nutr. 2006, 136, 207S–211S. [Google Scholar] [CrossRef]
  46. Li, J.Y.; Suzuki, K.; Koike, Y.; Chen, D.S.; Yonezawa, T.; Nishihara, M.; Manabe, N. Effects of Dietary Supplementation with Branched-Chain Amino Acids (BCAAs) during Nursing on Plasma BCAA Levels and Subsequent Growth in Cattle. Asian-Australas. J. Anim. Sci. 2005, 18, 1440–1444. [Google Scholar] [CrossRef]
  47. Early, R.J.; Thompson, J.R.; Christopherson, R.J.; Sedgwick, G.W. Branched-Chain Alpha-Keto Acid Exchange across the Portal-Drained Viscera and Hindlimb of Fed and Fasted Steers. Can. J. Anim. Sci. 1984, 64, 276–277. [Google Scholar] [CrossRef]
  48. Chalupa, W. Degradation of Amino Acids by the Mixed Rumen Microbial Population. J. Anim. Sci. 1976, 43, 828–834. [Google Scholar] [CrossRef]
  49. Wu, G. Dietary Requirements of Synthesizable Amino Acids by Animals: A Paradigm Shift in Protein Nutrition. J. Anim. Sci. Biotechnol. 2014, 5, 34. [Google Scholar] [CrossRef] [Green Version]
  50. Yu, X.; Long, Y.C. Crosstalk between Cystine and Glutathione Is Critical for the Regulation of Amino Acid Signaling Pathways and Ferroptosis. Sci. Rep. 2016, 6, 30033. [Google Scholar] [CrossRef]
  51. Kizil, O.; Akar, Y.; Saat, N.; Kizil, M.; Yuksel, M. The Plasma Lipid Peroxidation Intensity (MDA) and Chain-Breaking Antioxidant Concentrations in the Cows with Clinic or Subclinic Mastitis. Rev. Med. Vet. 2007, 158, 529–533. [Google Scholar]
  52. Nkrumah, J.D.; Okine, E.K.; Mathison, G.W.; Schmid, K.; Li, C.; Basarab, J.A.; Price, M.A.; Wang, Z.; Moore, S.S. Relationships of Feedlot Feed Efficiency, Performance, and Feeding Behavior with Metabolic Rate, Methane Production, and Energy Partitioning in Beef Cattle1. J. Anim. Sci. 2006, 84, 145–153. [Google Scholar] [CrossRef]
  53. Alexandre, P.A.; Kogelman, L.J.A.; Santana, M.H.A.; Passarelli, D.; Pulz, L.H.; Fantinato-Neto, P.; Silva, P.L.; Leme, P.R.; Strefezzi, R.F.; Coutinho, L.L.; et al. Liver Transcriptomic Networks Reveal Main Biological Processes Associated with Feed Efficiency in Beef Cattle. BMC Genom. 2015, 16, 1073. [Google Scholar] [CrossRef] [Green Version]
  54. Richardson, E.C.; Herd, R.M. Biological Basis for Variation in Residual Feed Intake in Beef Cattle. 2. Synthesis of Results Following Divergent Selection. Aust. J. Exp. Agric. 2004, 44, 431–440. [Google Scholar] [CrossRef]
  55. Connor, E.E.; Kahl, S.; Elsasser, T.H.; Parker, J.S.; Li, R.W.; Van Tassell, C.P.; Baldwin, R.L.; Barao, S.M. Enhanced Mitochondrial Complex Gene Function and Reduced Liver Size May Mediate Improved Feed Efficiency of Beef Cattle during Compensatory Growth. Funct. Integr. Genom. 2010, 10, 39–51. [Google Scholar] [CrossRef]
  56. Abo-Ismail, M.K.; Kelly, M.J.; Squires, E.J.; Swanson, K.C.; Bauck, S.; Miller, S.P. Identification of Single Nucleotide Polymorphisms in Genes Involved in Digestive and Metabolic Processes Associated with Feed Efficiency and Performance Traits in Beef Cattle1,2. J. Anim. Sci. 2013, 91, 2512–2529. [Google Scholar] [CrossRef]
  57. Clemmons, B.A.; Voy, B.H.; Myer, P.R. Altering the Gut Microbiome of Cattle: Considerations of Host-Microbiome Interactions for Persistent Microbiome Manipulation. Microb. Ecol. 2019, 77, 523–536. [Google Scholar] [CrossRef]
  58. Archer, J.A.; Richardson, E.C.; Herd, R.M.; Arthur, P.F. Potential for Selection to Improve Efficiency of Feed Use in Beef Cattle: A Review. Aust. J. Agric. Res. 1999, 50, 147–162. [Google Scholar] [CrossRef]
Figure 1. Principal coordinates analysis based on unweighted (A) and weighted (B) UniFrac distances of different levels of residual feed intake. Analyses based on 9999 permutations. Low-RFI is represented by a blue circle (n = 8), and high-RFI is represented by a red square (n = 6).
Ruminants 02 00019 g001
Figure 2. Linear discriminant analysis effect size of bacteria that were associated with low-RFI (green) or high-RFI (red) phenotypes.
Ruminants 02 00019 g002
Figure 3. Principal components analysis (A) and orthogonal partial least squares discriminant analysis (B) comparing rumen fluid metabolomes of low- and high-RFI heifers. Ellipses represent a 95% confidence interval, with low-RFI represented by the plus sign and high-RFI heifers represented by the triangle.
Ruminants 02 00019 g003
Figure 4. Variable importance in project plots for the top 15 metabolites contributing to differences in metabolomes between low- and high-RFI heifers in rumen fluid (A) and serum (B).
Ruminants 02 00019 g004
Figure 5. Principal components analysis (A) and orthogonal partial least squares discriminant analysis (B) of serum metabolites that differed between low-RFI (plus sign) and high-RFI (triangle). Ellipses represent a 95% confidence interval.
Ruminants 02 00019 g005
Table 1. Significant bacteria that differed between low- and high-RFI heifers.
Taxa LevelTaxonHigh-RFI 1Low-RFI 1p-ValueFDR 2
FamilyLachnospiraceae (Other)2.94 × 10⁻³ (7.07 × 10⁻⁴)7.82 × 10⁻³ (1.71 × 10⁻³)0.040.98
FamilyDesulfobulbaceae50.002.61 × 10−5 (1.11 × 10⁻⁵)0.050.98
FamilyNeisseriaceae33.37 × 10−5 (2.65 × 10⁻⁵)1.09 × 10⁻⁴ (3.20 × 10⁻⁵)0.020.98
GenusShuttleworthia41.35 × 10−4 (2.48 × 10⁻⁵)5.89 × 10⁻⁴ (1.58 × 10⁻⁴)0.020.98
GenusCorynebacterium3.49 × 10−4 (4.89 × 10⁻⁵)1.53 × 10⁻⁴ (5.14 × 10⁻⁵)0.020.98
Genusp-75-a52.75 × 10−4 (7.19 × 10⁻⁵)1.11 × 10⁻⁴ (3.16 × 10⁻⁵)0.040.98
GenusL7A-E112.15 × 10−4 (8.59 × 10⁻⁵)1.49 × 10⁻⁵ (7.28 × 10⁻⁶)<0.0010.98
1 Mean (SEM) based on raw abundances. 2 Benjamini–Hochberg false discovery rate corrected p-values 3 Based on log-transformed data 4 Based on square root-transformed data 5 Based on ranked data.
Table 2. Alpha diversity metrics between low- and high-RFI heifers.
MetricHigh-RFI 1Low-RFI 1p-Value
Good’s Coverage0.95 (0.00)0.95 (0.00)0.74
Observed OTU2366.83 (148.53)2195.63 (87.38)0.31
Chao14658.78 (315.16)4536.07 (252.66)0.76
Faith’s Phylogenetic Diversity121.40 (5.39)113.03 (3.28)0.19
Shannon’s Diversity Index8.01 (0.31)7.80 (0.16)0.52
Simpson’s Evenness E0.02 (0.01)0.02 (0.00)0.64
1 Mean (SEM).
Table 3. Beta diversity metrics between low- and high-RFI heifers.
Metric 1Test Statisticp-Value
PERMANOVA 2–weighted1.30 40.22
PERMANOVA 2–unweighted1.17 40.03
ANOSIM 3–weighted 0.08 50.22
ANOSIM 3–unweighted0.16 50.09
1 Metrics based on weighted or unweighted UniFrac distances with 9999 permutations. 2 Permutational multivariate analysis of variance. 3 Analysis of similarity. 4 Test statistic is pseudo-F. 5 Test statistic is R.
Table 4. Rumen fluid metabolites with >2-fold differences between low- and high-RFI heifers.
MetaboliteHigh-RFI 1Low-RFI 1Fold Change
UDP-N-acetylglucosamine8.44 × 102 (8.44 × 10²)3.23 × 10⁵ (1.83 × 10⁵)0.0032488
NAD1.18 × 102 (1.18 × 10²)1.84 × 10⁴ (1.09 × 10⁴)0.01375
Taurine2.22 × 103 (1.54 × 10³)1.35 × 10⁵ (1.01 × 10⁵)0.020692
Cholate4.83 × 105 (1.36 × 10⁵)7.08 × 10⁶ (2.82 × 10⁶)0.075272
Creatine1.89 × 103 (6.28 × 10²)3.77 × 10⁴ (2.75 × 10⁴)0.076414
Taurodeoxycholaten.d.5.48 × 105 (3.36 × 10⁵)0.081299
Glycodeoxycholaten.d.4.29 × 105 (3.10 × 10⁵)0.12439
Cystathionine1.08 × 104 (5.76 × 10³)2.03 × 10³ (8.88 × 10²)8.004
Arginine9.39 × 103 (3.90 × 10³)1.07 × 10⁵ (6.57 × 10⁴)0.13458
IMP6.48 × 103 (2.24 × 10³)4.42 × 10⁴ (3.51 × 10⁴) 0.14821
UMP4.93 × 104 (1.15 × 10⁴)2.59 × 10⁵ (1.08 × 10⁵)0.19245
UDPn.d.7.78 × 102 (6.71 × 10²)0.195
phosphorylethanolamine3.88 × 102 (1.76 × 10²)3.68 × 10³ (1.96 × 10³)0.20153
cAMP4.04 × 105 (3.79 × 10⁵)1.25 × 10⁶ (9.49 × 10⁵)0.24847
Asparagine4.18 × 104 (7.51 × 10³)1.53 × 10⁵ (6.18 × 10⁴)0.32909
Octulose bisphosphate5.12 × 105 (1.67 × 10⁵)1.89 × 10⁵ (7.19 × 10⁴)2.6493
Creatinine6.67 × 104 (9.29 × 10³)7.68 × 10⁴ (3.23 × 10⁴)0.39336
Homocysteine1.59 × 102 (1.59 × 10²)9.04 × 10² (7.49 × 10²)0.42019
Cysteine2.22 × 104 (7.15 × 10³)1.01 × 10⁴ (3.22 × 10³)2.1765
FAD2.81 × 103 (2.81 × 10³)1.04 × 10³ (6.76 × 10²)2.1052
3-Phosphoglycerate9.84 × 105 (1.77 × 10⁵)2.10 × 10⁶ (3.99 × 10⁵)0.49568
1 Mean (SEM). n.d. = not detected.
Table 5. Serum metabolites with >2-fold difference between high- and low-RFI heifers.
MetaboliteHigh-RFI 1Low-RFI 1Fold Change
IMP2.75 × 103 (1.31 × 10³)6.12 × 10⁵ (4.99 × 10⁵)0.0050715
UDP-N-acetylglucosamine1.52 × 103 (1.03 × 10³)1.09 × 10⁵ (6.45 × 10⁴)0.013976
NAD2.24 × 102 (1.64 × 10²)1.19 × 10⁴ (7.07 × 10³)0.023292
UMP3.69 × 104 (7.16 × 10³)3.87 × 10⁵ (1.67 × 10⁵)0.094823
GMP2.17 × 104 (5.49 × 10³)1.38 × 10⁵ (6.40 × 10⁴)0.1514
dTMP2.46 × 104 (2.09 × 10³)9.26 × 10⁴ (3.17 × 10⁴)0.29886
N-Acetylglucosamine 1/6-phosphate2.06 × 104 (1.93 × 10⁴)4.35 × 10³ (3.02 × 10³)2.8714
IDP2.41 × 105 (1.26 × 10⁵)5.65 × 10⁵ (2.83 × 10⁵)0.35639
Guanosine4.20 × 104 (3.29 × 10³)1.29 × 10⁵ (4.69 × 10⁴)0.36182
Fructose 1,6-bisphosphate1.23 × 105 (4.62 × 10⁴)3.55 × 10⁵ (1.46 × 10⁵)0.37308
cAMP9.52 × 102 (3.60 × 10²)2.66 × 10³ (2.35 × 10³)0.38656
Kynurenic acid6.59 × 104 (1.34 × 10⁴)1.32 × 10⁵ (1.89 × 10⁴)0.47088
Glutathione6.30 × 103 (2.24 × 10³)4.05 × 10³ (1.88 × 10³)2.1148
1 Mean (SEM).
Table 6. Correlations of rumen fluid metabolites and bacteria.
TaxonMetabolitep 1p-Value 2
p-75-a52-Oxoisovalerate−0.540.04
3-Phosphoglycerate−0.530.04
Creatinine−0.73<0.01
Cytidine−0.610.01
Glutamine−074<0.01
IMP−0.630.01
N-acetylornithine−0.640.01
Pimelic acid−0.560.03
Valine−0.520.05
Lachnospiraceae (Other)2-Oxoisovalerate0.71<0.01
3-Phosphoglycerate0.550.03
Arginine0.550.03
Creatinine0.520.05
Cysteine0.590.02
Cytidine0.560.03
Glutamine0.590.02
Phosphorylethanolamine0.560.03
Taurine0.69<0.01
UMP0.520.05
Corynebacterium2-Oxoisovalerate−0.66<0.01
3-Phosphoglycerate−0.530.04
Citrate−0.550.03
Phosphorylethanolamine−0.600.02
Succinate/Methylmalonate−0.540.04
Taurine−0.74<0.01
NeisseriaceaeCreatine0.71<0.01
Cysteine−0.78<0.001
Dihydroorotate−0.560.03
FMN−0.530.04
Glycodeoxycholate0.530.04
Hydroxyproline−0.530.04
Nicotinate−0.580.02
Phosphorylethanolamine0.550.03
Taurodeoxycholate0.520.05
UMP0.590.02
Xylose−0.560.03
Shuttleworthia2,3-Dihydroxybenzoate−0.570.03
2-Oxo-4-methylthiobutanoate0.530.04
2-Oxoisovalerate0.590.02
Asparagine0.580.02
Taurine0.66<0.01
UDP0.590.02
Desulfobulbaceae2-Dehydro-D-gluconate−0.570.03
Cysteine−0.550.04
Deoxyuridine−0.560.03
FMN−0.64<0.01
Histidine−0.550.04
Hydroxyproline−0.600.02
Methionine−0.620.01
Methionine sulfoxide−0.530.04
N-carbamoyl-L-aspartate−0.530.04
Nicotinate−0.590.02
Tyrosine−0.620.01
Uracil−0.530.04
Xylose−0.560.03
L7A-E11Succinate/Methylmalonate−0.72<0.01
Taurine−0.590.02
UDP-N-acetylglucosamine−0.76<0.01
UMP−0.66<0.01
1 Spearman’s rank correlation test statistic. 2 Significance determined at p < 0.05.
Publisher’s Note: MDPI stays neutral with regard to jurisdictional claims in published maps and institutional affiliations.

