Article

Physiological and Behavioral Reactions of Simmental Dairy Cows to Increasing Heat Load on Pasture

1
Institute for Agricultural Engineering and Animal Husbandry, Bavarian State Research Center, Vöttingerstr. 36, 85354 Freising, Germany
2
Chair of Animal Welfare, Ethology, Animal Hygiene and Animal Husbandry, Department of Veterinary Sciences, Faculty of Veterinary Medicine, Ludwig-Maximilians-University Munich, Veterinärstr. 13/R, 80539 Munich, Germany
*
Author to whom correspondence should be addressed.
Ruminants 2022, 2(2), 157-172; https://doi.org/10.3390/ruminants2020010
Submission received: 16 December 2021 / Revised: 27 March 2022 / Accepted: 28 March 2022 / Published: 31 March 2022
(This article belongs to the Special Issue Feature Papers of Ruminants 2021-2022)

Abstract

:
Climate change is accompanied by temperatures exceeding the thermal comfort zone of dairy cows, resulting in numerous consequences for production and welfare. Early detection of heat load enables taking countermeasures and can be realized using monitoring systems. We aimed at investigating heat load-induced changes in the behavior and physiology of grazing Simmental cows. Data were collected on five (round 1; r1) and eight (round 2; r2) consecutive days on a dairy farm combining a freestall barn with permanent access to pasture. Weather data, respiration rate, milk yield, milk composition, and fecal cortisol of eleven (r1) and thirteen (r2) cows were collected. The behavior of five animals was recorded with collar-based monitoring systems. Previously reported thresholds of different weather indices were exceeded on two days in r1 and on four days in r2. Under heat load, respiration rate and somatic cell count increased. Fecal cortisol did not change in r1 but increased steadily in r2. Grazing time decreased in r1. Rumination mainly occurred at night in both rounds, and its synchrony decreased in r2. Although limited by sample size, our results give a first impression on heat load induced physiological and behavioral reactions of Simmental dairy cows on pasture.

1. Introduction

The upper critical value of the thermal comfort zone of dairy cows is defined at 16 to 18 °C [1,2]. With global warming, the number of days with temperatures above these thresholds increases [3]. Therefore, heat load is highly relevant for dairy industry regarding economic losses [4] and animal welfare [5]. Heat load has numerous consequences, including a reduction in milk yield [6] and conception rate [7], as well as an increased risk for diseases, such as ruminal acidosis [8], mastitis [9], and hoof disorders [10].
Various heat load indices, based on the Temperature Humidity Index (THI) developed by Thom [11] for humans, were established in order to define heat load in dairy cows. In contrast to the THI, which only includes the influence of dry-bulb temperature (DBT) and relative humidity (RH), the Black Globe Humidity Index (BGHI) also considers wind speed (WS) and solar radiation (RAD) by including the black globe temperature (BGT). Compared to THI, the BGHI better reflects the effects of heat load on grazing dairy cattle [12]. Various thresholds were defined for the indices based on different physiological parameters in order to classify heat load in dairy cows [1,2].
Heat load prediction based on environmental factors is limited, as the beginning of burdening weather conditions highly depends on various animal-related factors, including breed [6], coat color [13], coat thickness [14], body weight [15], parity [16], lactation stage [17], milk yield [18,19], gestation period [20], and acclimatization [21].
Heat-burdened dairy cows show physiological and behavioral reactions that aim at decreasing heat production, while increasing heat dissipation. If adaptation is insufficient, body temperature rises [22], and the burdening situation results in the activation of the hypothalamus-hypophysis-adrenal axis, which leads to an increased plasma level of cortisol [23]. Physiological reactions include a rise in respiration, heart, and sweating rates [13,24,25]. Behavioral changes involve an increase in standing time at the expense of lying [26], a rise in drinking time [25], and a reduction in feeding and grazing time [27,28], as well as rumination time [17]. Physiological and behavioral reactions to heat load can be allocated to the three constructs of animal welfare defined by Fraser et al. [29] and modified by Keyserlingk et al. [30], biological functioning and health, affective state, and natural living [5], underlining the relevance of heat load and its abatement regarding the welfare of dairy cows.
Changes in behavior can be automatically detected with monitoring systems. The application of technical solutions gathering animal-related data with sensors for improving animal management is part of Precision Livestock Farming (PLF) [31]. The behaviors regarded for the examination of heat load include lying and standing [21,32], grazing [33], and ruminating [17,33]. Additionally, combinations of physiological, productional, and behavioral reactions are used [34]. Countermeasures can be taken timely and are more effective when heat load is detected early. Measurements include the use of fans and sprinklers [35], misters [36], or chilled lying stalls [37]. On pasture, dairy cows benefit from shaded areas [38]. Additionally, management can be altered to mitigate heat load, including the shift of feeding and grazing times to the evening or nighttime [39,40].
Most of the studies conducted on heat load in dairy cows, focus on the reactions of high-yielding Holstein cows; pasture-related behaviors are rarely investigated [41]. Therefore, the goal of our study was to assess the behavioral and physiological responses of dual-purpose Simmental cows on pasture to increasing heat load.

2. Materials and Methods

All conducted procedures of the study were approved by the ethics committee from the Faculty of Veterinary Medicine of Ludwig-Maximilians-University Munich (protocol no.: 231-08-08-2020) and were in accordance with EU directive 2010/63/EU and the German Animal Welfare Act.

2.1. Farm Management and Animals

The experiment was undertaken in 2020 on a conventional dairy farm in Bavaria, Germany, and was conducted in two rounds of five days in June (r1) and eight days in August (r2). The herd consisted of 52 dairy cows (94% Simmental, 4% German Black Pied, 2% German Red Pied) with a main milk yield of 8496 kg in the preceding year. The cows had permanent access to pasture (14 ha) as well as to a free stall barn with high cubicles (n = 48) equipped with rubber mattresses. The pasture was managed continuously, with the same area being available to the cows at all times. Access to pasture was granted all days long from April to October, excluding 2 h around each milking (6:00–8:00 h and 18:00–20:00 h). The cows were milked twice daily in a tandem milking parlor, approximately starting at 06:30 h and 18:30 h. Forage was supplied by pasture, exclusively. Feed lime was offered on the feeding table in the barn two times a day before milking. Several mineral lick stones were available on the feeding table, too. Cows yielding ≥ 35 kg/d received concentrate from a transponder-controlled computerized feeder. Water was supplied ad libitum via two troughs in the barn and nine troughs on pasture.
Eleven (r1) and thirteen (r2) lactating cows were randomly selected from the herd based on the following criteria: second to fifth lactation, lactating (not dried off), freedom from lameness, changes in milk composition, and any other signs of health disorders. Some animals were selected in both rounds, and some were unique to each round. In the first round, average parity of the chosen cows (n = 11) was 3.6 ± 1.3 (mean ± standard deviation), and the animals were 205 ± 51 days in milk (DIM; range: 122–304 DIM) on the first day of the round. In the second round, average parity of the chosen cows (n = 13) was 3.5 ± 1.3 and the animals were 258 ± 34 DIM (range: 193–299 DIM). Mean milk yield was 19.1 ± 7.0 kg (range: 6.6–26.7 kg) in r1 and 18.9 ± 4.4 kg (range: 11.2–28.3 kg) in r2. Due to technical issues of the monitoring systems, behavior data from only five animals per round was available. Average parity of the cows of which behavior data was recorded (n = 5) was 3.2 ± 1.2 in the first round and 4.4 ± 1.1 in the second round. The animals were 194 ± 42 and 243 ± 34 DIM on the first day of each round, respectively. Mean milk yield was 20.8 ± 5.5 kg (range: 15.5–26.7 kg) in r1 and 19.8 ± 3.8 kg (range: 13.5–28.3 kg) in r2.

2.2. Data Collection and Sampling

Data were collected on five (r1) and eight (r2) consecutive days (d). On d0, measurement technologies (as described in the following) were installed, and data collection started, with d1 marking the first day with 24 h of data. In r1, data collection began with morning milking; in r2, data collection started with evening milking. On d4 (r1) and d7 (r2), data collection was ended by removing the technologies.

2.2.1. Weather Conditions

A weather station was built and set up on a part of the pasture that was fenced off. Data on DBT (°C), RH (%) and WS (m/s) were collected every ten minutes by a weather transmitter (WXT510; Vaisala Oyj, Helsinki, Finland). RAD (W/m2) was measured every ten minutes by a pyranometer (CM11; OTT HydroMet B.V., Delft, The Netherlands). Hourly means were computed for every measurement from the weather station used to calculate the THI (1) according to the National Research Council [42] and the BGHI (2) according to Buffington et al. [12] for the data from the weather station using the following equations with DBT (°C), RH (%), BGT (°C), dew point temperature (DPT; °C), WS (m/s), and RAD (W/m2):
THI = ( 1.8 × DBT + 32 ) ( 0.55 0.0055 × RH ) × ( 1.8 × DBT 26 )
BGHI = BGT + 0.36 × DPT + 41.5
As only DBT was collected, BGT (3) and DPT (4) were calculated with the formulas proposed by Hajizadeh et al. [43] and Lawrence [44], respectively:
BGT = 0.01498 × RAD + 1.184 × DBT 0.0789 × RH 2.739
DPT = DBT ( 100 RH 5 )
Weather data collection started on d0 and ended on d4 in r1 and started on d0 and ended on d7 in r2. From the hourly means, the average per 6 h period (06:00–12:00, 12:00–18:00, 18:00–24:00 and 00:00–06:00 h) as well as for 24 h (06:00–06:00 h) was calculated.

2.2.2. Behavior Data (Monitoring System)

On d0, the selected animals were equipped with the prototype of a monitoring system (133 × 63 × 35 mm; 220 g; Blaupunkt Telematics GmbH, Hildesheim, Germany) attached to a collar. The same prototype was previously used in the studies of Schmeling et al. [45,46]. The system contained a sensor board (BNO055; Bosch Sensortec GmbH, Reutlingen, Germany) consisting of a 3D accelerometer, a 3D magnetometer, and a 3D gyroscope. The sensor was set to measure the raw acceleration (m/s) in three axes as well as the Euler angle (°) with a frequency of 10 Hz. Power was supplied by two lithium batteries. The batteries were changed once during each round (r1: d2, r2: d3). Data were stored on a Secure Digital Memory Card (SanDisk 32 GB; Western Digital Deutschland GmbH, Aschheim, Germany) and downloaded after each round. Following the experiment, two binary models were applied to the sensor data in order to predict different behaviors from the movement of the animals’ neck and head. Both models were based on a random forest algorithm. One model was used for the distinction of grazing and non-grazing and one for the distinction of ruminating and non-ruminating. The models were previously validated in combination with the same monitoring system prototype. The model for grazing behavior achieved an accuracy of 92% [46]. The ruminating model predicted rumination behavior with an accuracy of 98% on pasture and 97% in the barn [45].

2.2.3. Milk Yield and Milk Composition

Milk yield was automatically recorded with a milk meter integrated into the milking parlor at each milking. Daily milk yield was calculated as the sum of milk yield at morning and evening milking. Milk yield was recorded on five days (d0 to d4) in r1, and seven days (d1 to d7) in r2. During five (d0 to d4) and four (d2 to d5) morning milking in r1 and r2, respectively, a container was attached at a predesigned position in the milk pipe at each milking station, and a representative amount of milk was automatically separated into the container. From the container, a sample was taken and inserted into a sample tube containing the preserving agent Azidiol. Milk samples were cooled immediately and sent to the Milchprüfring Bayern e. V. (Wolnzach, Germany). Milk samples were analyzed for fat and protein content using infrared spectroscopy. To assess somatic cell count, a flow cytometry was performed. Analysis procedures were chosen according to the RohMilchGütV from the German Federal Ministry of Food and Agriculture [47]. Starting milk sampling on d2 in r2 instead of d0 as in r1 aimed at regarding a delay of two days in changes in milk composition caused by heat load [2].

2.2.4. Respiration Rate

Respiration rate was recorded during morning milking in the milking parlor (r1: d1 to d4; r2: d2, d4, d5) and in the afternoon on pasture or in the stable (14:00 to 17:00 h; r1: d0 to d4; r2: d1 to d4) by a trained observer. Flank movements were counted for 30 s, and the value was multiplied by two to receive respiration rate per minute, as conducted by Abeni et al. [48]. If the respiration rate of one animal was recorded more than once within the afternoon, the average was calculated. Respiration rate was only recorded while animals were lying (±ruminating) or standing (±ruminating). When animals were performing other behaviors (walking, grazing, social, or grooming behavior), the count was postponed.

2.2.5. Fecal Cortisol

A fresh fecal sample was taken from the selected cows every second day (r1: d0, d2, d4; r2: d3, d5, d7) after morning milking between 08:30 h and 09:00 h to determine the concentration of the cortisol metabolite 11,17-Dioxoandrostane (11,17 DOA). About 10 to 15 g were collected manually from the rectum or from freshly eliminated feces and filled into fecal sample tubes (17 mL; Dieckhoff and Ratschow Praxisdienst GmbH & Co. KG, Longuich, Germany). Samples were stored on ice immediately after collection and frozen to −18 °C within two hours. Sampling time was chosen because fecal cortisol level rises with a time delay of about 9 to 12 h after stressors occur and remains elevated for 18 to 44 h [49,50,51]. Cortisol metabolite content in the morning reflects the accumulated stress level from the preceding day [52]. After the experiment, the samples were processed at the laboratory of the Chair of Animal Welfare, Ethology, Animal Hygiene and Animal Husbandry of LMU Munich, Germany. After thawing and homogenization of the samples, 0.5 g were mixed with 1 mL of water and 4 mL of ethanol (80%) following Palme and Möstl [53]. The dispersion was centrifuged, and the supernatant was frozen at −18 °C and sent to the laboratory of the Institute for Medical Biochemistry of Vetmeduni Vienna, Austria, where the concentration of 11,17-DOA was determined using an 11-oxoetiocholanolone Enzyme Immunoassay previously validated for cattle [50].

2.3. Statistical Analysis

Data were assessed comparing different time periods. A day reflects the time from 6:00 h to 6:00 h the next day. Daytime considers the behavior from 6:00 to 18:00 h, while nighttime represents the time from 18:00 to 6:00 h the next day. For behavior data, a loss of 10% per considered time interval was tolerated according to Elischer et al. [54]. Due to technical issues of the monitoring systems, the data from only five animals per round could be used to evaluate the behavior under increasing heat load. Only days with a total of 24 h were considered in the comparison of behavior, which was true for d1 to d3 in r1 and d1 to d4 in r2.
All statistical analyses were conducted with RStudio 1.3 (RStudio, Inc., Boston, MA, USA). Additional packages used were pgirmess [55] and DescTools [56]. Differences in respiration rate on pasture and in the stable were assessed with a two-sided t-test. A Friedman test with post hoc multiple comparison was used to compare the respiration rate, milk yield, milk composition, somatic cell count, and fecal cortisol content between the different days for all observed cows. The difference between the change in fecal cortisol content was assessed with a t-test for paired samples in r1 and—due to lack of normal distribution—with a Wilcoxon test in r2. For the comparison of grazing and rumination behavior from five animals between the different days for 24 h, as well as for day and night, a Friedman test with post hoc multiple comparison was used as well. General differences between night and day rumination and grazing time were assessed with a two-sided t-test. Due to a lack of normal distribution, the differences per day between night and day rumination and grazing time were investigated with a Wilcoxon test. Following Crump et al. [57], Fleiss’ Kappa coefficient of agreement (κF) was used to calculate synchrony for the different behaviors during the day and during daytime and nighttime. Fleiss’ Kappa is a test for the interrater reliability of more than two raters [58]. In our calculation, cows were considered raters, and the agreement (=synchrony) within the five cows for each behavior was calculated per hour. Within one hour, a behavior was considered to be shown when more than 50% of the time, equaling > 0.5 h, was spent on the behavior. κF was classified as <0 = poor, 0–0.2 = slight, 0.21–0.4 = fair, 0.41–0.6 = moderate, 0.61–0.8 = substantial, and 0.81–1 = almost perfect, according to Landis and Koch [59]. Where applicable, values were considered significant at p < 0.05 and highly significant at p < 0.01.

3. Results

3.1. Weather Data

The mean values for DBT, RH, RAD, and WS and the different weather indices (THI, BGHI) per 6 h period and per day are depicted in Table 1 for r1 and Table 2 for r2. In both rounds, highest DBT, RAD, and index values within each day were observed in the period between 12:00 and 18:00 h on most days. On d5 in r2, however, highest mean values occurred from 06:00 to 12:00 h. On all days, RH was higher and wind speed was lower during the night than during the day. In r1, highest daily average DBT and RAD combined with high RH were observed on d4, resulting in the highest index values on that day compared to the other days within r1. In r2, highest daily average DBT, RAD and index, values were observed on d4. Highest RH occurred on d5, and lowest WS was recorded on d1.

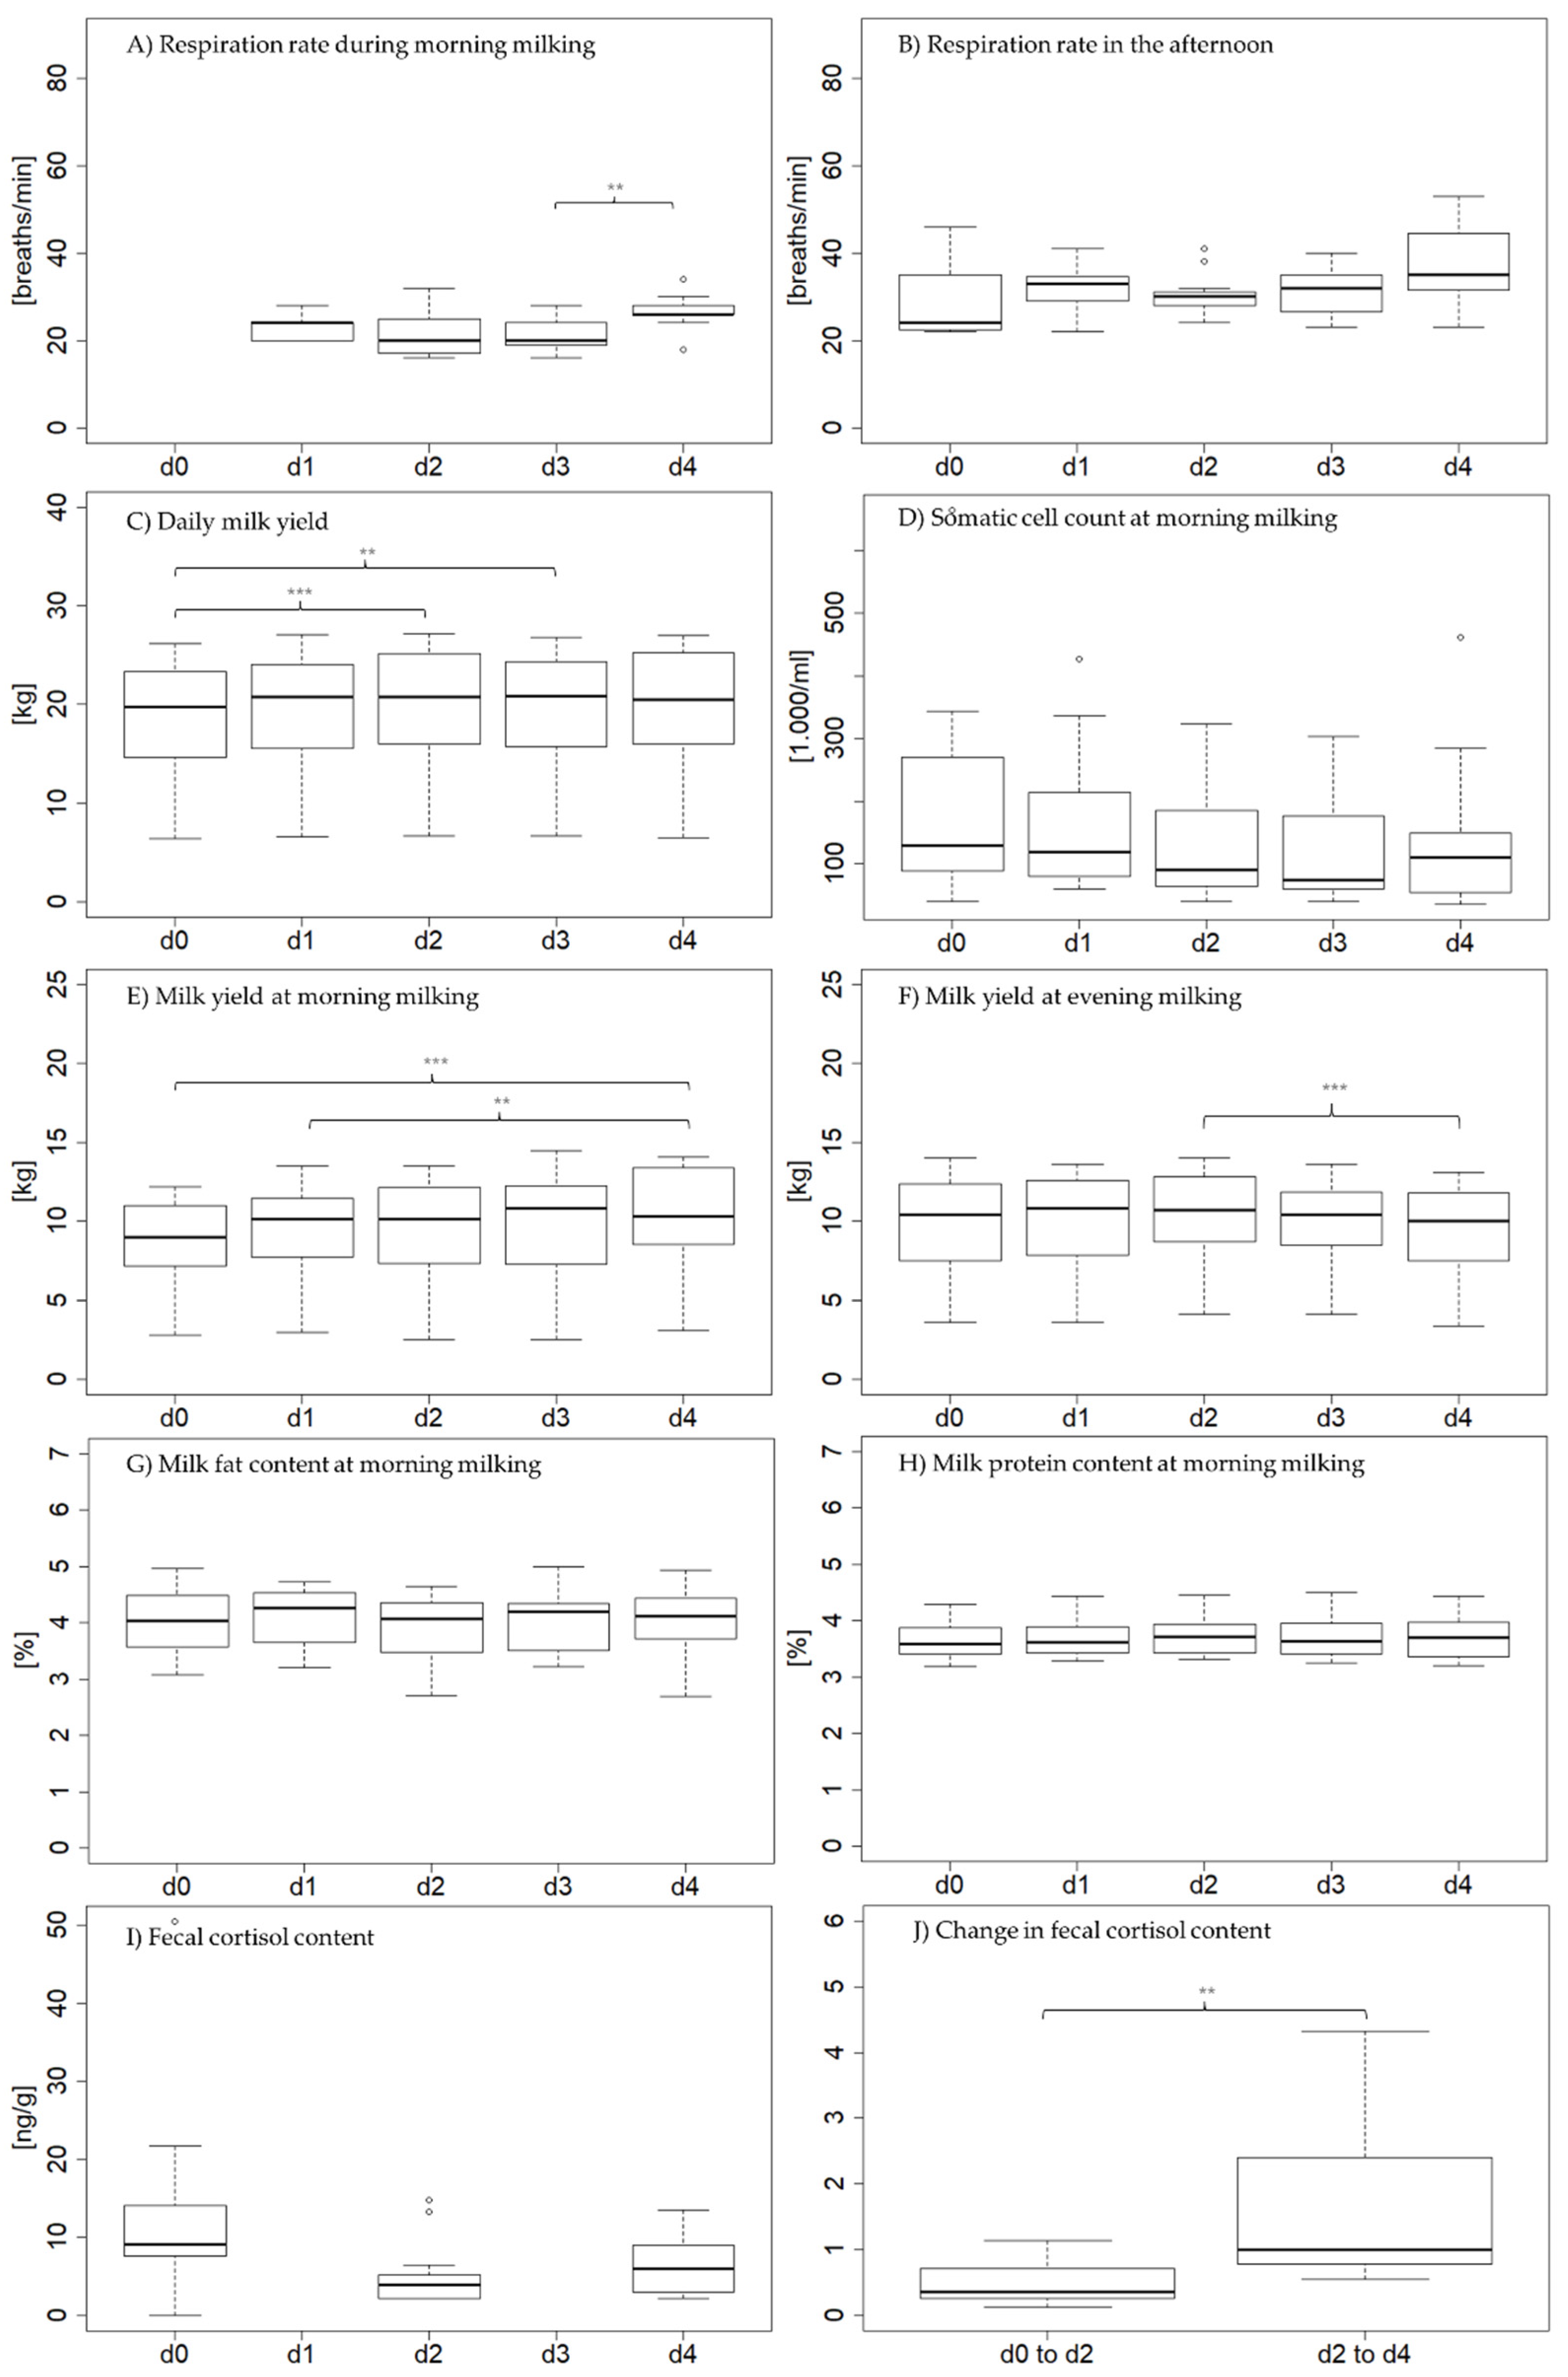
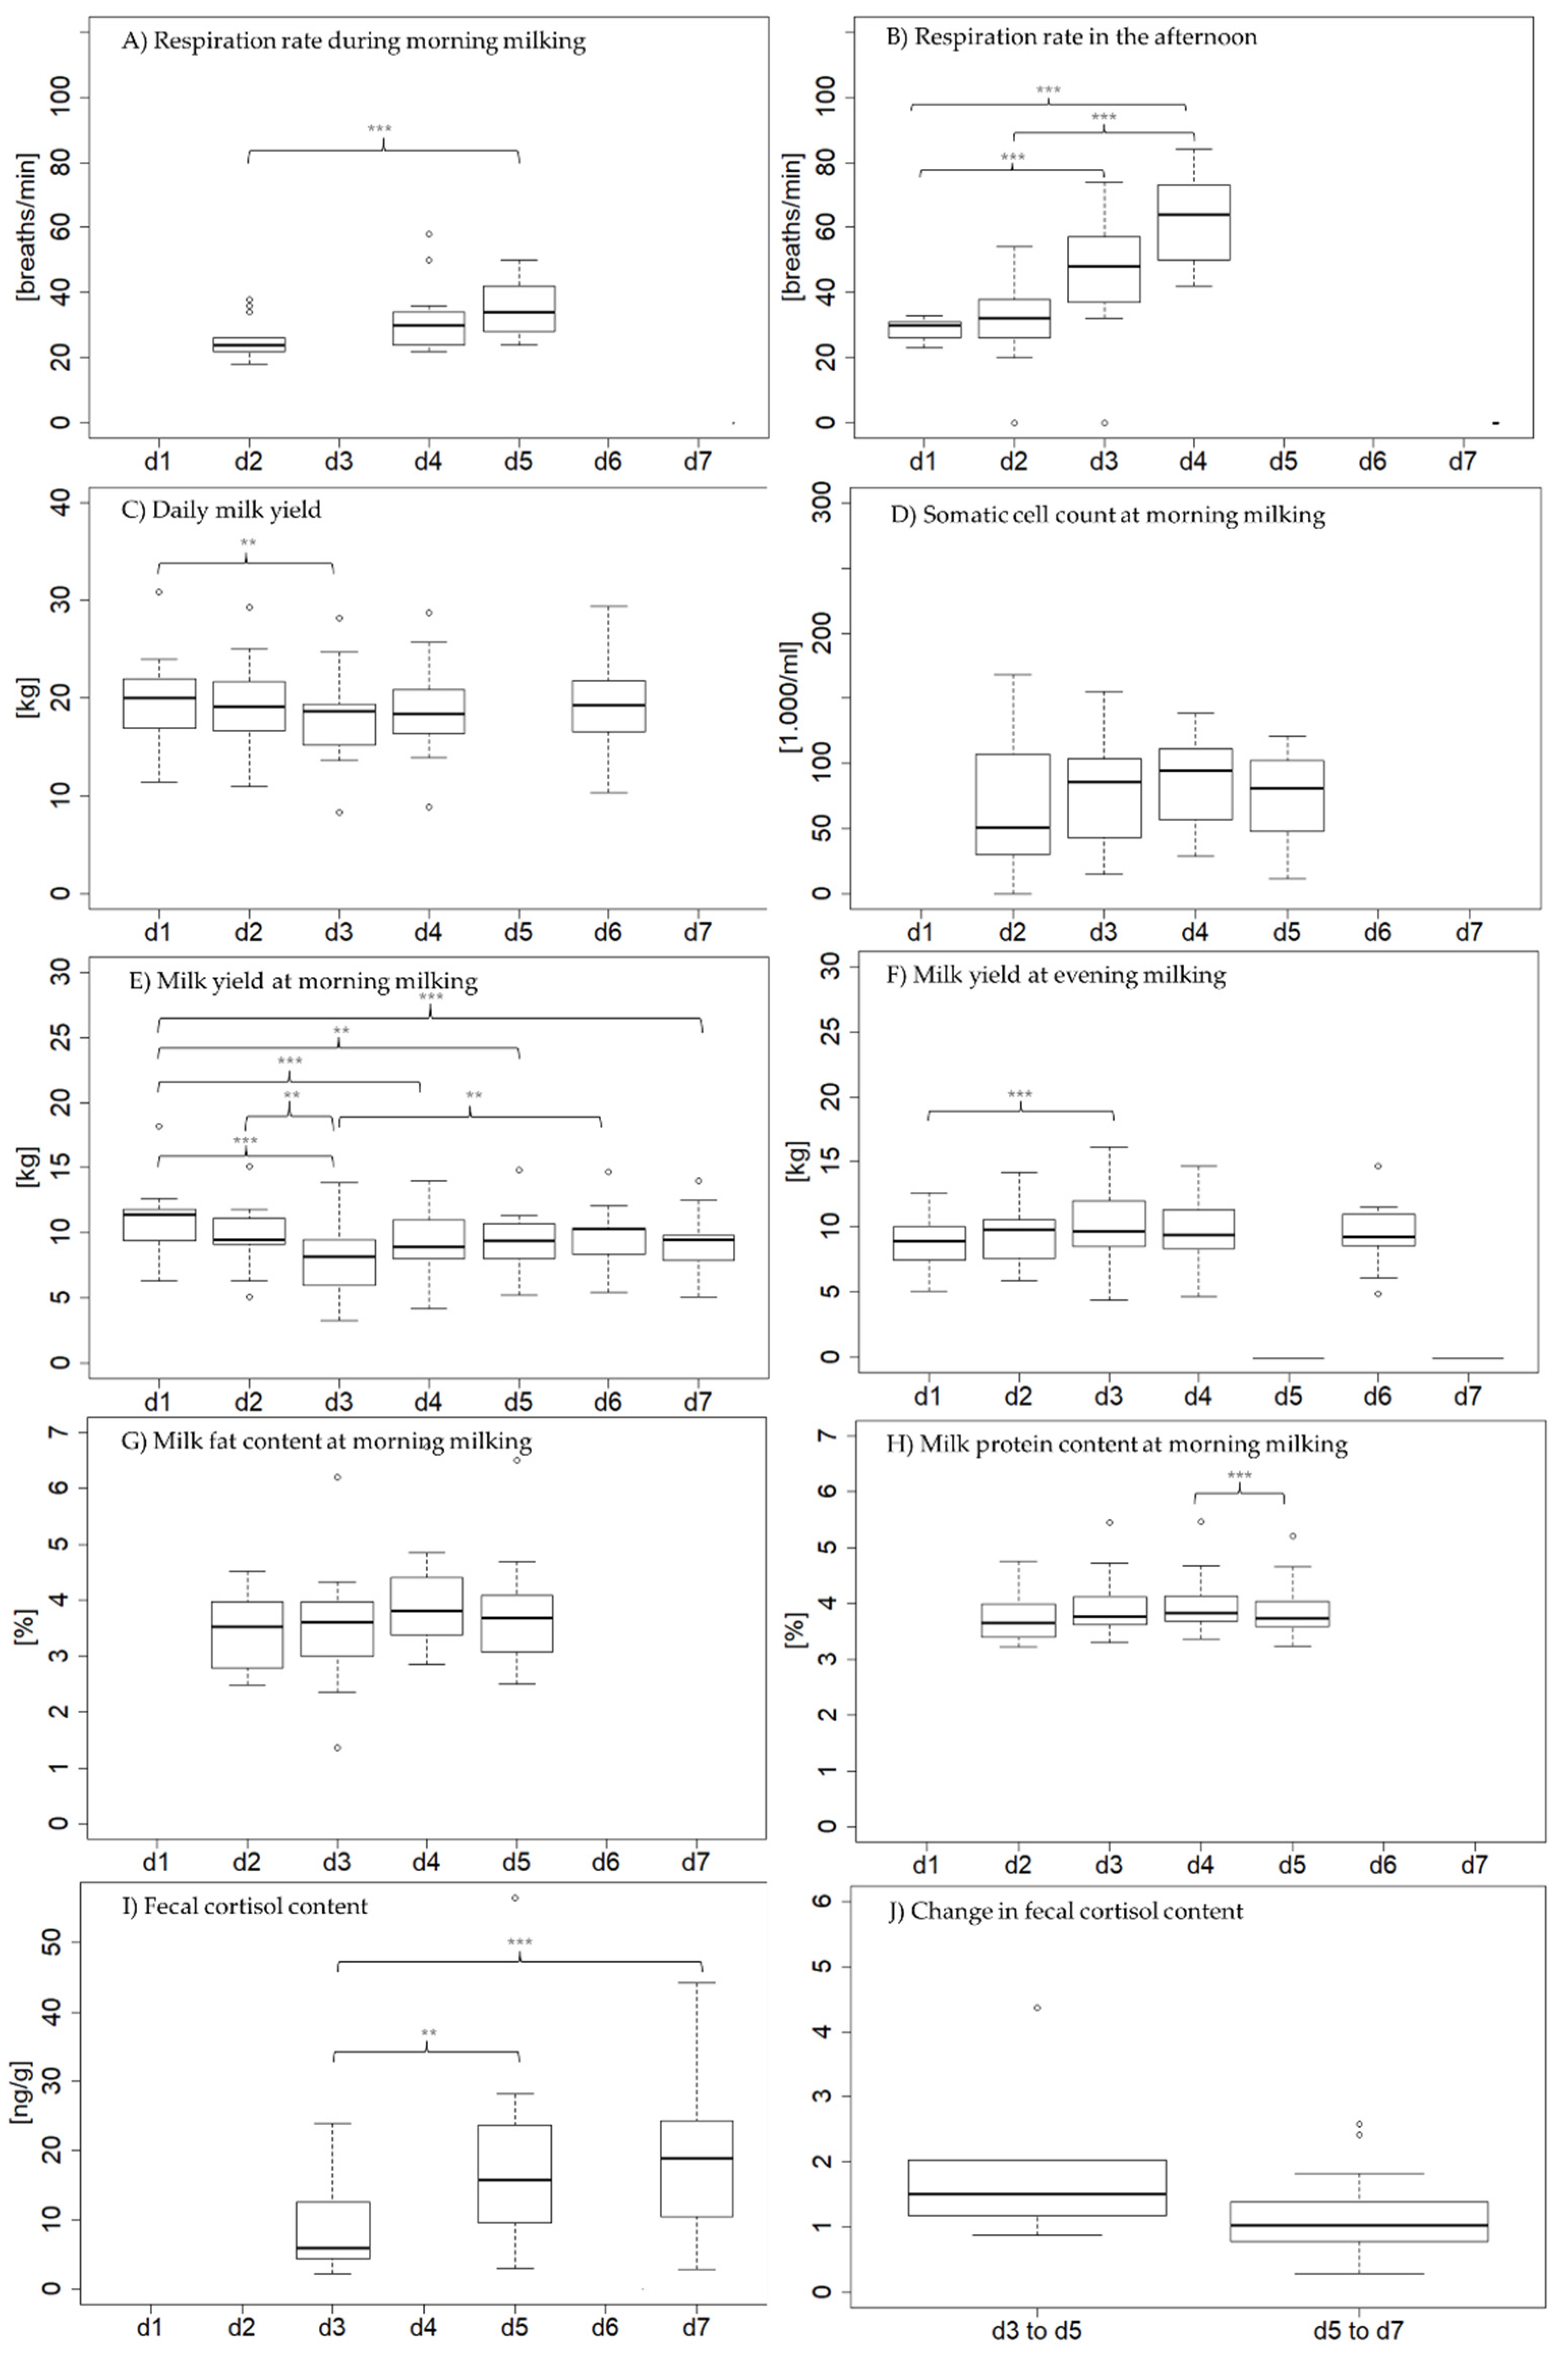
3.2. Physiological Parameters

The development of respiration rate, milk yield, milk composition, and fecal cortisol content is depicted in Figure 1 for r1 and in Figure 2 for r2. No significant difference was found between respiration rate recorded in the stable or on pasture (p = 0.17).
In r1, respiration rate of the observed animals (n = 11) during morning milking increased significantly between d3 and d4 (21 vs. 27 breaths/minute; p < 0.05). Respiration rate in the afternoon was statistically similar (p = 0.13) but increased numerically on d4. Milk yield was significantly lower on d0 than on d2 (18.3 vs. 19.5 kg; p < 0.01) and d3 (18.3 vs. 19.2 kg; p < 0.05). Milk yield in the morning was higher on d4 than on d0 (10.2 vs. 8.7 kg; p < 0.01) and d1 (10.2 vs. 9.2 kg; p < 0.05). At evening milking, it was significantly lower on d4 than on d2 (9.2 vs. 10.2 kg; p < 0.01). No significant difference was observed for somatic cell count (p = 0.12), but on d4, the count was numerically higher. Milk fat and protein content were similar on all days (p = 0.32 and p = 0.06, respectively). Fecal cortisol did not differ statistically (p = 0.06), but a wider range was observed on d0 and the change in fecal cortisol content from d2 to d4 was significantly greater than from d0 to d2 (1.7 vs. 0.5; p < 0.05).
In r2, respiration rate of the observed animals (n = 13) during morning milking increased between d2 and d5 (26 vs. 32 breaths/minute; p < 0.01). In the afternoon, respiration rate increased significantly from d1 to d4 (28 vs. 62 breaths/minute; p < 0.01). Daily milk yield was significantly lower on d3 than on d1 (18.4 vs. 19.6 kg; p < 0.05). Morning milk yield decreased significantly from d1 to d5 (10.9 vs. 9.3 kg; p < 0.01), increased to d6, but stayed low until d7, whereas evening milk yield was higher on d3 than on d1 (10.4 vs. 9.0 kg; p < 0.01) and decreased non-significantly afterwards. Somatic cell count and milk fat content were similar between the different days (p = 0.43 and p = 0.37, respectively). Milk protein decreased significantly between d4 and d5 (3.90 vs. 3.81%; p < 0.01). Fecal cortisol increased from d3 to d5 to d7 with significant differences between d3 and d5 (8.5 vs. 17.9 ng/g; p < 0.05) and d3 and d7 (8.5 vs. 18.4 ng/g; p < 0.01). The change in fecal cortisol from d3 to d5 and from d5 to d7 did not differ significantly (p = 0.20).

3.3. Grazing Behavior

In r1, animals (n = 5) grazed for a mean of 8.2 (±0.6) h per 24 h period. Grazing time decreased significantly between d1 and d2 (8.9 vs. 7.8 h/d; p < 0.01; see Table 3). Between d2 and d3, grazing time increased numerically, but it was not statistically significant (7.8 vs. 7.9 h/d; p > 0.05). The same differences between the days were evident when considering daytime grazing (4.9 vs. 3.9 vs. 4.1 h/12h; p < 0.05), but no difference was found between nighttime grazing between days. In general, significantly more grazing time occurred during the day than during the night (p < 0.05), but within each day, the difference could not be confirmed statistically. On d2, the same time was spent grazing during the day and during the night (3.9 h/12 h). Overall κF for grazing was 0.66, which indicates a substantial agreement between animals (=synchrony). Synchrony on d1 and d3 was similar (0.63 vs. 0.62) but was higher on d2 (0.73; see Table 4). In general, synchrony was slightly lower during the day than during the night (0.63 vs. 0.69). This was true for d1 (0.59 vs. 0.67) and d2 (0.67 vs. 0.79), but not for d3 (0.63 vs. 0.61).
In r2, animals grazed for a mean of 6.8 (±0.8) h per 24 h period. Grazing time did not differ significantly between the days (p = 0.15; see Table 3). However, when considering daytime and nighttime separately, d2 and d4 differed significantly, with more grazing time being shown on d2 during the day (4.6 vs. 2.9 h/12 h; p < 0.01) and on d4 during the night (2.2 vs. 3.5 h/12 h; p < 0.01). In general, significantly more grazing time occurred during the day (p < 0.01), but on d4, nighttime grazing time was higher than grazing time during the day (3.5 vs. 2.9 h/12 h). Overall κF for grazing was 0.68, which indicates a substantial agreement between animals (=synchrony). Although on d1 and d4, synchrony was substantial (0.71 and 0.73, respectively), it was only moderate on d2 and d3 (0.59 both; see Table 4). In general, synchrony was lower during the day than during the night (0.64 vs. 0.72). This was evident on d1 (0.60 vs. 0.80), d3 (0.56 vs. 0.62), and d4 (0.50 vs. 0.92) but not on d2 (0.82 vs. 0.41).

3.4. Ruminating Behavior

In r1, animals (n = 5) ruminated for a mean of 7.0 (±0.5) h per 24 h period. Rumination time did not differ significantly between the days (p > 0.05; see Table 3). In general, significantly more ruminating occurred during the night than during the day (p < 0.01), but within each day, the difference could not be confirmed statistically. Differences between the different days were not evident when daytime and nighttime rumination time was assessed separately. Overall κF for ruminating behavior was 0.35, which indicates fair agreement (=synchrony) between animals. Synchrony increased from d1 (0.30) to d2 (0.32) and was highest on d3 (0.43; see Table 4). In general, synchrony was higher during the night than during the day (0.23 vs. 0.39) which was evident for all days.
In r2, animals ruminated for a mean of 7.5 (± 0.3) h per 24 h period. Rumination time per day did not differ significantly between the different days (p > 0.05; see Table 3). In general, significantly more ruminating occurred during the night than during the day (p < 0.01). Ruminating time during the day differed significantly between d2 and d4 (2.3 vs. 3.6 h/12 h; p < 0.01) and ruminating time during the night differed significantly between d1 and d2 (4.1 vs. 5.2 h/12 h; p < 0.05). Overall κF for ruminating was 0.38, which indicates fair agreement (=synchrony). Between the days, synchrony decreased steadily from 0.45 on d1 to 0.27 on d4 (see Table 4). In general, synchrony of rumination behavior was similar during the day and during the night (0.32 vs. 0.36). However, within each day, synchrony was higher during the night on d1 (0.28 vs. 0.52) and d2 (0.11 vs. 0.40) and higher during the day on d3 (0.41 vs. 0.34) and d4 (0.34 vs. 0.18).

4. Discussion

4.1. Physiological Responses in Relation to Weather Conditions

In previous studies, different thresholds were defined for the various weather indices depending on the regarded physiological reaction. In r1, the daily THI and BGHI means did not reach the thresholds of 67 and 74 determined by Zimbelman et al. [61] and Dalcin et al. [62], respectively, for the elevation of respiration rate. However, respiration rate increased significantly during morning milking and numerically in the afternoon, between d3 and d4 when THI increased from 65 to 67 and BGHI from 62 to 65. Kibler [63] stated that respiration rate elevation is the first reaction towards heat load shown by dairy cows, which is in line with our findings. Previously determined thresholds for changes in milk yield vary widely. Although the THI thresholds of 60 to 62 defined by by Brügemann [2], Hammami et al. [1] and Gorniak et al. [64] for changes in milk yield and milk composition in Holstein cows were reached on all days except for d2, no reduction in milk yield with rising intensity of weather conditions or change in milk fat or protein was observed in r1 in our study. The reduced milk yield on d0 might have been caused by the presence of an unknown person during milking. This is supported by the reduction in milk yield being mainly based on a reduction in morning milk yield, whereas evening milk yield was not reduced. Concerning the reduction in milk yield caused by high temperatures, Brügemann [2] found that changes in milk yield and milk composition under heat load occur with a time delay of two days. Therefore, the changes in our study might have occurred after the observed period. On the other hand, Gantner [65] defined a THI threshold of 77 for a reduction in milk yield in Simmental cows. That threshold was not reached in r1 in our study. Although a certain reaction towards heat load was shown by an elevated respiration rate, burden of the weather conditions was not confirmed by a rise in fecal cortisol level in r1. Heat dissipation through breathing air might have prevented the animals from experiencing a burden caused by the observed weather conditions.
In contrast to r1, heat load was confirmed by elevated fecal cortisol content, which could be based on the more extreme and longer excess of heat load thresholds in r2. Although temperatures decreased after d5, heat load seemed to persist, reflected by a persisting high level of fecal cortisol on d7. R1 of data collection was conducted in June, after two months of pasture season, whereas r2 took place in August, when cows had already been outside for four months. On the one hand, physiological reactions towards heat load can be expected to be more pronounced at the beginning summer, when animals are not acclimatized to higher temperatures yet [66]. On the other hand, heat load can accumulate leading to more extreme reactions to high temperatures at the end of summer [21]. The observed group of cows (r1: n = 11, r2: n = 13) differed between rounds, and some cows were unique to one round. Although focal cows had higher DIM in r2 (194 vs. 243), average milk yield did not differ (19.1 vs. 18.9 kg). Milk yield influences the sensitivity of dairy cows to heat load [18]. The similar milk yield results in the same thresholds for respiration rate elevation
In r2, a significant rise in respiration rate was observed between d2 and d3 when THI changed from 63 to 69 and BGHI from 63 to 69. The change is in line with the THI threshold for respiration rate elevation of 67 defined by Zimbelman et al. [61] but occurred at lower BGHI values than expected after the findings of Dalcin et al. [62]. In contrast to r1, milk yield was reduced on d3 and stayed low until d7 in r2. The decrease in milk yield was mainly based on a reduction in morning milk yield and was partly compensated by an elevated evening milk yield. On d3, THI reached a daily mean of 68 and BGHI a mean of 69. Observed THI threshold for change in milk yield is in line with the findings of Zimbelman et al. [61], higher than the thresholds determined by Hammami et al. [1] for Holstein cows in the stable, by Brügemann [2] for Holstein cows on pasture and lower than the threshold determined by Gantner [65] for Simmental cows in the stable. If a delay of two days for the heat load induced change in milk yield is considered, as proposed by Brügemann [2], we observed the same threshold of 62, as determined in the mentioned study. Milk composition did not differ between the days in r2. Unlike r1, a longer time period was covered after the days with increased heat load intensity. The lack of change in milk composition might have been prevented by a reduction in milk yield in general.

4.2. Behavioral Changes

In r1, grazing duration was similar on d1 and d2 but decreased on d3 with higher index values. The reduction in grazing time corresponds to the findings of Tucker et al. [27] in Holstein cows. In contrast, Fisher et al. [67] did not observe a reduction in grazing time. In their study, observations were limited to two 24 h periods and were also conducted with Holstein cows. In r2, no significant difference was observed in grazing time between the days, whereas grazing time was numerically lower on d4. In general, significantly more time was spent grazing during the day than during the night in the second round. However, on d4, more grazing was shown during the night than during the day. Feed utilization is linked to heat production in dairy cows [68]. A shift of grazing behavior towards the cooler night hours might be a counteraction to heat burdening daytime. In r1, more time was spent grazing compared to r2. Although milk yield did not differ significantly between the rounds, it was lower in r2 due to higher DIM. Lower milk yields and thereby energy requirements could have caused the lower grazing time. Additionally, differences in pasture quality and availability might have influenced grazing behavior. Rumination time did not differ significantly between the days in r1 and t2, but more rumination time was shown during the night than during the day which is in line with previously conducted studies [69,70]. Additionally, a difference between day- and nighttime rumination behavior was largest on d4 in r2.
Synchrony of grazing behavior was moderate to high, which is in agreement with the findings of Flury and Gygax [71] for animals on pasture. In general, rumination behavior had a lower synchrony. Between the rounds, synchrony of grazing and rumination behavior only differed slightly (0.66 vs. 0.68 for grazing, 0.35 vs. 0.38 for ruminating in r1 and r2, respectively). No meaningful development of synchrony was observed in r1. Within r2, synchrony of rumination behavior decreased steadily. Synchrony of grazing behavior was decreased on d2 and d3. Only a small subset of the herd (n = 5) was included in the behavior assessment under heat load. As most of the animals (n = 4) were unique to each round, a comparison between rounds is difficult. The behavioral dynamics of the whole herd might also look different, because the development of heat load highly relates to various factors that are individual for each animal [41].

5. Conclusions

The two periods of data collection differed in extremity of heat load conditions. In both rounds, elevated respiration rates as a first physiological reaction towards high temperatures was observed. The burden of weather conditions was confirmed by an elevated fecal cortisol level only in r2, where temperatures were more extreme. Additionally, a reduction in milk yield and changes in milk composition as consequences of heat load only occurred in the second round. Whereas the observed thresholds for THI were in line with previous literature, physiological heat load reactions were evident at lower BGHI values than those reported previously. The behavioral changes observed in a subset of animals included a reduction in grazing duration and a shift of grazing time towards the night.
Although informative value of reported behavior changes is limited by the small sample size, they provide the base for further studies on the behavioral reactions of mid-yielding Simmental cows to heat load on pasture.

Author Contributions

Conceptualization, S.T. and E.R.; methodology, L.S., S.T. and E.R.; validation, L.S.; formal analysis, L.S.; resources, S.T.; data curation, L.S.; writing—original draft preparation, L.S.; writing—review and editing, S.T., M.E. and E.R.; visualization, L.S.; supervision, S.T., M.E. and E.R.; project administration, S.T. and E.R.; funding acquisition, S.T. All authors have read and agreed to the published version of the manuscript.

Funding

This research was funded by Bavarian Research Foundation, grant number 1301-17.

Institutional Review Board Statement

The study was conducted according to the guidelines of EU directive 2010/63/EU and the German Welfare Act and was approved by the Ethics Committee from the Faculty of Veterinary Medicine of Ludwig-Maximilians-University Munich (protocol code 231-08-08-2020).

Informed Consent Statement

Not applicable.

Data Availability Statement

Data is contained within the article.

Acknowledgments

First: we would like to thank the farmer and his family for allowing us to conduct the study on their farm and for their support in animal handling and sampling. We are grateful for the help of Daniela Nicklas and her students who developed the machine learning models. Furthermore, we would like to thank Alexander Süsse from Blaupunkt Telematics GmbH for providing us with the prototype of the monitoring system.

Conflicts of Interest

The authors declare no conflict of interest. The funders had no role in the design of the study; in the collection, analyses, or interpretation of data; in the writing of the manuscript, or in the decision to publish the results.

References

  1. Hammami, H.; Bormann, J.; M’hamdi, N.; Montaldo, H.H.; Gengler, N. Evaluation of heat stress effects on production traits and somatic cell score of Holsteins in a temperate environment. J. Dairy Sci. 2013, 96, 1844–1855. [Google Scholar] [CrossRef] [PubMed] [Green Version]
  2. Brügemann, K. Defining and evaluating heat stress thresholds in different dairy cow production systems. Arch. Tierz. 2012, 55, 13–24. [Google Scholar] [CrossRef]
  3. Carvalho, D.; Cardoso Pereira, S.; Rocha, A. Future surface temperatures over Europe according to CMIP6 climate projections: An analysis with original and bias-corrected data. Clim. Chang. 2021, 167, 10. [Google Scholar] [CrossRef]
  4. Wankar, A.K.; Rindhe, S.N.; Doijad, N.S. Heat stress in dairy animals and current milk production trends, economics, and future perspectives: The global scenario. Trop Anim. Health Prod. 2021, 53, 70. [Google Scholar] [CrossRef]
  5. Polsky, L.; von Keyserlingk, M.A.G. Invited review: Effects of heat stress on dairy cattle welfare. J. Dairy Sci. 2017, 100, 8645–8657. [Google Scholar] [CrossRef] [Green Version]
  6. Gantner, V.; Bobić, T.; Potočnik, K.; Gregić, M.; Kučević, D. Persistence of heat stress effect in dairy cows. Mljekarstvo/Dairy 2019, 69, 30–41. [Google Scholar] [CrossRef]
  7. Schüller, L.K.; Burfeind, O.; Heuwieser, W. Impact of heat stress on conception rate of dairy cows in the moderate climate considering different temperature-humidity index thresholds, periods relative to breeding, and heat load indices. Theriogenology 2014, 81, 1050–1057. [Google Scholar] [CrossRef]
  8. Gantner, V.; Kuterovac, K.; Potočnik, K. Effect of Heat Stress on Metabolic Disorders Prevalence Risk and Milk Production in Holstein Cows in Croatia. Ann. Anim. Sci. 2016, 16, 451–461. [Google Scholar] [CrossRef] [Green Version]
  9. Vitali, A.; Felici, A.; Lees, A.M.; Giacinti, G.; Maresca, C.; Bernabucci, U.; Gaughan, J.B.; Nardone, A.; Lacetera, N. Heat load increases the risk of clinical mastitis in dairy cattle. J. Dairy Sci. 2020, 103, 8378–8387. [Google Scholar] [CrossRef]
  10. Sanders, A.H.; Shearer, J.K.; de Vries, A. Seasonal incidence of lameness and risk factors associated with thin soles, white line disease, ulcers, and sole punctures in dairy cattle. J. Dairy Sci. 2009, 92, 3165–3174. [Google Scholar] [CrossRef] [Green Version]
  11. Thom, E.C. The Discomfort Index. Weatherwise 1959, 12, 57–61. [Google Scholar] [CrossRef]
  12. Buffington, D.E.; Collazo-Arocho, A.; Canton, G.H.; Pitt, D.; Thatcher, W.W.; Collier, R.J. Black Globe-Humidity Index (BGHI) as Comfort Equation for Dairy Cows. Trans. ASAE 1981, 24, 711–714. [Google Scholar] [CrossRef]
  13. Gebremedhin, K.G.; Lee, C.N.; Hillman, P.E.; Collier, R.J. Physiological Responses of Dairy Cows during Extended Solar Exposure. Trans. ASABE 2010, 53, 239–247. [Google Scholar] [CrossRef]
  14. Rashid, S.A.; Tomar, A.K.S.; Verma, M.R.; Mehrotra, S.; Bharti, P.K. Effect of skin and coat characteristics on growth and milk production traits in Tharparkar cattle. Indian J. Anim. Sci. 2019, 89, 1251–1254. [Google Scholar]
  15. Ji, B.; Banhazi, T.; Ghahramani, A.; Bowtell, L.; Wang, C.; Li, B. Modelling of heat stress in a robotic dairy farm. Part 2: Identifying the specific thresholds with production factors. Biosyst. Eng. 2020, 199, 43–57. [Google Scholar] [CrossRef]
  16. Ji, B.; Banhazi, T.; Ghahramani, A.; Bowtell, L.; Wang, C.; Li, B. Modelling of heat stress in a robotic dairy farm. Part 1: Thermal comfort indices as the indicators of production loss. Biosyst. Eng. 2020, 199, 27–42. [Google Scholar] [CrossRef]
  17. Abeni, F.; Galli, A. Monitoring cow activity and rumination time for an early detection of heat stress in dairy cow. Int. J. Biometeorol. 2017, 61, 417–425. [Google Scholar] [CrossRef]
  18. Navrátil, S.; Falta, D.; Chládek, G. Effect of Temperature Cumulation on Milk Yield of Czech Fleckvieh-Simmental Cattle. Acta Univ. Agric. Silvic. Mendel. Brun. 2017, 65, 1579–1584. [Google Scholar] [CrossRef] [Green Version]
  19. Heinicke, J.; Hoffmann, G.; Ammon, C.; Amon, B.; Amon, T. Effects of the daily heat load duration exceeding determined heat load thresholds on activity traits of lactating dairy cows. J. Therm. Biol. 2018, 77, 67–74. [Google Scholar] [CrossRef]
  20. Abdeltalif, A.M.; Alameen, A.O. Influence of Season and Pregnangy on Thermoregulation and Haematological Profile in Crossbred Dairy Cows in Tropical Environment. Glob. Vet. 2012, 9, 334–340. [Google Scholar] [CrossRef]
  21. Heinicke, J.; Ibscher, S.; Belik, V.; Amon, T. Cow individual activity response to the accumulation of heat load duration. J. Therm. Biol. 2019, 82, 23–32. [Google Scholar] [CrossRef] [PubMed]
  22. Van Laer, E.; Tuyttens, F.A.M.; Ampe, B.; Sonck, B.; Moons, C.P.H.; Vandaele, L. Effect of summer conditions and shade on the production and metabolism of Holstein dairy cows on pasture in temperate climate. Animal 2015, 9, 1547–1558. [Google Scholar] [CrossRef] [PubMed] [Green Version]
  23. Chen, S.; Wang, J.; Peng, D.; Li, G.; Chen, J.; Gu, X. Exposure to heat-stress environment affects the physiology, circulation levels of cytokines, and microbiome in dairy cows. Sci. Rep. 2018, 8, 14606. [Google Scholar] [CrossRef] [PubMed] [Green Version]
  24. McManus, C.M.; Louvandini, H.; Paim, T.P.; Silva, F.C.P.; Bernal, F.E.M. Factors affecting heat tolerance in crossbred cattle in central Brazil. Ciênc. Anim. Bras. 2014, 15, 152–158. [Google Scholar] [CrossRef] [Green Version]
  25. Vizzotto, E.F.; Fischer, V.; Thaler Neto, A.; Abreu, A.S.; Stumpf, M.T.; Werncke, D.; Schmidt, F.A.; McManus, C.M. Access to shade changes behavioral and physiological attributes of dairy cows during the hot season in the subtropics. Animal 2015, 9, 1559–1566. [Google Scholar] [CrossRef] [PubMed] [Green Version]
  26. Herbut, P.; Angrecka, S. The effect of heat stress on time spent lying by cows in a housing system. Ann. Anim. Sci. 2018, 18, 825–833. [Google Scholar] [CrossRef] [Green Version]
  27. Tucker, C.B.; Rogers, A.R.; Schütz, K.E. Effect of solar radiation on dairy cattle behaviour, use of shade and body temperature in a pasture-based system. Appl. Anim. Behav. Sci. 2008, 109, 141–154. [Google Scholar] [CrossRef]
  28. Eslamizad, M.; Lamp, O.; Derno, M.; Kuhla, B. The control of short-term feed intake by metabolic oxidation in late-pregnant and early lactating dairy cows exposed to high ambient temperatures. Physiol. Behav. 2015, 145, 64–70. [Google Scholar] [CrossRef]
  29. Fraser, D.; Weary, D.M.; Pajor, E.; Milligan, B.N. A Scientific Conception of Animal Welfare that Reflects Ethical Concerns. Anim. Welf. 1997, 6, 187–205. [Google Scholar]
  30. Von Keyserlingk, M.A.G.; Rushen, J.; de Passillé, A.M.; Weary, D.M. Invited review: The welfare of dairy cattle-key concepts and the role of science. J. Dairy Sci. 2009, 92, 4101–4111. [Google Scholar] [CrossRef]
  31. Berckmans, D. Precision livestock farming technologies for welfare management in intensive livestock systems. Rev. Sci. Tech. OIE 2014, 33, 189–196. [Google Scholar] [CrossRef] [PubMed]
  32. Allen, J.D.; Hall, L.W.; Collier, R.J.; Smith, J.F. Effect of core body temperature, time of day, and climate conditions on behavioral patterns of lactating dairy cows experiencing mild to moderate heat stress. J. Dairy Sci. 2015, 98, 118–127. [Google Scholar] [CrossRef] [PubMed] [Green Version]
  33. Arias, R.A.; Delgado, C.; Keim, J.P.; Gandarillas, M. Use of the Comprehensive Climate Index to estimate heat stress response of grazing dairy cows in a temperate climate region. J. Dairy Res. 2021, 88, 154–161. [Google Scholar] [CrossRef] [PubMed]
  34. Becker, C.A.; Aghalari, A.; Marufuzzaman, M.; Stone, A.E. Predicting dairy cattle heat stress using machine learning techniques. J. Dairy Sci. 2021, 104, 501–524. [Google Scholar] [CrossRef]
  35. Karimi, M.T.; Ghorbani, G.R.; Kargar, S.; Drackley, J.K. Late-gestation heat stress abatement on performance and behavior of Holstein dairy cows. J. Dairy Sci. 2015, 98, 6865–6875. [Google Scholar] [CrossRef] [Green Version]
  36. Boonsanit, D.; Chanpongsang, S.; Chaiyabutr, N. Effects of supplemental recombinant bovine somatotropin and mist-fan cooling on the renal tubular handling of sodium in different stages of lactation in crossbred Holstein cattle. Res. Vet. Sci. 2012, 93, 417–426. [Google Scholar] [CrossRef]
  37. Ortiz, X.A.; Smith, J.F.; Rojano, F.; Choi, C.Y.; Bruer, J.; Steele, T.; Schuring, N.; Allen, J.; Collier, R.J. Evaluation of conductive cooling of lactating dairy cows under controlled environmental conditions. J. Dairy Sci. 2015, 98, 1759–1771. [Google Scholar] [CrossRef] [Green Version]
  38. Schütz, K.E.; Rogers, A.R.; Poulouin, Y.A.; Cox, N.R.; Tucker, C.B. The amount of shade influences the behavior and physiology of dairy cattle. J. Dairy Sci. 2010, 93, 125–133. [Google Scholar] [CrossRef]
  39. Calamari, L.; Petrera, F.; Stefanini, L.; Abeni, F. Effects of different feeding time and frequency on metabolic conditions and milk production in heat-stressed dairy cows. Int. J. Biometeorol. 2013, 57, 785–796. [Google Scholar] [CrossRef]
  40. Steinwidder, A.; Gasteiner, J. 8 Tipps Gegen Hitzestress bei Milchkühen. Available online: https://landwirt-media.com/8-tipps-gegen-hitzestress-bei-milchkuehen/ (accessed on 16 September 2021).
  41. Galán, E.; Llonch, P.; Villagrá, A.; Levit, H.; Pinto, S.; Del Prado, A. A systematic review of non-productivity-related animal-based indicators of heat stress resilience in dairy cattle. PLoS ONE 2018, 13, e0206520. [Google Scholar] [CrossRef]
  42. National Research Council (U.S.). A Guide to Environmental Research on Animals; National Academy of Sciences: Washington, DC, USA, 1971; ISBN 0309018692 9780309018692. [Google Scholar]
  43. Hajizadeh, R.; Farhang Dehghan, S.; Golbabaei, F.; Jafari, S.M.; Karajizadeh, M. Offering a model for estimating black globe temperature according to meteorological measurements. Met. Apps 2017, 24, 303–307. [Google Scholar] [CrossRef] [Green Version]
  44. Lawrence, M.G. The Relationship between Relative Humidity and the Dewpoint Temperature in Moist Air: A Simple Conversion and Applications. Bull. Am. Meteorol. Soc. 2005, 86, 225–234. [Google Scholar] [CrossRef]
  45. Schmeling, L.; Elmamooz, G.; Nicklas, D.; Rauch, E.; Thurner, S. Evaluation of a sensor-based system for monitoring rumination in dairy cows with access to pasture. In Proceedings of the EurAgEng 2021 Conference, New Challaneges for Agricultural Engineering towards a Digital World, Online, 5–8 July 2021; University of Évora: Évora, Portugal, 2021; pp. 154–155. [Google Scholar]
  46. Schmeling, L.; Thurner, S.; Nicklas, D.; Erhard, M.; Rauch, E. Automated detection of grazing behaviour with a collar-based monitoring system. In Sensing-New Insights into Grassland and Science and Practice, Proceedings of the 21st Symposium of the European Grassland Federation, 21st Symposium of the European Grassland Federation, Online, 17–19 May 2021; Astor, T., Dzene, I., Eds.; EGF: Witzenhausen, Germany, 2021; pp. 193–195. ISBN 978-3-00-068789-1. [Google Scholar]
  47. German Federal Ministry of Food and Agriculture. Verordnung zur Fortenwicklung des Rohmilchgüterechts: RohmilchGütV. Available online: https://www.bgbl.de/xaver/bgbl/text.xav?SID=&tf=xaver.component.Text_0&tocf=&qmf=&hlf=xaver.component.Hitlist_0&bk=bgbl&start=%2F%2F*%5B%40node_id%3D%27817545%27%5D&skin=pdf&tlevel=-2&nohist=1 (accessed on 8 September 2021).
  48. Abeni, F.; Calamari, L.; Stefanini, L. Metabolic conditions of lactating Friesian cows during the hot season in the Po valley. 1. Blood indicators of heat stress. Int. J. Biometeorol. 2007, 52, 87–96. [Google Scholar] [CrossRef]
  49. Pesenhofer, G.; Palme, R.; Pesenhofer, R.M.; Kofler, J. Comparison of two methods of fixation during functional claw trimming-walk-in crush versus tilt table-in dairy cows using faecal cortisol metabolite concentrations and daily milk yield as parameters. Wien. Tierärztliche Mitschrift 2006, 93, 288–294. [Google Scholar]
  50. Palme, R.; Robia, C.; Messmann, S.; Hofer, J.; Möstl, E. Measurement of faecal cortisol metabolites in ruminants: A non-invasive parameter of adrenocortical function. Wien. Tierärztliche Mitschrift 1999, 86, 237–241. [Google Scholar]
  51. Morrow, C.J.; Kolver, E.S.; Verkerk, G.A.; Matthews, L.R. Fecal glucocorticoid metabolites as a measure of adrenal activity in dairy cattle. Gen. Comp. Endocrinol. 2002, 126, 229–241. [Google Scholar] [CrossRef] [PubMed]
  52. Geischeder, S. Auswirkungen von Hitzestress auf Milchkühe der Rasse Fleckvieh unter Bayerischen Klimabedingungen und Einfluss Einer Unterstützungslüftung Durch Ventilatoren. Ph.D. Thesis, Ludwig-Maximilians-Universität München, München, Germany, 2017. [Google Scholar]
  53. Palme, R.; Möstl, E. Measurement of cortisol metabolites in faeces of sheep as a parameter of cortisol concentration in blood. In Proceedings of the 1st International Symposium on Physiology and Ethology of Wild and Zoo Animals, 1st International Symposium on Physiology and Ethology of Wild and Zoo Animals, Berlin, Germany, 18–21 September 1996; Deutsche Gesellschaft Für Säugetierkunde EV Berlin, European Association of Zoos and Aquaria, Ed.; Gustav Fischer Verlag: Berlin, Germany, 1997; pp. 192–197. [Google Scholar]
  54. Elischer, M.F.; Arceo, M.E.; Karcher, E.L.; Siegford, J.M. Validating the accuracy of activity and rumination monitor data from dairy cows housed in a pasture-based automatic milking system. J. Dairy Sci. 2013, 96, 6412–6422. [Google Scholar] [CrossRef]
  55. Giraudoux, P. Pgirmess: Spatial Analysis and Data Mining for Field Ecologists: R Package Version 1.7.0. 2021. Available online: https://CRAN.R-project.org/package=pgirmess (accessed on 8 September 2021).
  56. Signorell, A.; Aho, K.; Alfons, A.; Anderegg, N.; Aragon, T.; Arachchige, C.; Arppe, A.; Baddeley, A.; Barton, K.; Bolker, B.; et al. DescTools: Tools for Descriptive Statistics: R Package Version 0.99.42. 2021. Available online: https://cran.r-project.org/package=DescTools (accessed on 8 September 2021).
  57. Crump, A.; Jenkins, K.; Bethell, E.J.; Ferris, C.P.; Arnott, G. Pasture Access Affects Behavioral Indicators of Wellbeing in Dairy Cows. Animals 2019, 9, 902. [Google Scholar] [CrossRef] [Green Version]
  58. Fleiss, J.L. Measuring nominal scale agreement among many raters. Psychol. Bull. 1971, 76, 378–382. [Google Scholar] [CrossRef]
  59. Landis, J.R.; Koch, G.G. The Measurement of Observer Agreement for Categorical Data. Biometrics 1977, 33, 159. [Google Scholar] [CrossRef] [Green Version]
  60. Schmeling, L.; Elmamooz, G.; Hoang, P.T.; Kozar, A.; Nicklas, D.; Sünkel, M.; Thurner, S.; Rauch, E. Training and Validating a Machine Learning Model for the Sensor-based Monitoring of Lying Behavior in Dairy Cows on Pasture and in the Barn. Animals 2021, 11, 2660. [Google Scholar] [CrossRef] [PubMed]
  61. Zimbelman, R.B.; Rhoads, R.; Rhoads, M.L.; Duff, G.C.; Baumgard, L.H.; Collier, R.J. A Re-Evaluation of the Impact of Temperature Humidity Index (THI) and Black Globe Humidity Index (BGHI) on Milk Production in High Producing Dairy Cows. In Proceedings of the Southwest Nutrition and Management Conference, Southwest Nutrition and Management Conference, American Registry of Professional Animal Scientists, Tempe, AZ, USA, 26–27 February 2009; Southwest Nutrition Conference: Phoenix, AZ, USA, 2009; pp. 158–168. [Google Scholar]
  62. Dalcin, V.C.; Fischer, V.; Daltro, D.D.S.; Alfonzo, E.P.M.; Stumpf, M.T.; Kolling, G.J.; da Silva, M.V.G.B.; McManus, C. Physiological parameters for thermal stress in dairy cattle. R. Bras. Zootec. 2016, 45, 458–465. [Google Scholar] [CrossRef] [Green Version]
  63. Kibler, H.H. Environmental Physiology and Shelter Engineering: LXVII. Thermal Effects of Various Temperature-Humidity Combinations on Holstein Cattle as Measured by Eight Physiological Responses; Research Bulletin No. 862: Columbia, MO, USA, 1964; Available online: https://mospace.umsystem.edu/xmlui/handle/10355/58200 (accessed on 8 September 2021).
  64. Gorniak, T.; Meyer, U.; Südekum, K.-H.; Dänicke, S. Impact of mild heat stress on dry matter intake, milk yield and milk composition in mid-lactation Holstein dairy cows in a temperate climate. Arch. Anim. Nutr. 2014, 68, 358–369. [Google Scholar] [CrossRef]
  65. Gantner, V. The differences in heat stress resistance due to dairy cattle breed. Mljekarstvo/Dairy 2017, 62, 112–122. [Google Scholar] [CrossRef] [Green Version]
  66. Collier, R.J.; Baumgard, L.H.; Zimbelman, R.B.; Xiao, Y. Heat stress: Physiology of acclimation and adaptation. Anim. Front. 2019, 9, 12–19. [Google Scholar] [CrossRef] [PubMed] [Green Version]
  67. Fisher, A.D.; Roberts, N.; Bluett, S.J.; Verkerk, G.A.; Matthews, L.R. Effects of shade provision on the behaviour, body temperature and milk production of grazing dairy cows during a New Zealand summer. N. Z. J. Agric. Res. 2008, 51, 99–105. [Google Scholar] [CrossRef]
  68. Suzuki, T.; Kamiya, Y.; Tanaka, M.; Hattori, I.; Sakaigaichi, T.; Terauchi, T.; Nonaka, I.; Terada, F. Effect of fiber content of roughage on energy cost of eating and rumination in Holstein cows. Anim. Feed. Sci. Technol. 2014, 196, 42–49. [Google Scholar] [CrossRef]
  69. Ternman, E.; Pastell, M.; Hänninen, L.; Agenäs, S.; Nielsen, P.P. First-night effect on sleep time in dairy cows. PLoS ONE 2018, 13, e0195593. [Google Scholar] [CrossRef] [Green Version]
  70. Gregorini, P.; DelaRue, B.; McLeod, K.; Clark, C.; Glassey, C.B.; Jago, J. Rumination behavior of grazing dairy cows in response to restricted time at pasture. Livest. Sci. 2012, 146, 95–98. [Google Scholar] [CrossRef]
  71. Flury, R.; Gygax, L. Daily patterns of synchrony in lying and feeding of cows: Quasi-natural state and (anti-) synchrony factors. Behav. Processes 2016, 133, 56–61. [Google Scholar] [CrossRef]
Figure 1. Development of respiration rate (A,B), milk yield (C,E,F), milk composition (G,H), somatic cell count (D), and fecal cortisol level (I,J) in r1 from d0 to d4. “***” indicates highly significant differences (p < 0.01), and “**” indicates significant differences (p < 0.05).
Ruminants 02 00010 g001
Figure 2. Development of respiration rate (A,B), milk yield (C,E,F), milk composition (G,H), somatic cell count (D), and fecal cortisol level (I,J) in r2 from d1 to d7. “***” indicates highly significant differences (p < 0.01), and “**” indicates significant differences (p < 0.05).
Ruminants 02 00010 g002
Table 1. Mean DBT 1, RH 2, RAD 3, WS 4, THI 5, and BGHI 6 per 6 h period (0:00–06:00, 06:00–12:00, 12:00–18:00, and 18:00–24:00 h) and per day (06:00–06:00 h) in r1 on d1 to d4.
DayTime of DayDBT [°C]RH [%]RAD [W/m2]WS [m/s]THIBGHI
006:00–12:0020661802.06765
12:00–18:0023452132.46970
18:00–24:001866391.56360
00:00–06:00137801.55652
daily average19641051.86462
106:00–12:001959792.86462
12:00–18:0023391283.16868
18:00–24:001952483.36462
00:00–06:00148201.85752
daily average1958642.86361
206:00–12:0016731892.16159
12:00–18:0022513562.56871
18:00–24:001678733.06157
00:00–06:00109700.65147
daily average16751552.06058
306:00–12:001872631.76360
12:00–18:0025531903.37273
18:00–24:001983593.26561
00:00–06:00169501.06156
daily average2076782.36562
406:00–12:002273831.96966
12:00–18:0027502243.87576
18:00–24:001886272.86460
00:00–06:00169600.66257
daily average2176832.36765
1 dry bulb temperature, 2 relative humidity, 3 radiation, 4 wind speed, 5 Temperature-Humidity-Index, 6 Black Globe Humidity Index.
Table 2. Mean DBT 1, RH 2, RAD 3, WS 4, THI 5, and BGHI 6 per 6 h period (0:00–06:00, 06:00–12:00, 12:00–18:00, and 18:00–24:00 h) and per day (06:00–06:00 h) in r2 on d1 to d7.
DayTime of DayDBT [°C]RH [%]RAD [W/m2]WS [m/s]THIBGHI
018:00–24:002068820.76664
00:00–06:00178300.36156
daily average- 7- 7- 7- 7- 7- 7
106:00–12:0017781280.96260
12:00–18:0019743150.76464
18:00–24:001874910.56360
00:00–06:00158500.65854
daily average17781330.76259
206:00–12:0015792580.75958
12:00–18:0022496320.96875
18:00–24:0020631010.66563
00:00–06:00157800.95854
daily average18672480.86363
306:00–12:0016772161.06059
12:00–18:0027427211.17384
18:00–24:0025511150.87272
00:00–06:00196701.66561
daily average22592631.16869
406:00–12:0019702471.36565
12:00–18:0030397381.17789
18:00–24:0028451110.87476
00:00–06:00207700.66762
daily average24582740.97173
506:00–12:002172462.36865
12:00–18:001989262.76661
18:00–24:00189691.66559
00:00–06:00169900.76055
daily average1989461.86560
606:00–12:0019801262.66462
12:00–18:0021591554.96866
18:00–24:001678111.86157
00:00–06:00129101.05450
daily average1777732.56259
706:00–12:0016761670.96058
12:00–18:0020504872.66670
18:00–24:001581230.95955
1 dry bulb temperature, 2 relative humidity, 3 radiation, 4 wind speed, 5 Temperature-Humidity-Index, 6 Black Globe Humidity Index, 7 as recording started at noon no average was calculated for that d1.
Table 3. Grazing and ruminating behavior per day (d; 06:00–06:00 h) and separately for daytime (06:00–18:00 h) and nighttime (06:00–18:00 h) for d1 to d3 in r1 and for d1 to d4 in r2. For behavior evaluation, previously validated machine learning models [45,46,60] for each behavioral pattern were applied to the sensor data from 5 animals.
d1d2d3d4
ØSEMØSEMØSEMØSEM
round 1
Grazing time/24 h [h] 8.9 a0.377.8 b0.397.9 a,b0.30- 1
Grazing time/12 h daytime [h] 4.9 a0.223.9 b0.254.1 a,b0.19- 1
Grazing time/12 h nighttime [h] 4.00.163.90.203.80.17- 1
Rumination time/24 h [h] 7.10.256.80.337.10.17- 1
Rumination time/12 h daytime [h] 2.70.342.60.263.00.13- 1
Rumination time/12 h nighttime [h] 4.40.124.20.144.10.06- 1
round 2
Grazing time/24 h [h]7.00.346.80.487.10.386.40.38
Grazing time/12 h daytime [h] 3.7 a,b0.224.6 a0.214.3 a,b0.262.9 b0.28
Grazing time/12 h nighttime [h] 3.3 a,b0.142.2 a0.302.8 a,b0.193.5 b0.13
Rumination time/24 h [h]7.00.317.50.197.40.268.20.14
Rumination time/12 h daytime [h]2.9 a,b0.142.3 a0.142.6 a,b0.163.6 b0.22
Rumination time/12 h nighttime [h]4.1 b0.195.2 a0.194.8 a,b0.264.6 a,b0.19
a,b significant (p < 0.05) differences within a row; 1 behavior data was not recorded for 24 h on that day in round 1.
Table 4. Fleiss’ Kappa (κF) values for the evaluation of synchrony of grazing and ruminating behavior in the two rounds from 5 animals for each day (d; 06:00–06:00 h) and during daytime (06:00–18:00 h) and nighttime (06:00–18:00 h) for d1 to d3 in r1 and for d1 to d4 in r2.
Round 1Round 2
d1d2d3d1d2d3d4
Synchrony of grazing behavior within 24 h0.630.730.620.710.590.590.73
Synchrony of grazing behavior during the day0.590.670.630.600.820.560.50
Synchrony of grazing behavior during the night0.670.790.610.800.410.620.92
Synchrony of ruminating behavior within 24 h0.300.320.430.450.420.390.27
Synchrony of ruminating behavior during the day0.040.260.350.280.110.410.34
Synchrony of ruminating behavior during the night0.380.310.480.520.400.340.18
Publisher’s Note: MDPI stays neutral with regard to jurisdictional claims in published maps and institutional affiliations.

