
Associations between Circulating IGF-1 Concentrations, Disease Status and the Leukocyte Transcriptome in Early Lactation Dairy Cows

 , , , , , , , , , , , and
Abstract
:1. Introduction
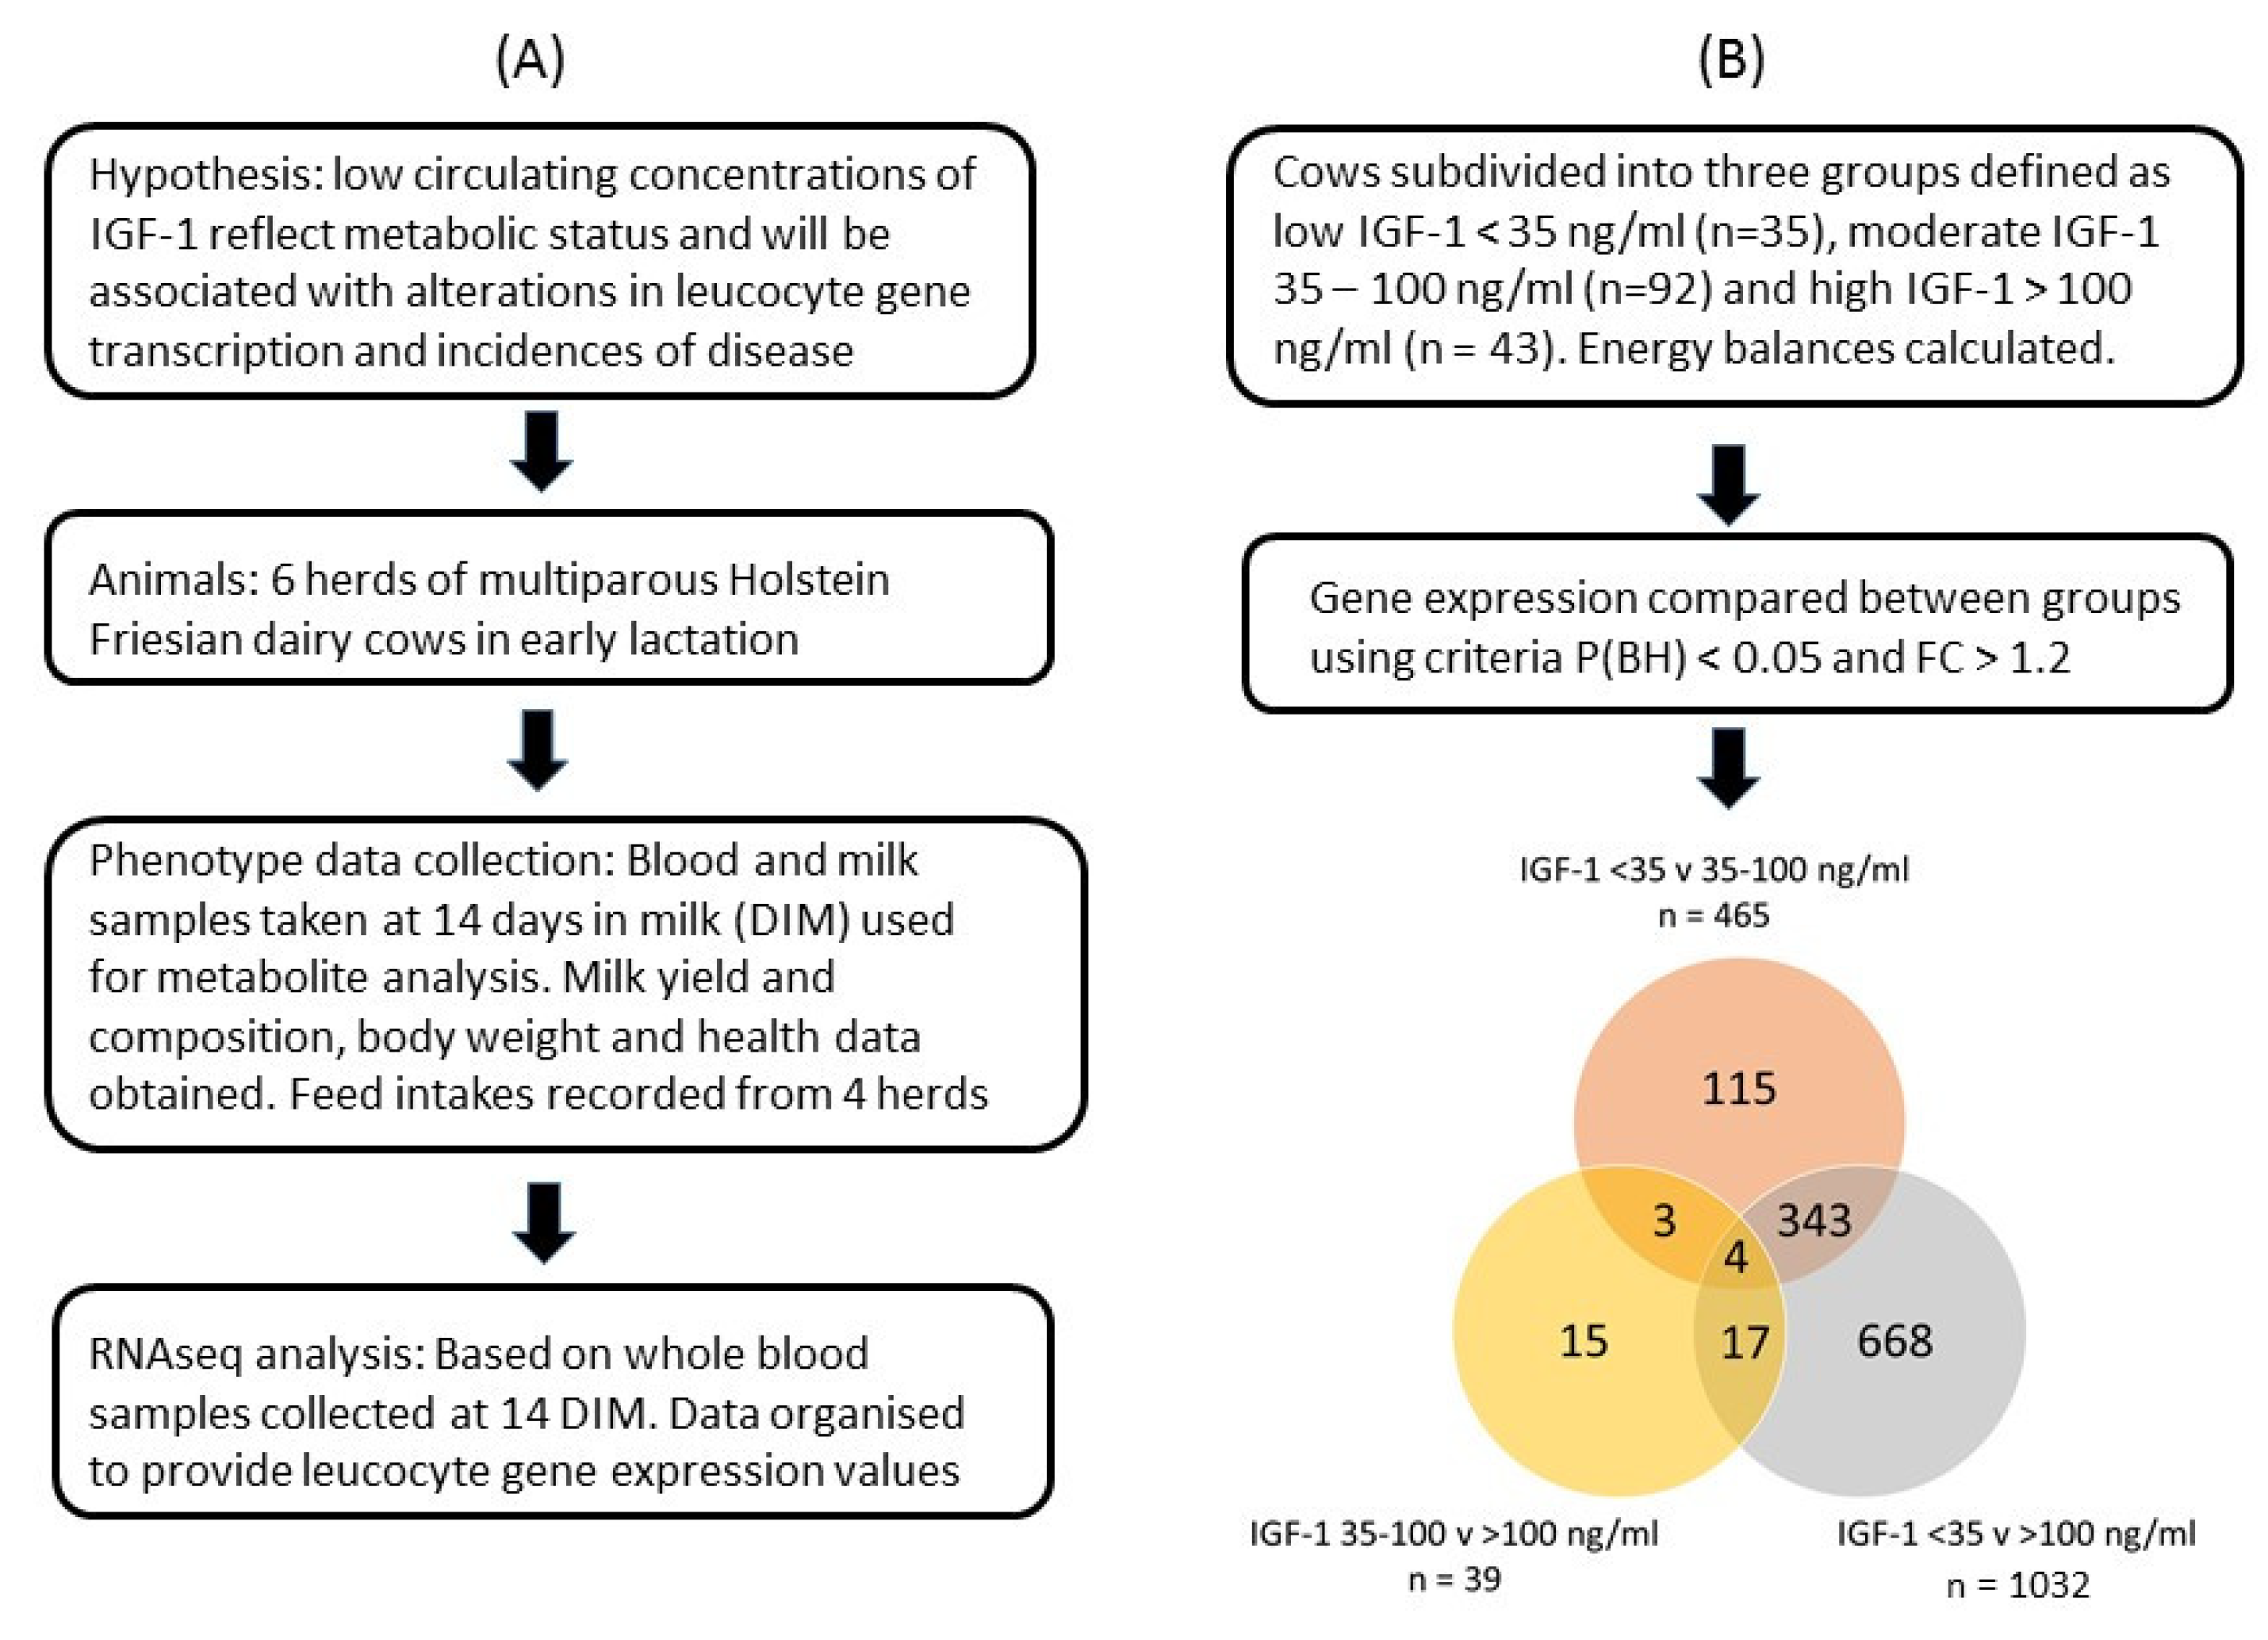
2. Materials and Methods
2.1. Animals
2.2. Measurement of IGF-1 and Metabolites in Blood
2.3. Milk Sampling and Analysis for Metabolites and Enzymes
2.4. Calculation of Energy Balance
2.5. Health Records
2.6. RNA Extraction
2.7. RNA Sequencing
2.8. Relationship between Gene Expression with Circulating IGF-1
2.9. Statistical Analysis
3. Results
3.1. Cow Data
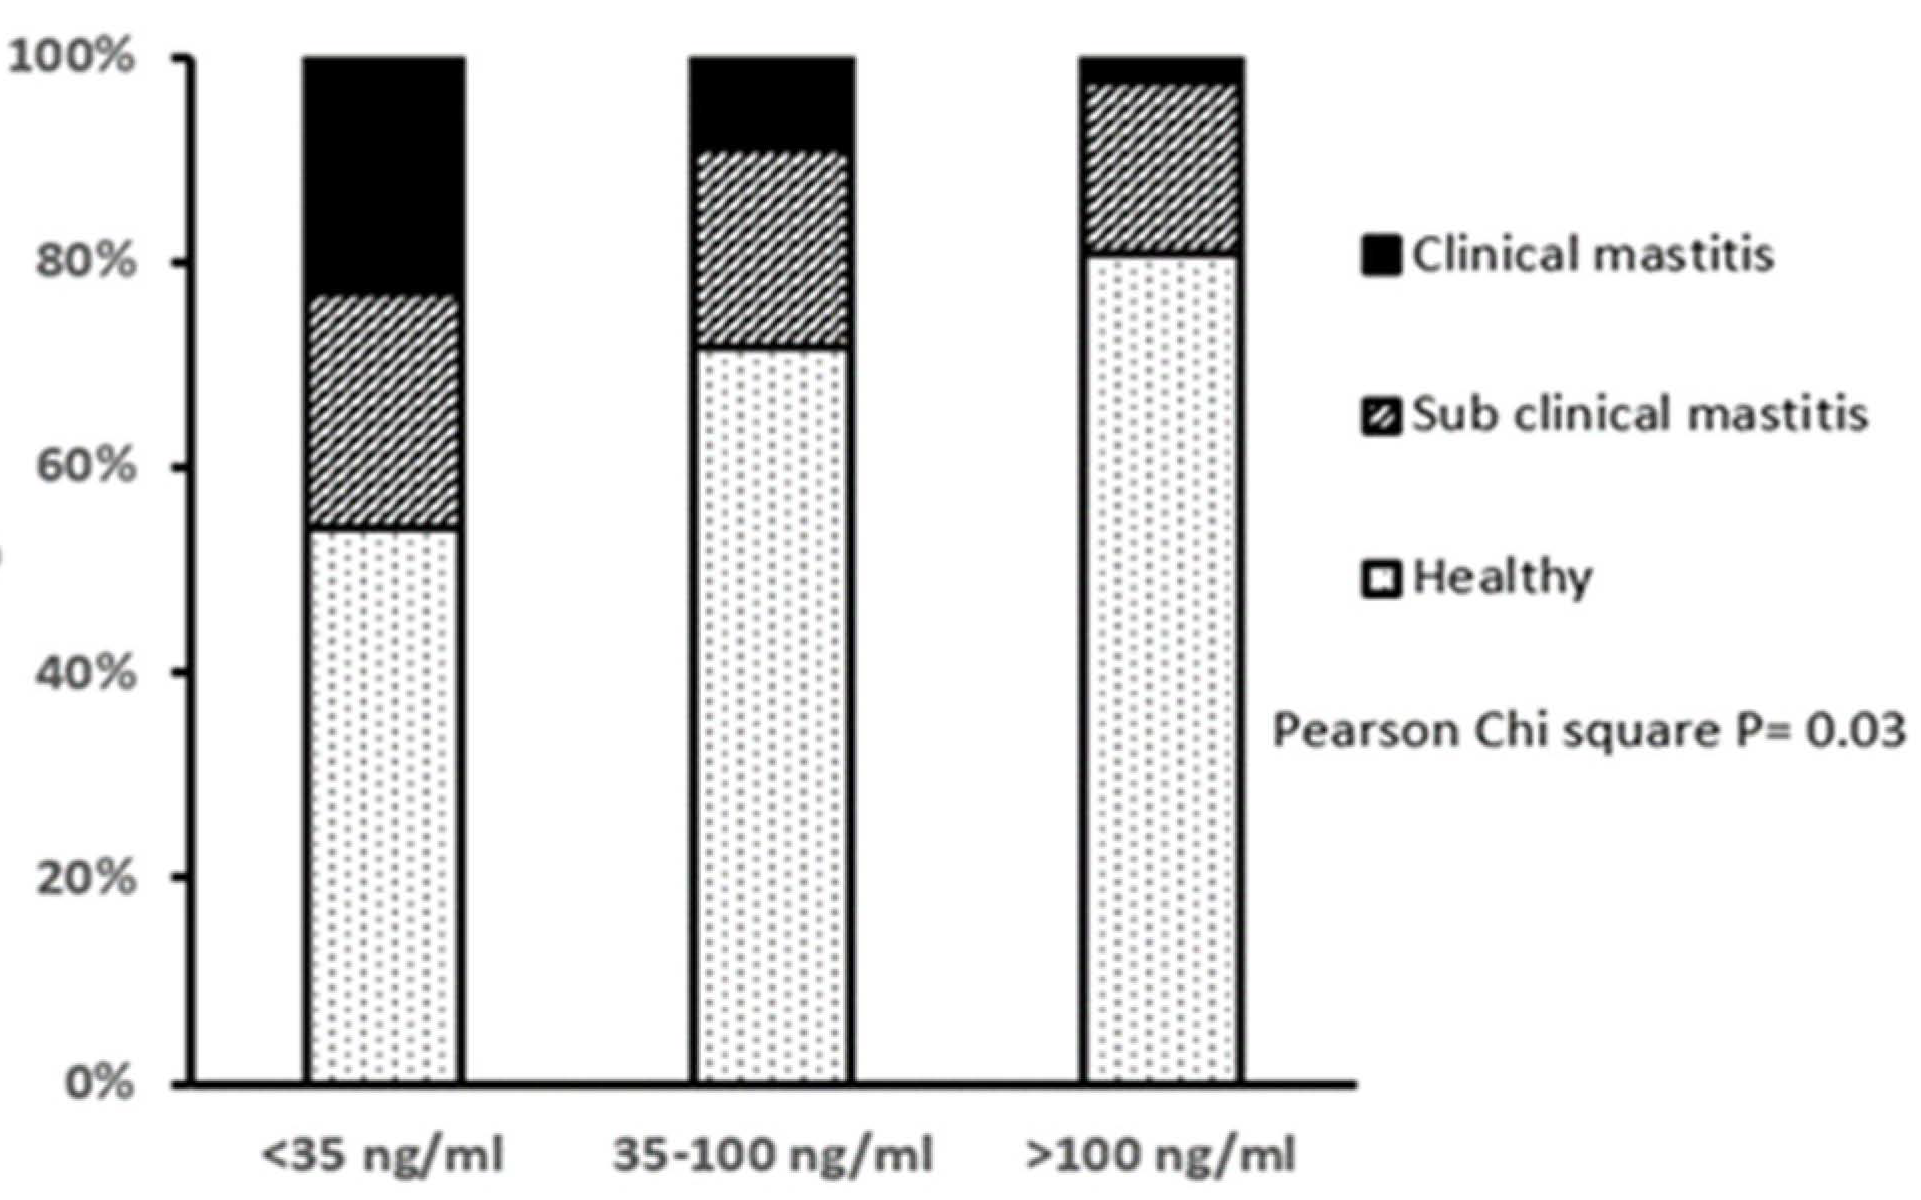
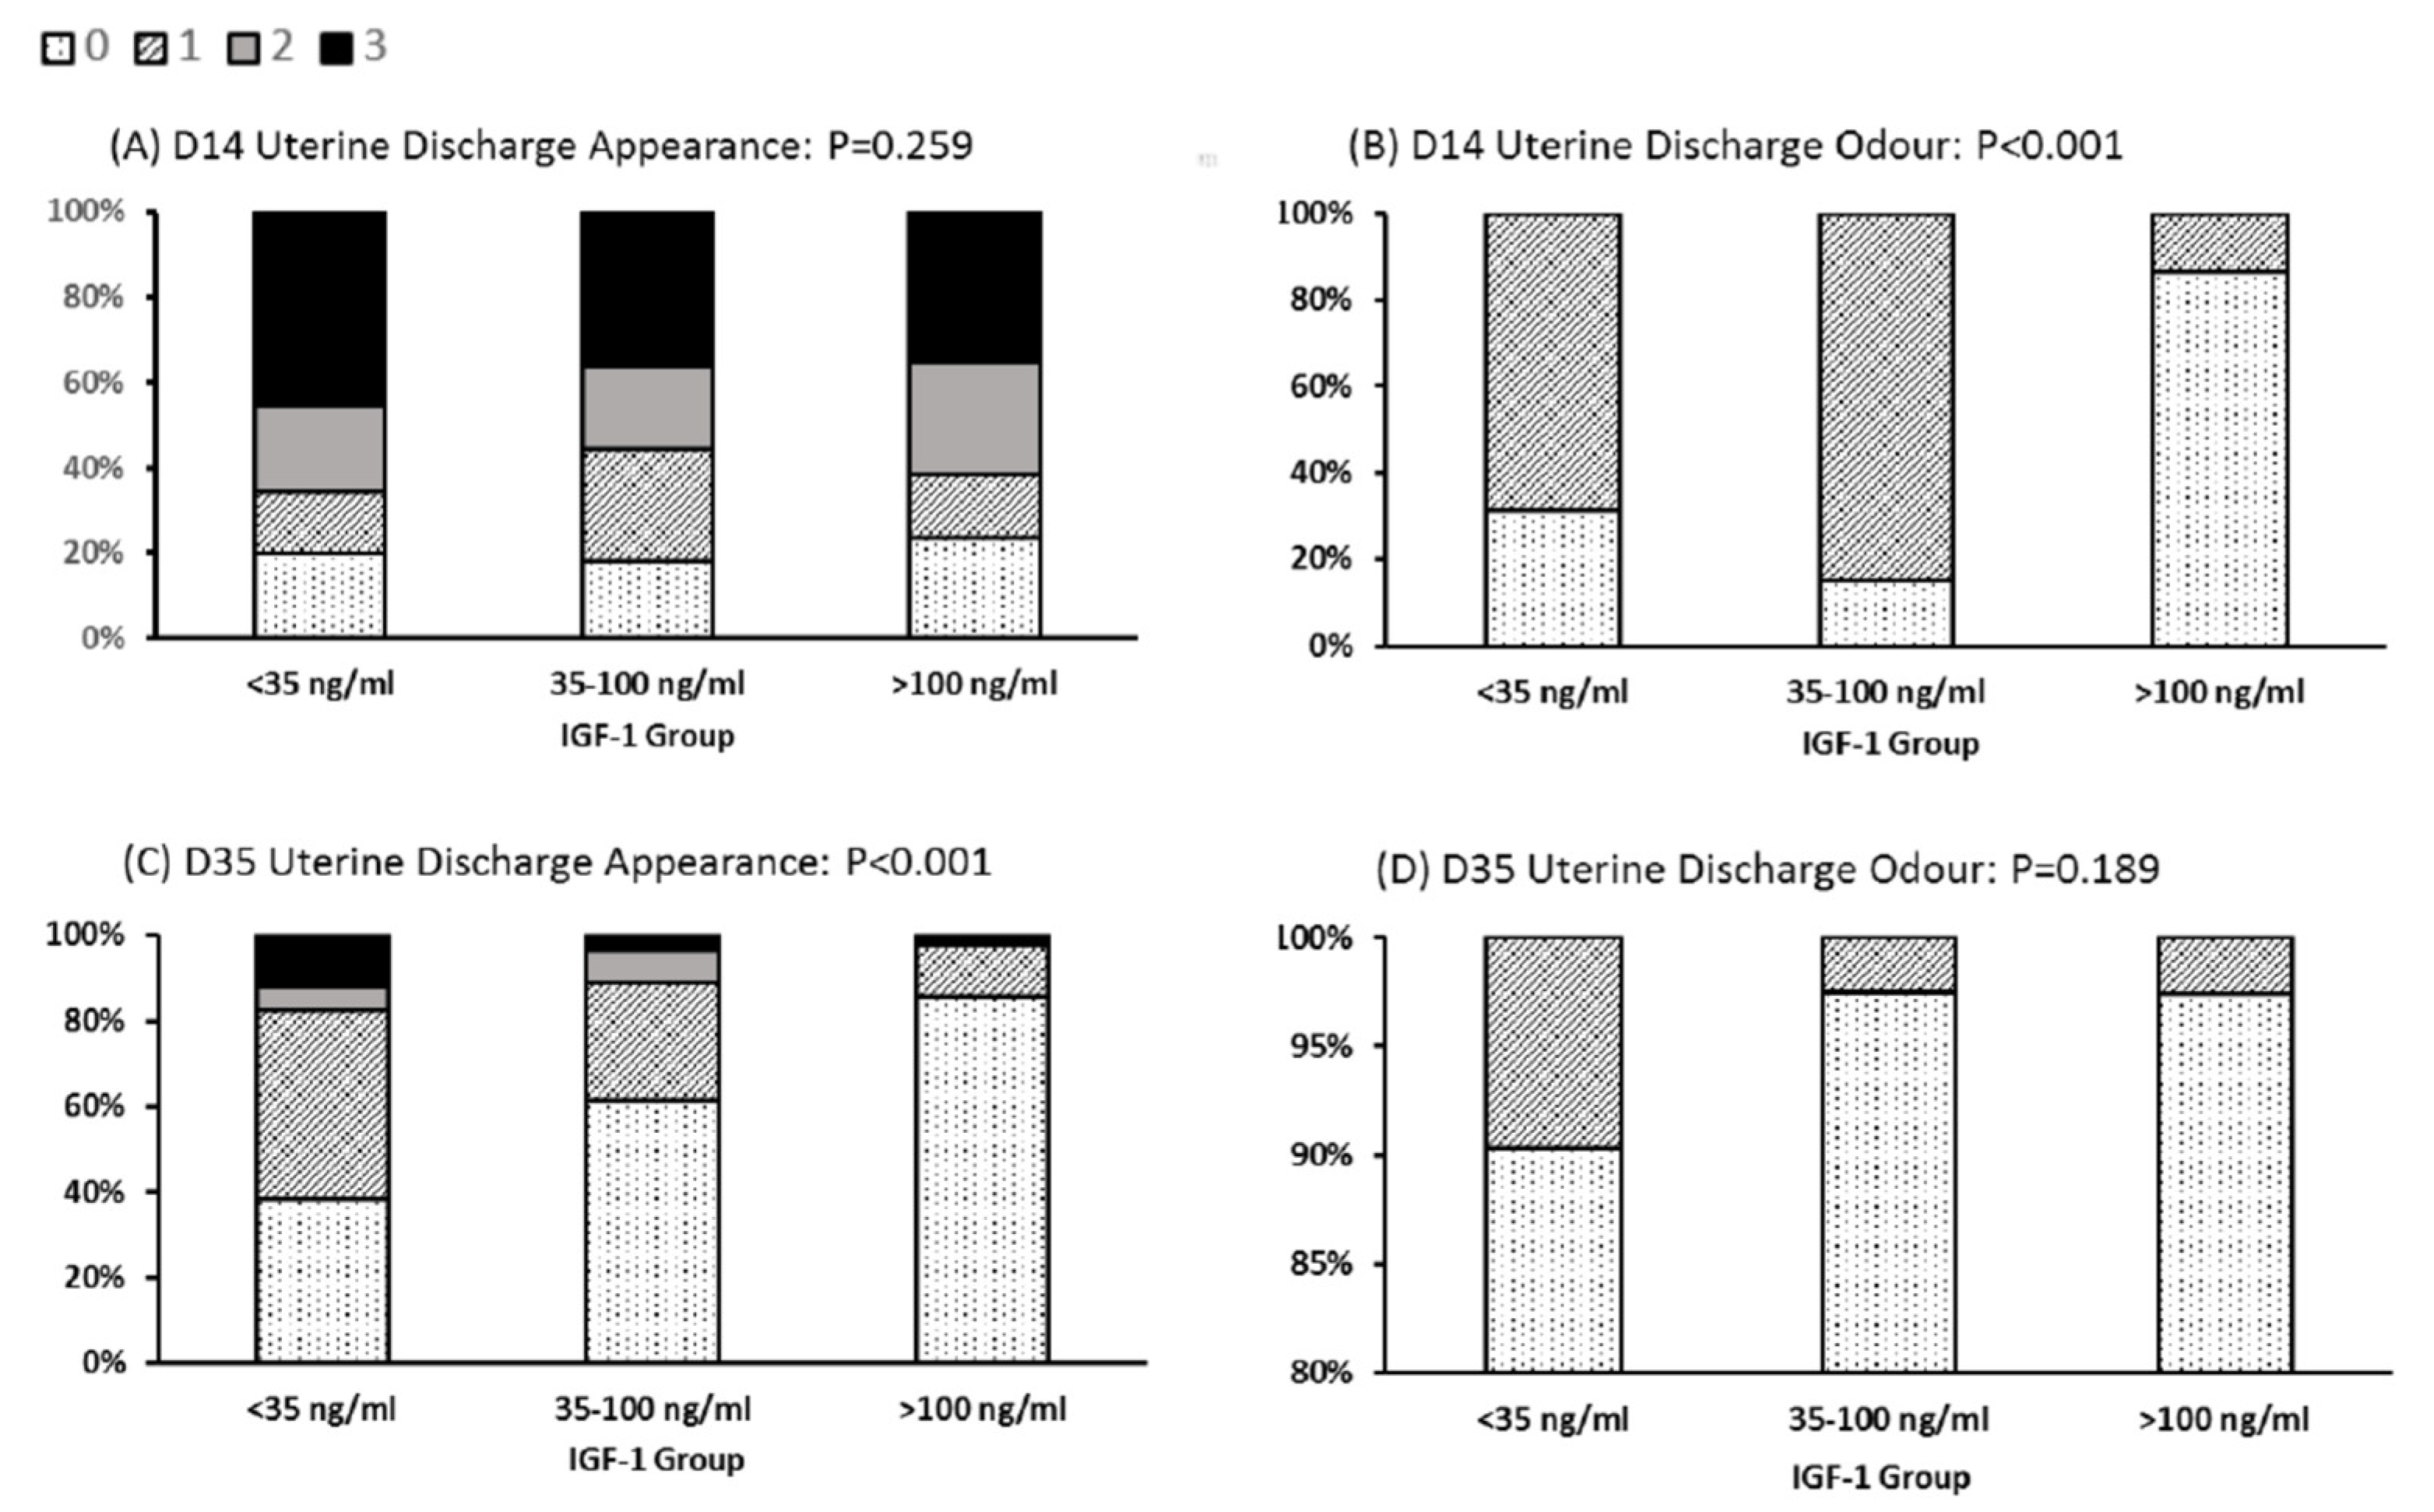
3.2. Health
3.3. Gene Expression Data in Leucocytes
3.4. Genes Up-Regulated in LOW IGF-1 Cows
3.5. Genes Down-Regulated in LOW IGF-1 Cows
3.6. Cluster Analysis
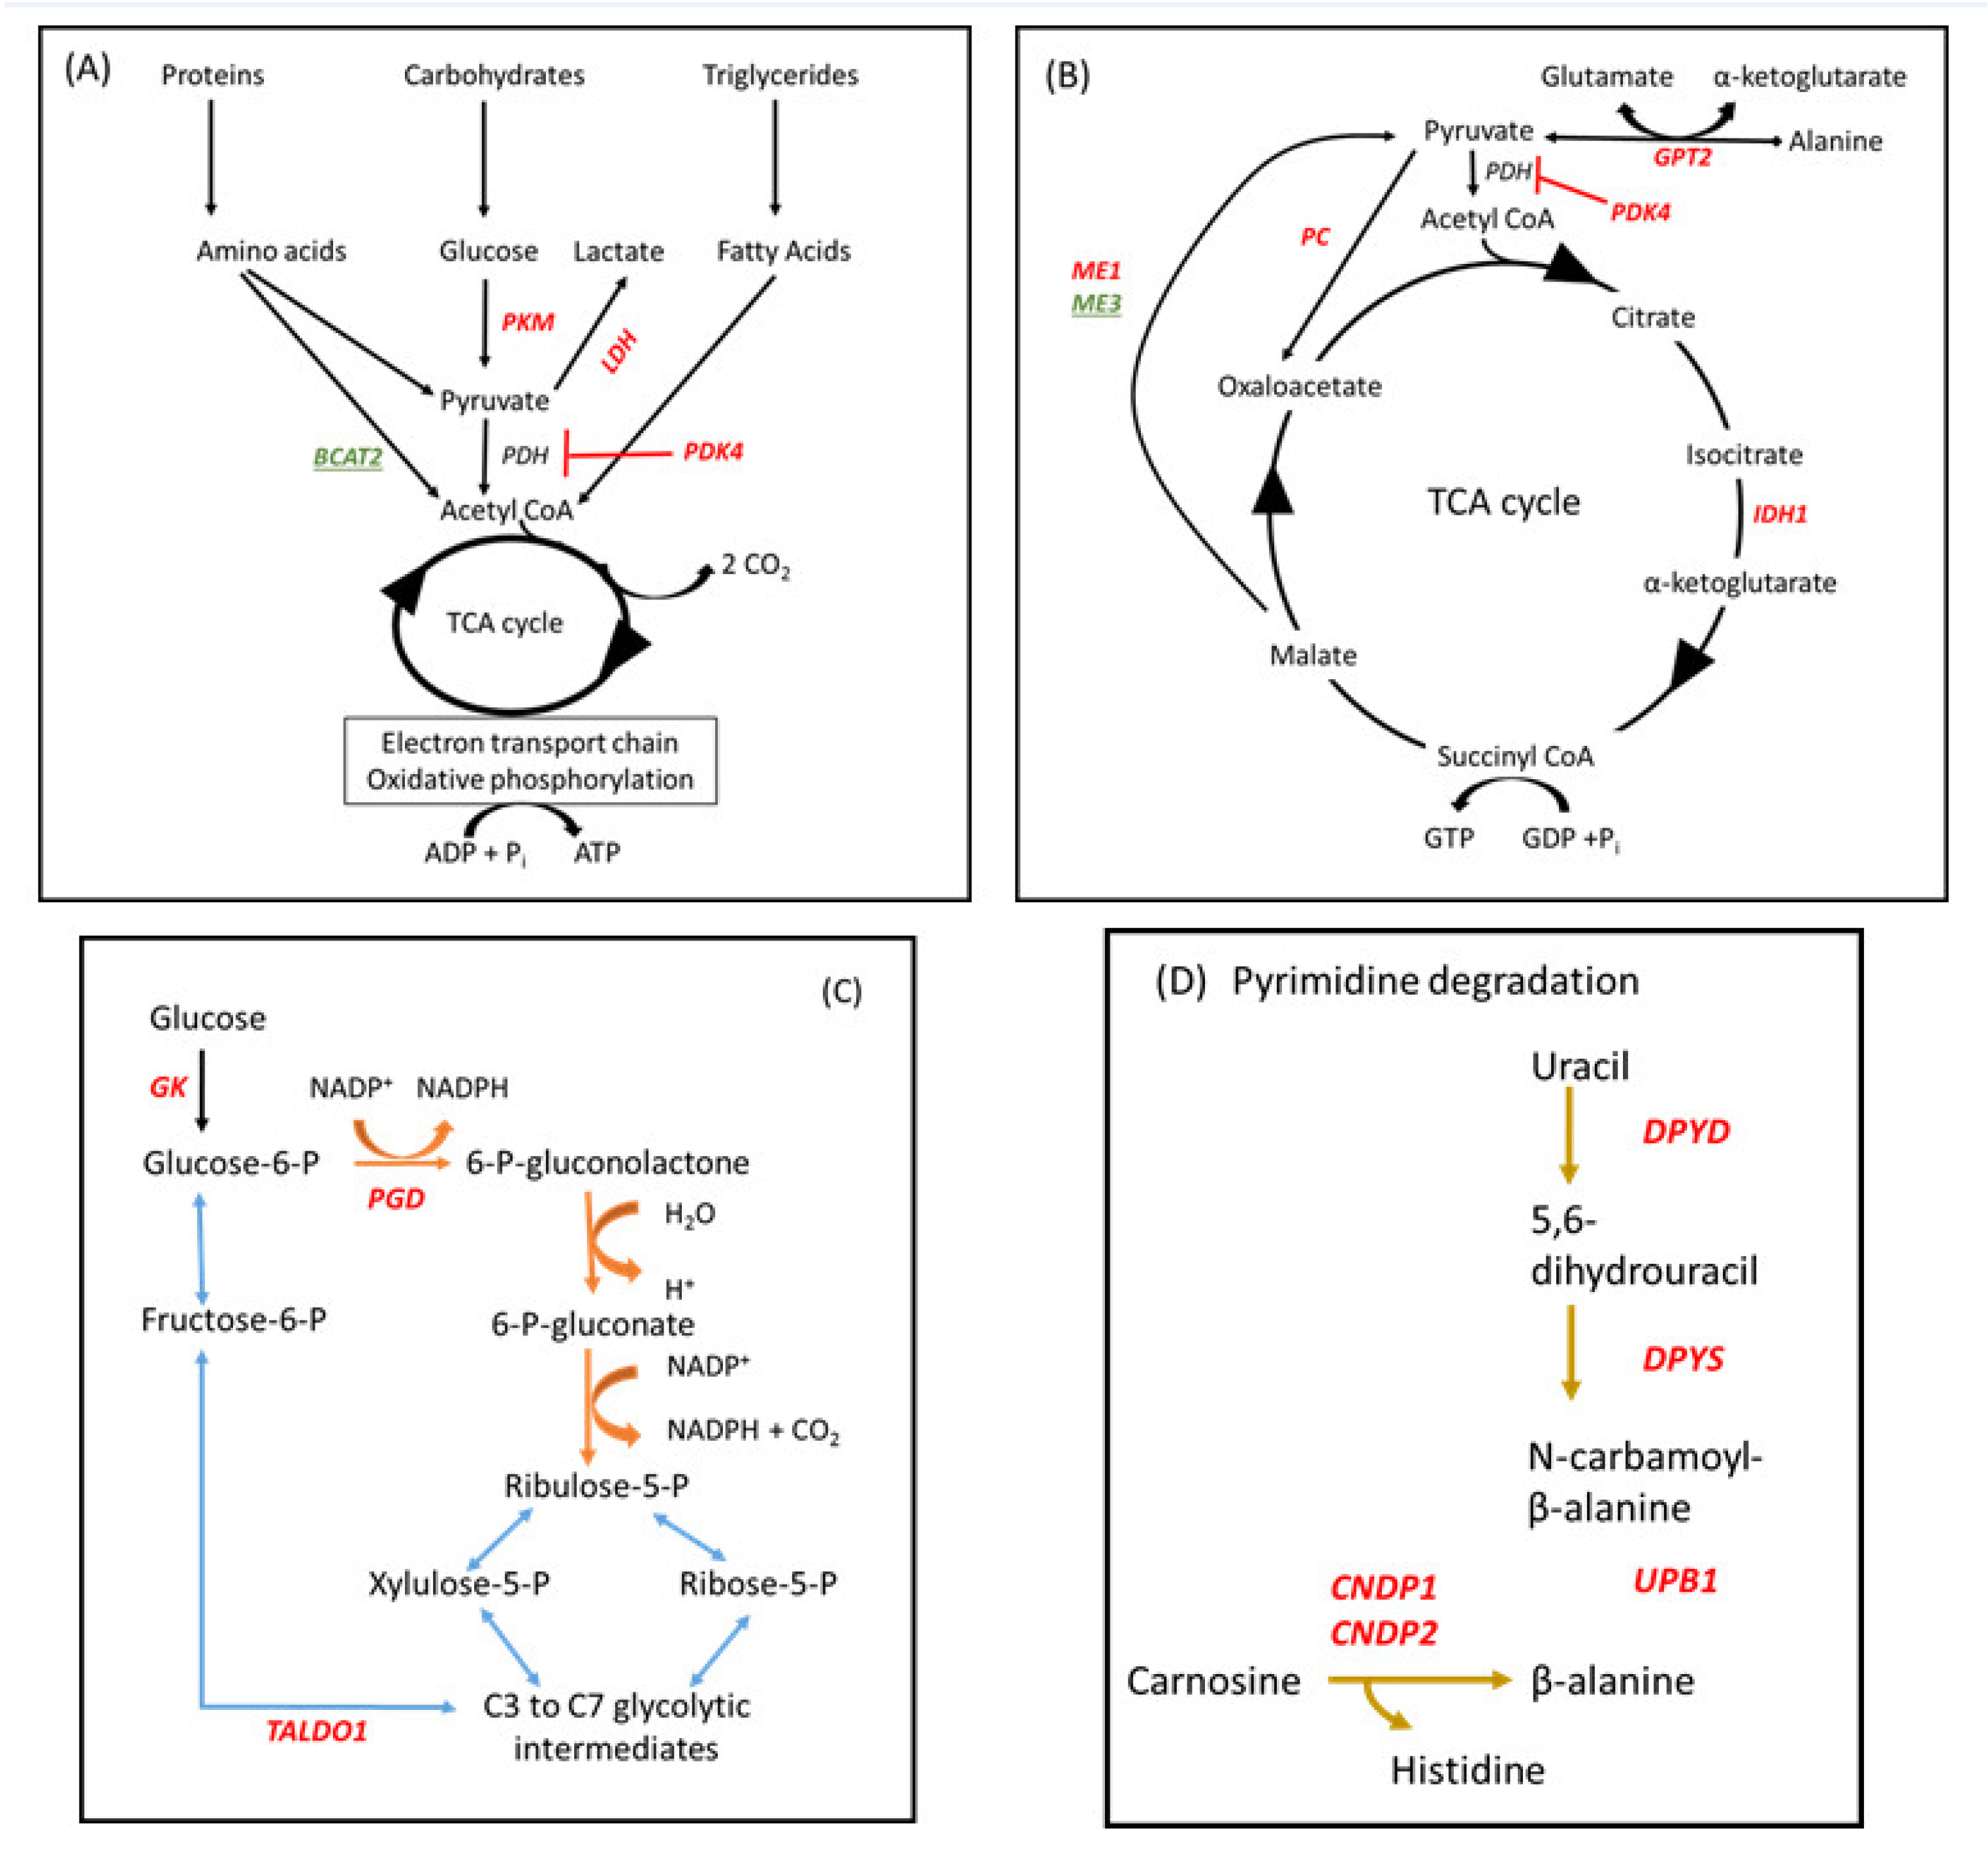
3.7. KEGG Pathway Analysis
4. Discussion
4.1. Gene Expression in Peripheral Blood
4.2. Phenotypic Changes
4.3. Markers of Energy Metabolism
4.4. ABC Transporters
4.5. Antimicrobial Activity
4.6. Vascular Damage and Inflammation
4.7. Cytokine and Chemokine Signaling Pathways
4.8. Adaptive Immunity
4.9. Cytoskeleton and Cell Motility
4.10. Potential Links to Health and Fertility
5. Conclusions
Supplementary Materials
Author Contributions
Funding
Institutional Review Board Statement
Data Availability Statement
Acknowledgments
Conflicts of Interest
References
- Drackley, J.K. Biology of Dairy Cows During the Transition Period: The Final Frontier? J. Dairy Sci. 1999, 82, 2259–2273. [Google Scholar] [CrossRef]
- Loor, J.J.; Dann, H.M.; Guretzky, N.A.J.; Everts, R.E.; Oliveira, R.; Green, C.A.; Litherland, N.B.; Rodriguez-Zas, S.L.; Lewin, H.A.; Drackley, J.K. Plane of nutrition prepartum alters hepatic gene expression and function in dairy cows as assessed by longitudinal transcript and metabolic profiling. Physiol. Genom. 2006, 27, 29–41. [Google Scholar] [CrossRef] [PubMed]
- Ingvartsen, K.L. Feeding- and management-related diseases in the transition cow: Physiological adaptations around calving and strategies to reduce feeding-related diseases. Anim. Feed Sci. Technol. 2006, 126, 175–213. [Google Scholar] [CrossRef]
- Habel, J.; Sundrum, A. Mismatch of Glucose Allocation between Different Life Functions in the Transition Period of Dairy Cows. Animals 2020, 10, 1028. [Google Scholar] [CrossRef]
- Ingvartsen, K.L.; Andersen, J.B. Integration of metabolism and intake regulation: A review focusing on periparturient animals. J. Dairy Sci. 2000, 83, 1573–1597. [Google Scholar] [CrossRef]
- Taylor, V.J.; Beever, D.E.; Wathes, D.C. Physiological Adaptations to Milk Production that Affect the Fertility of High Yielding Dairy Cows. In Dairying, Using Science to Meet Consumer Needs, Kebreab, E., Mills, J., Beever, D., Eds.; Cambridge University Press: Cambridge, UK. Br. Soc. Anim. Sci. Occas. Publ. 2004, 29, 37–71. [Google Scholar] [CrossRef]
- Loor, J.J.; Dann, H.M.; Everts, R.E.; Oliveira, R.; Green, C.A.; Guretzky, N.A.J.; Rodriguez-Zas, S.L.; Lewin, H.A.; Drackley, J.K. Temporal gene expression profiling of liver from periparturient dairy cows reveals complex adaptive mechanisms in hepatic function. Physiol. Genom. 2005, 23, 217–226. [Google Scholar] [CrossRef] [PubMed] [Green Version]
- Wathes, D.C.; Cheng, Z.; Salavati, M.; Buggiotti, L.; Takeda, H.; Tang, L.; Becker, F.; Ingvartsen, K.I.; Ferris, C.; Hostens, M.; et al. Relationships between metabolic profiles and gene expression in liver and leukocytes of dairy cows in early lactation. J. Dairy Sci. 2021, 104, 3596–3616. [Google Scholar] [CrossRef]
- Trevisi, E.; Amadori, M.; Cogrossi, S.; Razzuoli, E.; Bertoni, G. Metabolic stress and inflammatory response in high-yielding, periparturient dairy cows. Res. Vet. Sci. 2012, 93, 695–704. [Google Scholar] [CrossRef]
- Kobayashi, Y.; Boyd, C.K.; Bracken, C.J.; Lamberson, W.R.; Keisler, D.H.; Lucy, M.C. Reduced Growth Hormone Receptor (GHR) Messenger Ribonucleic Acid in Liver of Periparturient Cattle Is Caused by a Specific Down-Regulation of GHR 1A That Is Associated with Decreased Insulin-Like Growth Factor I. Endocrinology 1999, 140, 3947–3954. [Google Scholar] [CrossRef]
- Fenwick, M.A.; Fitzpatrick, R.; Kenny, D.A.; Diskin, M.G.; Patton, J.; Murphy, J.J.; Wathes, D.C. Interrelationships between negative energy balance (NEB) and IGF regulation in liver of lactating dairy cows. Domest. Anim. Endocrinol. 2008, 34, 31–44. [Google Scholar] [CrossRef]
- Bell, A.W. Regulation of organic nutrient metabolism during transition from late pregnancy to early lactation. J. Anim. Sci. 1995, 73, 2804–2819. [Google Scholar] [CrossRef]
- Thissen, J.-P.; Ketelslegers, J.-M.; Underwood, L.E. Nutritional Regulation of the Insulin-Like Growth Factors. Endocr. Rev. 1994, 15, 80–101. [Google Scholar] [CrossRef] [PubMed]
- Etherton, T.D.; Bauman, D.E. Biology of Somatotropin in Growth and Lactation of Domestic Animals. Physiol. Rev. 1998, 78, 745–761. [Google Scholar] [CrossRef] [PubMed]
- Ronge, H.; Blum, J.; Clement, C.; Jans, F.; Leuenberger, H.; Binder, H. Somatomedin C in dairy cows related to energy and protein supply and to milk production. Anim. Sci. 1988, 47, 165–183. [Google Scholar] [CrossRef] [Green Version]
- Meier, S.; Kolver, E.S.; Verkerk, G.A.; Roche, J.R. Effects of divergent Holstein-Friesian strain and diet on diurnal patterns of plasma metabolites and hormones. J. Dairy Res. 2010, 77, 432–437. [Google Scholar] [CrossRef]
- Zbinden, R.S.; Falk, M.; Münger, A.; Dohme-Meier, F.; Van Dorland, H.A.; Bruckmaier, R.M.; Gross, J.J. Metabolic load in dairy cows kept in herbage-based feeding systems and suitability of potential markers for compromised well-being. J. Anim. Physiol. Anim. Nutr. 2017, 101, 767–778. [Google Scholar] [CrossRef] [PubMed]
- Taylor, V.J.; Beever, D.E.; Bryant, M.J.; Wathes, D.C. Pre-pubertal measurements of the somatotrophic axis as predictors of milk production in Holstein–Friesian dairy cows. Domest. Anim. Endocrinol. 2006, 31, 1–18. [Google Scholar] [CrossRef] [PubMed]
- Sheahan, A.J.; Boston, R.C.; Roche, J.R. Diurnal patterns of grazing behavior and humoral factors in supplemented dairy cows. J. Dairy Sci. 2013, 96, 3201–3210. [Google Scholar] [CrossRef]
- Witkowska-Sędek, E.; Pyrżak, B. Chronic inflammation and the growth hormone/insulin-like growth factor-1 axis. Cent. Eur. J. Immunol. 2020, 45, 469–475. [Google Scholar] [CrossRef]
- Clark, R. The Somatogenic Hormones and Insulin-Like Growth Factor-1: Stimulators of Lymphopoiesis and Immune Function. Endocr. Rev. 1997, 18, 157–179. [Google Scholar] [CrossRef] [PubMed]
- Heemskerk, V.H.; Daemen, M.A.R.C.; Buurman, W.A. Insulin-like growth factor-1 (IGF-1) and growth hormone (GH) in immunity and inflammation. Cytokine Growth Factor Rev. 1999, 10, 5–14. [Google Scholar] [CrossRef]
- Inoue, T.; Saito, H.; Hashiguchi, Y.; Fukatsu, K.; Inaba, T.; Lin, M.-T.; Han, L.; Furukawa, S.; Muto, T. Growth hormone and insulin-like growth factor I augment Escherichia coli-killing activity of murine peritoneal exudative cells. Shock 1996, 6, 345–350. [Google Scholar] [CrossRef]
- Wolters, T.L.C.; Netea, M.G.; Hermus, A.R.M.M.; Smit, J.W.A.; Netea-Maier, R.T. IGF1 potentiates the pro-inflammatory response in human peripheral blood mononuclear cells via MAPK. J. Mol. Endocrinol. 2017, 59, 129–139. [Google Scholar] [CrossRef]
- De Koster, J.; Salavati, M.; Grelet, C.; Crowe, M.A.; Matthews, E.; O’Flaherty, R.; Opsomer, G.; Foldager, L.; Gplus, E.; Hostens, M. Prediction of metabolic clusters in early-lactation dairy cows using models based on milk biomarkers. J. Dairy Sci. 2019, 102, 2631–2644. [Google Scholar] [CrossRef] [PubMed] [Green Version]
- Cai, T.Q.; Weston, P.G.; Lund, L.A.; Brodie, B.; McKenna, D.J.; Wagner, W.C. Association between neutrophil functions and periparturient disorders in cows. Am. J. Vet. Res. 1994, 55, 934–943. [Google Scholar] [PubMed]
- Mallard, B.A.; Dekkers, J.C.; Ireland, M.J.; Leslie, K.E.; Sharif, S.; VanKampen, C.L.; Wagter, L.; Wilkie, B.N. Alteration in immune responsiveness during the peripartum period and its ramification on dairy cow and calf health. J. Dairy Sci. 1998, 81, 585–595. [Google Scholar] [CrossRef]
- Wathes, D.C.; Cheng, Z.; Chowdhury, W.; Fenwick, M.A.; Fitzpatrick, R.; Morris, D.G.; Patton, J.; Murphy, J.J. Negative energy balance alters global gene expression and immune responses in the uterus of postpartum dairy cows. Physiol. Genom. 2009, 39, 1–13. [Google Scholar] [CrossRef]
- Crookenden, M.A.; Moyes, K.M.; Kuhn-Sherlock, B.; Lehnert, K.; Walker, C.G.; Loor, J.J.; Mitchell, M.D.; Murray, A.; Dukkipati, V.S.R.; Vailati-Riboni, M.; et al. Transcriptomic analysis of circulating neutrophils in metabolically stressed peripartal grazing dairy cows. J. Dairy Sci. 2019, 102, 7408–7420. [Google Scholar] [CrossRef]
- Zerbe, H.; Schneider, N.; Leibold, W.; Wensing, T.; Kruip, T.A.M.; Schuberth, H.J. Altered functional and immunophenotypical properties of neutrophilic granulocytes in postpartum cows associated with fatty liver. Theriogenology 2000, 54, 771–786. [Google Scholar] [CrossRef]
- Hammon, D.S.; Evjen, I.M.; Dhiman, T.R.; Goff, J.P.; Walters, J.L. Neutrophil function and energy status in Holstein cows with uterine health disorders. Vet. Immunol. Immunopathol. 2006, 113, 21–29. [Google Scholar] [CrossRef]
- McCarthy, M.M.; Yasui, T.; Felippe, M.J.B.; Overton, T.R. Associations between the degree of early lactation inflammation and performance, metabolism, and immune function in dairy cows. J. Dairy Sci. 2016, 99, 680–700. [Google Scholar] [CrossRef] [PubMed] [Green Version]
- Cheng, Z.; Wylie, A.; Ferris, C.; Ingvartsen, K.L.; Wathes, D.C.; GplusE Consortium. Effect of diet and nonesterified fatty acid levels on global transcriptomic profiles in circulating peripheral blood mononuclear cells in early lactation dairy cows. J. Dairy Sci. 2021, 104, 10059–10075. [Google Scholar] [CrossRef]
- Bernabucci, U.; Ronchi, B.; Lacetera, N.; Nardone, A. Influence of Body Condition Score on Relationships Between Metabolic Status and Oxidative Stress in Periparturient Dairy Cows. J. Dairy Sci. 2005, 88, 2017–2026. [Google Scholar] [CrossRef] [Green Version]
- Ingvartsen, K.L.; Moyes, K. Nutrition, immune function and health of dairy cattle. Animal 2013, 7, 112–122. [Google Scholar] [CrossRef] [PubMed] [Green Version]
- Loftus, R.M.; Finlay, D.K. Immunometabolism: Cellular Metabolism Turns Immune Regulator. J. Biol. Chem. 2016, 291, 1–10. [Google Scholar] [CrossRef] [Green Version]
- Walls, J.; Sinclair, L.; Finlay, D. Nutrient sensing, signal transduction and immune responses. Semin. Immunol. 2016, 28, 396–407. [Google Scholar] [CrossRef] [Green Version]
- Dimeloe, S.; Burgener, A.-V.; Grählert, J.; Hess, C. T-cell metabolism governing activation, proliferation and differentiation; a modular view. Immunology 2017, 150, 35–44. [Google Scholar] [CrossRef] [Green Version]
- Desdín-Micó, G.; Soto-Heredero, G.; Mittelbrunn, M. Mitochondrial activity in T cells. Mitochondrion 2018, 41, 51–57. [Google Scholar] [CrossRef]
- O’Neill, L.A.J.; Hardie, D.G. Metabolism of inflammation limited by AMPK and pseudo-starvation. Nature 2013, 493, 346–355. [Google Scholar] [CrossRef]
- Nonnecke, B.J.; Kimura, K.; Goff, J.P.; Kehrli, M.E., Jr. Effects of the Mammary Gland on Functional Capacities of Blood Mononuclear Leukocyte Populations from Periparturient Cows. J. Dairy Sci. 2003, 86, 2359–2368. [Google Scholar] [CrossRef]
- Ingvartsen, K.L.; Moyes, K.M. Factors contributing to immunosuppression in the dairy cow during the periparturient period. Jpn. J. Vet. Res. 2015, 63 (Suppl. S1), S15–S24. [Google Scholar]
- Gier, H.T.; Marion, G.B. Uterus of the cow after parturition: Involutional changes. Am. J. Vet. Res. 1968, 29, 83–96. [Google Scholar] [PubMed]
- Sheldon, I.M.; Lewis, G.S.; LeBlanc, S.; Gilbert, R.O. Defining postpartum uterine disease in cattle. Theriogenology 2006, 65, 1516–1530. [Google Scholar] [CrossRef] [PubMed]
- Vangroenweghe, F.; Lamote, I.; Burvenich, C. Physiology of the periparturient period and its relation to severity of clinical mastitis. Domest. Anim. Endocrinol. 2005, 29, 283–293. [Google Scholar] [CrossRef]
- Leblanc, S. Monitoring Metabolic Health of Dairy Cattle in the Transition Period. J. Reprod. Dev. 2010, 56, S29–S35. [Google Scholar] [CrossRef] [Green Version]
- Smith, G.L.; Friggens, N.C.; Ashworth, C.J.; Chagunda, M.G.G. Association between body energy content in the dry period and post-calving production disease status in dairy cattle. Animal 2017, 11, 1590–1598. [Google Scholar] [CrossRef] [Green Version]
- Ceciliani, F.; Ceron, J.J.; Eckersall, P.D.; Sauerwein, H. Acute phase proteins in ruminants. J. Proteom. 2012, 75, 4207–4231. [Google Scholar] [CrossRef]
- Brodsky, I.E.; Medzhitov, R. Targeting of immune signalling networks by bacterial pathogens. Nat. Cell Biol. 2009, 11, 521–526. [Google Scholar] [CrossRef]
- Krysko, D.V.; Agostinis, P.; Krysko, O.; Garg, A.D.; Bachert, C.; Lambrecht, B.N.; Vandenabeele, P. Emerging role of damage-associated molecular patterns derived from mitochondria in inflammation. Trends Immunol. 2011, 32, 157–164. [Google Scholar] [CrossRef]
- Ingvartsen, K.L.; Dewhurst, R.J.; Friggens, N.C. On the relationship between lactational performance and health: Is it yield or metabolic imbalance that cause production diseases in dairy cattle? A position paper. Livest. Prod. Sci. 2003, 83, 277–308. [Google Scholar] [CrossRef]
- Wathes, D.C.; Cheng, Z.; Bourne, N.; Taylor, V.J.; Coffey, M.P.; Brotherstone, S. Differences between primiparous and multiparous dairy cows in the inter-relationships between metabolic traits, milk yield and body condition score in the periparturient period. Domest. Anim. Endocrinol. 2007, 33, 203–225. [Google Scholar] [CrossRef] [PubMed] [Green Version]
- Krogh, M.A.; Hostens, M.; Salavati, M.; Grelet, C.; Sorensen, M.T.; Wathes, D.C.; Ferris, C.P.; Marchitelli, C.; Signorelli, F.; Napolitano, F.; et al. Between- and within-herd variation in blood and milk biomarkers in Holstein cows in early lactation. Animal 2020, 14, 1067–1075. [Google Scholar] [CrossRef]
- Beltman, M.E.; Forde, N.; Furney, P.; Carter, F.; Roche, J.F.; Lonergan, P.; Crowe, M.A. Characterisation of endometrial gene expression and metabolic parameters in beef heifers yielding viable or non-viable embryos on Day 7 after insemination. Reprod. Fertil. Dev. 2010, 22, 987–999. [Google Scholar] [CrossRef] [Green Version]
- Bjerre-Harpøth, V.; Storm, A.C.; Vestergaard, M.; Larsen, M.; Larsen, T. Effect of postpartum propylene glycol allocation to over-conditioned Holstein cows on concentrations of milk metabolites. J. Dairy Res. 2016, 83, 156–164. [Google Scholar] [CrossRef] [PubMed]
- Nielsen, N.I.; Larsen, T.; Bjerring, M.; Ingvartsen, K.L. Quarter Health, Milking Interval, and Sampling Time During Milking Affect the Concentration of Milk Constituents. J. Dairy Sci. 2005, 88, 3186–3200. [Google Scholar] [CrossRef] [Green Version]
- Larsen, T. Determination of lactate dehydrogenase (LDH) activity in milk by a fluorometric assay. J. Dairy Res. 2005, 72, 209–216. [Google Scholar] [CrossRef] [PubMed]
- Larsen, T.; Moyes, K.M. Fluorometric determination of uric acid in bovine milk. J. Dairy Res. 2010, 77, 438–444. [Google Scholar] [CrossRef]
- NRC. Nutrient Requirements of Dairy Cattle, 7th ed.; National Academies Press: Washington, DC, USA, 2001; Volume 1. [Google Scholar]
- Williams, E.J.; Fischer, D.P.; Pfeiffer, D.U.; England, G.C.W.; Noakes, D.E.; Dobson, H.; Sheldon, I.M. Clinical evaluation of postpartum vaginal mucus reflects uterine bacterial infection and the immune response in cattle. Theriogenology 2005, 63, 102–117. [Google Scholar] [CrossRef]
- Manson, F.J.; Leaver, J.D. The influence of concentrate amount on locomotion and clinical lameness in dairy cattle. Anim. Sci. 1988, 47, 185–190. [Google Scholar] [CrossRef]
- Beltman, M.E.; McNally, J.C.; Kelly, E.; Crowe, M.A. Relationship between plasma concentrations of IGF-I and clinical endometritis, and response to progesterone synchrony in dairy cows during early lactation. J. Dairy Sci. 2020, 103, 9493–9501. [Google Scholar] [CrossRef]
- Taylor, V.J.; Cheng, Z.; Pushpakumara, P.G.A.; Wathes, D.C.; Beever, D.E. Relationships between the plasma concentrations of insulin-like growth factor-I in dairy cows and their fertility and milk yield. Vet. Rec. 2004, 155, 583–588. [Google Scholar] [CrossRef]
- Huang, D.W.; Sherman, B.T.; Lempicki, R.A. Bioinformatics enrichment tools: Paths toward the comprehensive functional analysis of large gene lists. Nucleic Acids Res. 2009, 37, 1–13. [Google Scholar] [CrossRef] [PubMed] [Green Version]
- Huang, D.W.; Sherman, B.T.; Lempicki, R.A. Systematic and integrative analysis of large gene lists using DAVID bioinformatics resources. Nat. Protoc. 2009, 4, 44–57. [Google Scholar] [CrossRef]
- Roland, L.; Drillich, M.; Iwersen, M. Hematology as a diagnostic tool in bovine medicine. J. Vet. Diagn. Investig. 2014, 26, 592–598. [Google Scholar] [CrossRef] [Green Version]
- Berry, M.P.R.; Graham, C.; McNab, F.W.; Xu, Z.; Bloch, S.A.A.; Oni, T.; Wilkinson, K.; Banchereau, R.; Skinner, J.; Wilkinson, R.; et al. An interferon-inducible neutrophil-driven blood transcriptional signature in human tuberculosis. Nature 2010, 466, 973–977. [Google Scholar] [CrossRef] [PubMed] [Green Version]
- Blankley, S.; Berry, M.P.R.; Graham, C.M.; Bloom, C.I.; Lipman, M.; O’Garra, A. The application of transcriptional blood signatures to enhance our understanding of the host response to infection: The example of tuberculosis. Philos. Trans. R. Soc. B Biol. Sci. 2014, 369, 20130427. [Google Scholar] [CrossRef]
- Park, H.-E.; Park, H.-T.; Jung, Y.H.; Yoo, H.S. Gene expression profiles of immune-regulatory genes in whole blood of cattle with a subclinical infection of Mycobacterium avium subsp. paratuberculosis. PLoS ONE 2018, 13, e0196502. [Google Scholar] [CrossRef] [Green Version]
- Ray, D.E.; Halbach, T.J.; Armstrong, D.V. Season and Lactation Number Effects on Milk Production and Reproduction of Dairy Cattle in Arizona. J. Dairy Sci. 1992, 75, 2976–2983. [Google Scholar] [CrossRef]
- Langhans, W. Bacterial products and the control of ingestive behavior: Clinical implications. Nutrition 1996, 12, 303–315. [Google Scholar] [CrossRef]
- Johnson, R.W. Immune and endocrine regulation of food intake in sick animals. Domest. Anim. Endocrinol. 1998, 15, 309–319. [Google Scholar] [CrossRef]
- Elsasser, T.H.; Caperna, T.J.; Rumsey, T.S. Endotoxin administration decreases plasma insulin-like growth factor (IGF)-I and IGF-binding protein-2 in Angus × Hereford steers independent of changes in nutritional intake. J. Endocrinol. 1995, 144, 109–117. [Google Scholar] [CrossRef] [PubMed]
- Lyons, N.A.; Cooke, J.S.; Wilson, S.; van Winden, S.C.; Gordon, P.J.; Wathes, D.C. Relationships between metabolite and IGF1 concentrations with fertility and production outcomes following left abomasal displacement. Vet. Rec. 2014, 174, 657. [Google Scholar] [CrossRef]
- Cattaneo, L.; Lopreiato, V.; Piccioli-Cappelli, F.; Trevisi, E.; Minuti, A. Plasma albumin-to-globulin ratio before dry-off as a possible index of inflammatory status and performance in the subsequent lactation in dairy cows. J. Dairy Sci. 2021, 104, 8228–8242. [Google Scholar] [CrossRef]
- Enagy, C.; Ehaschemi, A. Time and Demand are Two Critical Dimensions of Immunometabolism: The Process of Macrophage Activation and the Pentose Phosphate Pathway. Front. Immunol. 2015, 6, 164. [Google Scholar] [CrossRef] [Green Version]
- Kelly, B.; O’Neill, L.A.J. Metabolic reprogramming in macrophages and dendritic cells in innate immunity. Cell Res. 2015, 25, 771–784. [Google Scholar] [CrossRef] [Green Version]
- Yi, Z.; Wu, Y.; Zhang, W.; Wang, T.; Gong, J.; Cheng, Y.; Miao, C. Activator-Mediated Pyruvate Kinase M2 Activation Contributes to Endotoxin Tolerance by Promoting Mitochondrial Biogenesis. Front. Immunol. 2021, 11, 595316. [Google Scholar] [CrossRef] [PubMed]
- Xie, M.; Yu, Y.; Kang, R.; Zhu, S.; Yang, L.; Zeng, L.; Sun, X.; Yang, M.; Billiar, T.R.; Wang, H.; et al. PKM2-dependent glycolysis promotes NLRP3 and AIM2 inflammasome activation. Nat. Commun. 2016, 7, 13280. [Google Scholar] [CrossRef]
- Holness, M.J.; Sugden, M.C. Regulation of pyruvate dehydrogenase complex activity by reversible phosphorylation. Biochem. Soc. Trans. 2003, 31, 1143–1151. [Google Scholar] [CrossRef] [PubMed]
- Longo, N.; Ardon, O.; Vanzo, R.; Schwartz, E.; Pasquali, M. Disorders of creatine transport and metabolism. Am. J. Med. Genet. Part C Semin. Med. Genet. 2011, 157, 72–78. [Google Scholar] [CrossRef]
- Baardman, J.; Verberk, S.G.S.; Prange, K.H.M.; van Weeghel, M.; van der Velden, S.; Ryan, D.G.; Wust, R.C.I.; Neele, A.E.; Speijer, D.; Denis, S.W.; et al. A Defective Pentose Phosphate Pathway Reduces Inflammatory Macrophage Responses during Hypercholesterolemia. Cell Rep. 2018, 25, 2044–2052.e5. [Google Scholar] [CrossRef] [PubMed] [Green Version]
- Zhao, X.; Han, Q.; Liu, Y.; Sun, C.; Gang, X.; Wang, G. The Relationship between Branched-Chain Amino Acid Related Metabolomic Signature and Insulin Resistance: A Systematic Review. J. Diabetes Res. 2016, 2016, 2794591. [Google Scholar] [CrossRef] [PubMed]
- HoleČek, M. Branched-chain amino acids in health and disease: Metabolism, alterations in blood plasma, and as supplements. Nutr. Metab. 2018, 15, 33. [Google Scholar] [CrossRef] [PubMed] [Green Version]
- Jukić, I.; Kolobarić, N.; Stupin, A.; Matić, A.; Kozina, N.; Mihaljević, Z.; Mihalj, M.; Šušnjara, P.; Stupin, M.; Ćurić, Ž.B.; et al. Carnosine, Small but Mighty—Prospect of Use as Functional Ingredient for Functional Food Formulation. Antioxidants 2021, 10, 1037. [Google Scholar] [CrossRef]
- Schnackerz, K.D.; Dobritzsch, D. Amidohydrolases of the reductive pyrimidine catabolic pathway: Purification, characteriza-tion, structure, reaction mechanisms and enzyme deficiency. Biochim. Biophys. Acta (BBA) Proteins Proteom. 2008, 1784, 431–444. [Google Scholar] [CrossRef]
- Liparulo, I.; Bergamini, C.; Bortolus, M.; Calonghi, N.; Gasparre, G.; Kurelac, I.; Masin, L.; Rizzardi, N.; Rugolo, M.; Wang, W.; et al. Coenzyme Q biosynthesis inhibition induces HIF-1α stabilization and metabolic switch toward glycolysis. FEBS J. 2021, 288, 1956–1974. [Google Scholar] [CrossRef]
- Wang, W.; Liparulo, I.; Rizzardi, N.; Bolignano, P.; Calonghi, N.; Bergamini, C.; Fato, R. Coenzyme Q Depletion Reshapes MCF-7 Cells Metabolism. Int. J. Mol. Sci. 2020, 22, 198. [Google Scholar] [CrossRef]
- Abraham, E.H.; Prat, A.G.; Gerweck, L.; Seneveratne, T.; Arceci, R.J.; Kramer, R.; Guidotti, G.; Cantiello, H.F. The multidrug resistance (mdr1) gene product functions as an ATP channel. Proc. Natl. Acad. Sci. USA 1993, 90, 312–316. [Google Scholar] [CrossRef] [Green Version]
- Giuliani, A.L.; Sarti, A.C.; Di Virgilio, F. Ectonucleotidases in Acute and Chronic Inflammation. Front. Pharmacol. 2021, 11, 619458. [Google Scholar] [CrossRef]
- Out, R.; Hoekstra, M.; Habets, K.; Meurs, I.; de Waard, V.; Hildebrand, R.B.; Wang, Y.; Chimini, G.; Kuiper, J.; Van Berkel, T.J.; et al. Combined Deletion of Macrophage ABCA1 and ABCG1 Leads to Massive Lipid Accumulation in Tissue Macrophages and Distinct Atherosclerosis at Relatively Low Plasma Cholesterol Levels. Arter. Thromb. Vasc. Biol. 2008, 28, 258–264. [Google Scholar] [CrossRef] [Green Version]
- Groenen, A.G.; Halmos, B.; Tall, A.R.; Westerterp, M. Cholesterol efflux pathways, inflammation, and atherosclerosis. Crit. Rev. Biochem. Mol. Biol. 2021, 56, 426–439. [Google Scholar] [CrossRef] [PubMed]
- Bottazzi, B.; Inforzato, A.; Messa, M.; Barbagallo, M.; Magrini, E.; Garlanda, C.; Mantovani, A. The pentraxins PTX3 and SAP in innate immunity, regulation of inflammation and tissue remodelling. J. Hepatol. 2016, 64, 1416–1427. [Google Scholar] [CrossRef] [Green Version]
- Lutzow, Y.C.S.; Donaldson, L.; Gray, C.P.; Vuocolo, T.; Pearson, R.D.; Reverter, A.; Byrne, K.A.; Sheehy, P.A.; Windon, R.; Tellam, R.L. Identification of immune genes and proteins involved in the response of bovine mammary tissue to Staphylococcus aureus infection. BMC Vet. Res. 2008, 4, 18. [Google Scholar] [CrossRef] [PubMed] [Green Version]
- Genís, S.; Arís, A.; Kaur, M.; Cerri, R.L.A. Effect of metritis on endometrium tissue transcriptome during puerperium in Holstein lactating cows. Theriogenology 2018, 122, 116–123. [Google Scholar] [CrossRef] [Green Version]
- Leito, J.T.; Ligtenberg, A.J.; Nazmi, K.; De Blieck-Hogervorst, J.M.; Veerman, E.C.; Amerongen, A.V.N. A common binding motif for various bacteria of the bacteria-binding peptide SRCRP2 of DMBT1/gp-340/salivary agglutinin. Biol. Chem. 2008, 389, 1193–1200. [Google Scholar] [CrossRef]
- Reichhardt, M.P.; Holmskov, U.; Meri, S. SALSA—A dance on a slippery floor with changing partners. Mol. Immunol. 2017, 89, 100–110. [Google Scholar] [CrossRef] [Green Version]
- Müller, H.; Hu, J.; Popp, R.; Schmidt, M.H.H.; Müller-Decker, K.; Mollenhauer, J.; Fisslthaler, B.; Eble, J.A.; Fleming, I. Deleted in Malignant Brain Tumors 1 is Present in the Vascular Extracellular Matrix and Promotes Angiogenesis. Arter. Thromb. Vasc. Biol. 2012, 32, 442–448. [Google Scholar] [CrossRef] [PubMed] [Green Version]
- Kligman, D.; Hilt, D.C. The S100 protein family. Trends Biochem. Sci. 1988, 13, 437–443. [Google Scholar] [CrossRef]
- Sohnle, P.G.; Hunter, M.J.; Hahn, B.; Chazin, W.J. Zinc-Reversible Antimicrobial Activity of Recombinant Calprotectin (Migration Inhibitory Factor–Related Proteins 8 and 14). J. Infect. Dis. 2000, 182, 1272–1275. [Google Scholar] [CrossRef]
- Thorey, I.S.; Roth, J.; Regenbogen, J.; Halle, J.-P.; Bittner, M.; Vogl, T.; Kaesler, S.; Bugnon, P.; Reitmaier, B.; Durka, S.; et al. The Ca2+-binding Proteins S100A8 and S100A9 Are Encoded by Novel Injury-regulated Genes. J. Biol. Chem. 2001, 276, 35818–35825. [Google Scholar] [CrossRef] [PubMed] [Green Version]
- Foell, D.; Wittkowski, H.; Vogl, T.; Roth, J. S100 proteins expressed in phagocytes: A novel group of damage-associated molecular pattern molecules. J. Leukoc. Biol. 2007, 81, 28–37. [Google Scholar] [CrossRef]
- Ehrchen, J.M.; Sunderkötter, C.; Foell, D.; Vogl, T.; Roth, J. The endogenous Toll-like receptor 4 agonist S100A8/S100A9 (calprotectin) as innate amplifier of infection, autoimmunity, and cancer. J. Leukoc. Biol. 2009, 86, 557–566. [Google Scholar] [CrossRef] [PubMed]
- Ibrahim, M.; Peter, S.; Gärtner, M.A.; Michel, G.; Jung, M.; Einspanier, R.; Gabler, C. Increased mRNA expression of selected antimicrobial peptides around ovulation and during inflammatory processes in the bovine endometrium postpartum. Theriogenology 2016, 86, 2040–2053. [Google Scholar] [CrossRef] [PubMed]
- Swangchan-Uthai, T.; Lavender, C.R.; Cheng, Z.; Fouladi-Nashta, A.A.; Wathes, D.C. Time Course of Defense Mechanisms in Bovine Endometrium in Response to Lipopolysaccharide. Biol. Reprod. 2012, 87, 135. [Google Scholar] [CrossRef] [PubMed]
- Swangchan-Uthai, T.; Chen, Q.; Kirton, S.E.; Fenwick, M.A.; Cheng, Z.; Patton, J.; Fouladi-Nashta, A.A.; Wathes, D.C. Influence of energy balance on the antimicrobial peptides S100A8 and S100A9 in the endometrium of the post-partum dairy cow. Reproduction 2013, 145, 527–539. [Google Scholar] [CrossRef] [PubMed]
- Selsted, M.E.; Tang, Y.Q.; Morris, W.L.; McGuire, P.A.; Novotny, M.J.; Smith, W.; Henschen, A.H.; Cullor, J.S. Purification, primary structures, and antibacterial activities of beta-defensins, a new family of antimicrobial peptides from bovine neu-trophils. J. Biol. Chem. 1993, 268, 6641–6648. [Google Scholar] [CrossRef]
- Hilchie, A.L.; Wuerth, K.; Hancock, R.E. Immune modulation by multifaceted cationic host defense (antimicrobial) peptides. Nat. Chem. Biol. 2013, 9, 761–768. [Google Scholar] [CrossRef] [PubMed]
- Yang, D.; Oppenheim, J.J. Alarmins and antimicrobial immunity. Med. Mycol. 2009, 47, S146–S153. [Google Scholar] [CrossRef] [Green Version]
- Gurao, A.; Kashyap, S.K.; Singh, R. β-defensins: An innate defense for bovine mastitis. Vet. World 2017, 10, 990–998. [Google Scholar] [CrossRef] [Green Version]
- Isobe, N. Control mechanisms for producing antimicrobial factors in ruminant mammary gland. Anim. Sci. J. 2017, 88, 937–943. [Google Scholar] [CrossRef] [Green Version]
- Crookenden, M.A.; Walker, C.G.; Heiser, A.; Murray, A.; Dukkipati, V.S.R.; Kay, J.K.; Meier, S.; Moyes, K.M.; Mitchell, M.D.; Loor, J.J.; et al. Effects of precalving body condition and prepartum feeding level on gene expression in circulating neutrophils. J. Dairy Sci. 2017, 100, 2310–2322. [Google Scholar] [CrossRef] [Green Version]
- Gupta, S.K.; Haigh, B.J.; Seyfert, H.-M.; Griffin, F.J.; Wheeler, T.T. Bovine milk RNases modulate pro-inflammatory responses induced by nucleic acids in cultured immune and epithelial cells. Dev. Comp. Immunol. 2017, 68, 87–97. [Google Scholar] [CrossRef]
- Alnakip, M.; Quintela-Baluja, M.; Böhme, K.; Fernandezno, I.C.; Caamaño-Antelo, S.; Calo-Mata, P.; Barros-Velázquez, J. The Immunology of Mammary Gland of Dairy Ruminants between Healthy and Inflammatory Conditions. J. Veter-Med. 2014, 2014, 659801. [Google Scholar] [CrossRef] [Green Version]
- Abdelmegid, S.; Kelton, D.; Caswell, J.; Kirby, G. Proteomic 2D-DIGE Analysis of Milk Whey from Dairy Cows with Staphylococcus aureus Mastitis Reveals Overexpression of Host Defense Proteins. Microorganisms 2020, 8, 1883. [Google Scholar] [CrossRef]
- Weinberg, E.D. The hazards of iron loading. Metallomics 2010, 2, 732–740. [Google Scholar] [CrossRef] [Green Version]
- Montalbetti, N.; Simonin, A.; Kovacs, G.; Hediger, M.A. Mammalian iron transporters: Families SLC11 and SLC40. Mol. Aspects Med. 2013, 34, 270–287. [Google Scholar] [CrossRef] [PubMed]
- Weinberg, E.D. Iron and infection. Microbiol. Rev. 1978, 42, 45–66. [Google Scholar] [CrossRef]
- Zarzosa-Moreno, D.; Avalos-Gómez, C.; Ramírez-Texcalco, L.S.; Torres-López, E.; Ramírez-Mondragón, R.; Hernández-Ramírez, J.O.; Serrano-Luna, J.; De La Garza, M. Lactoferrin and Its Derived Peptides: An Alternative for Combating Virulence Mechanisms Developed by Pathogens. Molecules 2020, 25, 5763. [Google Scholar] [CrossRef]
- Brunyanszki, A.; Erdelyi, K.; Szczesny, B.; Olah, G.; Salomao, R.; Herndon, D.N.; Szabo, C. Upregulation and Mitochondrial Sequestration of Hemoglobin Occur in Circulating Leukocytes during Critical Illness, Conferring a Cytoprotective Phenotype. Mol. Med. 2015, 21, 666–675. [Google Scholar] [CrossRef] [PubMed]
- King, A.J.; Songdej, D.; Downes, D.J.; A Beagrie, R.; Liu, S.; Buckley, M.; Hua, P.; Suciu, M.C.; Oudelaar, A.M.; Hanssen, L.L.P.; et al. Reactivation of a developmentally silenced embryonic globin gene. Nat. Commun. 2021, 12, 4439. [Google Scholar] [CrossRef] [PubMed]
- Leite, G.G.F.; Scicluna, B.P.; Van Der Poll, T.; Salomão, R. Genetic signature related to heme-hemoglobin metabolism pathway in sepsis secondary to pneumonia. NPJ Syst. Biol. Appl. 2019, 5, 26. [Google Scholar] [CrossRef] [Green Version]
- Yun, S.-H.; Sim, E.-H.; Goh, R.-Y.; Park, J.-I.; Han, J.-Y. Platelet Activation: The Mechanisms and Potential Biomarkers. BioMed Res. Int. 2016, 2016, 9060143. [Google Scholar] [CrossRef] [PubMed] [Green Version]
- Trevisi, E.; Zecconi, A.; Bertoni, G.; Piccinini, R. Blood and milk immune and inflammatory profiles in periparturient dairy cows showing a different liver activity index. J. Dairy Res. 2010, 77, 310–317. [Google Scholar] [CrossRef] [PubMed]
- Kra, G.; Nemes-Navon, N.; Daddam, J.R.; Livshits, L.; Jacoby, S.; Levin, Y.; Zachut, M.; Moallem, U. Proteomic analysis of peripheral blood mononuclear cells and inflammatory status in postpartum dairy cows supplemented with different sources of omega-3 fatty acids. J. Proteom. 2021, 246, 104313. [Google Scholar] [CrossRef] [PubMed]
- Sun, Y.; Sheshadri, N.; Zong, W.-X. SERPINB3 and B4: From biochemistry to biology. Semin. Cell Dev. Biol. 2017, 62, 170–177. [Google Scholar] [CrossRef] [Green Version]
- Yaron, J.R.; Zhang, L.; Guo, Q.; Haydel, S.E.; Lucas, A.R. Fibrinolytic Serine Proteases, Therapeutic Serpins and Inflammation: Fire Dancers and Firestorms. Front. Cardiovasc. Med. 2021, 8, 648947. [Google Scholar] [CrossRef]
- Quilliam, L.A.; Rebhun, J.F.; Castro, A.F. A growing family of guanine nucleotide exchange factors is responsible for activation of ras-family GTPases. Prog. Nucleic Acid Res. Mol. Biol. 2002, 71, 391–444. [Google Scholar] [CrossRef] [PubMed]
- Lee, J.; Lee, S.; Son, J.; Lim, H.; Kim, E.; Kim, D.; Ha, S.; Hur, T.; Lee, S.; Choi, I. Analysis of circulating-microRNA expression in lactating Holstein cows under summer heat stress. PLoS ONE 2020, 15, e0231125. [Google Scholar] [CrossRef]
- Zenobi, M.G.; Gardinal, R.; Zuniga, J.E.; Mamedova, L.K.; Driver, J.P.; Barton, B.A.; Santos, J.E.P.; Staples, C.R.; Nelson, C.D. Effect of prepartum energy intake and supplementation with ruminally protected choline on innate and adaptive immunity of multiparous Holstein cows. J. Dairy Sci. 2020, 103, 2200–2216. [Google Scholar] [CrossRef]
- Bradford, B.J.; Mamedova, L.K.; Minton, J.E.; Drouillard, J.S.; Johnson, B.J. Daily Injection of Tumor Necrosis Factor-α Increases Hepatic Triglycerides and Alters Transcript Abundance of Metabolic Genes in Lactating Dairy Cattle. J. Nutr. 2009, 139, 1451–1456. [Google Scholar] [CrossRef] [PubMed] [Green Version]
- Muñoz-Garcia, J.; Cochonneau, D.; Télétchéa, S.; Moranton, E.; Lanoe, D.; Brion, R.; Lézot, F.; Heymann, M.-F.; Heymann, D. The twin cytokines interleukin-34 and CSF-1: Masterful conductors of macrophage homeostasis. Theranostics 2021, 11, 1568–1593. [Google Scholar] [CrossRef] [PubMed]
- Ellis, S.A.; Ballingall, K.T. Cattle MHC: Evolution in action? Immunol. Rev. 1999, 167, 159–168. [Google Scholar] [CrossRef] [PubMed]
- Furukawa, A.; Wisel, S.A.; Tang, Q. Impact of Immune-Modulatory Drugs on Regulatory T Cell. Transplantation 2016, 100, 2288–2300. [Google Scholar] [CrossRef] [PubMed] [Green Version]
- Willis, S.N.; Tellier, J.; Liao, Y.; Trezise, S.; Light, A.; O’Donnell, K.; Garrett-Sinha, L.A.; Shi, W.; Tarlinton, D.M.; Nutt, S.L. Environmental sensing by mature B cells is controlled by the transcription factors PU.1 and SpiB. Nat. Commun. 2017, 8, 1426. [Google Scholar] [CrossRef] [PubMed]
- Aiba, Y.; Yamazaki, T.; Okada, T.; Gotoh, K.; Sanjo, H.; Ogata, M.; Kurosaki, T. BANK Negatively Regulates Akt Activation and Subsequent B Cell Responses. Immunity 2006, 24, 259–268. [Google Scholar] [CrossRef] [PubMed] [Green Version]
- Altin, J.G.; Sloan, E.K. The role of CD45 and CD45-associated molecules in T cell activation. Immunol. Cell Biol. 1997, 75, 430–445. [Google Scholar] [CrossRef]
- Maity, P.C.; Blount, A.; Jumaa, H.; Ronneberger, O.; Lillemeier, B.F.; Reth, M. B cell antigen receptors of the IgM and IgD classes are clustered in different protein islands that are altered during B cell activation. Sci. Signal. 2015, 8, ra93. [Google Scholar] [CrossRef]
- Holdbrooks, A.T.; Ankenbauer, K.E.; Hwang, J.; Bellis, S.L. Regulation of inflammatory signaling by the ST6Gal-I sialyltransferase. PLoS ONE 2020, 15, e0241850. [Google Scholar] [CrossRef]
- Hennet, T.; Chui, D.; Paulson, J.C.; Marth, J.D. Immune regulation by the ST6Gal sialyltransferase. Proc. Natl. Acad. Sci. USA 1998, 95, 4504–4509. [Google Scholar] [CrossRef] [Green Version]
- Joachimiak, E.; Osinka, A.; Farahat, H.; Świderska, B.; Sitkiewicz, E.; Poprzeczko, M.; Fabczak, H.; Wloga, D. Composition and function of the C1b/C1f region in the ciliary central apparatus. Sci. Rep. 2021, 11, 11760. [Google Scholar] [CrossRef]
- Wannemacher, K.M.; Wang, L.; Zhu, L.; Brass, L.F. The role of semaphorins and their receptors in platelets: Lessons learned from neuronal and immune synapses. Platelets 2011, 22, 461–465. [Google Scholar] [CrossRef] [PubMed]
- Alto, L.T.; Terman, J.R. Semaphorins and their signaling mechanisms. In Semaphorin Signaling; Terman, J.R., Ed.; Methods in Molecular Biology; Humana Press: New York, NY, USA, 2017; Volume 1493, pp. 1–25. ISBN 978-1-4939-6448-2. [Google Scholar] [CrossRef] [Green Version]
- Koivisto, O.; Hanel, A.; Carlberg, C. Key Vitamin D Target Genes with Functions in the Immune System. Nutrients 2020, 12, 1140. [Google Scholar] [CrossRef] [Green Version]
- Rivière, T.; Bader, A.; Pogoda, K.; Walzog, B.; Maier-Begandt, D. Structure and Emerging Functions of LRCH Proteins in Leukocyte Biology. Front. Cell Dev. Biol. 2020, 8, 584134. [Google Scholar] [CrossRef] [PubMed]
- Tur-Gracia, S.; Martinez-Quiles, N. Emerging functions of cytoskeletal proteins in immune diseases. J. Cell Sci. 2021, 134, jcs253534. [Google Scholar] [CrossRef]
- Schaks, M.; Giannone, G.; Rottner, K. Actin dynamics in cell migration. Essays Biochem. 2019, 63, 483–495. [Google Scholar] [CrossRef] [PubMed] [Green Version]
- Reymann, A.-C.; Boujemaa-Paterski, R.; Martiel, J.-L.; Guérin, C.; Cao, W.; Chin, H.F.; De La Cruz, E.M.; Théry, M.; Blanchoin, L. Actin Network Architecture Can Determine Myosin Motor Activity. Science 2012, 336, 1310–1314. [Google Scholar] [CrossRef] [PubMed] [Green Version]
- Cummins, S.B.; Waters, S.M.; Evans, A.C.O.; Lonergan, P.; Butler, S.T. Genetic merit for fertility traits in Holstein cows: III. Hepatic expression of somatotropic axis genes during pregnancy and lactation. J. Dairy Sci. 2012, 95, 3711–3721. [Google Scholar] [CrossRef] [PubMed] [Green Version]
- Cummins, S.B.; Lonergan, P.; Evans, A.C.O.; Berry, D.P.; Evans, R.D.; Butler, S.T. Genetic merit for fertility traits in Holstein cows: I. Production characteristics and reproductive efficiency in a pasture-based system. J. Dairy Sci. 2012, 95, 1310–1322. [Google Scholar] [CrossRef] [PubMed]
- Wathes, D.C.; Cheng, Z.; Fenwick, M.A.; Fitzpatrick, R.; Patton, J. Influence of energy balance on the somatotrophic axis and matrix metalloproteinase expression in the endometrium of the postpartum dairy cow. Reproduction 2011, 141, 269–281. [Google Scholar] [CrossRef] [Green Version]
- Fortune, J.E.; Rivera, G.M.; Evans, A.C.O.; Turzillo, A.M. Differentiation of Dominant Versus Subordinate Follicles in Cattle. Biol. Reprod. 2001, 65, 648–654. [Google Scholar] [CrossRef]
- Wathes, D.C.; Fenwick, M.; Cheng, Z.; Bourne, N.; Llewellyn, S.; Morris, D.G.; Kenny, D.; Murphy, J.; Fitzpatrick, R. Influence of negative energy balance on cyclicity and fertility in the high producing dairy cow. Theriogenology 2007, 68, S232–S241. [Google Scholar] [CrossRef] [PubMed]
- Beam, S.W.; Butler, W.R. Energy Balance and Ovarian Follicle Development Prior to the First Ovulation Postpartum in Dairy Cows Receiving Three Levels of Dietary Fat. Biol. Reprod. 1997, 56, 133–142. [Google Scholar] [CrossRef] [Green Version]
- Pushpakumara, P.G.A.; Gardner, N.H.; Reynolds, C.K.; Beever, D.E.; Wathes, D.C. Relationships between transition period diet, metabolic parameters and fertility in lactating dairy cows. Theriogenology 2003, 60, 1165–1185. [Google Scholar] [CrossRef]
- Patton, J.; Kenny, D.A.; McNamara, S.; Mee, J.F.; O’Mara, F.P.; Diskin, M.G.; Murphy, J.J. Relationships Among Milk Production, Energy Balance, Plasma Analytes, and Reproduction in Holstein-Friesian Cows. J. Dairy Sci. 2007, 90, 649–658. [Google Scholar] [CrossRef] [Green Version]
- Piechotta, M.; Mysegades, W.; Ligges, U.; Lilienthal, J.; Hoeflich, A.; Miyamoto, A.; Bollwein, H. Antepartal insulin-like growth factor 1 and insulin-like growth factor binding protein 2 concentrations are indicative of ketosis in dairy cows. J. Dairy Sci. 2015, 98, 3100–3109. [Google Scholar] [CrossRef] [PubMed] [Green Version]
- Dickinson, S.E.; Griffin, B.A.; Elmore, M.F.; Kriese-Anderson, L.; Elmore, J.B.; Dyce, P.W.; Rodning, S.P.; Biase, F.H. Transcriptome profiles in peripheral white blood cells at the time of artificial insemination discriminate beef heifers with different fertility potential. BMC Genom. 2018, 19, 129. [Google Scholar] [CrossRef] [Green Version]
- LeBlanc, S.J.; Lissemore, K.D.; Kelton, D.F.; Duffield, T.F.; Leslie, K.E. Major advances in disease prevention in dairy cattle. J. Dairy Sci. 2006, 89, 1267–1279. [Google Scholar] [CrossRef] [Green Version]


| IGF-1 Group (ng/mL) | ||||
|---|---|---|---|---|
| LOW < 35 | MOD 35–100 | HIGH > 100 | p ‡ | |
| Week 1 | ||||
| n | 32 | 84 | 38 | |
| Lactation No. | 3.9 ± 0.27 b | 3.2 ± 0.11 a | 2.6 ± 0.17 a | <0.001 |
| Milk yield (kg/d) | 29.2 ± 1.32 | 31.0 ± 0.76 | 31.7 ± 0.67 | 0.21 # |
| Fat (F%) | 4.9 ± 0.20 | 4.8 ± 0.12 | 4.5 ± 0.10 | 0.40 |
| Protein (Pr%) | 3.5 ± 0.08 a | 3.5 ± 0.04 a | 3.9 ± 0.05 b | <0.001 |
| F:Pr | 1.4 ± 0.06 b | 1.4 ± 0.04 b | 1.2 ± 0.03 a | 0.002 |
| Lactose (%) | 4.5 ± 0.05 a | 4.5 ± 0.02 ab | 4.6 ± 0.03 b | 0.026 |
| Week 2 | ||||
| n | 32 | 82 | 31 | |
| Milk yield (kg/d) | 30.2 ± 1.24 b | 33.3 ± 0.79 ab | 36.6 ± 1.13 b | 0.001 |
| Fat (F%) | 4.4 ± 0.14 | 4.5 ± 0.11 | 4.2 ± 0.15 | 0.23 |
| Protein (Pr%) | 3.1 ± 0.05 a | 3.2 ± 0.03 a | 3.4 ± 0.05 b | <0.001 |
| F:Pr | 1.4 ± 0.04 b | 1.4 ± 0.04 b | 1.2 ± 0.03 a | 0.009 |
| Lactose (%) | 4.6 ± 0.04 a | 4.7 ± 0.02 a | 4.8 ± 0.03 b | 0.014 |
| IGF-1 Group (ng/mL) | ||||
|---|---|---|---|---|
| Parameter † | LOW < 35 | MOD 35–100 | HIGH > 100 | p * |
| Blood | ||||
| n | 34 | 88 | 41 | |
| IGF-1 (ng/mL) | 25 ± 1.3 a | 63 ± 1.9 b | 143 ± 5.3 c | <0.001 |
| Glucose (mM) | 3.2 ± 0.07 a | 3.3 ± 0.06 a | 3.5 ± 0.07 b | 0.005 |
| Fructosamine (μM) | 246 ± 3.0 a | 247 ± 2.0 a | 258 ± 2.7 b | 0.003 |
| BHB (μM) | 0.79 ± 0.082 | 0.75 ± 0.077 | 0.52 ± 0.044 | 0.082 |
| NEFA (µekv/L) | 884 ± 82 b | 740 ± 47 ab | 633 ± 57 a | 0.046 |
| Urea (mM) | 3.0 ± 0.22 a | 2.9 ± 0.12 a | 3.7 ± 0.21 b | 0.004 |
| Milk | ||||
| n | 32 | 83 | 41 | |
| Glucose-6-phosphate (mM) | 0.19 ± 0.010 | 0.18 ± 0.007 | 0.20 ± 0.009 | 0.080 |
| Free glucose (mM) | 0.16 ± 0.011 a | 0.18 ± 0.007 a | 0.26 ± 0.017 b | <0.001 # |
| BHB (μM) | 77.9 ± 9.71 b | 67.4 ± 5.11 ab | 46.7 ± 3.28 a | <0.001 # |
| Isocitrate (mM) | 0.20 ± 0.009 b | 0.18 ± 0.006 ab | 0.17 ± 0.006 a | 0.045 |
| Urea (mM) | 2.83 ± 0.229 ab | 2.90 ± 0.150 a | 3.53 ± 0.242 b | 0.041 |
| Uric acid (μM) | 161 ± 10.7 a | 155 ± 6.7 a | 194 ± 5.9 b | 0.004 # |
| NAGase (units/L) | 2.56 ± 0.194 | 2.66 ± 0.290 | 2.15 ± 0.152 | 0.428 |
| LDH (units/L) | 4.39 ± 0.658 | 4.54 ± 0.664 | 2.84 ± 0.222 | 0.485 # |
| Feed intake and Energy Balance | ||||
| n | 18 | 61 | 38 | |
| Weight (kg, 7 day average) | 671 ± 18.9 | 670 ± 9.5 | 657 ± 10.4 | 0.288 |
| DMI (kg/d, 7 day average) | 16.4 ± 0.60 a | 18.5 ± 0.38 b | 19.8 ± 0.54 b | 0.001 |
| EB (MJoule/d 7 d average) | −10.7 ± 1.51 b | −7.5 ± 0.70 ab | −5.0 ± 1.09 a | 0.005 |
| IGF-1 Group (ng/mL) | ||||
|---|---|---|---|---|
| LOW < 35 | MOD 35–100 | HIGH > 100 | p (χ2) | |
| n | 35 | 92 | 43 | |
| Assisted calving | 6 (17.1%) | 7 (7.6%) | 7 (16.3%) | 0.187 |
| Twins | 4 (11.4%) | 6 (6.5%) | 1 (2.3% | 0.267 |
| Stillbirth | 0 (0%) | 2 (2.2%) | 1 (2.3%) | 0.672 |
| Retained placenta | 4 (11.4%) | 5 (5.4%) | 6 (13.9%) | 0.221 |
| Milk fever | 2 (5.7%) | 0 (0%) | 0 (0%) | 0.020 |
| Displaced abomasum | 4 (11.4%) | 2 (2.2%) | 0 (0%) | 0.014 |
| Lame # | 10 (28.6%) | 27 (29.3%) | 13 (30.2%) | 0.987 |
| Gene Symbol | Gene Name | FC ‡ | p(BH) |
|---|---|---|---|
| Up-regulated genes in LOW IGF-1 cows, ranked by fold change | |||
| PTX3 | Pentraxin 3 | 28.9 | <0.001 |
| DMBT1 | Deleted in malignant brain tumors 1 | 16.2 | <0.001 |
| ALB | Albumin | 12.5 | 0.001 |
| LOC112445470 | Serpin B4-like | 10.0 | <0.001 |
| FGA | Fibrinogen alpha chain | 9.95 | 0.006 |
| KRT1 | Keratin 1 | 9.37 | 0.010 |
| LOC100297334 | Armadillo repeat containing X-linked 6 | 9.07 | 0.005 |
| LOC511106 | Serpin peptidase inhibitor, clade B like | 9.06 | <0.001 |
| TF | Transferrin | 9.02 | 0.008 |
| LOC107131803 | Serpin B3-like | 8.84 | <0.001 |
| Up-regulated genes in LOW IGF-1 cows, ranked by FDR p-value # | |||
| PTX3 | Pentraxin 3 | 28.9 | <0.001 |
| DMBT1 | Deleted in malignant brain tumors 1 | 16.2 | <0.001 |
| ZCCHC14 | Zinc finger CCHC-type containing 14 | 1.48 | <0.001 |
| ATP13A3 | ATPase 13A3 | 1.41 | <0.001 |
| NRG1 | Neuregulin 1 | 2.03 | <0.001 |
| DCSTAMP | Dendrocyte expressed seven transmembrane protein | 2.70 | <0.001 |
| GATM | Glycine amidinotransferase | 1.83 | <0.001 |
| PROK2 | Prokineticin 2 | 3.02 | <0.001 |
| DGKH | Diacylglycerol kinase eta | 1.74 | <0.001 |
| PDK4 | Pyruvate dehydrogenase kinase 4 | 2.10 | <0.001 |
| Up-regulated genes in LOW IGF-1 cows, ranked by RPKM values # | |||
| S100A12 | S100 calcium-binding protein A12 | 1.57 | <0.001 |
| S100A8 | S100 calcium-binding protein A8 | 1.71 | <0.001 |
| S100A9 | S100 calcium-binding protein A9 | 1.93 | <0.001 |
| HP | Haptoglobin | 2.16 | <0.001 |
| RNASE6 | Ribonuclease A family member k6 | 1.23 | 0.028 |
| TSPO | Translocator protein | 1.21 | 0.022 |
| PKM | Pyruvate kinase M1/2 | 1.26 | <0.001 |
| CTSB | Cathepsin B | 1.23 | 0.008 |
| TALDO1 | Transaldolase 1 | 1.28 | <0.001 |
| C10H15orf48 | Chromosome 10 open reading frame, human C15orf48 | 1.29 | 0.003 |
| Gene Symbol | Gene Name | FC ‡ | p(BH) |
|---|---|---|---|
| Down-regulated genes in LOW IGF-1 cows, ranked by fold change | |||
| HBZ | Hemoglobin subunit zeta | −7.95 | 0.001 |
| LOC112449072 | Multidrug resistance-associated protein 4-like | −6.85 | <0.001 |
| SEMA6B | Semaphorin 6B | −6.45 | 0.001 |
| LOC112441635 | DNA-directed RNA polymerase III subunit RPC9-like | −5.88 | 0.028 |
| MYH6 | Myosin, heavy chain 6, cardiac muscle, alpha | −5.52 | 0.011 |
| DMTN | Dematin actin-binding protein | −3.79 | 0.005 |
| C14H8orf88 | Chromosome 14 C8orf88 homolo | −3.15 | 0.029 |
| ALAS2 | 5′-aminolevulinate synthase 2 | −3.04 | <0.001 |
| REM1 | RRAD and GEM like GTPase 1 | −2.91 | 0.027 |
| LOC100847574 | Multidrug resistance-associated protein 4-like | −2.88 | <0.001 |
| Down-regulated genes in LOW IGF-1 cows, ranked by FDR p-value # | |||
| LBH | Limb bud and heart development | −1.32 | <0.001 |
| COQ2 | Coenzyme Q2, polyprenyltransferase | −1.26 | <0.001 |
| LOC112449072 | Multidrug resistance-associated protein 4-like | −6.85 | <0.001 |
| P2RY10 | P2Y receptor family member 10 | −1.23 | <0.001 |
| MYLIP | Myosin regulatory light chain interacting protein(MYLIP) | −1.24 | <0.001 |
| PLXDC1 | Plexin domain containing 1 | −1.57 | <0.001 |
| ST6GAL1 | ST6 beta-galactoside alpha-2,6-sialyltransferase 1 | −1.22 | <0.001 |
| ARPC5L | Actin related protein 2/3 complex subunit 5-like amyloid beta precursor-like protein 1(APLP1) | −1.23 | <0.001 |
| CXXC5 | CXXC finger protein 5 | −1.36 | <0.001 |
| BCAT2 | Branched-chain amino acid transaminase 2(BCAT2) | −1.33 | <0.001 |
| Down-regulated genes LOW IGF-1 cows, ranked by RPKM values # | |||
| BLA-DQB | MHC class II antigen | −1.20 | 0.014 |
| CD52 | CD52 molecule | −1.22 | <0.001 |
| MS4A1 | Membrane spanning 4-domains A1 | −1.25 | 0.006 |
| KIAA0040 | KIAA0040 | −1.23 | 0.008 |
| LTB | Lymphotoxin beta | −1.21 | 0.003 |
| LBH | Limb bud and heart development | −1.32 | <0.001 |
| SPIB | Spi-B transcription factor | −1.24 | 0.014 |
| BANK1 | B cell scaffold protein with ankyrin repeats 1 | −1.25 | 0.003 |
| PTPRCAP | Protein tyrosine phosphatase, receptor type C-associated protein (PTPRCAP) | −1.21 | 0.001 |
| CD79B | CD79B molecule | −1.27 | 0.008 |
| Category # | Term | Count | Fold Enrich | p(BH) |
|---|---|---|---|---|
| Annotation Cluster 1: Enrichment Score: 7.69 | ||||
| UP_SEQ_FEATURE | Disulfide bond | 85 | 2.37 | 3.60 × 10⁻¹² |
| UP_SEQ_FEATURE | Glycosylation site:N-linked (GlcNAc...) | 93 | 2.18 | 1.01 × 10⁻¹¹ |
| UP_KEYWORDS | Disulfide bond | 154 | 1.85 | 1.33 × 10⁻¹¹ |
| UP_SEQ_FEATURE | Signal peptide | 88 | 2.01 | 4.37 × 10⁻⁹ |
| UP_KEYWORDS | Glycoprotein | 104 | 1.77 | 1.29 × 10⁻⁶ |
| UP_SEQ_FEATURE | Topological domain:Extracellular | 48 | 2.06 | 3.61 × 10⁻⁴ |
| UP_SEQ_FEATURE | Topological domain:Cytoplasmic | 57 | 1.73 | 0.005 |
| UP_SEQ_FEATURE | Transmembrane region | 79 | 1.44 | 0.047 |
| UP_KEYWORDS | Secreted | 66 | 1.50 | 0.029 |
| Annotation Cluster 2: Enrichment Score: 4.95 | ||||
| UP_KEYWORDS | Transmembrane helix | 318 | 1.27 | 3.00 × 10⁻⁵ |
| UP_KEYWORDS | Transmembrane | 318 | 1.26 | 3.39 × 10⁻⁵ |
| UP_KEYWORDS | Membrane | 354 | 1.23 | 5.02 × 10⁻⁵ |
| Annotation Cluster 3: Enrichment Score: 3.84 | ||||
| GOTERM_MF_DIRECT | GO:0005044~scavenger receptor activity | 12 | 4.66 | 0.026 |
| INTERPRO | IPR001190:Speract/scavenger receptor | 9 | 5.55 | 0.048 |
| INTERPRO | IPR017448:Speract/scavenger receptor related | 9 | 5.21 | 0.048 |
| SMART | SM00202:SR | 9 | 4.82 | 0.027 |
| Annotation Cluster 4: Enrichment Score: 3.38 | ||||
| GOTERM_BP_DIRECT | GO:0042742~defense response to bacterium | 17 | 3.85 | 0.008 |
| INTERPRO | IPR006080:Beta defensin/Neutrophil defensin | 6 | 9.56 | 0.048 |
| UP_KEYWORDS | Antimicrobial | 11 | 4.01 | 0.012 |
| SMART | SM00048:DEFSN | 6 | 8.31 | 0.027 |
| Annotation Cluster 5: Enrichment Score: 2.77 | ||||
| UP_KEYWORDS | Inflammatory response | 12 | 3.88 | 0.009 |
| UP_KEYWORDS | Innate immunity | 15 | 3.02 | 0.013 |
| UP_KEYWORDS | Immunity | 19 | 2.34 | 0.029 |
| Term | Gene Count | Fold Enrich | p(BH) |
|---|---|---|---|
| bta04611:Platelet activation | 24 | 3.61 | 3.23 × 10⁻⁵ |
| bta04640:Hematopoietic cell lineage | 19 | 3.95 | 1.19 × 10⁻⁴ |
| bta04610:Complement and coagulation cascades | 16 | 4.13 | 4.09 × 10⁻⁴ |
| bta04060:Cytokine–cytokine receptor interaction | 26 | 2.28 | 0.010 |
| bta04015:Rap1 signaling pathway | 23 | 2.05 | 0.064 |
| bta04978:Mineral absorption | 9 | 3.91 | 0.064 |
| bta04512:ECM-receptor interaction | 13 | 2.86 | 0.064 |
| Term | Gene Count | Fold Enrich | p(BH) |
|---|---|---|---|
| bta01100:Metabolic pathways | 44 | 2.72 | 1.78 × 10⁻⁸ |
| bta01230:Biosynthesis of amino acids | 8 | 8.59 | 0.003 |
| bta01200:Carbon metabolism | 9 | 6.30 | 0.005 |
| bta02010:ABC transporters | 6 | 10.89 | 0.009 |
| bta00410:beta-Alanine metabolism | 5 | 11.22 | 0.033 |
| bta00620:Pyruvate metabolism | 5 | 10.03 | 0.039 |
| bta00770:Pantothenate and CoA biosynthesis | 4 | 16.95 | 0.039 |
Publisher’s Note: MDPI stays neutral with regard to jurisdictional claims in published maps and institutional affiliations. |
© 2021 by the authors. Licensee MDPI, Basel, Switzerland. This article is an open access article distributed under the terms and conditions of the Creative Commons Attribution (CC BY) license (https://creativecommons.org/licenses/by/4.0/).
Share and Cite
Wathes, D.C.; Becker, F.; Buggiotti, L.; Crowe, M.A.; Ferris, C.; Foldager, L.; Grelet, C.; Hostens, M.; Ingvartsen, K.L.; Marchitelli, C.; et al. Associations between Circulating IGF-1 Concentrations, Disease Status and the Leukocyte Transcriptome in Early Lactation Dairy Cows. Ruminants 2021, 1, 147-177. https://doi.org/10.3390/ruminants1020012
Wathes DC, Becker F, Buggiotti L, Crowe MA, Ferris C, Foldager L, Grelet C, Hostens M, Ingvartsen KL, Marchitelli C, et al. Associations between Circulating IGF-1 Concentrations, Disease Status and the Leukocyte Transcriptome in Early Lactation Dairy Cows. Ruminants. 2021; 1(2):147-177. https://doi.org/10.3390/ruminants1020012
Chicago/Turabian StyleWathes, D. Claire, Frank Becker, Laura Buggiotti, Mark A. Crowe, Conrad Ferris, Leslie Foldager, Clément Grelet, Miel Hostens, Klaus L. Ingvartsen, Cinzia Marchitelli, and et al. 2021. "Associations between Circulating IGF-1 Concentrations, Disease Status and the Leukocyte Transcriptome in Early Lactation Dairy Cows" Ruminants 1, no. 2: 147-177. https://doi.org/10.3390/ruminants1020012