Article

Transcriptomic Analysis of Insulin-Secreting Murine Hepatocytes Transduced with an Integrating Adeno-Associated Viral Vector

School of Life Sciences, University of Technology Sydney, Sydney 2007, Australia
*
Author to whom correspondence should be addressed.
Int. J. Transl. Med. 2023, 3(3), 374-388; https://doi.org/10.3390/ijtm3030026
Submission received: 11 August 2023 / Revised: 1 September 2023 / Accepted: 4 September 2023 / Published: 6 September 2023
(This article belongs to the Special Issue Biomarker and Translational Research in Oncology and Liver Diseases)

Abstract

:
Type 1 Diabetes (T1D) is a chronic metabolic disorder for which current treatments are unable to prevent the onset of complications. Previously, we used an adeno-associated viral vector (AAV8) to deliver furin-cleavable human insulin (INS-FUR) to the livers of diabetic non-obese diabetic (NOD) mice to reverse T1D. The use of the traditional AAV8-INS-FUR vector could not bring about normoglycemia. However, this vector, coupled with a transposon system in the AAV8/piggyBac-INS-FUR vector, was able to do so. This study aimed to investigate the transcriptomic profiles of the livers of diabetic, AAV8-INS-FUR-transduced, and AAV8/piggyBac-INS-FUR-transduced NOD mice and compare these to the normal liver to identify genetic differences resulting from delivery of the AAV8/piggyBac-INS-FUR vector which produced normoglycemia. Differential gene expression was determined by RNA-Seq analysis and differentially expressed genes from each treatment were mapped onto cellular pathways to determine the treatments’ cell signaling and downstream effects. We observed distinct differences between the piggyBac-transduced and diabetic models, particularly in terms of metabolic function and the upregulation of key pancreatic markers in the liver of piggyBac-transduced animals. The success of the AAV8/piggyBac-INS-FUR vector in achieving normoglycemia through stable transduction was evident. However, further engineering is necessary to achieve complete pancreatic transdifferentiation of liver cells.

1. Introduction

Type 1 Diabetes (T1D) has devastating physical and economic impacts on the 8.75 million individuals worldwide living with the disease [1]. T1D is characterized by the autoimmune attack on pancreatic beta (β)-cells, resulting in the inability to produce sufficient insulin to maintain normoglycemia [2]. The most common way this disease is treated is through daily exogenous insulin injections. This, however, has proven to be inefficient in mimicking the regulated release of insulin from the pancreas and may also be difficult to manage, resulting in the risk of hypoglycemic episodes. Other treatments include using an insulin pump, which automatically releases insulin depending on the blood glucose level measured [3]. Although this is more effective and makes it easier to manage T1D than daily insulin injections, it has shown a differing amount of insulin delivered than required. There is also the opportunity for transplantation of the pancreas or islet cells for T1D patients. However, this relies upon the availability of donor tissue and the need for immunosuppressive drugs [4].
Gene therapy is considered a potential solution to the issues presented with the current therapies. This therapy has proven to be effective in the treatment of other diseases, including hemophilia, severe combined immunodeficiency, and retinitis pigmentosa [5,6,7]. Gene therapy may be beneficial in the context of T1D as it allows for the development of ‘artificial β-cells’ from other cell types, including the patient’s cells. This line of research may also be beneficial for those with insulin-dependent Type 2 Diabetes. One strategy for the development of an artificial β-cell is through the use of non-viral or viral vectors. Vectors act as a vehicle for delivering a desired gene to a specific cell type. Non-viral vector methods include electroporation, lipofection and microRNA, which present a decreased biological risk and reduced immunogenicity compared to viral vectors where previous exposure to the virus can elicit a strong inflammatory response upon delivery [8,9]. Viral vectors used for gene therapy include adenoviral, lentiviral, retroviral, and adeno-associated viral vectors. There are biological challenges related to each viral vector choice; however, lentiviral and adeno-associated viral vectors, in particular, have shown promise as compared to non-viral vectors as they provide the opportunity for a long-term solution where non-viral vectors offer more transient expression of the delivered gene and shorter-term treatment [10].
A range of cells have been investigated as targets for gene therapy, and hence precursors for ‘artificial β-cells’, including both stem and somatic cells. Different somatic cells, including pancreatic, liver, and intestinal cell types, have been investigated for T1D treatment. Liver cells, specifically, share characteristics with native β-cells that make them favorable candidates to undergo β-cell transdifferentiation. Liver cells are formed from the same endodermal region as pancreatic cells, and they also possess a glucose-sensing system, a crucial component of an insulin-producing cell [11].
Our laboratory has previously shown that a second-generation lentiviral vector can convert liver cells to insulin-secreting cells, also known as pancreatic transdifferentiation, by delivering furin-cleavable insulin (INS-FUR) [12]. The occurrence of pancreatic transdifferentiation was confirmed through evidence of storage of insulin in granules, regulated insulin secretion in response to glucose stimulation, expression of β-cell transcription factors, and ultimately, the ability to permanently reverse T1D. This vector was delivered to the liver using a novel procedure of intervallic infusion in full-flow occlusion (FFO). This invasive procedure involves clamping the major veins and arteries to the liver, allowing the vector to remain in the liver during delivery into the portal vein. Using this technique improves transduction rates and limits exposure of the vector to blood plasma, which would typically rapidly inactivate it.
Although this methodology was very successful, the second-generation lentiviral vector possesses viral proteins from the parent HIV and, therefore, would not be a viable option for clinical use. In a later study conducted by La et al., an adeno-associated viral vector (AAV8) carrying the INS-FUR gene was delivered to the livers of diabetic non-obese diabetic (NOD) mice using the FFO procedure [13]. However, diabetes was not reversed. The clinical use of AAV vectors has increased significantly over the past ten years due to specific features, including a favorable safety profile and long-term gene expression [10]. This study also employed an AAV8/piggyBac-INS-FUR (piggyBac) system, which allowed the transposition of transgenes into the host genome. La et al. found that delivery of 5 × 10¹⁰ vector genomes of the piggyBac system into the portal vein of NOD mice significantly reduced the blood glucose levels for up to 15 weeks and reversed T1D with normal intraperitoneal glucose tolerance tests. However, pancreatic transdifferentiation was not evident using PCR analysis alone.
In the current study, total RNA sequencing (RNA-Seq) analysis was undertaken on cryopreserved liver tissue samples from the mice conducted by La et al. RNA-Seq analysis has been used to determine the extent of differentiation or reprogramming of the target cells to β-like cells [14,15]. Understanding the gene expression profile of the liver samples would help identify transcriptomic differences to explain the success of transduction with the integrating piggyBac system in reversing diabetes compared with the non-integrating AAV8 vector that did not. RNA-Seq analysis was undertaken on liver samples from each treatment group (AAV8 vector alone, piggyBac vector, untreated diabetes, and untreated, non-diabetic control). Bioinformatic analysis identified key pathways in livers transduced with the piggyBac system and key pancreatic gene expression differences, suggesting evidence of pancreatic reprogramming in the liver. By comparison, hepatic markers examined were not significantly different from the untreated liver, indicating the treatment did not impact liver function.

2. Materials and Methods

2.1. Liver Samples

Liver samples used in this study were obtained from previous work conducted and described by La et al. [13]. In the study conducted by La et al., female NOD mice between 16–21 weeks of age were assigned to two treatment groups, whereby one group was treated via liver transduction with the AAV8-INS-FUR vector and the other with liver transduction using the AAV8/piggyBac-INS-FUR vector. The sequence of the vector used has been provided in the Supplementary Materials (Supplementary Material S1). Additionally, two control groups were included: non-diabetic untreated NOD mice (normal) and untreated diabetic NOD mice (diabetic). La et al. confirmed the successful delivery of the INS-FUR gene in the liver through immunohistochemistry and reverse transcriptase polymerase chain reaction experiments and analysed metabolic behavior through intraperitoneal glucose tolerance tests [13].
For the present study, biological replicates were collected from each treatment and control group from the study conducted by La et al. to undergo further analysis: normal liver (normal, n = 3), diabetic liver (DL, n = 3), AAV8-INS-FUR transduced liver (AAV, n = 3) and AAV8/piggyBac-INS-FUR transduced liver (AAVPB, n = 3). A flow chart outlining the analyses conducted in this current study is available in the Supplementary Materials (Supplementary Figure S1)

2.2. RNA Isolation and Sample Quality Analysis

RNA was extracted from 30 mg of liver tissue for all samples collected using an AllPrep DNA/RNA Kit (Qiagen, Australia) following the manufacturer’s protocol. The quality of the extracted RNA was assessed using a NanoDrop™ 2000 spectrophotometer (Thermo Fisher Scientific, Waltham, MA, USA), Agilent Bio-Analyser with an Agilent Eukaryote Total RNA Nano Kit (Agilent, Santa Clara, CA, USA) and the Agilent TapeStation. The threshold requirement for total RNA-Seq analysis was 260/280 and 260/230 ratios of 2–2.2 (based on Nanodrop readings) and an RNA integrity number (RIN) of >7 for all samples (Supplementary Table S1 and Figure S2).

2.3. Total RNA Sequencing (RNA-Seq) Analysis

Total RNA-seq analysis was performed by the Ramaciotti Centre for Genomics (University of New South Wales, Australia) using the Illumina Stranded Total RNA prep Ligation with Ribo-Zero Plus on a NovaSeq 600 SP 1 × 100 bp flow cell for data output of up to 800 M reads (single end, ~60 M reads/sample with 12 samples), including a PhiX spike-in. QC of all samples was further confirmed by the Ramaciotti Centre, and upon completion of sequencing, demultiplexed fastQ files were provided for data analysis.

2.4. Differential Gene Expression Analysis

QIAGEN CLC Genomics Workbench (CLC, version 20) (https://digitalinsights.qiagen.com accessed on 5 January 2023) was utilized to process and analyze the RNA-Seq data library for each group (normal, DL, AAV, and AAVPB). The raw RNA-Seq data was imported into CLC and mapped to the Mus musculus reference genome. Quality control analyses were performed on the mapped data, including assessments of total read counts, normalization using the trimmed mean of M-values method (TMM), and determination of unmapped gene percentages (Supplementary Material S1, CLC Workbench Quality Control methods: https://resources.qiagenbioinformatics.com/manuals/clcgenomicsworkbench/current/index.php?manual=QC_Sequencing_Reads.html accessed on 2 August 2023)). Subsequently, differential expression analysis (CLC Workbench Differential Expression Analysis method: https://resources.qiagenbioinformatics.com/manuals/clcgenomicsworkbench/current/index.php?manual=Differential_Expression.html accessed on 2 August 2023)) was conducted for each group relative to the normal group (DL vs. normal, AAV vs. normal, AAVPB vs. normal), resulting in the identification of a list of differentially expressed genes (DEGs) for each treatment. To generate a curated list for subsequent pathway analysis, a statistical cut-off of a False Discovery Rate (FDR) p-value of ≤0.05 and a fold change of ≤−1 or ≥1 was applied to the DEGs.

2.5. Pathway Analysis

The curated list of DEGs was uploaded into QIAGEN Ingenuity Pathway Analysis (IPA) (QIAGEN Inc., https://digitalinsights.qiagen.com/IPA accessed on 8 January 2023). The core analysis function of IPA was employed to identify modified pathways, upstream regulators, and diseases and functions associated with the differential gene expression observed in the treated liver samples compared to normal liver [16]. The most significant canonical pathways for each group were first evaluated, where pathways with a Z-score of ≥2 (activated) or ≤−2 (inhibited) were considered to be significantly enriched pathways. A further, more targeted analysis of pathways and molecules related to pancreatic transdifferentiation and liver function was also undertaken, in which more subtle changes in Z-scores were considered. To confirm the activation state of a pathway of interest, upstream regulator, and other molecules with direct relationships to the pathway or function, reverse transcriptase quantitative Polymerase Chain Reaction (RT-qPCR) was completed using RNA extracted from the relevant liver samples. Additionally, the datasets were compared to the profile of a normal β-cell using a dataset contained within the IPA databases (GEO Dataset: GSE108097).

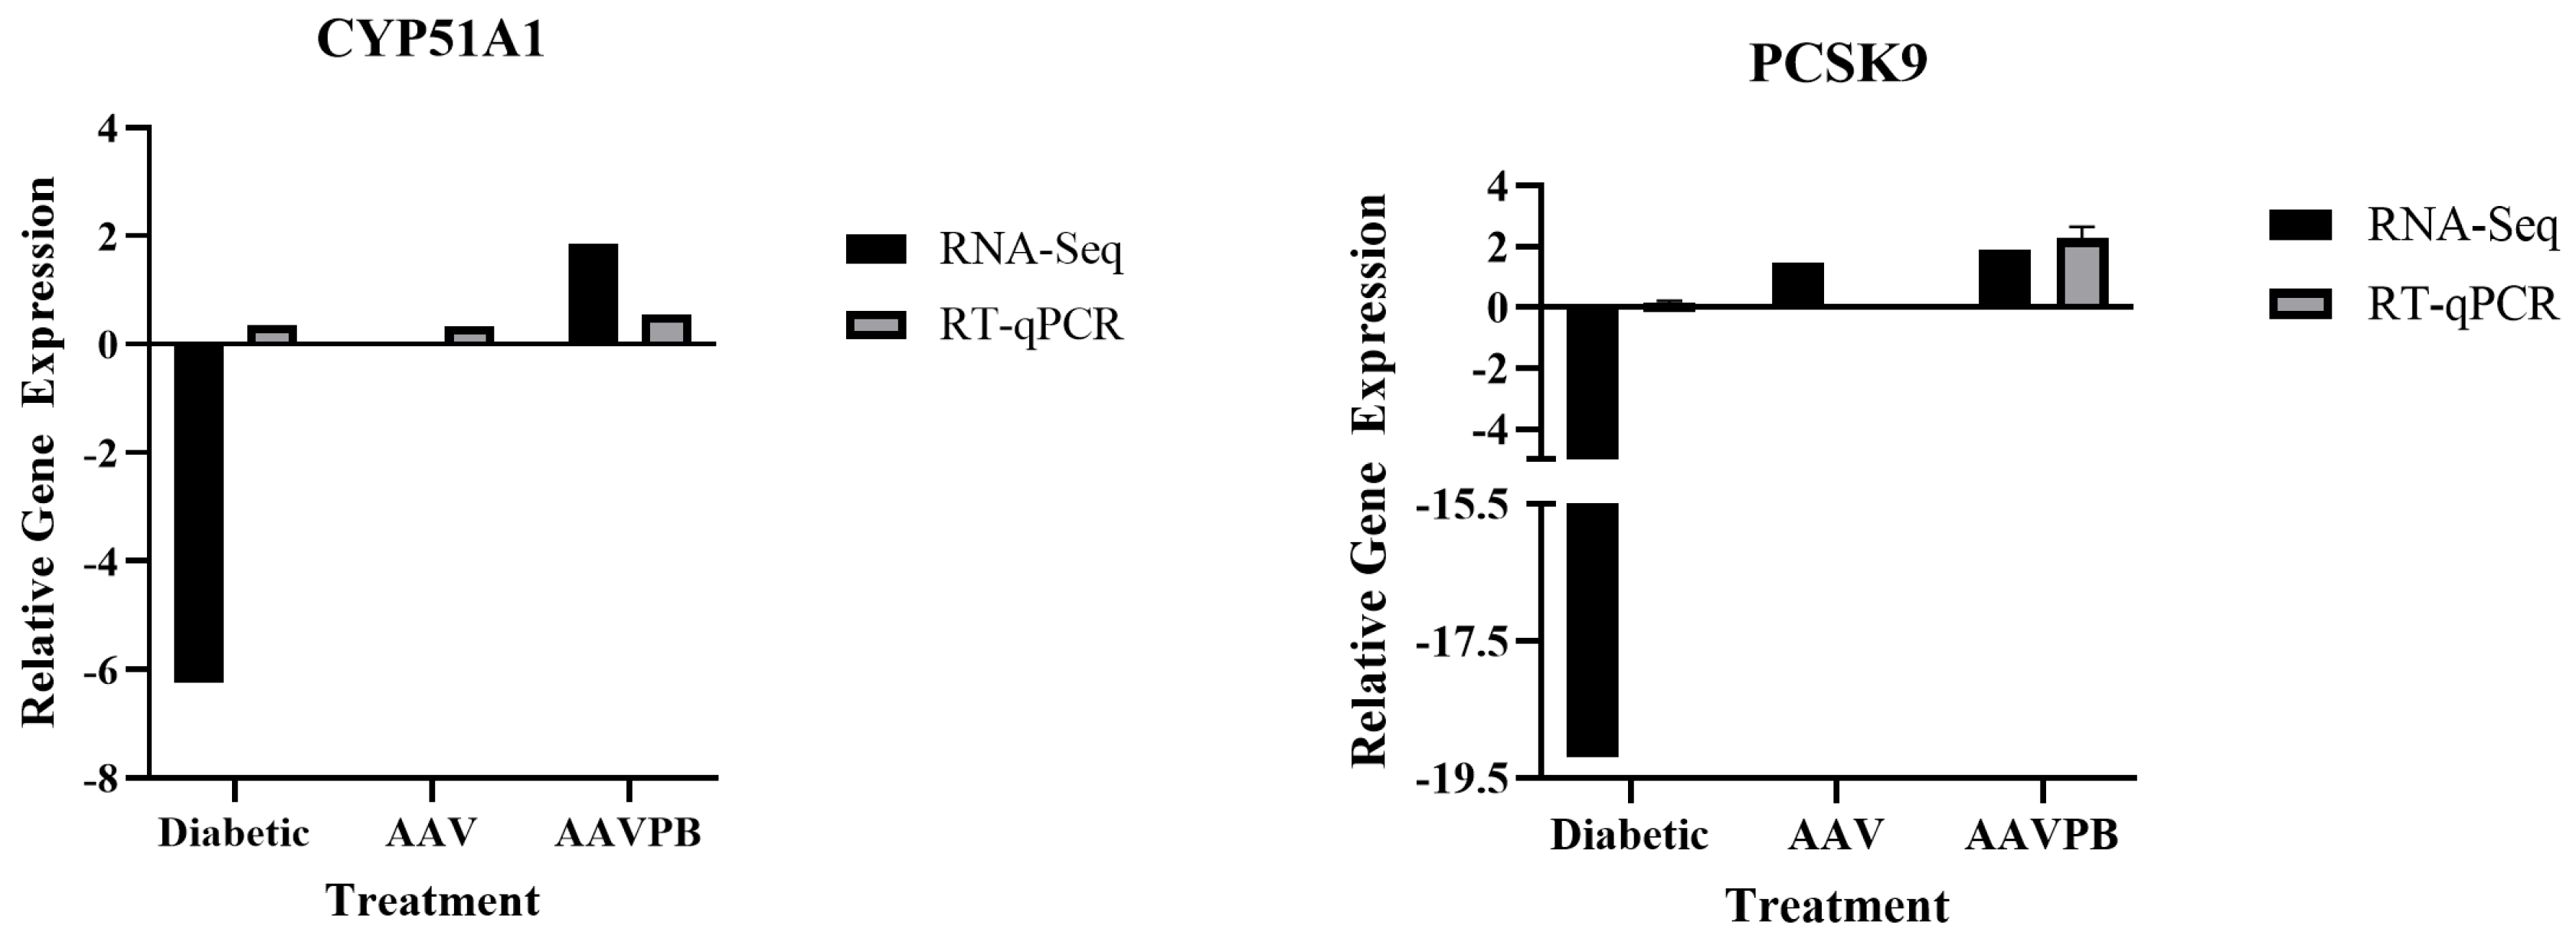
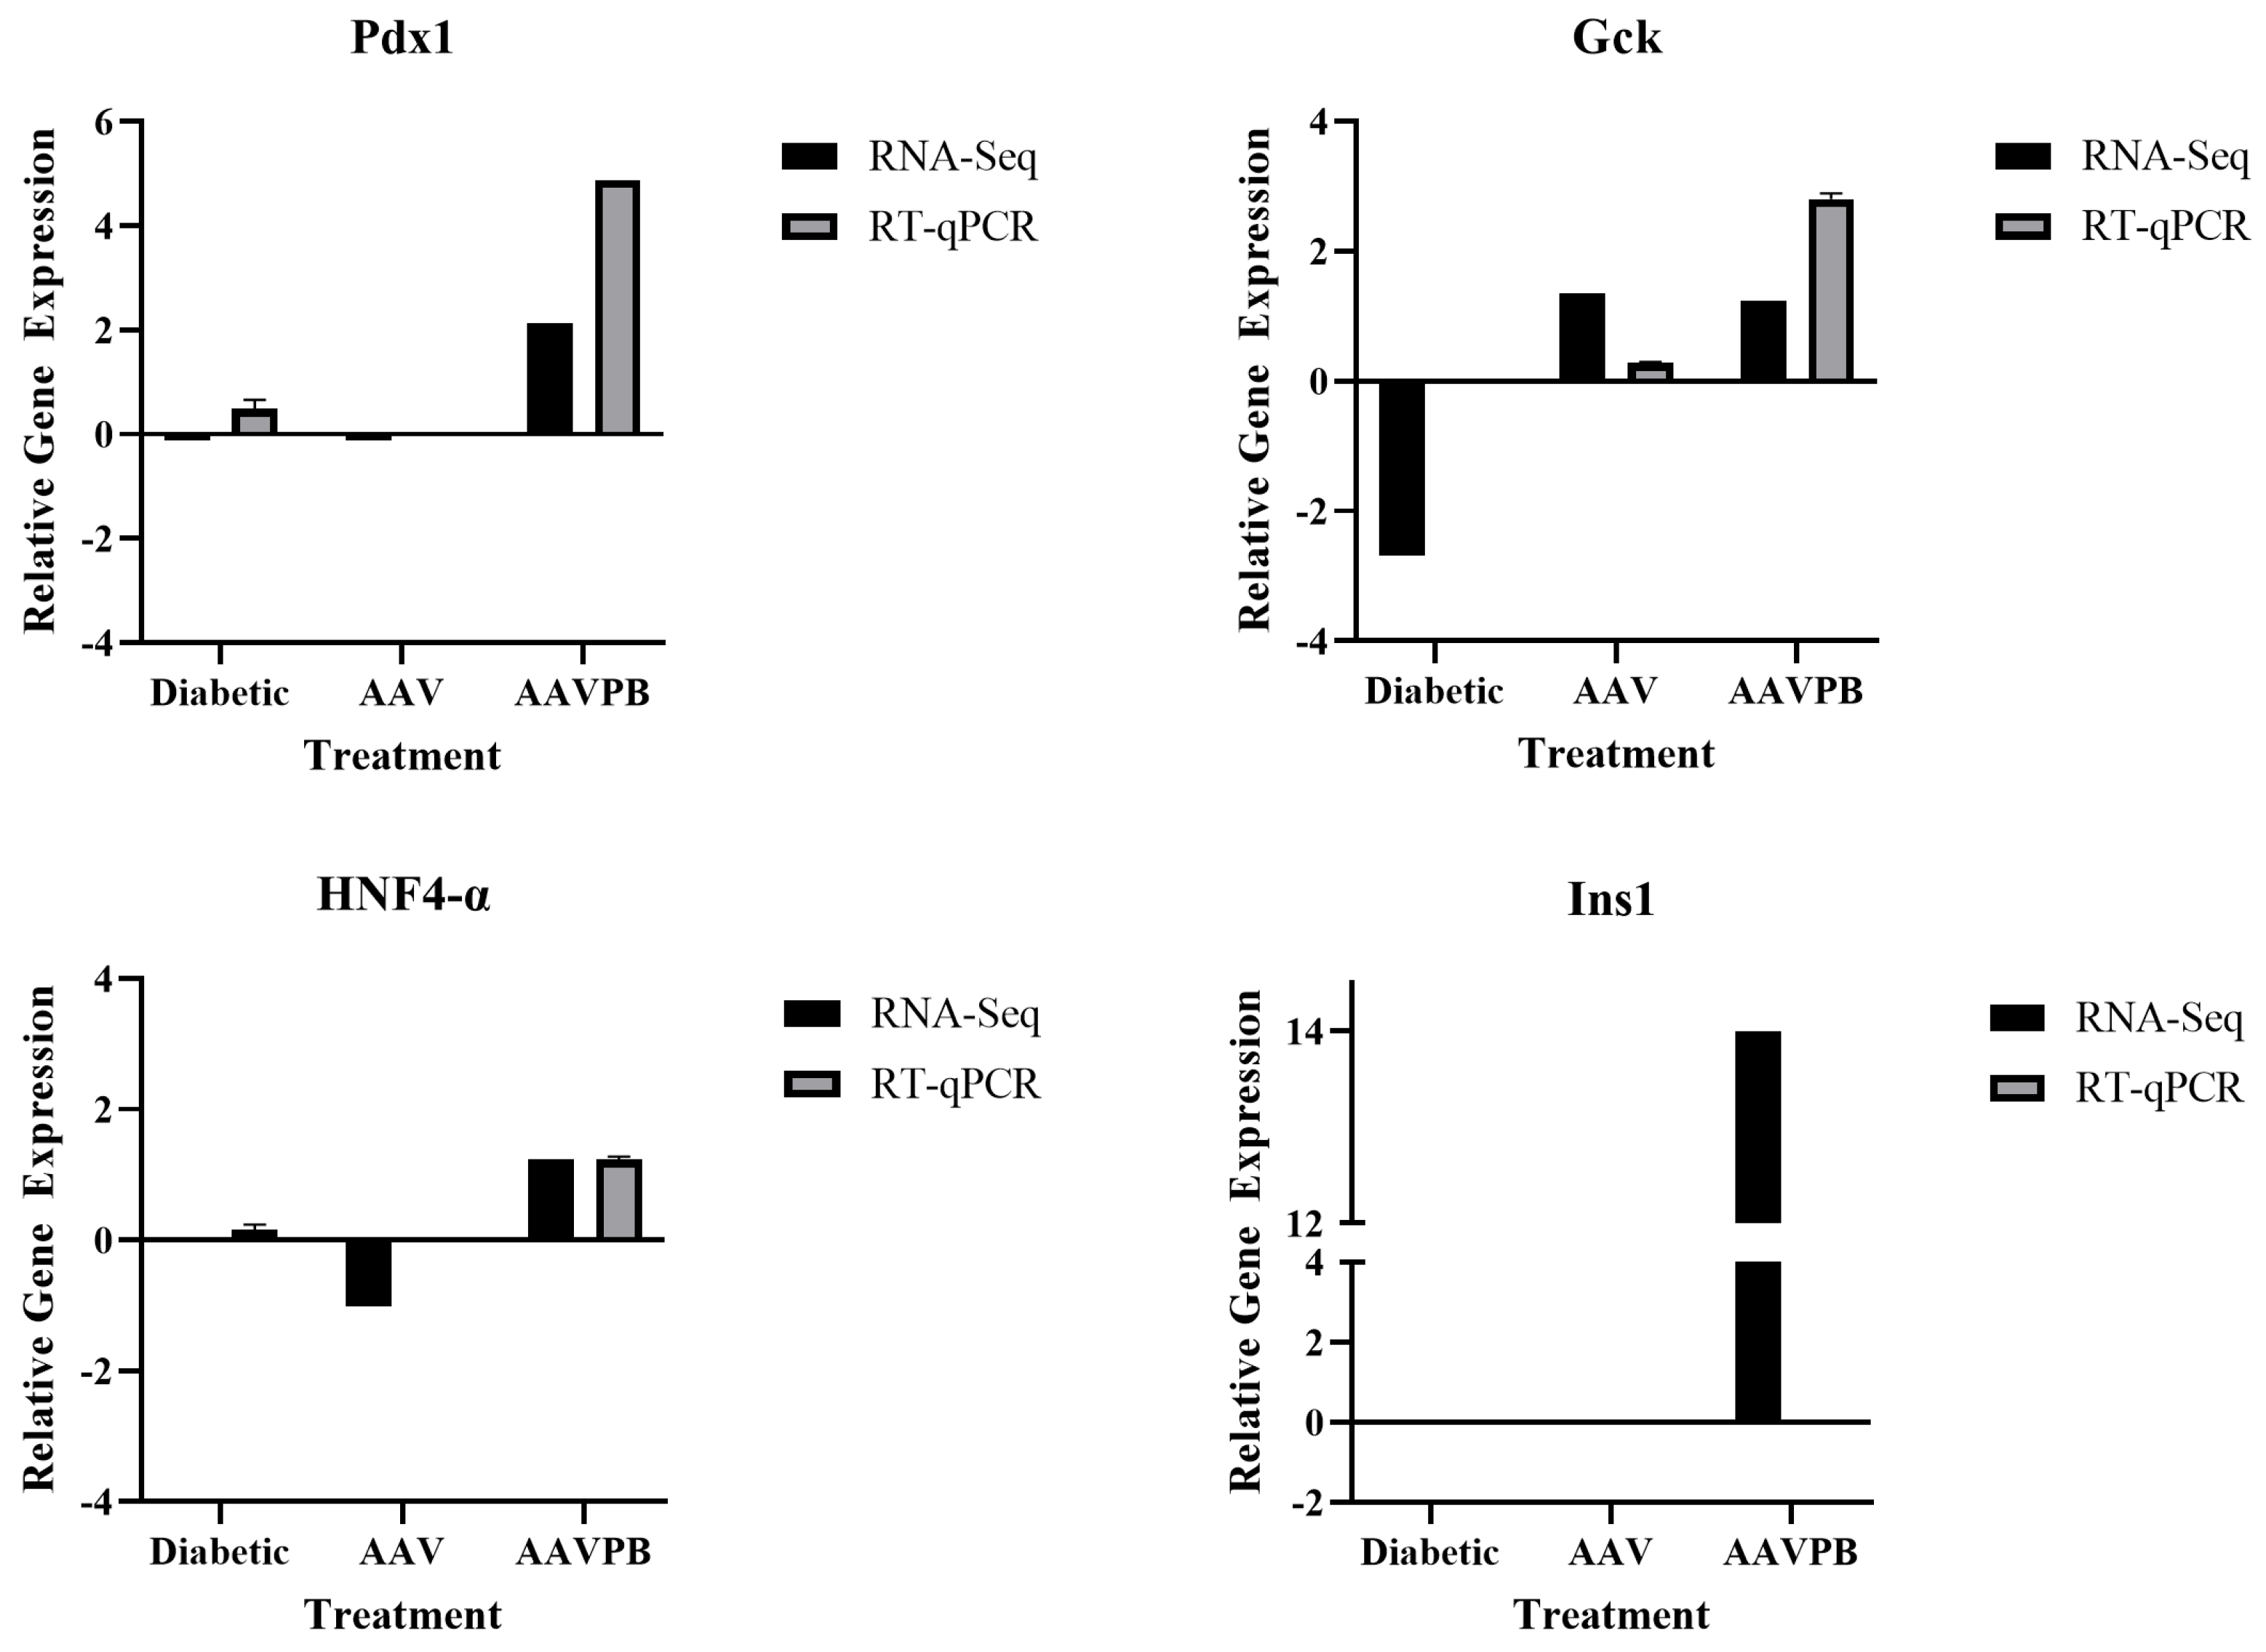
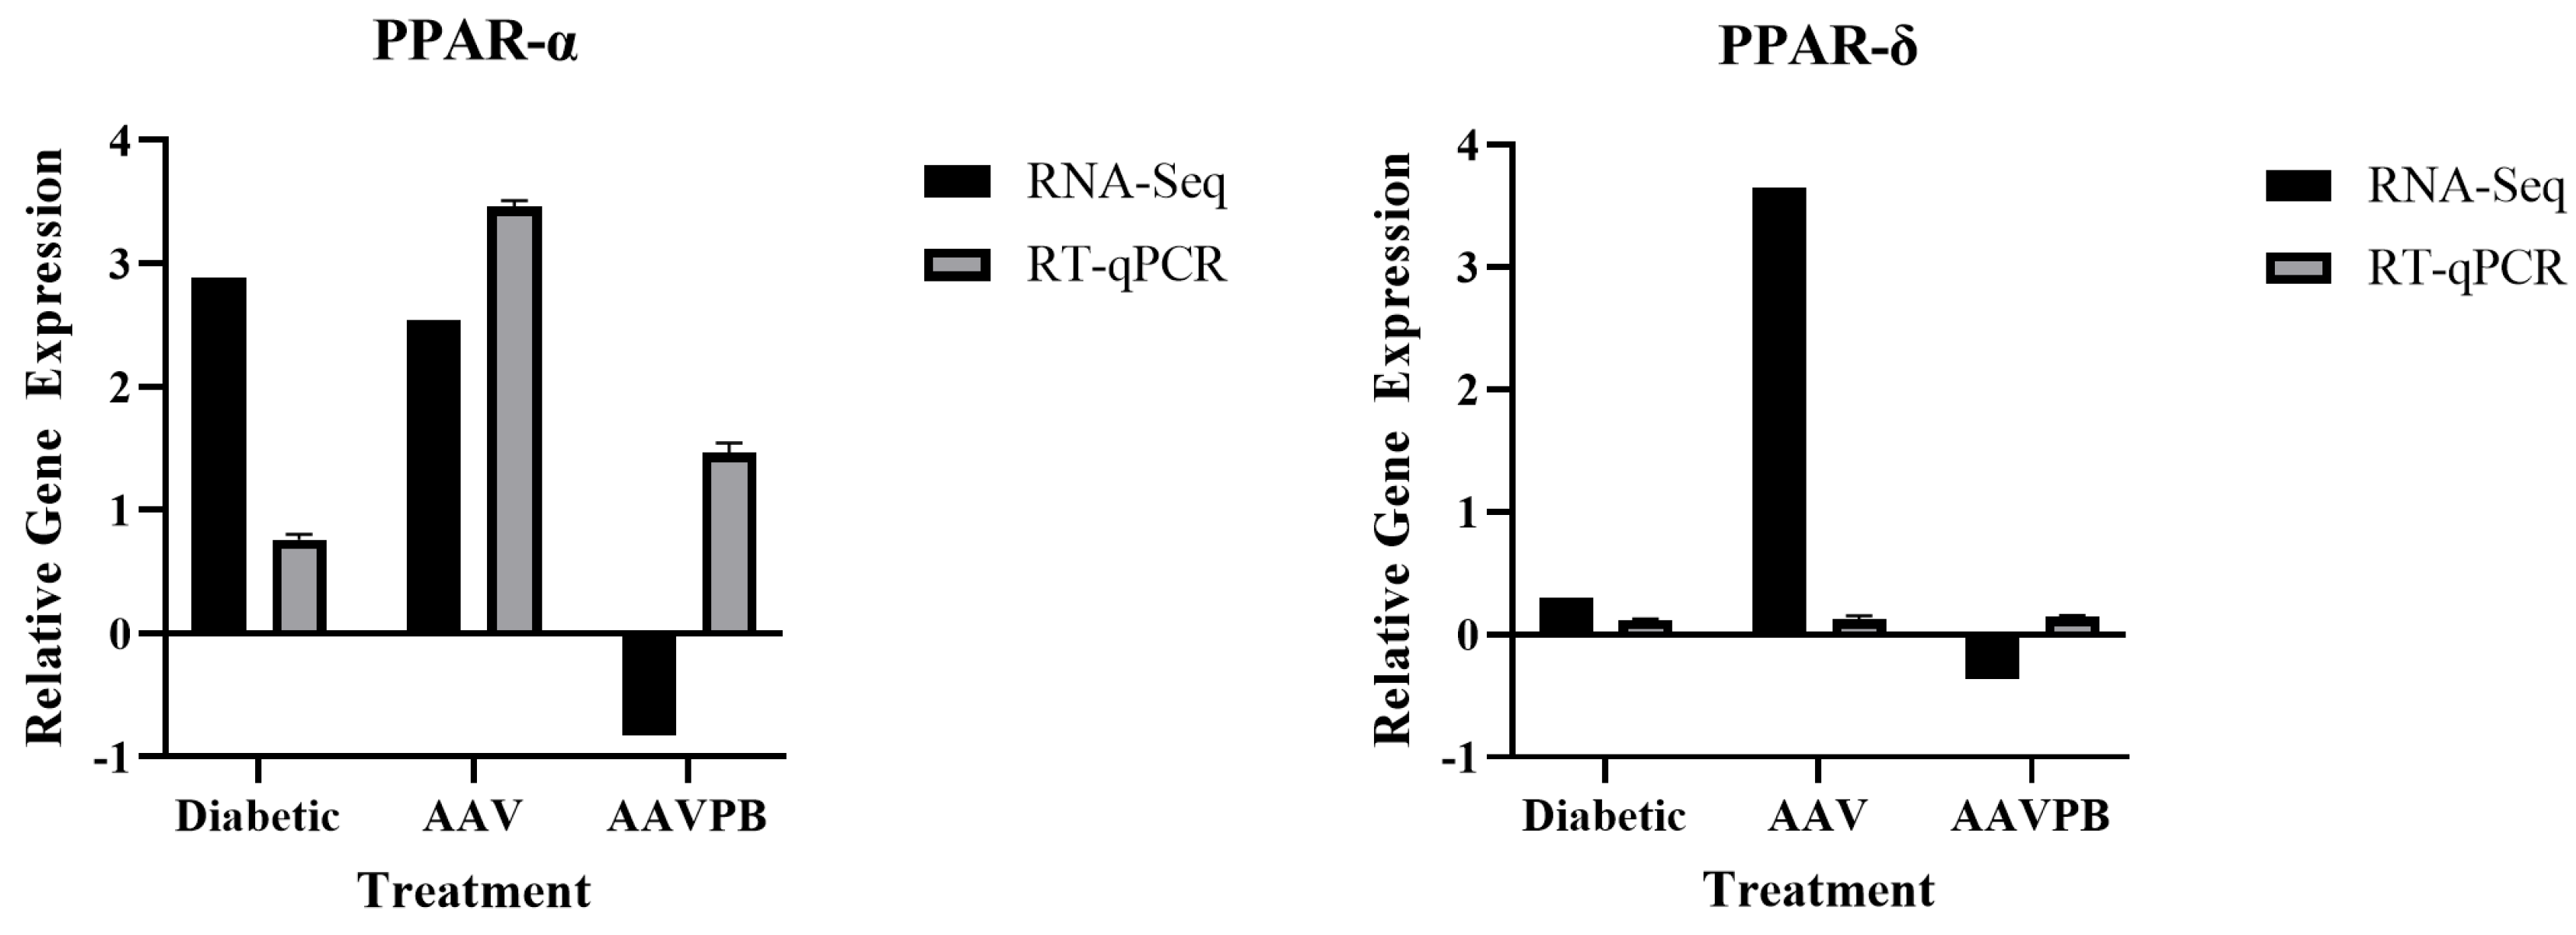
2.6. Validation of Differential Gene Expression by RT-qPCR

After extraction, RNA samples were treated with DNAse I (Applied BioSystems, Thermo Fisher Scientific, Macquarie Park, Sydney, Australia) according to the manufacturer’s protocol. Reverse transcription was completed using the Tetro cDNA Synthesis Kit (Bioline, Everleigh, Australia) with random primers according to the manufacturer’s protocol. Quantitative PCR using the cDNA samples was then performed using the TaqMan Fast Advanced Master Mix (Applied BioSystems, Thermo Fisher Scientific, Macquarie Park, Sydney, Australia) on a QuantStudio 12 K flex instrument following the manufacturers’ protocol. Commercially available Taqman assays were utilized for amplification of the reference genes; Beta-Actin (Mm02619580_g1) and Ywhaz (Mm03950126_s1) and all eight target genes; Cyp51A1 (Mm01322050_m1), PCSK9 (Mm01263610_m1), Pdx1 (Mm00435565_m1), HNF4-α (Mm01247712_m1), Ins1 (Mm01950294_s1), Gck (Mm00439129_m1), PPAR-α (Mm00440939_m1) and PPAR-δ (Mm00803184_m1). Each sample was analyzed in triplicate within each assay, and each assay was repeated at least once to verify the results. The Ct values (outliers removed) were used to determine the fold change in expression of each of the target genes (using the 2 C t method) [17] across the different treatments normalized against the reference genes; Beta-Actin and Ywhaz and the normal liver.

2.7. Statistical Analysis

Bioinformatic analysis statistics were carried out using in-built packages within CLC Workbench and IPA. Differential expression analyses of each treatment group compared to the normal group were completed using the Wald Test in CLC Workbench [18]. Activation Z-scores and significance were calculated in IPA for predictions on the activation state of relevant pathways and molecules based on the transcriptomic profile of the different groups relative to the normal group. An absolute Z-score of ≥2 was considered significant. RT-qPCR data was analyzed using GraphPad Prism software and expressed as the mean ± SD.

3. Results

3.1. RNA Extraction and RNA-Seq Quality Analysis

To investigate changes in gene expression in the different liver samples relative to the control, RNA was extracted from the livers of the mice from each treatment and control group (n = 3 for each group). All RNA quality control measures required for RNA-Seq analysis were met (Supplementary Table S1 and Supplementary Figure S2), as were the RNA-Seq data quality measures (Supplementary Material S2). Data analyses were undertaken in CLC to identify differential gene expression associated with each treatment.

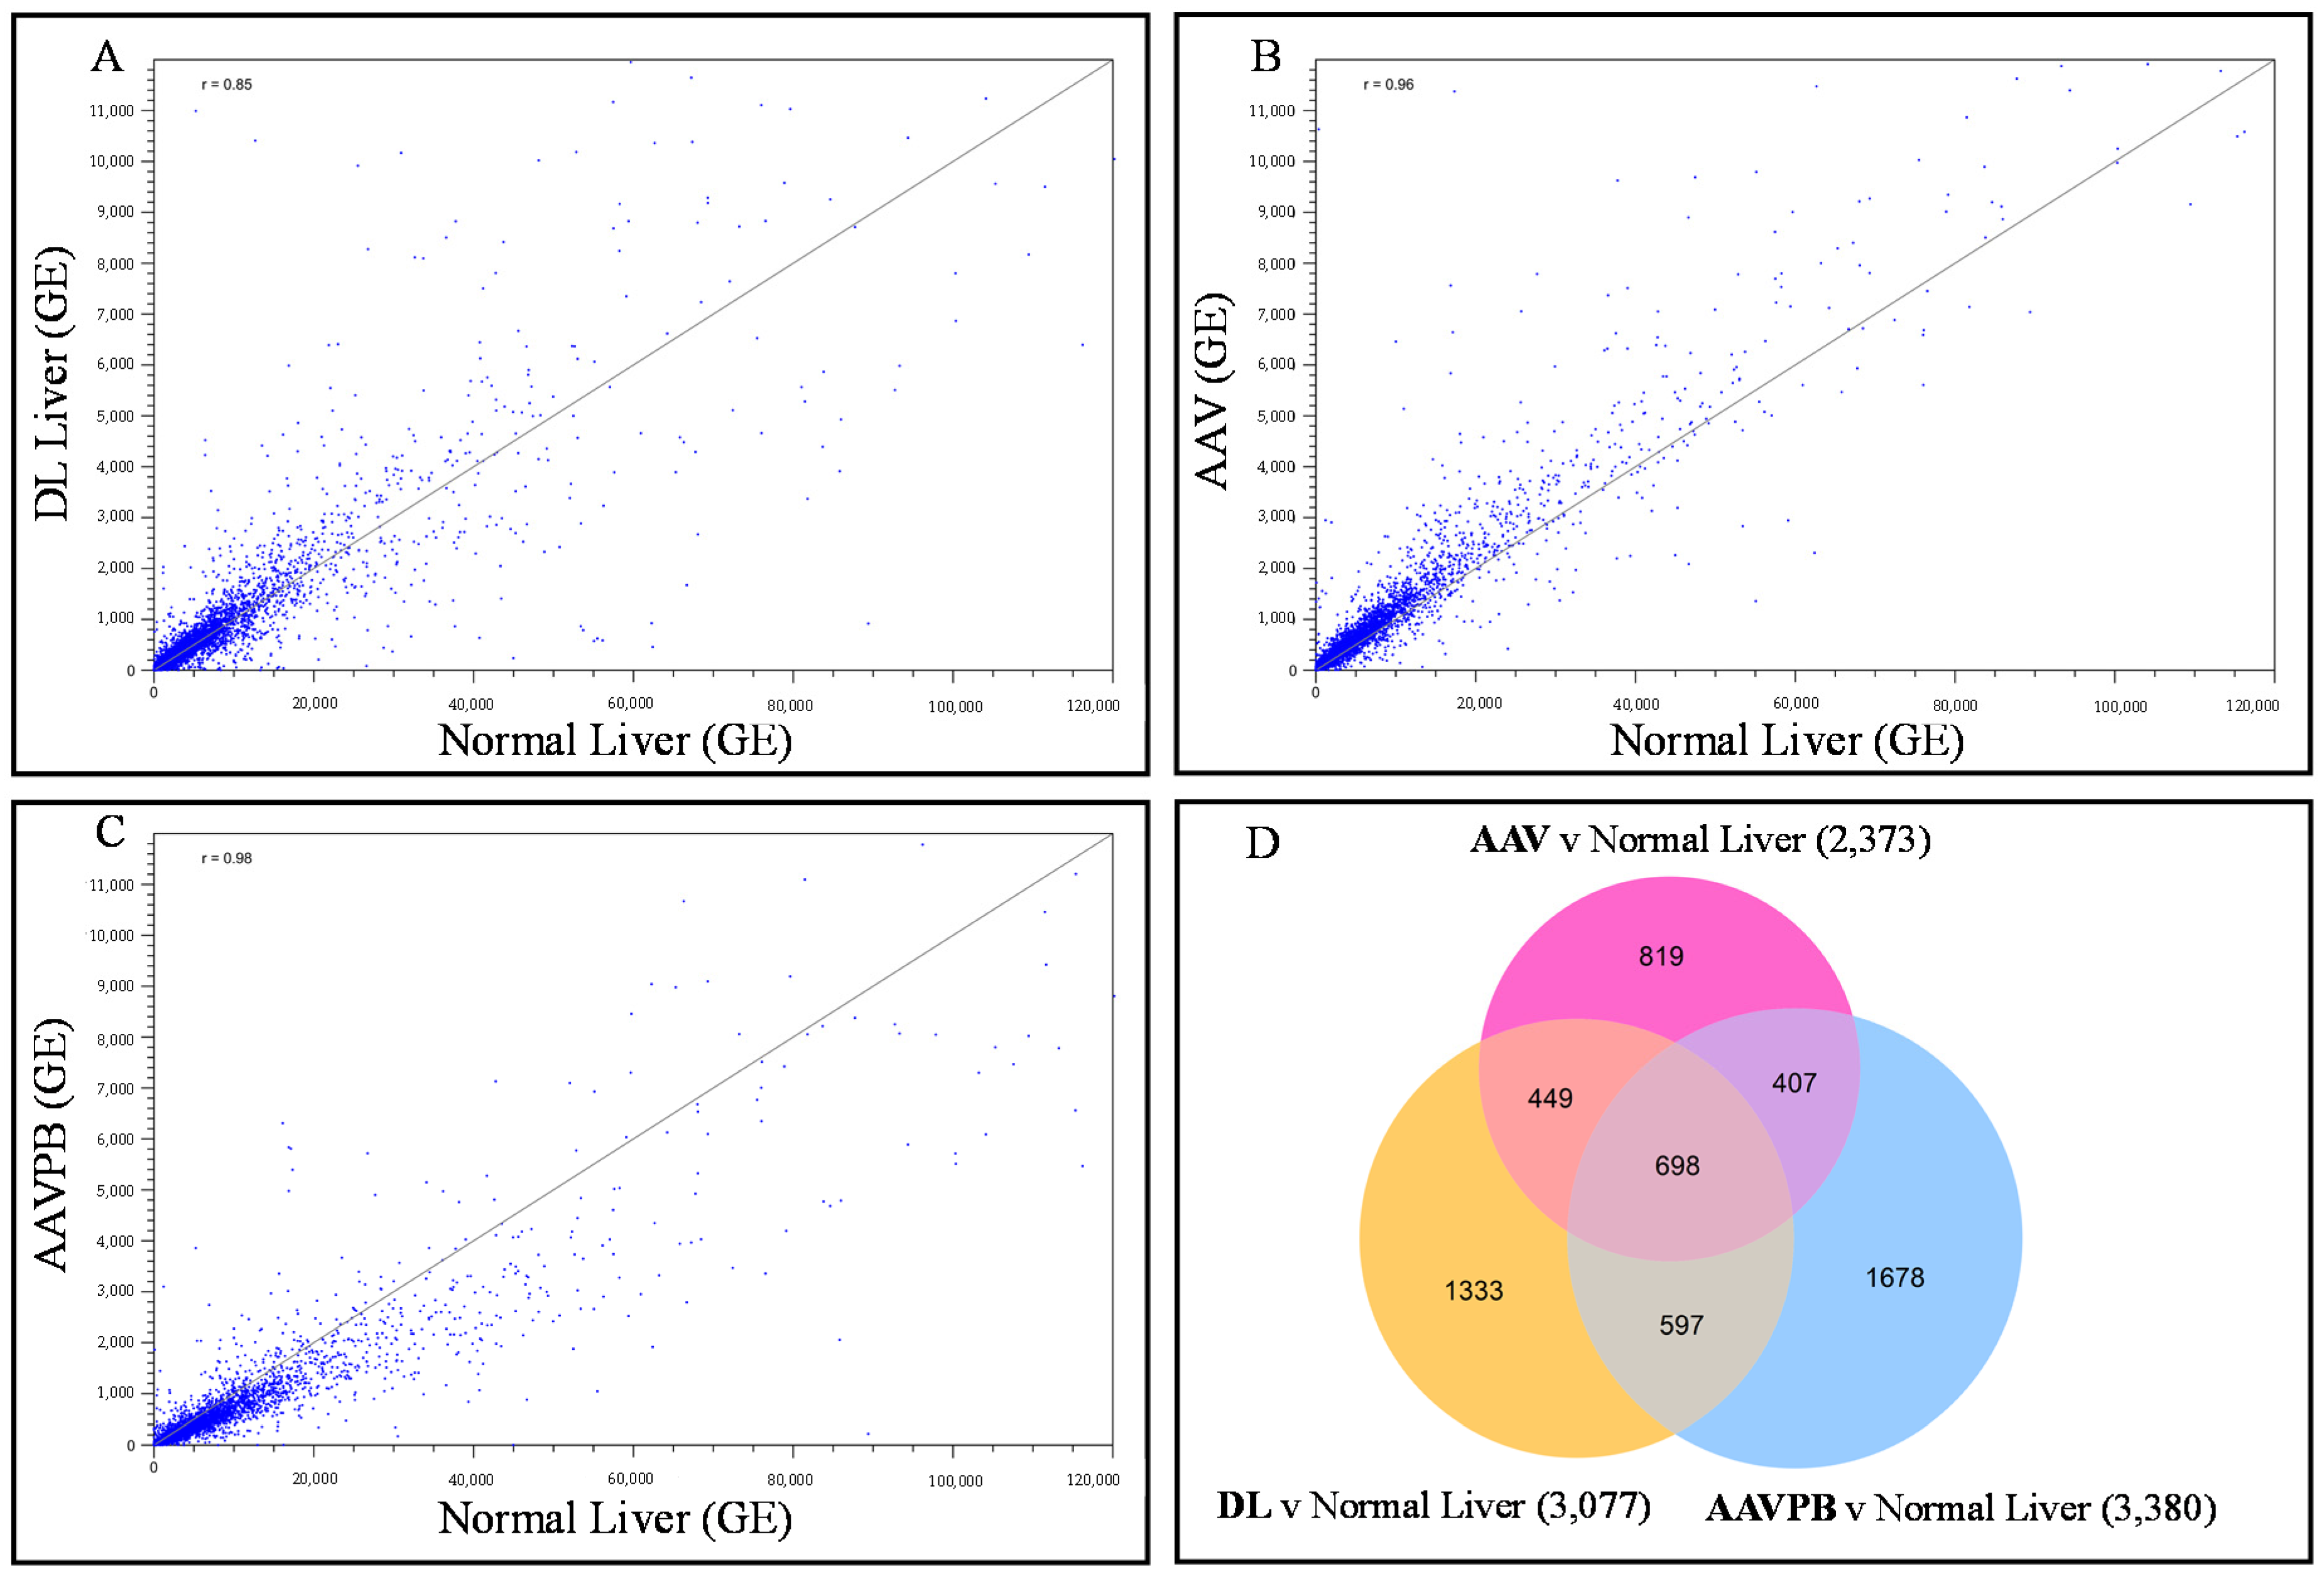
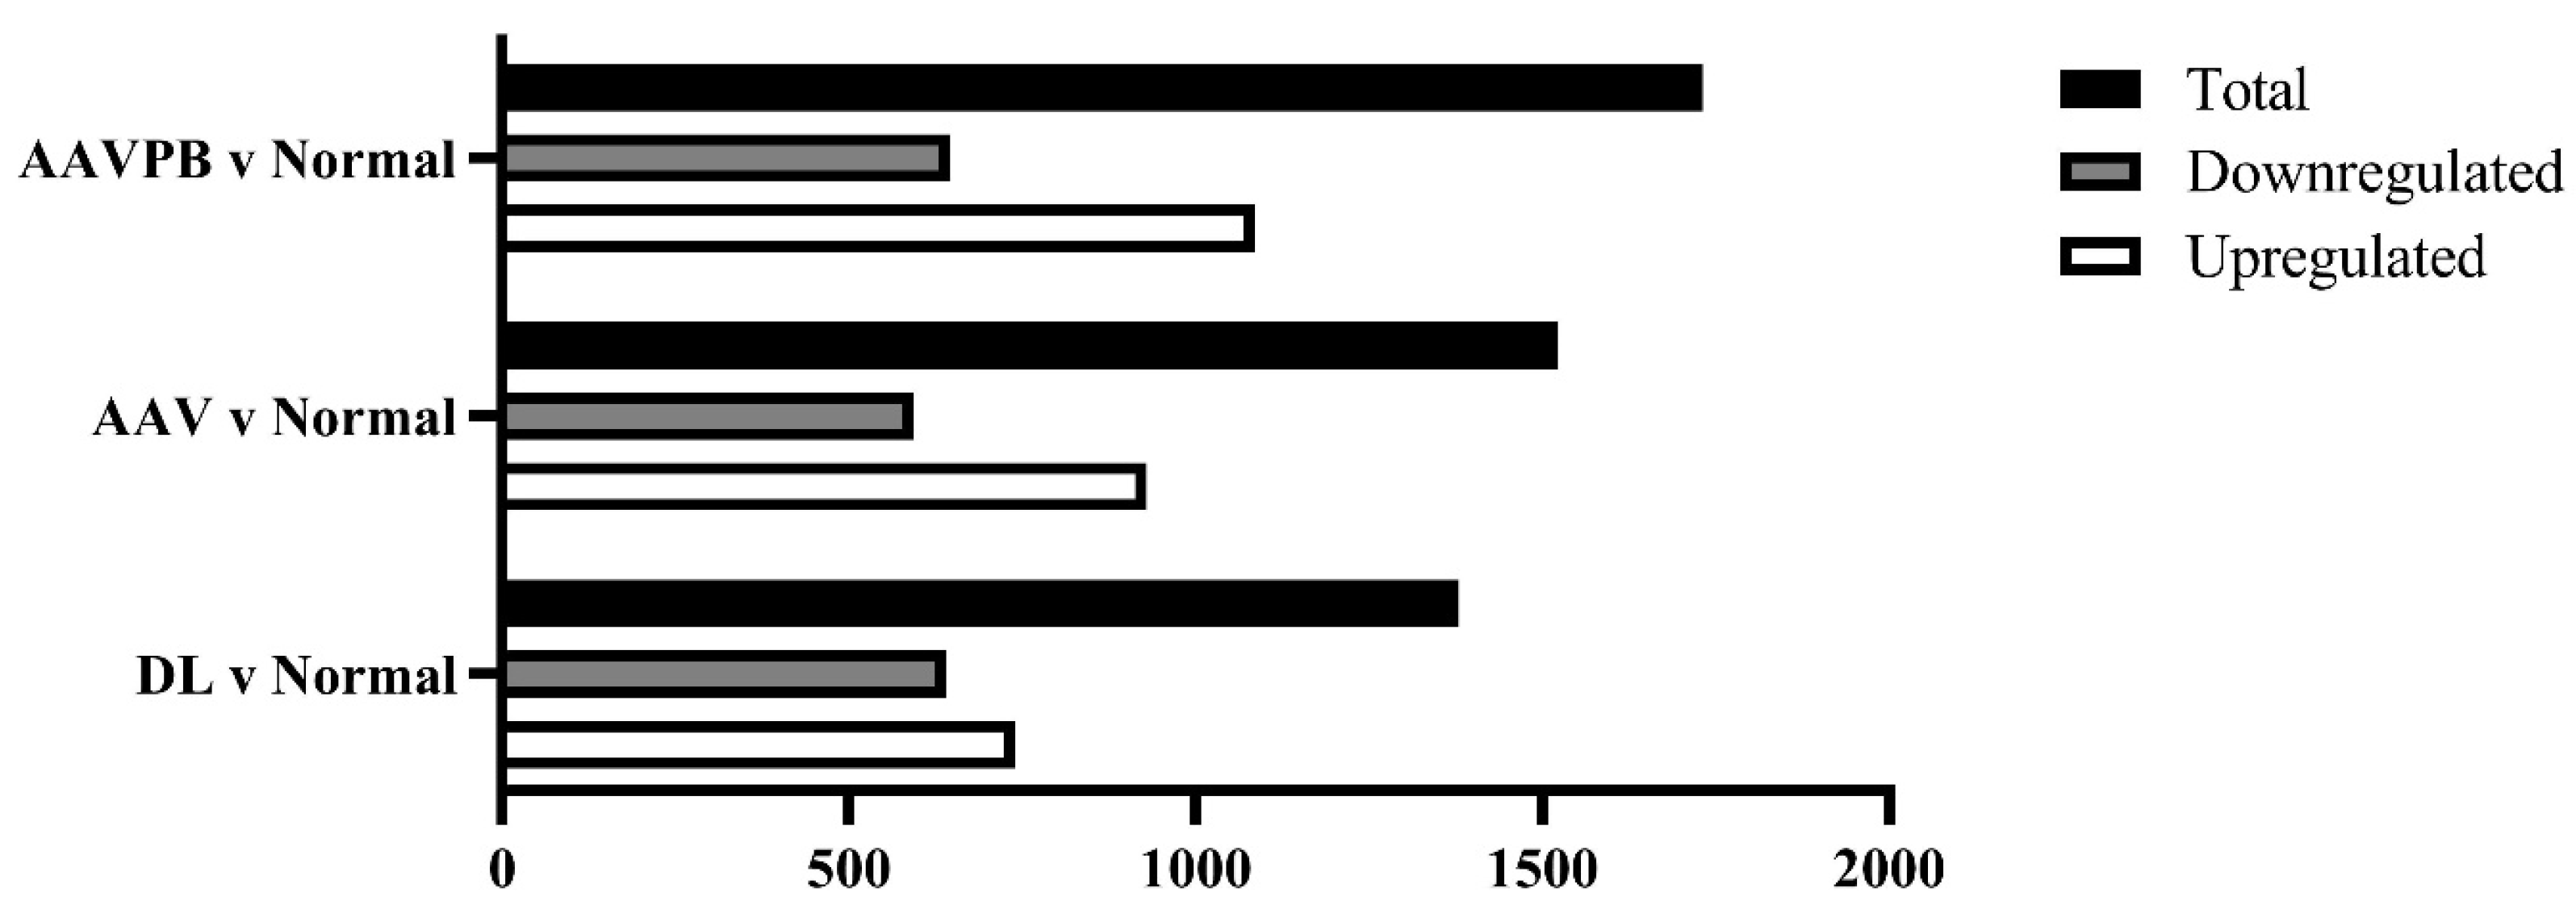
3.2. Identification and Visualization of Differentially Expressed Genes across Treatments

Differentially expressed genes (DEGs) were identified by comparing the transcriptomic profiles of liver samples from each of the three treatment groups (diabetic, AAV-transduced, and piggyBac-transduced) to that of normal liver (Figure 1A–D, volcano plots are provided in the Supplementary Materials as Supplementary Figure S3). In the gene expression plots, the higher Pearson correlation coefficient (r) for the piggyBac vs. normal (r = 0.98) comparison suggests the piggyBac treatment produced a gene expression profile most similar to that of the normal liver compared to the other liver samples (r = 0.86, for diabetic vs. normal and r = 0.96 for AAV vs. normal) (Figure 1).
An absolute fold change of ≥1 and FDR p-value of ≤0.05 was used as the statistical threshold for the selection of differentially expressed genes and was applied to produce a curated list of up- and downregulated genes associated with each treatment compared to normal (Figure 2). As expected from the scatter plots, when compared to normal liver, the diabetic liver showed the greatest number of DEGs (upregulated and downregulated), while the piggyBac transduced liver showed the lowest number (Figure 2). The curated lists of DEGs were imported into IPA to analyse the downstream effects potentially brought about by the differences in gene expression observed across the treatments.

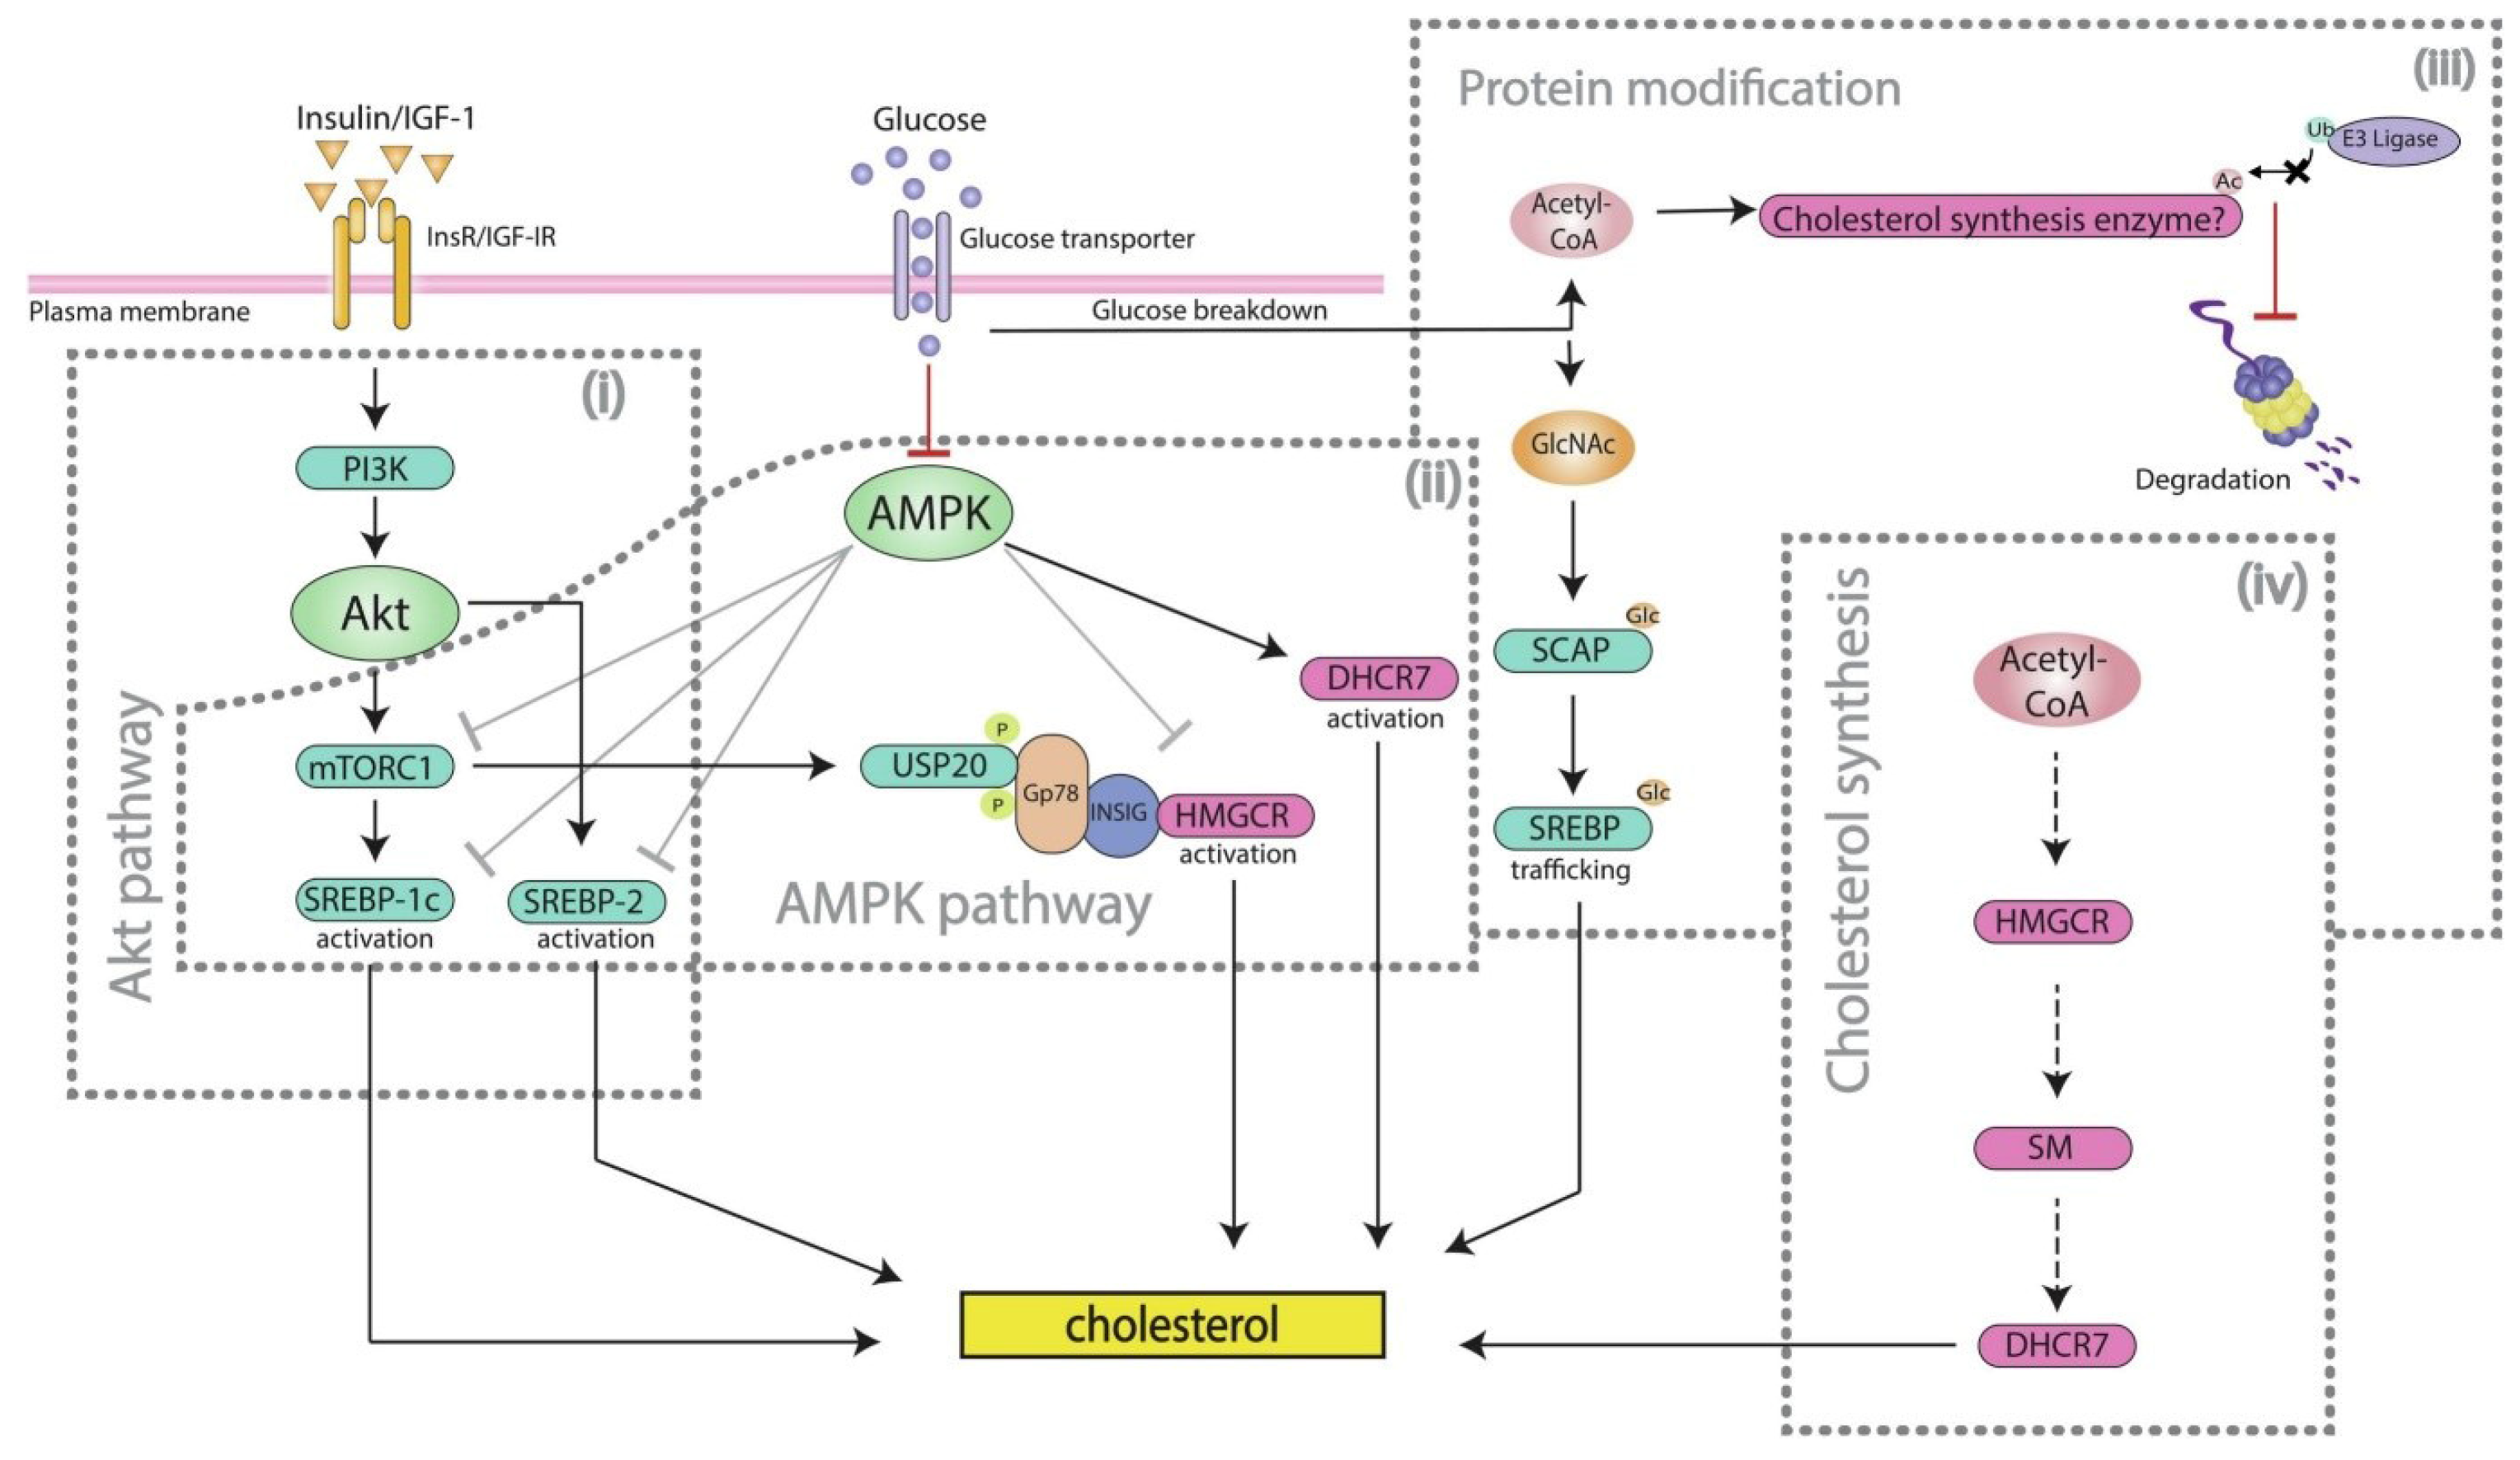
3.3. Canonical Pathway Analysis Identifies the Pathway of Cholesterol Biosynthesis in Diabetic and Piggybac Transduced Liver

Analysis based on the lists of curated DEGs imported into IPA showed pathways of metabolism and metabolic regulation as areas of significant difference across all treatments. Interestingly, cholesterol biosynthesis was a common point of difference observed in both the piggyBac-transduced and diabetic liver samples, ranking in the top 10 significant canonical pathways for both treatments (Figure 3, Table 1). Based on the Z-Scores, the cholesterol biosynthesis pathway, along with several molecules within this pathway, including 7-Dehydrocholesterol Reductase (DHCR7), 3-Hydroxy-3-Methylglutaryl-CoA Reductase (HMGCR) and Akt, were significantly activated in the piggyBac-transduced liver and significantly inhibited in the diabetic liver (Table 1). Additionally, the gluconeogenesis pathway was activated in both the diabetic and AAV-transduced liver and inhibited in the piggyBac-transduced liver compared to normal (Table 1).
To validate the directional effect of the treatments on cholesterol biosynthesis, as shown in IPA, we selected two key upstream regulators in the pathway, namely Cytochrome P450 Family 51 Subfamily A Member 1 (CYP51A1) and proprotein convertase subtilisin/kexin type 9 (PCSK9) for RT-qPCR validation (Figure 4). Both CYP51A1 and PCSK9 exhibited the highest upregulation in piggyBac-transduced, compared to diabetic and AAV-transduced samples. Notably, only PCSK9 showed significant upregulation when normalized against the normal liver. These RT-qPCR results corroborated the fold change observed in the RNA-Seq data. They solidified the predicted directional relationship between diabetic and piggyBac-transduced liver samples in the context of cholesterol biosynthesis (Figure 4).

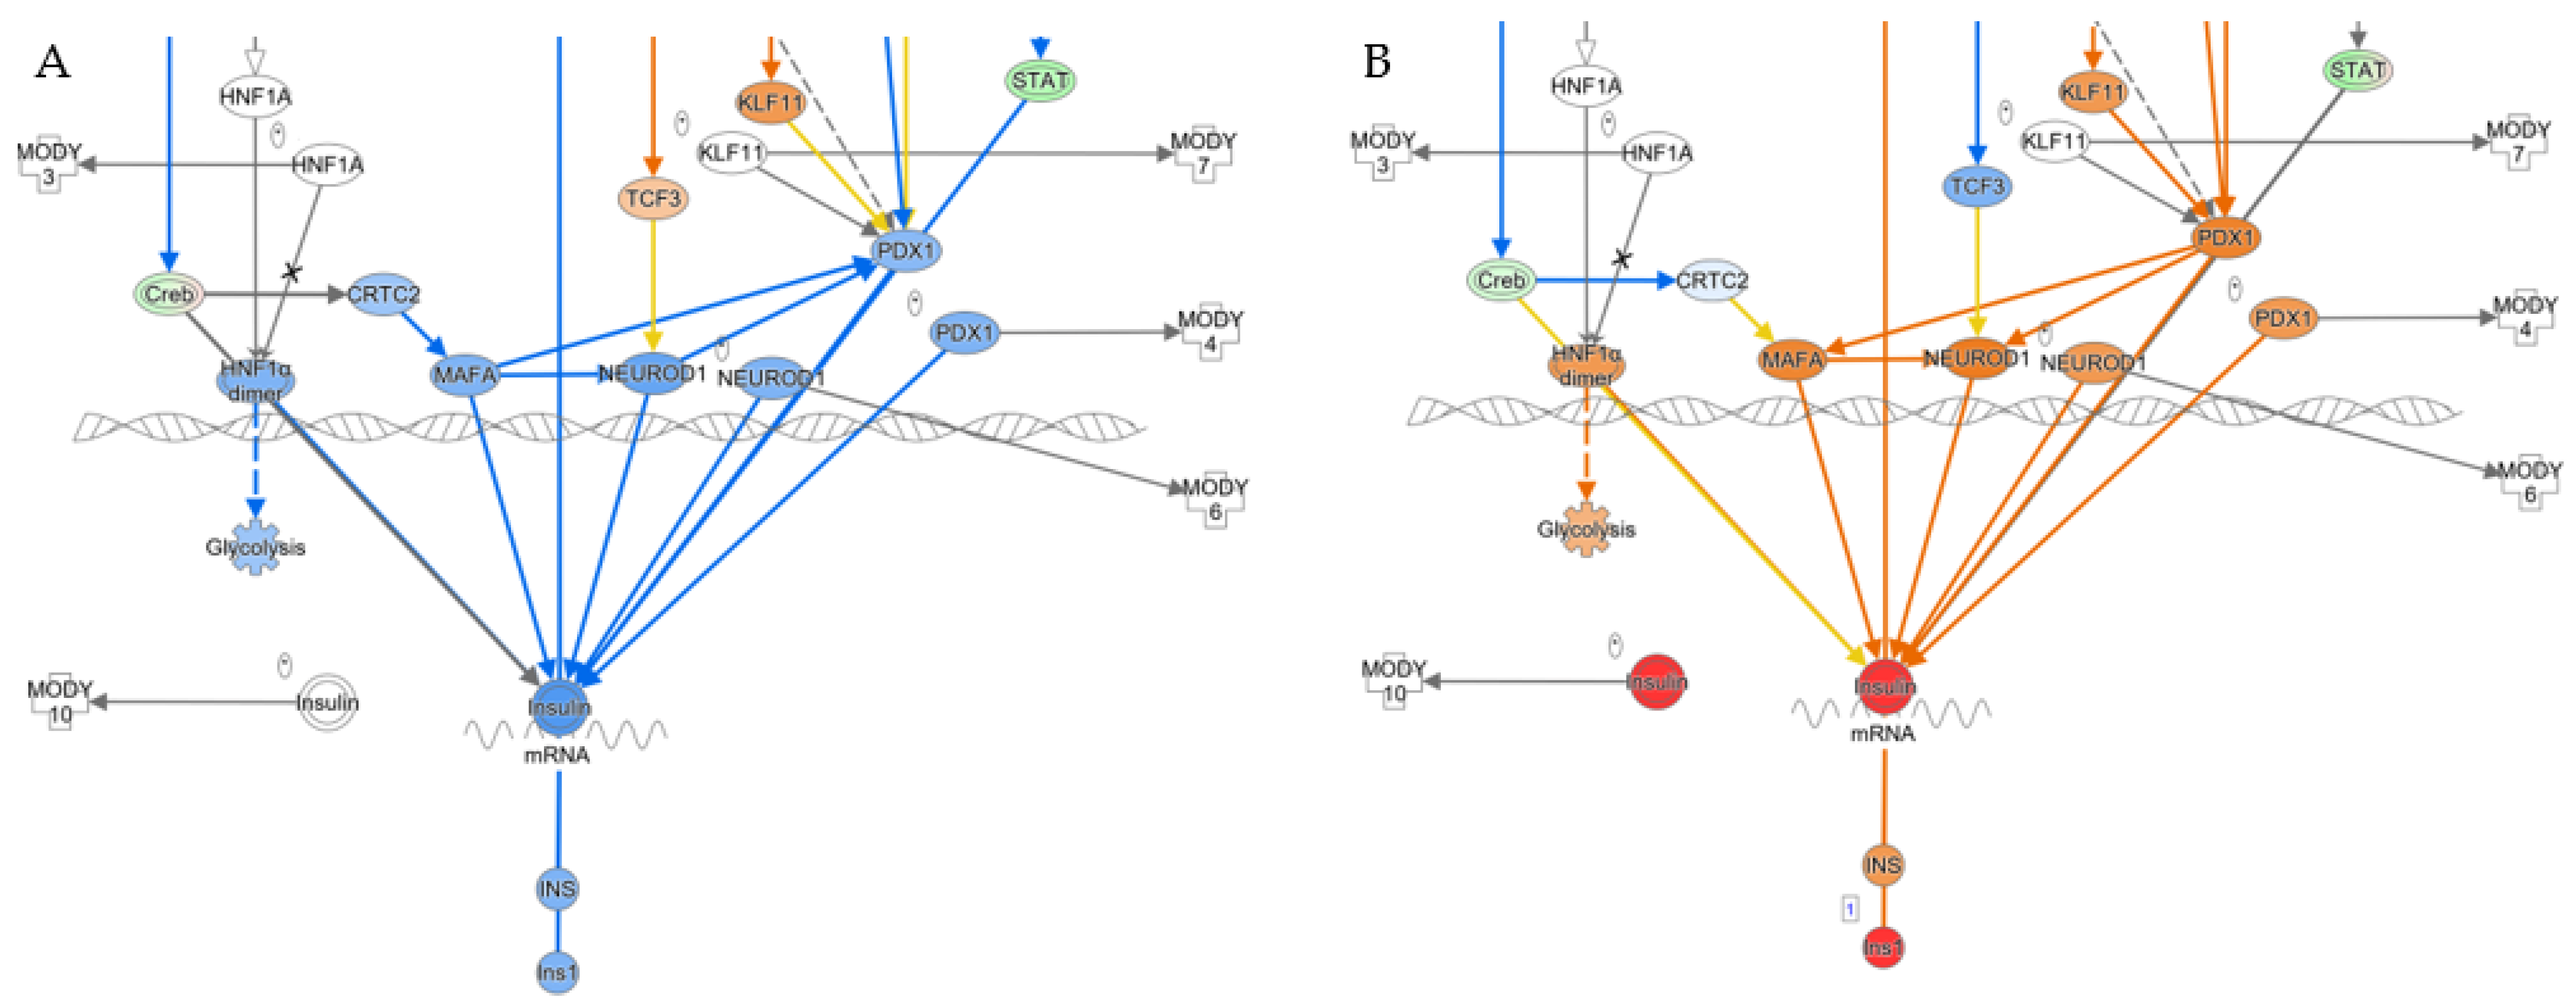
3.4. Pancreatic Markers Are Upregulated in AAV8/piggyBac-INS-FUR Transduced Liver and Downregulated in Diabetic Liver

To understand whether transduction with the AAV8 or piggyBac vectors had caused any β-cell developmental changes in the liver, a targeted analysis of significant and subtle changes in key pancreatic markers was undertaken in treated livers compared to normal. An existing transcriptomic dataset of normal β-cells in IPA was used to determine whether any treatment groups shared similarities to the β-cell gene expression profile. The insulin secretion pathway was chosen for further analysis as this indicates the liver-to-pancreas functional transition (Figure 5, Table 2). In the overlay of the piggyBac-transduced liver gene expression profile on the insulin secretion pathway, insulin and crucial pancreatic transcription factors such as Pdx1, NeuroD1, and MafA were observed to be activated (Figure 5B). Conversely, in the diabetic liver, insulin and all pancreatic transcription factors were found to be inhibited (Figure 5A).
There is a clear difference in the diabetic and piggyBac-transduced liver expression profile overlays of the insulin secretion pathway. However, the differences did not reach statistical significance (Table 2). To investigate these more subtle directional relationships in the insulin secretion pathway, four additional important regulators within the pathway, Pdx1, Ins1, Gck and HNF4-α, were selected for validation by RT-qPCR (Figure 6). The RT-qPCR results confirmed significant upregulation of Pdx1 and Gck in piggyBac-transduced liver compared to normal. These genes were either not present or not significantly upregulated in diabetic and AAV-transduced liver. With the exception of Ins1, RT-qPCR results were consistent with the directional activation given by IPA (Figure 6). IPA analysis predicted significant upregulation of Ins1 in the piggyBac-transduced liver. However, it was not corroborated by RT-qPCR. La et al. also reported the absence of Ins1 in the piggyBac treated samples. However, INS-FUR expression was significantly upregulated [13]. Considering the RT-qPCR and activation Z-scores from IPA, it would appear that the piggyBac-transduced liver is the only sample in which the insulin secretion pathway may be upregulated, however not to a point where endogenous insulin can be produced.

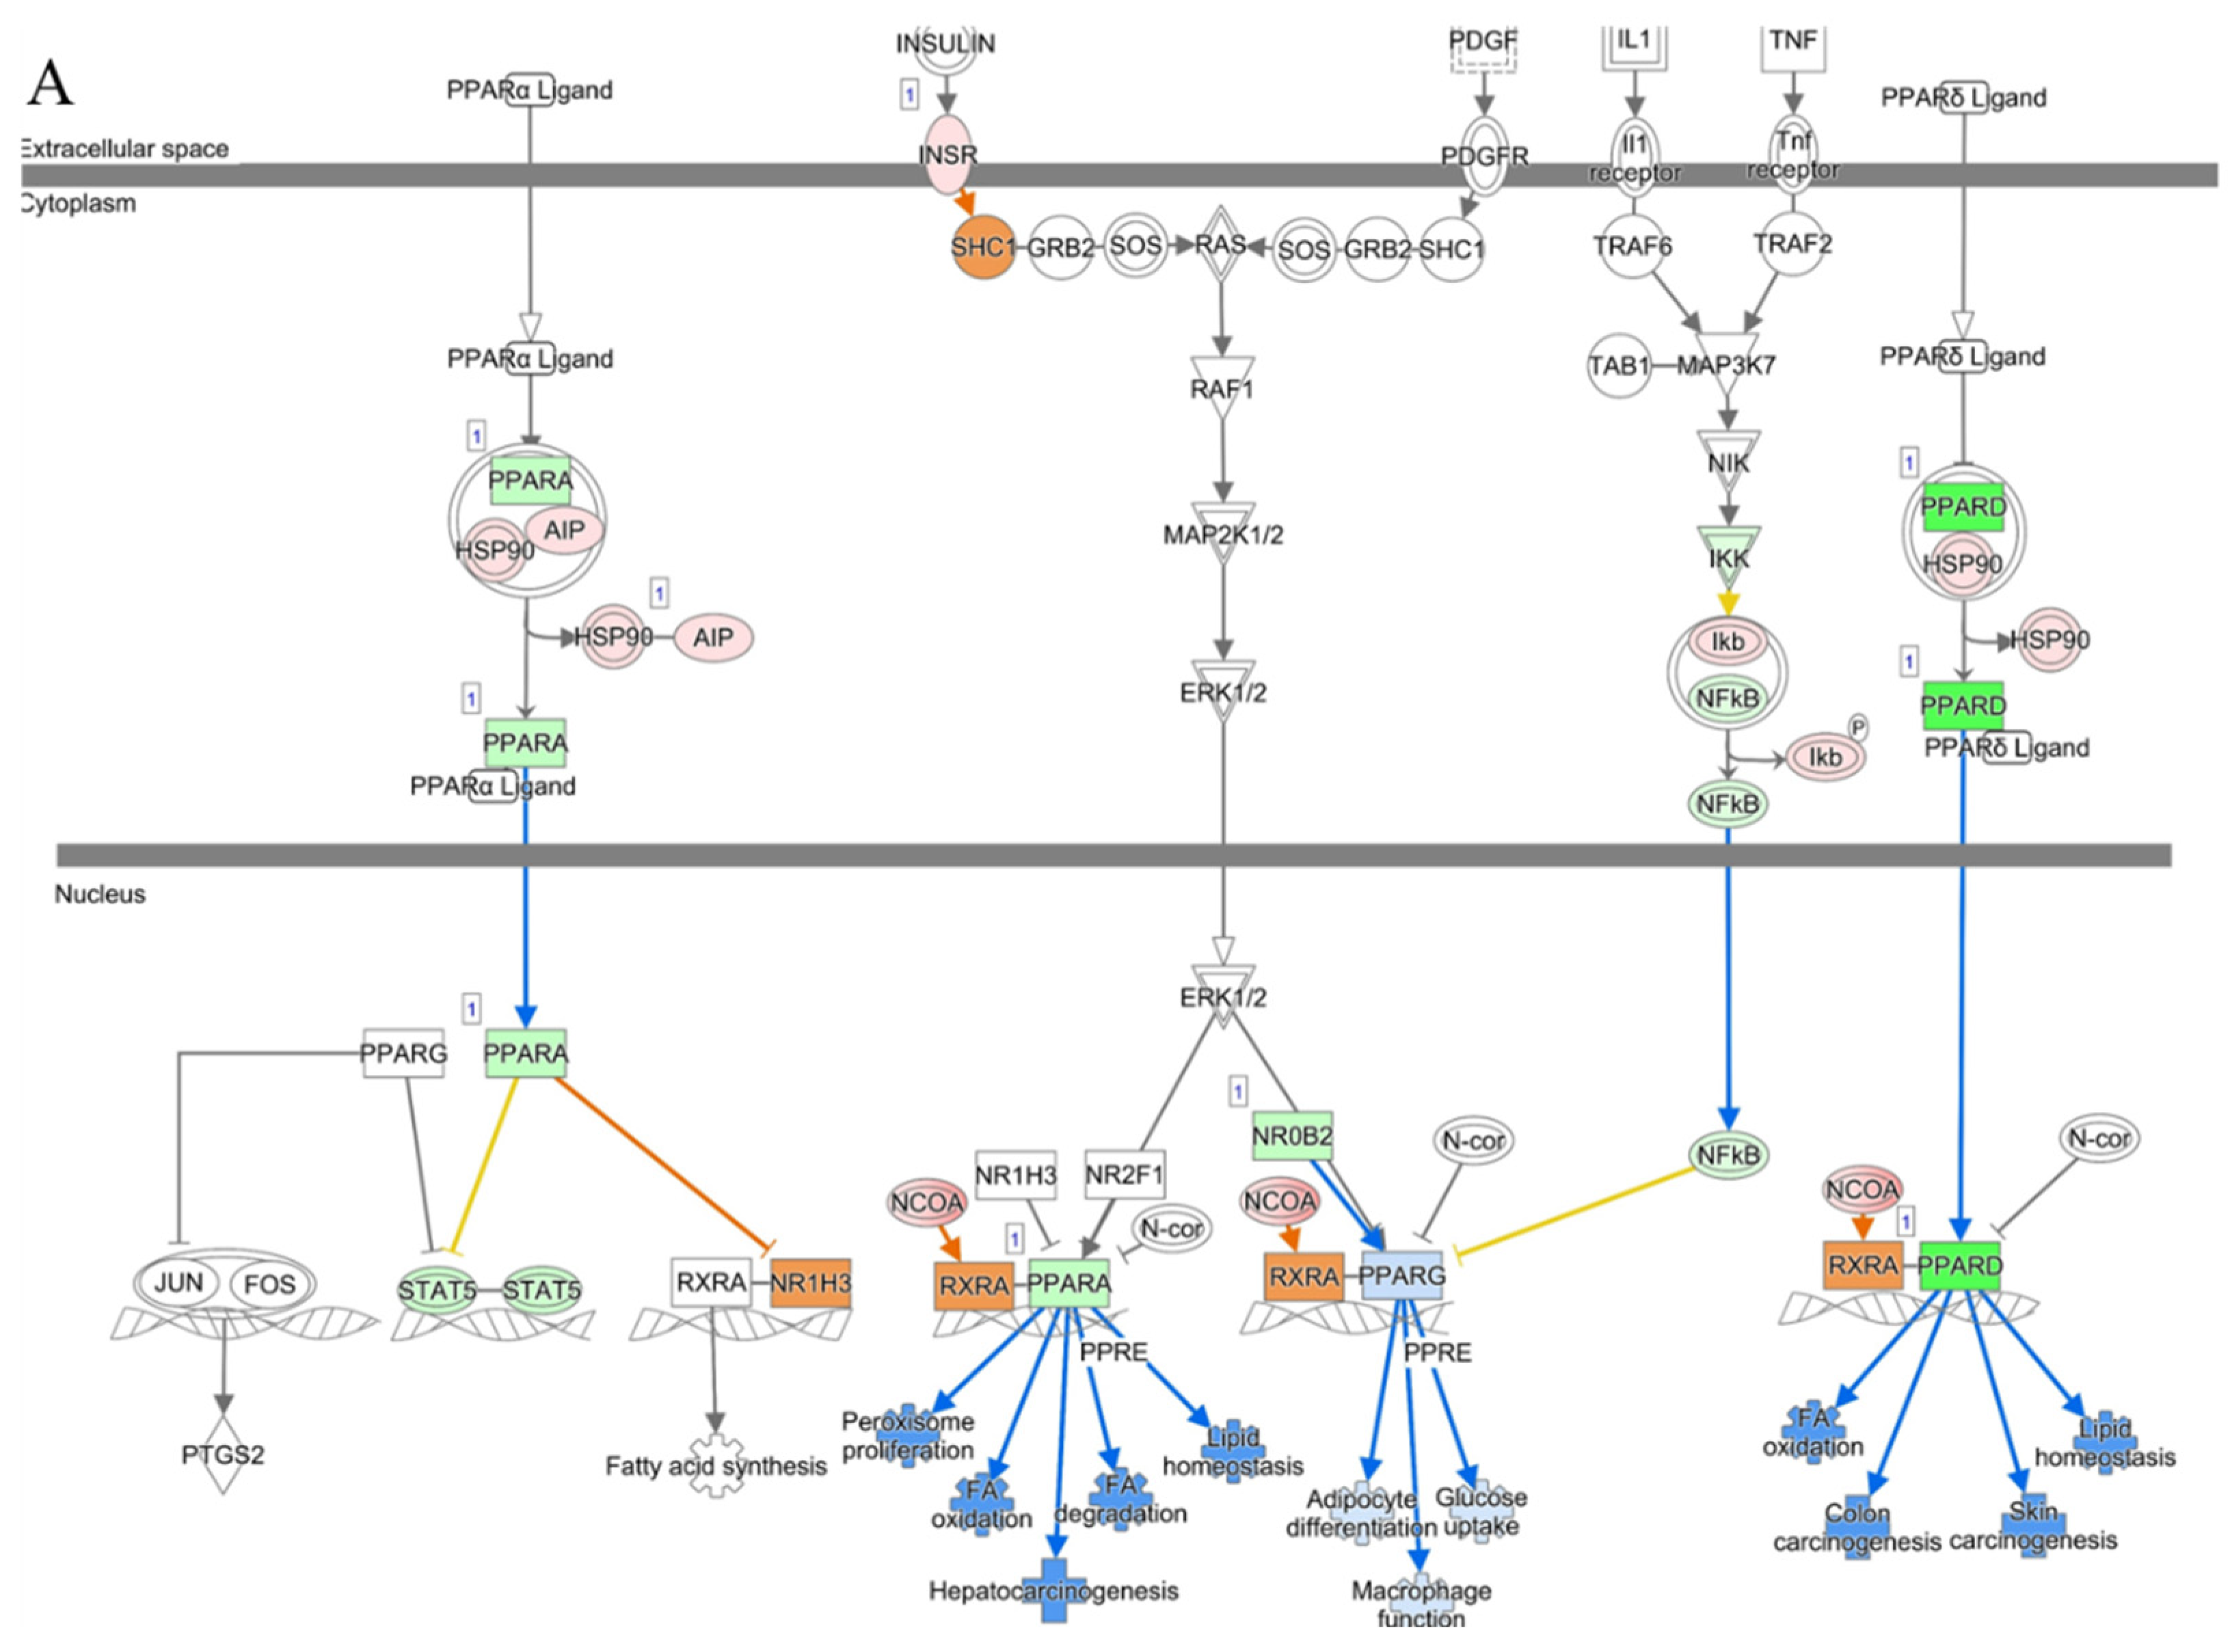
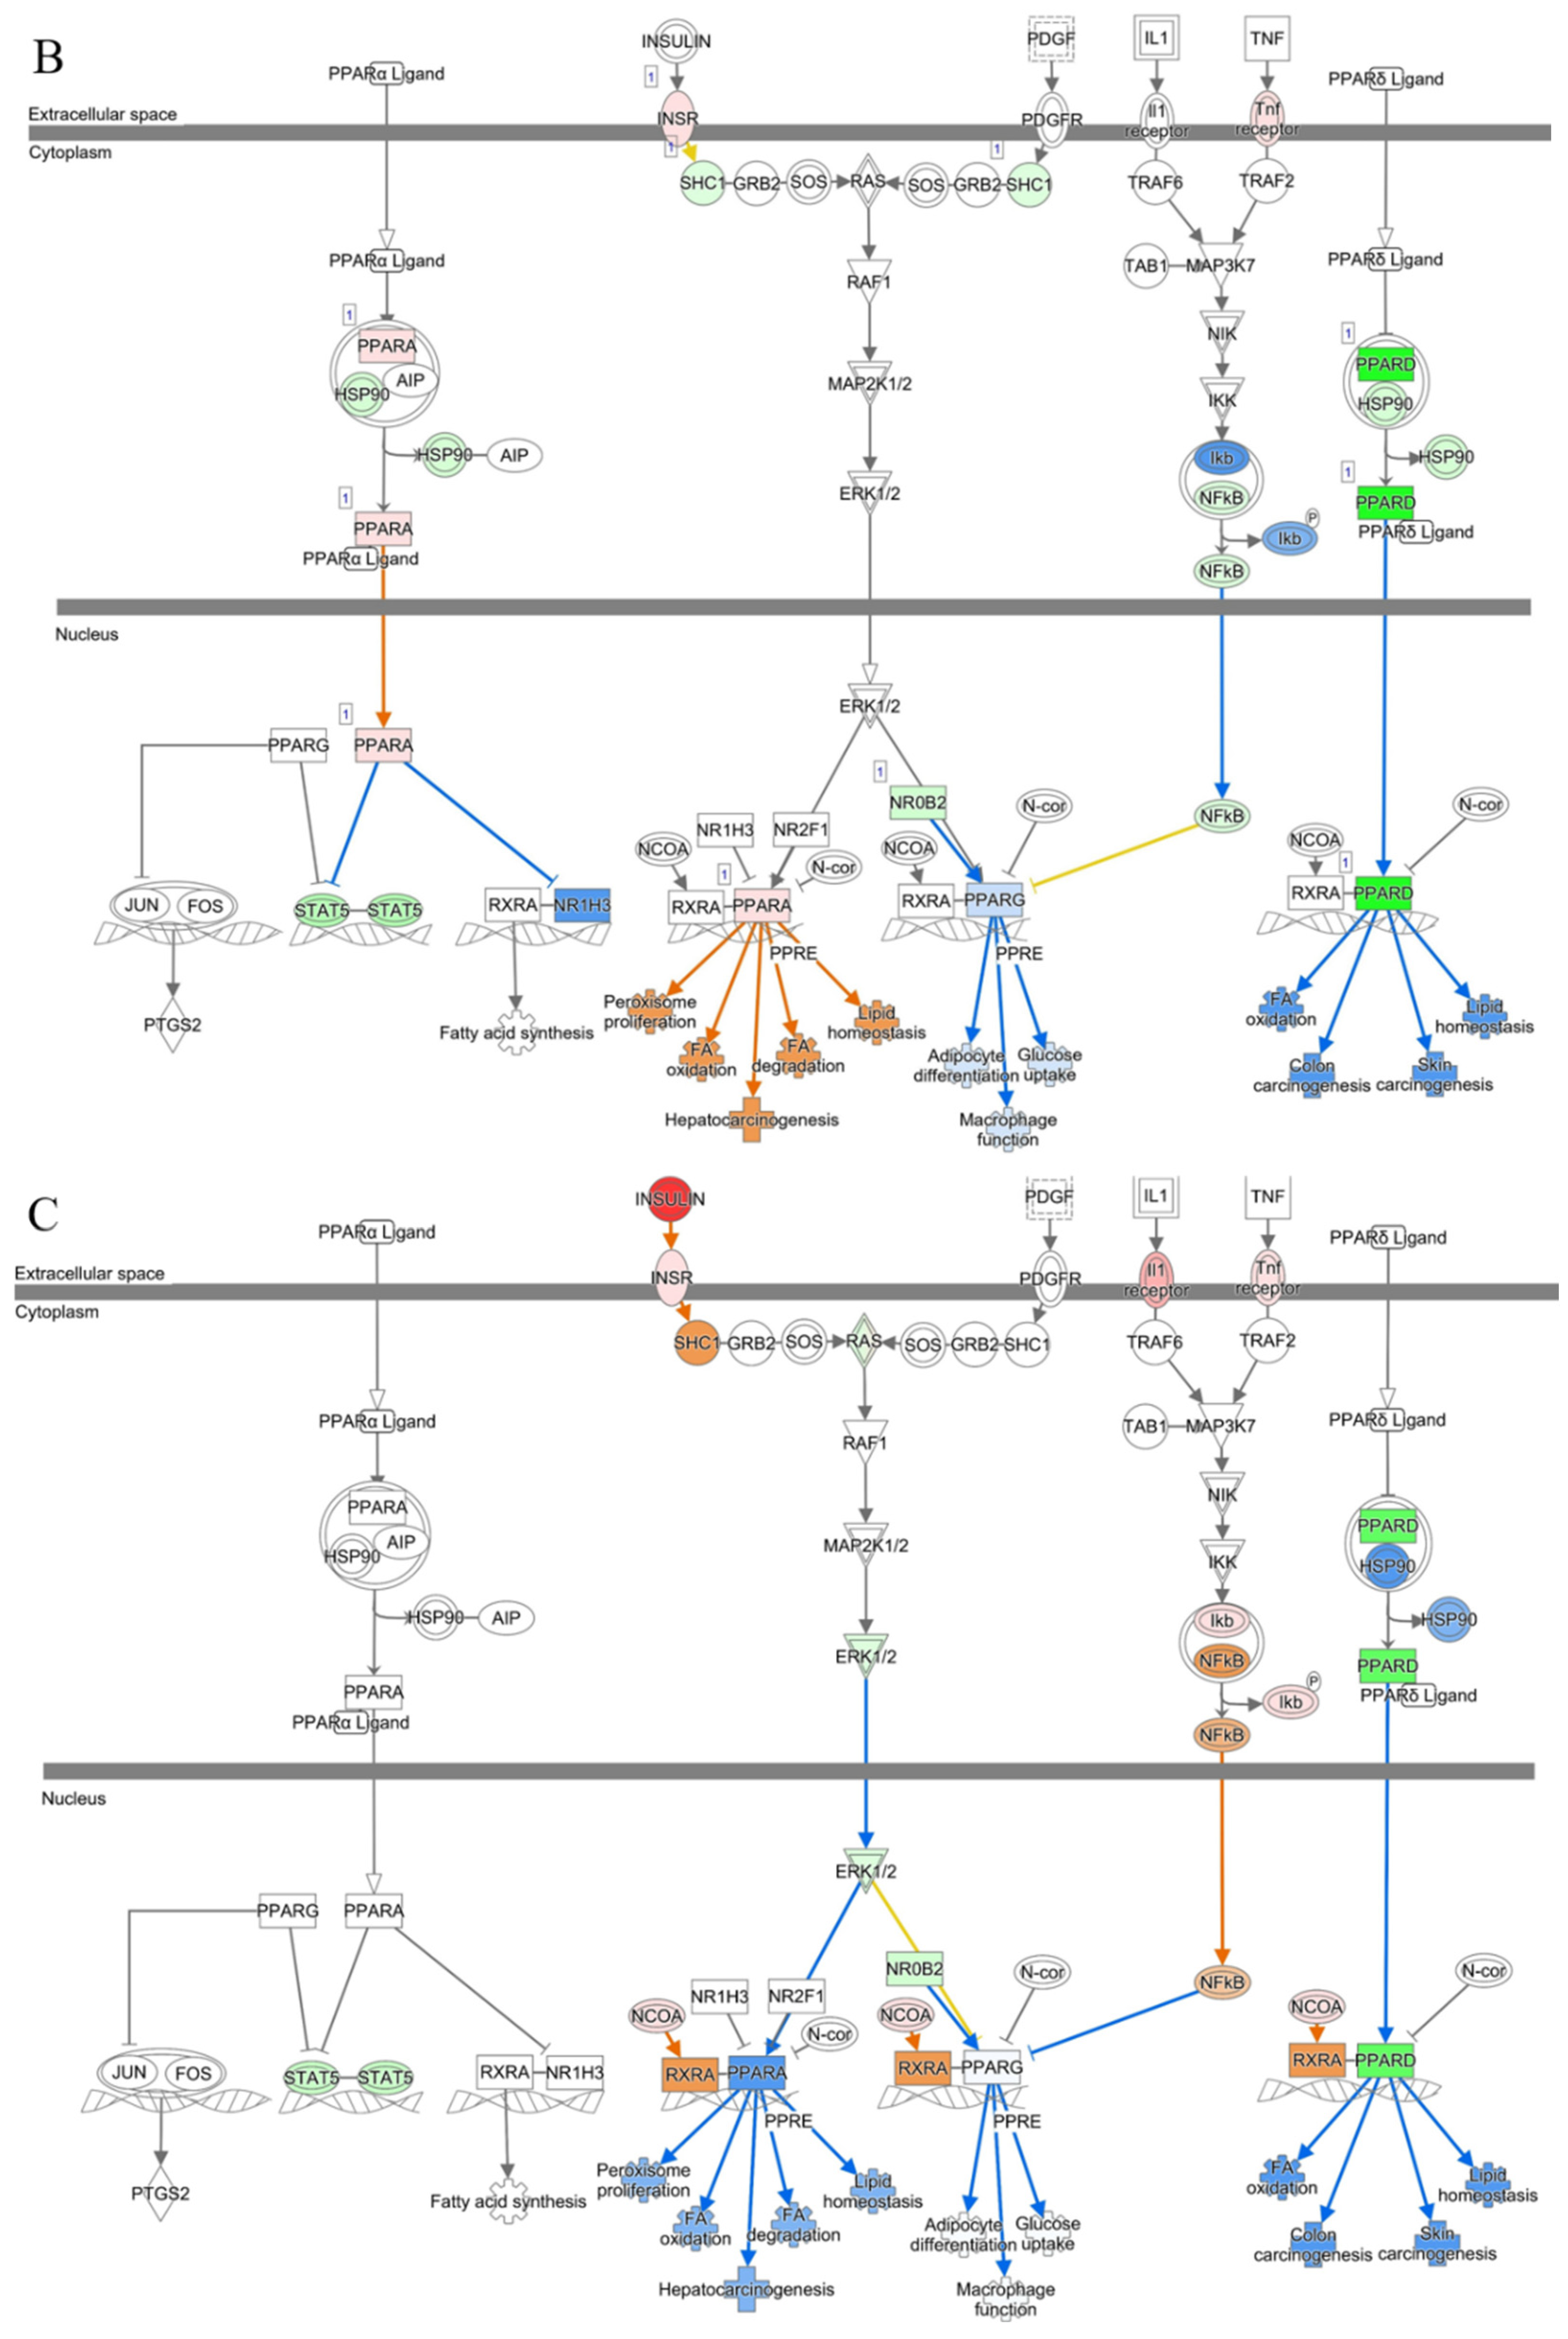
3.5. Liver Function Is Maintained in AAV8/piggyBac-INS-FUR Treatment

To assess the applicability of this treatment clinically, a targeted analysis of markers of liver function was also investigated. The PPAR family modulates lipid homeostasis and can be used to indicate liver function [20]. The overlay of the gene expression profile of each treatment on the PPAR pathway showed slight differences, with the AAV-transduced liver overlay showing activation of molecules throughout the pathway, particularly PPAR-α (Figure 7). The Z-score of the PPAR pathway overlays across the different treatment groups was highest in the AAV-transduced liver (Table 3).
Key indicators of the PPAR Signaling pathway and liver function, PPAR-α and PPAR-δ, were chosen for gene expression validation by RT-qPCR (Figure 8). Activation of PPAR-α across the treatments was investigated by RT-qPCR, showing significant upregulation in AAV-transduced liver, where there was no significant upregulation in either diabetic or piggyBac-transduced samples. For PPAR-δ, there was little difference between the normal liver and all treatment groups. Thus, the piggyBac-transduced liver showed expression of the hepatic markers as similar to normal. However, significant differences were observed with the AAV-transduced liver, suggesting liver function may have been impacted by the AAV treatment.

4. Discussion

The difficulty in managing the currently available treatments and the subsequent side effects makes it crucial that an effective and cost-efficient treatment is developed for individuals living with T1D. In the study by La et al., the delivery of INS-FUR by a piggyBac vector achieved normoglycaemia, whereas the delivery of INS-FUR by AAV8 could not [13]. Although normoglycaemia was achieved, no biological evidence of pancreatic transdifferentiation was observed, and it is therefore likely that the higher hepatic insulin levels seen in the animals transduced with the piggyBac vector were a result of stable integration of the gene not seen when the episomal AAV8 system was employed. The present study analysed gene expression data (via RNA-Seq) from liver tissues of diabetic animals and animals transduced with AAV8 and piggyBac, compared to liver samples from normal (untreated) animals. These analyses were conducted to investigate differences between the treatments and detect any evidence of pancreatic transdifferentiation. Additionally, the analyses were used to determine how the transcriptomic profile of the treatment that achieved normoglycaemia compared to that of a diabetic liver, a normal liver, and a normal β-cell.
Compared to the normal liver, the diabetic liver sample had the largest number of DEGs, and the piggyBac-transduced liver had the smallest number (Figure 2). The selected threshold log fold change of ≥1 and ≤−1 and FDR p-value of ≤0.05 was below the significance level. This allows the pathway analysis to be based on a larger data pool and not miss potentially biologically relevant directional inferences on downstream functions. The differential gene expression observed between the treatment groups compared to the normal liver mapped mostly to metabolic, immune response and cellular growth pathways. Of particular interest, the cholesterol biosynthesis pathways (1, 2 and 3) were found to be differentially modulated in the diabetic and piggyBac treated liver samples when compared to the normal liver, being significantly activated in AAVPB, and significantly inhibited in DL, which could be a result of the ability to break down glucose in the AAVPB transduced liver, alleviating the effects of diabetes on cholesterol synthesis. The synthesis of cholesterol is an energetically expensive pathway, and because of this, the breakdown of glucose by insulin is a very important regulator of its synthesis [21]. Acetyl-CoA, produced from glucose metabolism, results in an increase of regulatory genes, PCSK9 and CYP51A1, leading to the expression of important regulatory enzymes in the pathway, including HMGCR and DHCR7 [22,23]. PCSK9 is a key regulator of cholesterol metabolism, and deficiency in PCSK9 has been shown to result in a build-up of cholesterol, which particularly impairs insulin secretion [24,25]. HMGCR and DHCR7 are both pivotal in the cholesterol biosynthesis process, with HMGCR acting early and DHCR7 being in the late stage [26,27]. All these markers for cholesterol biosynthesis are significantly downregulated in DL due to the diabetic disease process. However, these markers are upregulated in AAVPB. As the breakdown of glucose is a key regulator of the cholesterol biosynthetic pathway, the upregulation of these key molecules further indicates that the piggyBac treatment has allowed for normoglycemic conditions rather than diabetic. This notion is further confirmed by the significant inhibition of the gluconeogenesis pathway in AAVPB and significant activation in diabetic and AAV samples where insulin is not available for glucose uptake and breakdown of energy. A similar finding was observed in a study that reported the occurrence of gluconeogenesis in T1D subjects in both resting and exercise states [28].
Further data analyses were undertaken to investigate the presence of pancreatic markers across the treatments compared to levels of these markers in a normal β-cell. Pancreatic markers were chosen based on their importance in β-cell development and glucose-stimulated insulin release. The selected markers were validated for presence and expression level by RT-qPCR analysis. With the exception of Gck, pancreatic markers were all predicted to be activated in the AAVPB transduced liver. All markers were predicted to be inhibited or not present in the diabetic sample. In the case of Gck, the predicted activation Z-score was −0.583 for AAVPB. However, validation by RT-qPCR gave a significant fold change of 2.78 relative to normal, which was higher than predicted for a normal β-cell. This result suggests that when there are limited numbers of DEGs present in the dataset to make inferences on the expression of molecules in the pathway, IPA can be ineffective in predicting downstream effects.
RT-qPCR validation confirmed the presence of Pdx1, Gck, and HNF4α in AAVPB and little to no detection of these markers in the diabetic liver. Ins1 was not detected in any samples despite having an expression log ratio score of 14.001 in AAVPB. These results confirm the absence of pancreatic transdifferentiation and the lack of production of endogenous insulin. However, the upregulation of Pdx1, a key pancreatic transcription factor that does not naturally occur in the liver, indicates that a level of reprogramming of the liver cells may have occurred [29]. It should be noted that although a 4.87-fold upregulation of Pdx1 was obtained by RT-qPCR analysis, the Ct value was very low (36). Evidence of reprogramming was further observed in the upregulation of Gck, a very important enzyme in regulating blood glucose, and HNf4α, which, among other roles, has proven to play a crucial role in pancreatic function [30]. The presence of these pancreatic markers suggests that not only was normoglycemia achieved in the piggyBac-treated NOD mice, but there is evidence of some reprogramming of liver cells occurring. However, not to a point where a β-like phenotype has been produced.
Hepatic markers were investigated to determine if the treatments affected liver function. The PPAR family of ligand-activated transcription factors (including PPAR-α, PPAR-δ, PPAR-β and PPAR-γ) are known regulators of many cellular functions in the liver, in particular, the regulation of expression of genes related to metabolic homeostasis [31,32]. The dysregulated expression of members of the PPAR family has been researched extensively in the context of diagnostic and therapeutic potential. Significant upregulation of PPAR-α, observed in AAV-treated liver samples, is often seen in the fasting state, favoring the expression of genes involved in fatty acid oxidation and gluconeogenesis [33]. Both IPA and RT-qPCR analyses of the hepatic markers showed insignificant upregulation or no difference between the normal and piggyBac treated liver samples. Limited unpublished data from the La et al. study on AST and ALT levels of normal and piggyBac-INS_FUR liver samples, which had normalized blood glucose, indicated no significant difference between the levels of these liver enzymes. For example, at the end of the experiment, the levels for normal animals were: (ALT: 258.9 U/L ± 20.4 and AST: 371.7 U/L ± 29.9) and for piggyBac-INS-FUR livers were (ALT: 279.2 U/L ± 15.4 and AST: 351.2 U/L ±25.4). These results indicate that the piggyBac-treated liver is functioning as a normal or untreated liver would. However, further thorough investigations must be done to confirm that this is the case.
RNA-Seq data and pathway analysis are valuable for determining the biological effects and differences in results obtained for a novel treatment like the piggyBac vector system. Considering all evidence gathered from pathway analysis and RT-qPCR, there is a distinct difference between the diabetic and the AAV8, and piggyBac transduced livers compared to the normal liver. Unlike the AAV8 treatment, which did not incorporate a transposon system, the piggyBac treatment achieved normoglycaemia. Consequently, it alleviated the effects of T1D on cholesterol biosynthesis and glucose metabolism and induced the upregulation of key pancreatic markers. Although these results indicate that this is an effective treatment, for this to be a clinically applicable and long-term solution, it is likely pancreatic transdifferentiation is required. The transcriptomic profile of the piggyBac treated livers does not indicate this has occurred.
This study has successfully outlined differences in cellular effects between each treatment, specifically in relation to metabolism, pancreatic markers, and liver function markers. This is a valuable contribution to understanding the underlying genetic mechanisms of these treatments and what is required to develop a treatment in which permanent reversal of T1D is achieved. Future research should utilize this piggyBac system or another integrating viral vector to deliver β-cell transcription factors. Current research indicates that the delivery of transcription factors can cause the reprogramming of somatic cells and the transdifferentiation of one cell lineage to another. This has been observed previously using a combination of Pdx1, NeuroD1, Ngn3 and MafA and allowed for permanent glucose-stimulated insulin secretion [34,35,36,37,38].

Supplementary Materials

The following supporting information can be downloaded at: https://www.mdpi.com/article/10.3390/ijtm3030026/s1, Figure S1: Flow chart outlining methodology used to anlayse and validate RNA-Seq data. Table S1: Concentration and quality analysis of extracted RNA using a Nanodrop Spectrophotometer. Figure S2: Quality analysis of RNA extractions using Agilent RNA ScreenTape System. The determined RNA integrity numbers are shown under the gel image. Figure S3: Volcano plot of −log10 (p-value) vs Log2 fold change. −Log10 (p-value) represents the significance level and Log2 represents the fold change of each gene compared to the normal liver sample. The red outlines encompass all genes with a log2 fold change of ≤−1 and ≥1 and a p-value of ≤0.05. (A) Diabetic Liver vs Normal Liver, (B) AAV-transduced Liver vs Normal Liver, (C) piggyBac-transduced liver vs Normal Liver. Supplementary Material S1: The sequence of the vector used. Supplementary Material S2: The RNA-Seq data quality.

Author Contributions

Conceptualization: A.L.G.M., A.M.S. and N.T.N.; methodology: A.L.G.M. and S.J.; software: A.L.G.M. and S.J.; validation: A.L.G.M.; formal analysis: A.L.G.M.; writing—original draft preparation: A.L.G.M.; writing—review and editing: A.L.G.M., N.T.N., A.M.S. and S.J; Funding: A.M.S. and N.T.N. All authors have read and agreed to the published version of the manuscript.

Funding

Funded by the National Health and Medical Research Council of Australia, Project grant no. 1086256. A.L.G.M. was supported by the Australian Government Research Training Stipend.

Institutional Review Board Statement

The animal experiments for which the samples were obtained for this study were approved by the Animal Care and Ethics Committee, University of Technology Sydney (ETH17-1559).

Informed Consent Statement

Not applicable.

Data Availability Statement

The datasets supporting the conclusions of this article are available in the GEO (Gene Expression Omnibus) (Home—GEO—NCBI (nih.gov (accessed on 25 June 2023)) repository. (GSE235925, GEO Accession viewer (nih.gov)). The RNA quality analysis, RNA Sequencing quality analysis and further figures are all available as Supplementary Materials.

Acknowledgments

The authors thank the Ramaciotti Centre for conducting the RNA sequencing and for their assistance with quality analysis.

Conflicts of Interest

The authors declare no conflict of interest.

Abbreviation

AAVAdeno-Associated Viral Vector-INS-FUR transduced liver
AAV8Adeno-Associated Viral Vector Serotype 8 treatment
AAVPBAdeno-Associated Viral Vector/piggyBac-INS-FUR transduced liver
CYP51A1Cytochrome P450 Family 51 Subfamily A Member 1
DEGDifferentially Expressed Gene
DHCR77-Dehydrocholesterol Reductase
DLDiabetic liver
FFOFull flow occlusion
Gckglucokinase
GEGene Expression
HMGCR3-Hydroxy-3-Methylglutaryl-CoA Reductase
HNF4-αHepatocyte nuclear factor 4 alpha
Ins1Endogenous mouse insulin
INS-FURFurin cleavable insulin gene
IPAIngenuity Pathway Analysis
NODNon-obese diabetic
PCSK9Proprotein convertase subtilisin/kexin type 9
Pdx1Pancreatic and duodenal homeobox 1
piggyBacAdeno-Associated Viral Vector/piggyBac-INS-FUR treatment
PPAR-αPeroxisome proliferator-activated receptor-alpha
PPAR-δPeroxisome proliferator-activated receptor-delta
RNA-SeqRNA Sequencing Data
T1DType 1 Diabetes

References

  1. Federation, I.D. Type 1 Diabetes. Available online: https://idf.org/about-diabetes/type-1-diabetes/ (accessed on 23 August 2023).
  2. Atkinson, M.A.; Maclaren, N.K. The pathogenesis of insulin-dependent diabetes mellitus. N. Engl. J. Med. 1994, 331, 1428–1436. [Google Scholar] [PubMed]
  3. Hovorka, R. Closed-loop insulin delivery: From bench to clinical practice. Nat. Rev. Endocrinol. 2011, 7, 385–395. [Google Scholar] [CrossRef] [PubMed]
  4. Ryan, E.A.; Lakey, J.R.; Paty, B.W.; Imes, S.; Korbutt, G.S.; Kneteman, N.M.; Bigam, D.; Rajotte, R.V.; Shapiro, A.J. Successful islet transplantation: Continued insulin reserve provides long-term glycemic control. Diabetes 2002, 51, 2148–2157. [Google Scholar] [CrossRef] [PubMed]
  5. Nathwani, A.C.; Reiss, U.M.; Tuddenham, E.G.; Rosales, C.; Chowdary, P.; McIntosh, J.; Della Peruta, M.; Lheriteau, E.; Patel, N.; Raj, D. Long-term safety and efficacy of factor IX gene therapy in hemophilia B. N. Engl. J. Med. 2014, 371, 1994–2004. [Google Scholar] [CrossRef]
  6. Cavazzana-Calvo, M.; Hacein-Bey, S.; Basile, G.v.d.S.; Gross, F.; Yvon, E.; Nusbaum, P.; Selz, F.; Hue, C.; Certain, S.; Casanova, J.-L. Gene therapy of human severe combined immunodeficiency (SCID)-X1 disease. Science 2000, 288, 669–672. [Google Scholar] [CrossRef]
  7. Acland, G.M.; Aguirre, G.D.; Ray, J.; Zhang, Q.; Aleman, T.S.; Cideciyan, A.V.; Pearce-Kelling, S.E.; Anand, V.; Zeng, Y.; Maguire, A.M. Gene therapy restores vision in a canine model of childhood blindness. Nat. Genet. 2001, 28, 92–95. [Google Scholar] [CrossRef]
  8. Ramamoorth, M.; Narvekar, A. Non viral vectors in gene therapy-an overview. J. Clin. Diagn. Res. JCDR 2015, 9, GE01. [Google Scholar] [CrossRef]
  9. Zhang, Y.; Chirmule, N.; Gao, G.-p.; Qian, R.; Croyle, M.; Joshi, B.; Tazelaar, J.; Wilson, J.M. Acute cytokine response to systemic adenoviral vectors in mice is mediated by dendritic cells and macrophages. Mol. Ther. 2001, 3, 697–707. [Google Scholar] [CrossRef]
  10. Mahoney, A.L.; Nassif, N.T.; O’Brien, B.A.; Simpson, A.M. Viral vectors in gene therapy and clinical applications. In Molecular Cloning; IntechOpen: Rijeka, Croatia, 2022. [Google Scholar] [CrossRef]
  11. Thorens, B. GLUT2, glucose sensing and glucose homeostasis. Diabetologia 2015, 58, 221–232. [Google Scholar] [CrossRef]
  12. Ren, B.; O’Brien, B.A.; Byrne, M.R.; Ch’ng, E.; Gatt, P.N.; Swan, M.A.; Nassif, N.T.; Wei, M.Q.; Gijsbers, R.; Debyser, Z. Long-term reversal of diabetes in non-obese diabetic mice by liver-directed gene therapy. J. Gene Med. 2013, 15, 28–41. [Google Scholar] [CrossRef]
  13. La, Q.T.; Ren, B.; Logan, G.J.; Cunningham, S.C.; Khandekar, N.; Nassif, N.T.; O’Brien, B.A.; Alexander, I.E.; Simpson, A.M. Use of a hybrid adeno-associated viral vector transposon system to deliver the insulin gene to diabetic NOD mice. Cells 2020, 9, 2227. [Google Scholar] [CrossRef] [PubMed]
  14. Li, H.-T.; Jiang, F.-X.; Shi, P.; Zhang, T.; Liu, X.-Y.; Lin, X.-W.; San, Z.-Y.; Pang, X.-N. In vitro reprogramming of rat bmMSCs into pancreatic endocrine-like cells. Vitr. Cell. Dev. Biol. Anim. 2017, 53, 157–166. [Google Scholar] [CrossRef] [PubMed]
  15. Huang, Y.; Wan, J.; Guo, Y.; Zhu, S.; Wang, Y.; Wang, L.; Guo, Q.; Lu, Y.; Wang, Z. Transcriptome Analysis of Induced Pluripotent Stem Cell (iPSC)-derived Pancreatic β-like Cell Differentiation. Cell Transplant. 2017, 26, 1380–1391. [Google Scholar] [CrossRef] [PubMed]
  16. Krämer, A.; Green, J.; Pollard, J., Jr.; Tugendreich, S. Causal analysis approaches in ingenuity pathway analysis. Bioinformatics 2014, 30, 523–530. [Google Scholar] [CrossRef]
  17. Livak, K.J.; Schmittgen, T.D. Analysis of relative gene expression data using real-time quantitative PCR and the 2− ΔΔCT method. Methods 2001, 25, 402–408. [Google Scholar] [CrossRef]
  18. Love, M.I.; Huber, W.; Anders, S. Moderated estimation of fold change and dispersion for RNA-seq data with DESeq2. Genome Biol. 2014, 15, 550. [Google Scholar] [CrossRef]
  19. Fenton, N.M.; Nguyen, T.B.; Sharpe, L.J.; Brown, A.J. Refining sugar’s involvement in cholesterol synthesis. Biochim. Biophys. Acta BBA Mol. Cell Biol. Lipids 2022, 1868, 159266. [Google Scholar] [CrossRef]
  20. Dubois, V.; Eeckhoute, J.; Lefebvre, P.; Staels, B. Distinct but complementary contributions of PPAR isotypes to energy homeostasis. J. Clin. Investig. 2017, 127, 1202–1214. [Google Scholar] [CrossRef]
  21. Brown, A.J.; Coates, H.W.; Sharpe, L.J. Cholesterol synthesis. In Biochemistry of Lipids, Lipoproteins and Membranes; Elsevier: Amsterdam, The Netherlands, 2021; pp. 317–355. [Google Scholar]
  22. Motaln, H.; Wagner, K.D.; Debeljak, N.; Rassoulzadegan, M.; Ačimovič, J.; Rozman, D.; Horvat, S. Mouse knockout of the cholesterogenic cytochrome P450 lanosterol 14α-demethylase (Cyp51) resembles Antley-Bixler syndrome. J. Biol. Chem. 2011, 286, 29086–29097. [Google Scholar]
  23. Wang, Y.; Rogers, P.M.; Su, C.; Varga, G.; Stayrook, K.R.; Burris, T.P. Regulation of cholesterologenesis by the oxysterol receptor, LXRα. J. Biol. Chem. 2008, 283, 26332–26339. [Google Scholar] [CrossRef]
  24. Da Dalt, L.; Ruscica, M.; Bonacina, F.; Balzarotti, G.; Dhyani, A.; Di Cairano, E.; Baragetti, A.; Arnaboldi, L.; De Metrio, S.; Pellegatta, F. PCSK9 deficiency reduces insulin secretion and promotes glucose intolerance: The role of the low-density lipoprotein receptor. Eur. Heart J. 2019, 40, 357–368. [Google Scholar] [CrossRef] [PubMed]
  25. Zhang, L.; McCabe, T.; Condra, J.H.; Ni, Y.G.; Peterson, L.B.; Wang, W.; Strack, A.M.; Wang, F.; Pandit, S.; Hammond, H. An anti-PCSK9 antibody reduces LDL-cholesterol on top of a statin and suppresses hepatocyte SREBP-regulated genes. Int. J. Biol. Sci. 2012, 8, 310. [Google Scholar] [CrossRef] [PubMed]
  26. Edwards, P.A.; Muroya, H.; Gould, R.G. In vivo demonstration of the circadian rhythm of cholesterol biosynthesis inthe liver and intestine of the rat. J. Lipid Res. 1972, 13, 396–401. [Google Scholar] [CrossRef] [PubMed]
  27. Prabhu, A.V.; Luu, W.; Li, D.; Sharpe, L.J.; Brown, A.J. DHCR7: A vital enzyme switch between cholesterol and vitamin D production. Prog. Lipid Res. 2016, 64, 138–151. [Google Scholar] [CrossRef] [PubMed]
  28. Petersen, K.F.; Price, T.B.; Bergeron, R. Regulation of net hepatic glycogenolysis and gluconeogenesis during exercise: Impact of type 1 diabetes. J. Clin. Endocrinol. Metab. 2004, 89, 4656–4664. [Google Scholar] [CrossRef]
  29. Leonard, J.; Peers, B.; Johnson, T.; Ferreri, K.; Lee, S.; Montminy, M. Characterization of somatostatin transactivating factor-1, a novel homeobox factor that stimulates somatostatin expression in pancreatic islet cells. Mol. Endocrinol. 1993, 7, 1275–1283. [Google Scholar]
  30. Hansen, S.K.; Párrizas, M.; Jensen, M.L.; Pruhova, S.; Ek, J.; Boj, S.F.; Johansen, A.; Maestro, M.A.; Rivera, F.; Eiberg, H. Genetic evidence that HNF-1α–dependent transcriptional control of HNF-4α is essential for human pancreatic β cell function. J. Clin. Investig. 2002, 110, 827–833. [Google Scholar] [CrossRef]
  31. Evans, R.M. The steroid and thyroid hormone receptor superfamily. Science 1988, 240, 889–895. [Google Scholar] [CrossRef]
  32. Mangelsdorf, D.J.; Thummel, C.; Beato, M.; Herrlich, P.; Schütz, G.; Umesono, K.; Blumberg, B.; Kastner, P.; Mark, M.; Chambon, P. The nuclear receptor superfamily: The second decade. Cell 1995, 83, 835. [Google Scholar] [CrossRef]
  33. Patsouris, D.; Mandard, S.; Voshol, P.J.; Escher, P.; Tan, N.S.; Havekes, L.M.; Koenig, W.; März, W.; Tafuri, S.; Wahli, W. PPARα governs glycerol metabolism. J. Clin. Investig. 2004, 114, 94–103. [Google Scholar] [CrossRef]
  34. Matsuoka, T.-A.; Kawashima, S.; Miyatsuka, T.; Sasaki, S.; Shimo, N.; Katakami, N.; Kawamori, D.; Takebe, S.; Herrera, P.L.; Kaneto, H. Mafa enables Pdx1 to effectively convert pancreatic islet progenitors and committed islet α-cells into β-cells in vivo. Diabetes 2017, 66, 1293–1300. [Google Scholar] [CrossRef] [PubMed]
  35. Yang, Y.-P.; Thorel, F.; Boyer, D.F.; Herrera, P.L.; Wright, C.V. Context-specific α-to-β-cell reprogramming by forced Pdx1 expression. Genes Dev. 2011, 25, 1680–1685. [Google Scholar] [CrossRef] [PubMed]
  36. Xiao, X.; Guo, P.; Shiota, C.; Zhang, T.; Coudriet, G.M.; Fischbach, S.; Prasadan, K.; Fusco, J.; Ramachandran, S.; Witkowski, P. Endogenous reprogramming of alpha cells into beta cells, induced by viral gene therapy, reverses autoimmune diabetes. Cell Stem Cell 2018, 22, 78–90.e74. [Google Scholar] [CrossRef]
  37. Akinci, E.; Banga, A.; Tungatt, K.; Segal, J.; Eberhard, D.; Dutton, J.R.; Slack, J.M. Reprogramming of various cell types to a beta-like state by Pdx1, Ngn3 and MafA. PLoS ONE 2013, 8, e82424. [Google Scholar] [CrossRef]
  38. Nagasaki, H.; Katsumata, T.; Oishi, H.; Tai, P.-H.; Sekiguchi, Y.; Koshida, R.; Jung, Y.; Kudo, T.; Takahashi, S. Generation of insulin-producing cells from the mouse liver using β cell-related gene transfer including Mafa and Mafb. PLoS ONE 2014, 9, e113022. [Google Scholar] [CrossRef] [PubMed]
Figure 1. RNA-Seq gene expression data visualization in scatter plots and a Venn diagram. (AC) Scatter plots of gene expression (GE) data from each treatment group compared to normal. Each plot represents the expression level of a gene in both RNA-Seq datasets being compared. Pearson correlation coefficients (r) are displayed on each graph and represent the degree of similarity of gene expression in the two datasets. (A) Diabetic Liver vs. Normal Liver, (B) AAV-transduced Liver vs. Normal Liver and (C) piggyBac-transduced liver vs. Normal Liver. (D) Venn diagram showing overlaps and differences in the gene expression profiles of all treatment groups with numerical values indicating the numbers of genes expressed in each segment.
Ijtm 03 00026 g001
Figure 2. Differential gene expression (upregulated and downregulated) in the different treatment groups (DL, diabetic liver; AAV, AAV-transduced liver; AAVPB, piggyBac-transduced liver) compared to the normal liver. Genes were selected based on a threshold fold change of ≤−1 and ≥1 and an FDR p-value of ≤0.05.
Ijtm 03 00026 g002
Figure 3. Glucose uptake in the presence of insulin can lead to the synthesis of cholesterol through the interconnecting signaling pathways of (i) the P13K/Akt pathway, (ii) AMPK repression, and (iii) Protein modification by Acetyl-CoA production from glucose breakdown. (iv) Summary of cholesterol biosynthesis, outlining the key enzymes regulating the pathway [19].
Ijtm 03 00026 g003
Figure 4. Gene expression of cholesterol biosynthesis markers obtained from RNA-Seq data and reverse transcriptase quantitative polymerase chain reaction (RT-qPCR) validation of CYP51A1 and PCSK9 in the three treatment groups (DL, diabetic liver; AAV, AAV-transduced liver; AAVPB, piggyBac-transduced liver) compared to normal liver. RT-qPCR results are expressed as means ± SD (n = 3).
Ijtm 03 00026 g004
Figure 5. Insulin secretion pathway shows the activation and inhibition status of the different components of the pathway in the diabetic liver (A) and piggyBac transduced liver (B) overlays. Elements of the pathway in orange or red have an activation Z-score of ≥2 (i.e., activated). Elements of the pathway in blue have an activation Z-score of ≤2 (i.e., inhibited).
Ijtm 03 00026 g005
Figure 6. Gene expression of pancreatic markers Pdx1, Gck, HNF4-α, and Ins1 obtained from RNA-Seq data and validation by reverse transcriptase quantitative polymerase chain reaction (RT-qPCR) in the three treatment groups (DL, diabetic liver; AAV, AAV-transduced liver; AAVPB, piggyBac-transduced liver) compared to normal liver. RT-qPCR results are expressed as means ± SD (n = 3).
Ijtm 03 00026 g006
Figure 7. PPAR Signaling Pathway showing the activation and inhibition status of the different components of the pathway in the diabetic liver (A), AAV transduced liver (B) and piggyBac transduced (C) overlays. Elements of the pathway highlighted in orange or red have activation scores of ≥2 (i.e., activated). Elements of the pathway highlighted in blue and green have activation scores of ≤2 (i.e., inhibited).
Ijtm 03 00026 g007aIjtm 03 00026 g007b
Figure 8. Gene expression of liver function markers, PPAR-α and PPAR-δ obtained from RNA-Seq data analysis and validated by reverse transcriptase quantitative polymerase chain reaction in the three treatment groups (DL, diabetic liver; AAV, AAV-transduced liver; AAVPB, piggyBac-transduced liver) compared to normal liver. RT-qPCR results are expressed as means ± SD (n = 3).
Ijtm 03 00026 g008
Table 1. Activation Z-scores for pathways and downstream molecules across all treatment groups compared to normal liver.
Pathway or MoleculeActivation Z-Score *
DL v NormalAAV v NormalAAVPB v Normal
Cholesterol Biosynthesis I−3.320.382.71
Cholesterol Biosynthesis II−3.320.382.71
Cholesterol Biosynthesis III −3.320.382.71
Gluconeogenesis2.712.33−2.45
DHCR7−5.34N/A1.54
HMGCR−4.662.462.76
Akt−2.280.641.62
* Positive score indicates activation of the pathway or molecule, and a negative Z-score indicates inhibition of the pathway or molecule.
Table 2. Activation Z-scores for insulin secretion pathway for all treatments compared to normal liver and beta cells.
PathwayAnalysisActivation Z-Scorep-Value of Overlap
Insulin Secretion PathwayAAVPB v Normal0.90<0.05
AAV v Normal1.57<0.05
DL v Normal1.00 >0.05
Beta cell v others1.54<0.05
Table 3. Activation Z-scores for the PPAR Signaling Pathway across all treatments compared to normal liver and beta cells.
PathwayAnalysisActivation Z-Scorep-Value of Overlap
PPAR
Signaling
AAVPB v Normal0<0.05
AAV v Normal1.51>0.05
DL v Normal0.28<0.05
Beta cell v others−0.63>0.05
Disclaimer/Publisher’s Note: The statements, opinions and data contained in all publications are solely those of the individual author(s) and contributor(s) and not of MDPI and/or the editor(s). MDPI and/or the editor(s) disclaim responsibility for any injury to people or property resulting from any ideas, methods, instructions or products referred to in the content.

