Article

Updating the Phylogeography and Temporal Evolution of Mitochondrial DNA Haplogroup U8 with Special Mention to the Basques

by
Vicente M. Cabrera
Department of Biochemistry, Microbiology, Cell Biology and Genetics, Universidad de La Laguna, 38200 San Cristobal de La Laguna, Spain
Retired.
DNA 2022, 2(2), 104-115; https://doi.org/10.3390/dna2020008
Submission received: 18 November 2021 / Revised: 10 February 2022 / Accepted: 29 March 2022 / Published: 7 April 2022

Abstract

:
Mitochondrial DNA phylogenetic and phylogeographic studies have been very useful in reconstructing the history of modern humans. In addition, recent advances in ancient DNA techniques have enabled direct glimpses of the human past. Taking advantage of these possibilities, I carried out a spatiotemporal study of the rare and little-studied mtDNA haplogroup U8. Today, U8, represented by its main branches U8a and U8b, has a wide western Eurasian range but both with average frequencies below 1%. It is known that, in Paleolithic times, U8 reached high frequencies in European hunter-gatherers. However, it is pertinent to precise that only lineages belonging to U8a and U8c, a sister branch of U8b, were detected at that time. In spite of its wide geographic implantation, U8c was extinct after the Last Glacial Maximum, but U8a subsisted until the present day, although it never reached its high Paleolithic frequencies. U8a is detected mainly in northern and western Europe including the Basques, testifying to a minor maternal Paleolithic continuity. In this respect, it is worth mentioning that Basques show more U8-based affinities with continental European than with Mediterranean populations. On the contrary, coalescent ages of the most ancient U8b clades point to a Paleolithic diversification in the Caucasus and the Middle Eastern areas. U8b-derived branches reached eastern Europe since the Mesolithic. Subsequent Neolithic and post-Neolithic expansions widen its ranges in continental Europe and the Mediterranean basin, including northern Africa, albeit always as a minor clade that accompanied other, more representative, mitochondrial lineages.

Graphical Abstract

1. Introduction

The non-recombinant mitochondrial DNA (mtDNA) lineages have been successfully used as molecular tracers to follow the evolution of human populations over time [1]. Under the hypothesis that one of the earliest mtDNA modern human radiations outside of Africa occurred in Southeast Asia [2], the mtDNA haplogroup U* indicates early westward radiation that reached South Asia and Eurasia in Paleolithic times. One of its western branches is haplogroup U8. Currently, this haplogroup is very rare but paradoxically widely extensive in its geographic range. On average, the frequency of hg U8 is usually below 1%. However, its subclade U8a reaches higher frequencies (3%) in northern European populations from Finland [3] and Novgorod, Russia [4]. On the other hand, its sister subclade U8b shows higher frequencies in Mediterranean isolates such as Corsica Island (4.3%) [5] and the non-Berber population of Zriba (16%), in Tunisia [6]. It is worth noting that, in this U8 description, I excluded the K sub-branch of U8b because it has been already well studied in different population genetic contexts [7,8,9,10].
Based on ancient DNA studies, haplogroup U8 seems to have been much more frequent in hunter-gatherer populations throughout Europe during the Paleolithic and Mesolithic periods [11,12].
Although an early study on the Basque population based on the phylogeny and phylogeography of haplogroup U8 has been published [13], no wide-scale studies for this haplogroup exist.
Taking advantage of the impressive increase in mitochondrial sequences available today, here, I carried out a wide, spatiotemporal analysis of haplogroup U8 using past and present-day population samples throughout its whole geographic range. I found that its main branches U8a and U8b (x K) tell us different but complementary demographic histories and that, in regard to haplogroup U8, Basques show higher genetic affinities with continental European populations than with the Mediterranean ones, including the Iberian Peninsula.

2. Material and Methods

2.1. Samples

Published partial and complete U8 mtDNA sequences were obtained searching the following databases: NCBI GenBank (www.ncbi.nlm.nih.gov/genbank/, (accessed on 30 October 2021)), Mitomap (www.mitomap.org/MITOMAP, (accessed on 18 October 2021)), Ian Logan 2020 (www.ianlogan.co.uk/sequences_by_group/haplogroup_select.htm, (accessed on 18 October 2021)), and AmtDB (http://amtdb.org, (accessed on 8 September 2021)). I also added six unpublished U8 complete mtDNA genome sequences generated in a previous study [2]. These sequences have been deposited in GenBank, with accession numbers OM641816-OM641821.

2.2. Sequence Classification

Sequence assignation to haplogroup U8 and its sub-haplogroups was confirmed using HaploGrep version 2, https://haplogrep.i-med.ac.at, (accessed on 2 November 2021) [14] and PhyloTree build 17 version, http://www.phylotree.org, (accessed on 2 November 2021) [15]. Sequence variants were scored with respect to rCRS. Output raw trees were confirmed and refined by hand. The hotspot 16,519 mutation and indels around nucleotides 309, 522, 573, and 16,193 were excluded from the trees and statistical analysis.

2.3. Match-Based Distances between Populations

To diminish the strong influence of the common haplotypes in frequency-based distances, I used an additional measure of distance based on matches, considering matches pairs of identical sequences or those differing in one or a maximum of two mutations. I implemented a simple algorithm defining IXy, the identity between populations x and y, as the double number of matches between them (2MXY) divided by the product of the number of different lineages in x and y (NX X NY). The distance between populations (DXY) simply equals 1 − IXY.

2.4. Other Statistical Analyses

Fisher’s and chi-square tests were used to analyze 2 × 2 contingence tables. Multidimensional scaling (MDS) was performed with R software. To assess the correlation between frequencies of U8 subclades and geographic coordinates, I used multiple regression analysis as implemented in the free statistical software http://www.statskingdom.com, (accessed on 9 November 2021).

2.5. Coalescence Age Estimations

For estimating coalescence ages, I used the following four approaches: (1) the rho statistic [16] using a substitution rate for the complete mtDNA sequence (16,500 bp) of one substitution every 3624 years [17]; (2) a modified rho statistic that corrects for the time dependency effect [18], using for the most recent period a mutation rate of one mutation every 1408 years [19]; (3) the rho statistic but using only those sequences with the major number of mutations within the clade analyzed [19] and a mutation rate of one mutation in every 3205 years [20]; (4) the rho statistics using ancient mtDNA sequences and the substitution rate of one substitution every 2273 years, deduced by calibration with ancient mtDNA sequences extracted from fossil samples securely radiocarbon dated and applying the branch shortening concept [21].

3. Results

I screened 429,051 mtDNA sequences obtained from present-day samples from the Iberian Peninsula, including the Basque Country (Table S1), Italy (Table S2), the Balkans (Table S3), central Europe (Table S4), western Europe (Table S5), eastern Europe (Table S6), northern Europe (Table S7), the Caucasus (Table S8), Turkey (Table S9), Middle East (Table S10), central Asia (Table S11), South Asia (Table S12) and northern Africa (Table S13). A summary of the frequencies of haplogroup U8 and its subclades U8a and U8b in each of the regions analyzed is provided in Table 1.
From this screening, I obtained a total of 1205 (0.28%) haplogroup U8 sequences, of which 886 (73.5%) are U8a and 319 (26.5%) U8b.
In addition, I screened a total of 7739 ancient mtDNA sequences comprising archaeological periods from the Paleolithic to Historic times (Table S14), summarized in Table 2. The frequency of haplogroup U8 (21.8%) was maximum in the European Paleolithic, represented mainly by its branches U8a (14.5%) and U8c (7.3%), whereas U8b was not detected. After the Last Glacial Maximum (LGM), in Mesolithic times, the U8c branch seems to be extinct, while U8a barely subsisted at very low frequencies in all the subsequent periods. On the other hand, U8b appeared in the Mesolithic (1%) and reached its highest frequency (1.3%) in the Neolithic.

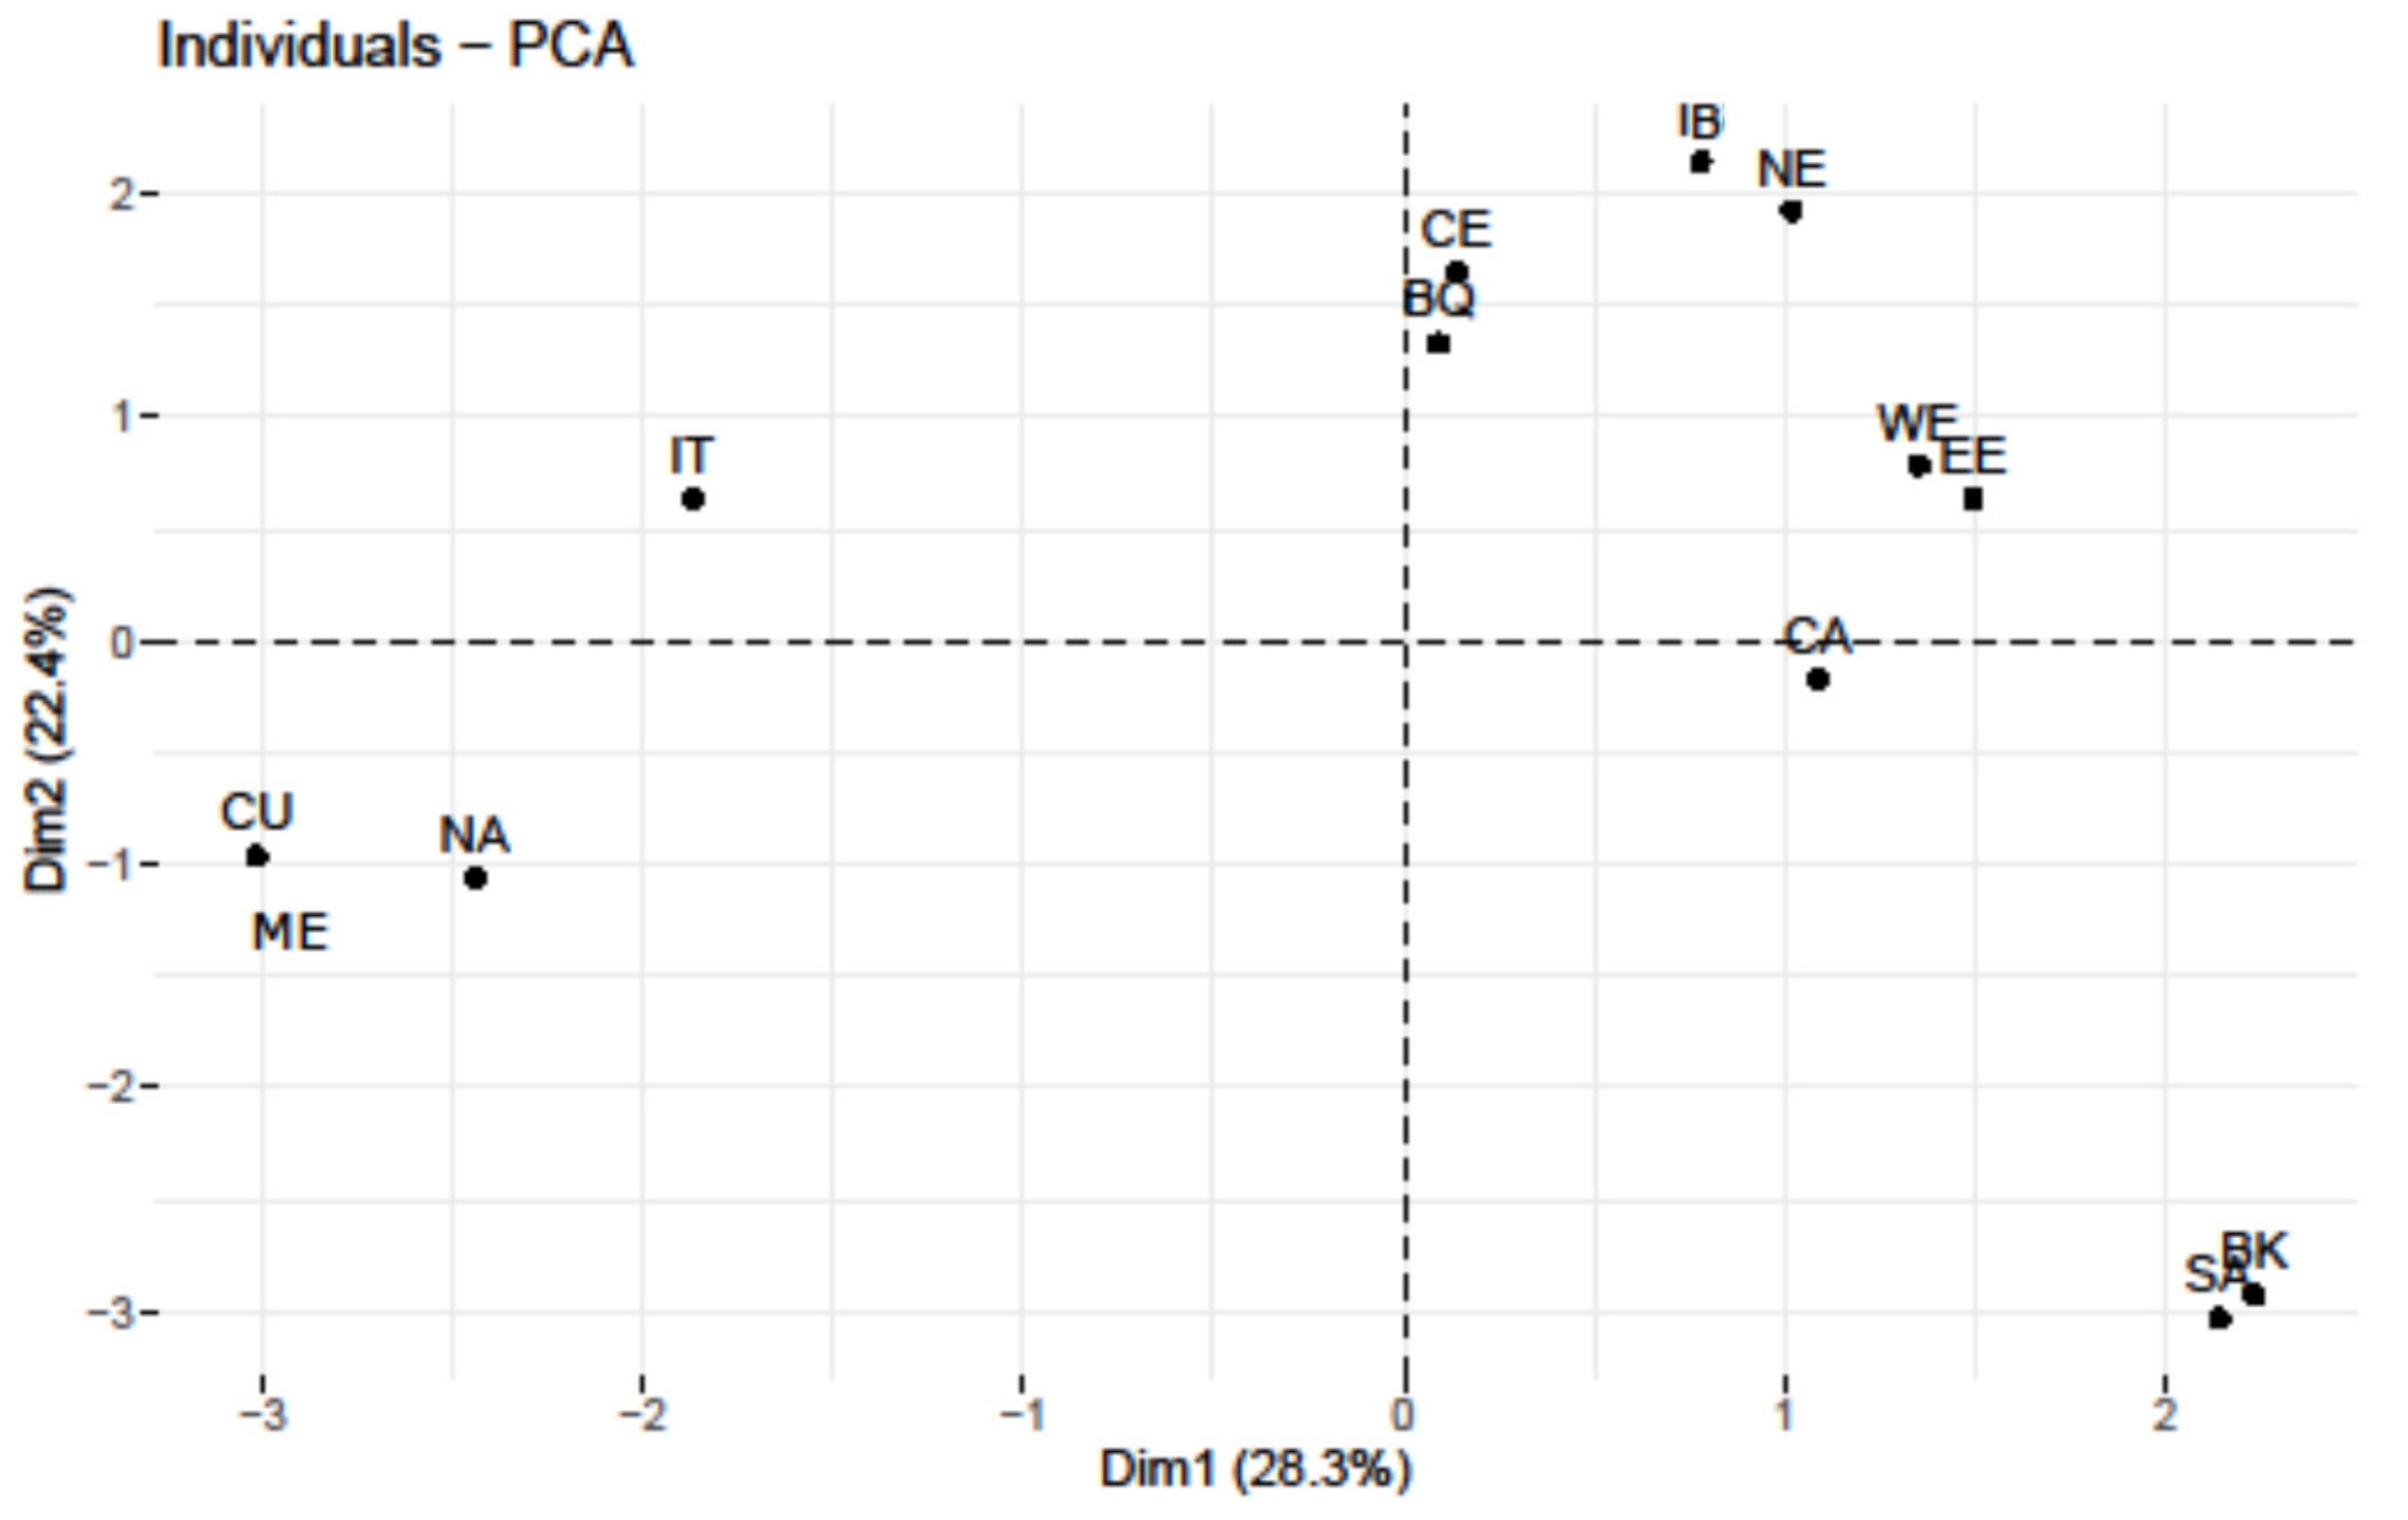
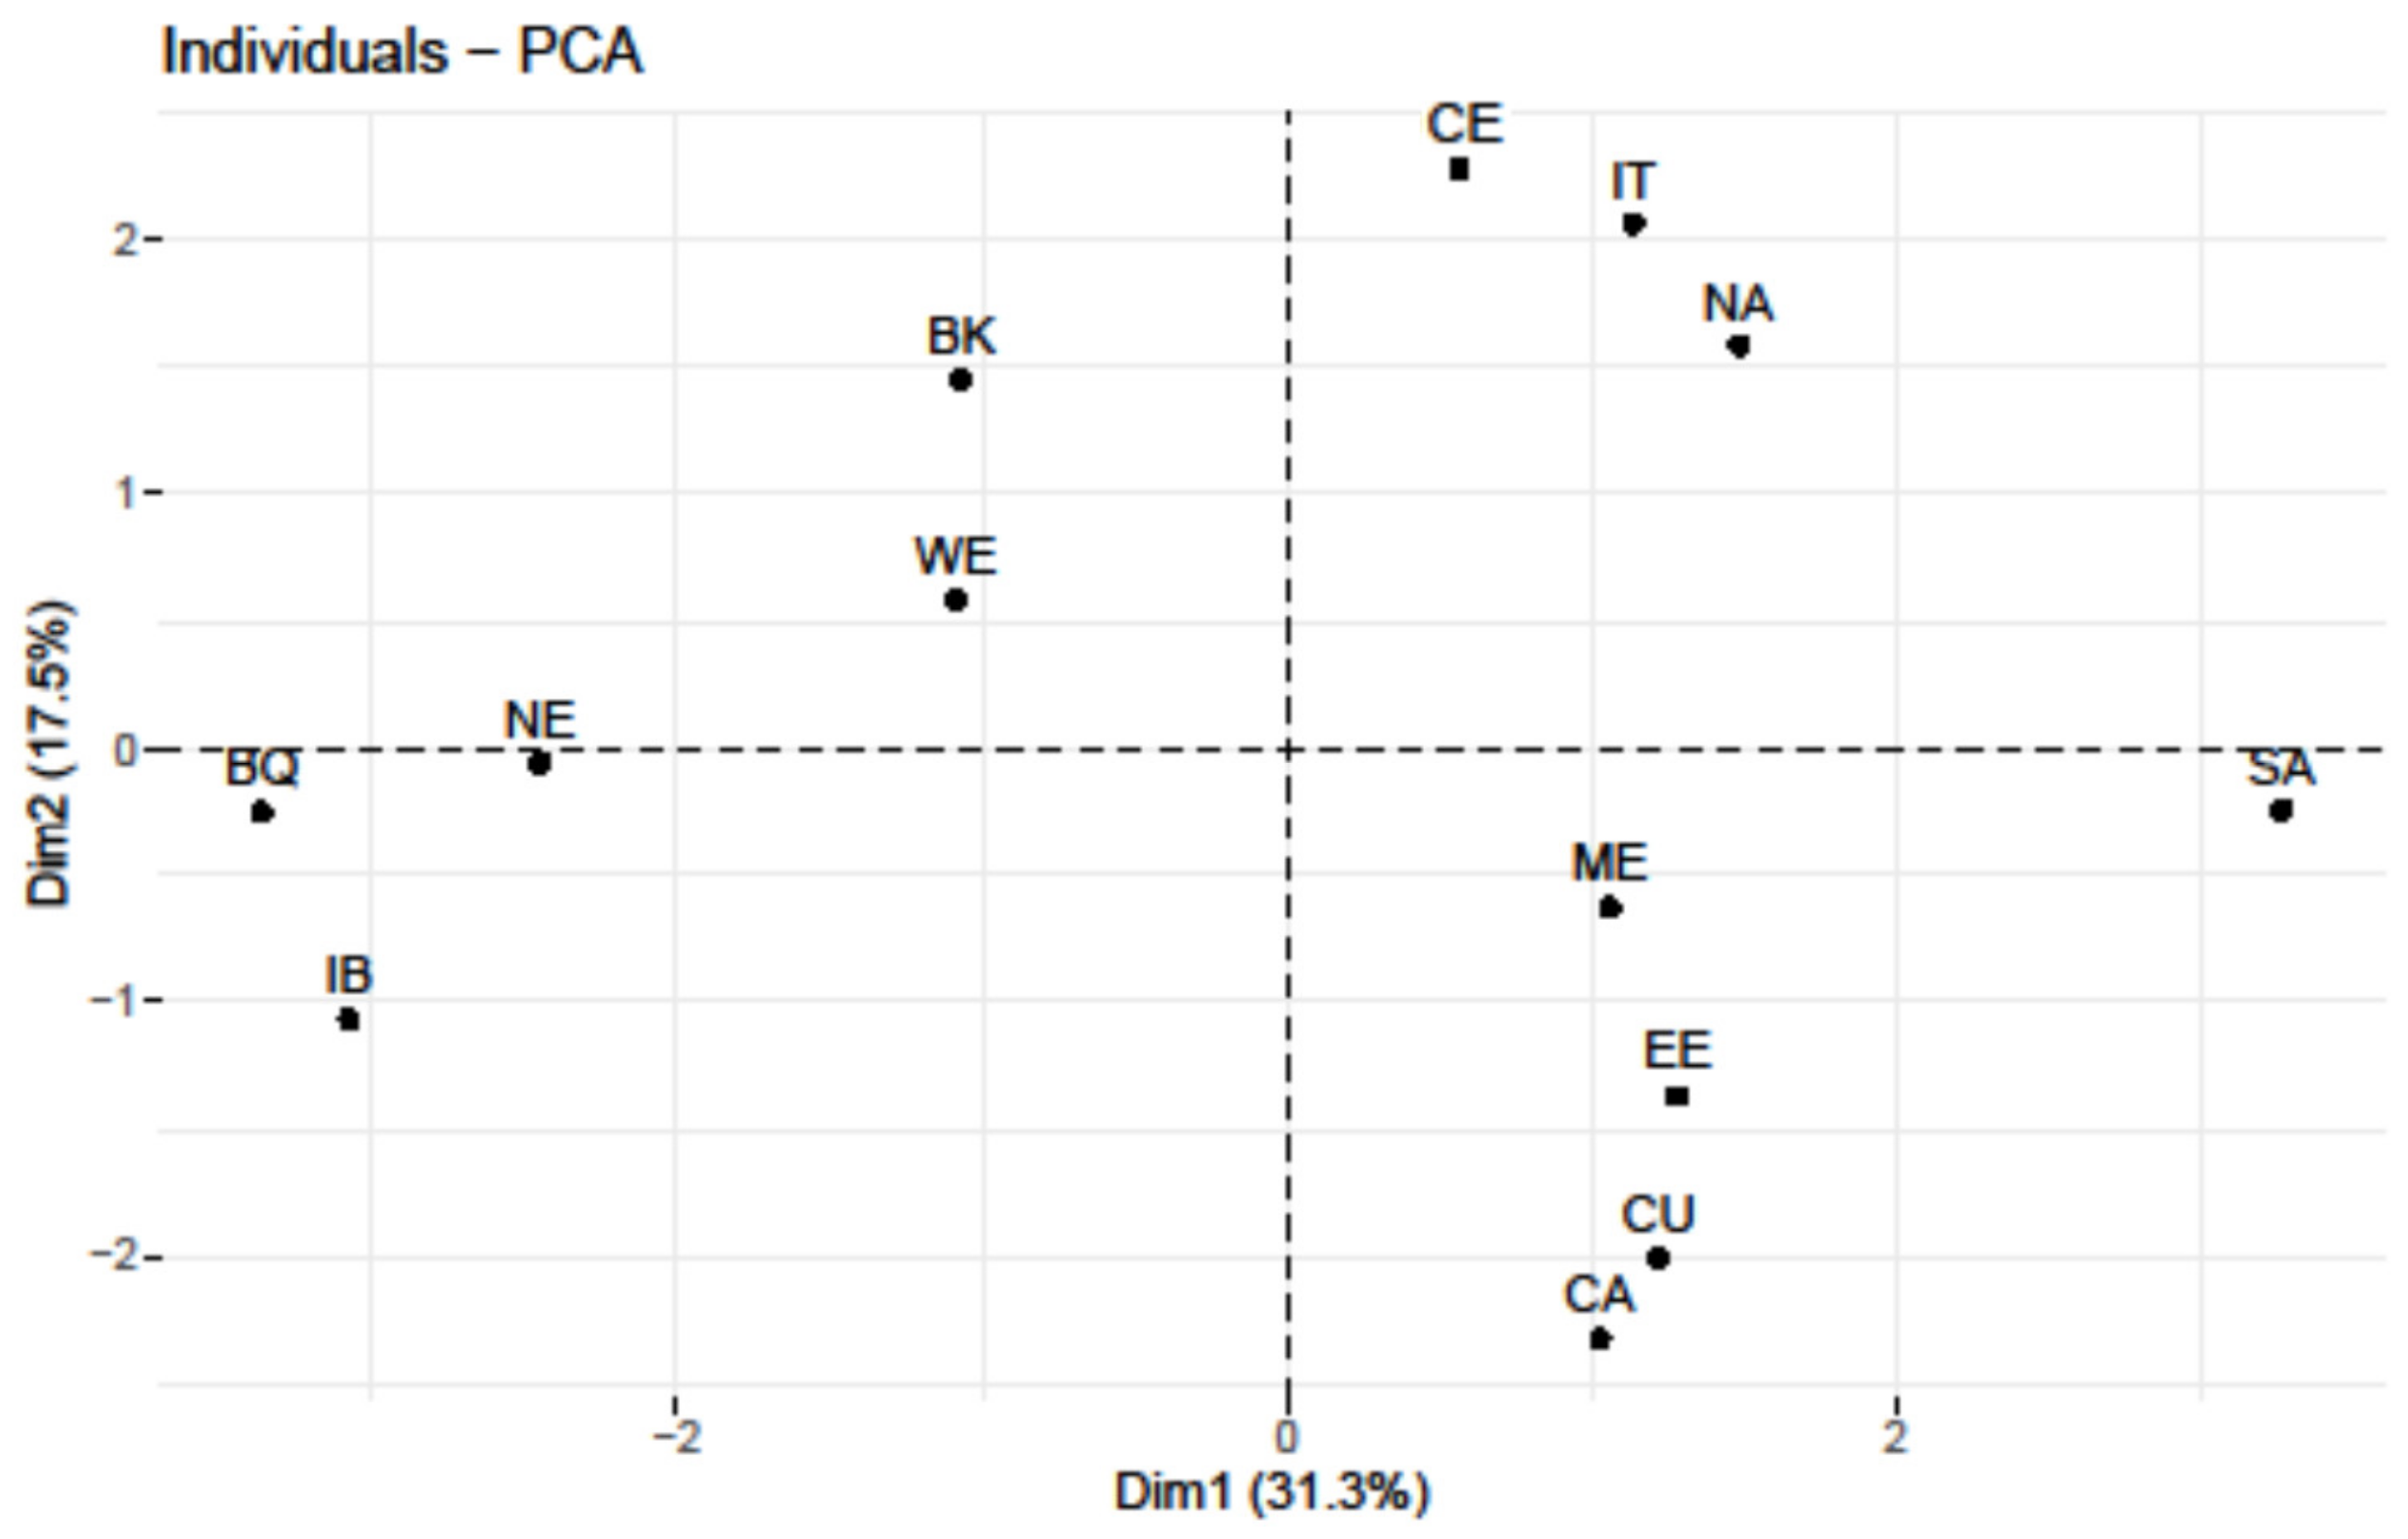
3.1. U8 Phylogeography of Present-Day Populations

Genetic drift and founder effects seem to be the main responsible factors for the anomalous high frequencies of U8 in some isolates. This seems to be the case for the Portuguese and Spanish Roma groups with frequencies of 3.6% and 2.5%, respectively (Table S1), only comparable to those found in northern European samples (Table S6). The frequency of U8b (2.9%) in Bulgarian Jews (Table S6) is also noteworthy, as are the high frequencies found for this haplogroup in isolate groups of Tunisia (16%) and Algeria (2.4%) (Table S13). Comparing average differences between large geographic areas, U8a is significantly more abundant in the continental European area comprising western, central, and northern regions, compared with eastern Europe, the Mediterranean basin, and the Middle East (0.45% vs. 0.15%; p < 0.00001). Conversely, frequencies of U8b in the latter area are significantly higher than in the former (0.21% vs. 0.12%; p = 0.0031). This geographic structure is also observed graphically. A PCA plot (Figure 1), which was based on an U8a pairwise genetic distance matrix between regions (Table S15), obtained from haplotype matches (Table S16), shows that the Middle East, the Caucasus, and northern Africa form a geographic continuum. On the other hand, all the European regions make up another geographic cluster to which central Asia approximates. For its part, Italy is in an intermediate position between these areas. I attribute the anomalous position of the Balkans to the small number of U8a sequences obtained from that region.
The same type of analysis performed for the U8b branch (Figure 2 and Table S17) presents a cluster grouping northern and western Europe, including Basques and the Iberian Peninsula. Italy seems to have received influences from central Europe and northern Africa, while eastern Europe seems to have received these influences from the Middle East and the Caucasus. Again, the Balkans shows an anomalous position.
On the other hand, the results of testing geographic correlation for U8a and U8b frequencies reveal that a strong and positive cline with latitude (R = 0.716; p < 0.00001) and a negative small one with longitude (R = −0.248; p = ns) exist for the U8a frequencies. In the case of the U8b frequencies, there is a weak, partial interaction with both coordinates, with a negative sign (r = −0.311) but without statistical significance. The preeminent northern (U8a) and southern (U8b) expansions across Europe from an ancestor U8* lineage probably originated in the Caucasus are depicted in Figure 3.

3.2. U8 Phylogeography in the Past

In addition to the changes observed over time, the prehistoric U8 samples also show interesting geographic differentiation. During the Paleolithic (Table S18), there was a clear geographic partition with U8a concentrated in central and western Europe and U8c in eastern Europe and the Mediterranean (p = 0.0003). In the Mesolithic (Table S19), the U8b cluster appeared for the first time but was limited to the Middle East and eastern Europe. Lineages U8a and U8c were not detected in this sample. The important sample size gathered for the Neolithic period (Table S20) allows confirming that U8a did not disappear in the Mesolithic, as it is detected in the Neolithic at low frequencies in western, central, and Eastern Europe. However, the absence of U8c lineages confirms that this branch was extinguished during the LGM. For its part, in the Neolithic, U8b extends through central and western Europe but with significantly lower frequencies than in eastern Europe and the Mediterranean basin (0.89% vs. 2.24%; p = 0.04). The most striking result of the Chalcolithic period (Table S21) is the high frequency of U8b in Italy and its notable presence in the Caucasus and central Asia, compared with other regions (p = 0.0009). During the Bronze Age (Table S22), while the U8a branch is still barely detectable, the U8b branch is consolidated in eastern Europe, the Mediterranean basin, the Middle East, and the Caucasus. Finally, in the Iron Age and Historic times (Table S23) U8b reached northern Africa at frequencies (3.2%) comparable to those in the Middle East.

3.3. Haplogroup U8 Coalescent Age Estimates

I built a phylogenetic tree (Figure S1) using 212 complete mitogenomes, 63 from ancient DNA remains, and 149 from present-day samples. The uncertainty of substitution and mutation rates, differences in the analyses, and the large confidence intervals make coalescent estimates rather imprecise (Table 3).
Thus, I opted for using the average of different estimations as a provisional approach. The mean coalescence ages for the whole U8 clade (52,936 ya; 95%CI: 29,916–75,955 ya), and its main subclades U8a (29,741 ya; 95%CI: 20,620–38,862 ya), and U8b (50,405 ya; 95% CI: 11,785–89,024 ya) are within the upper range of previous estimates [9,22,23]. The observation that although U8a and U8b are sister branches, the mean coalescence age of the first is significantly more recent than the second (t = 5.7966; df = 8; p = 0.0004) deserves special attention. In fact, the U8b estimate is close to that for the whole haplogroup U8. This result could be explained by invoking different demographic histories for each clade. For example, the U8a basal branch that separated it from the main node U2′3′4′7′8′9 accumulated six mutations before its next bifurcation. However, its sister branch subdivided into the U8b and U8c clades after only one mutation, but after this, five additional mutations accumulated at the U8b trunk before it bifurcated into branches U8b1a and U8b1b (Figure S1). There are also striking differences between clades attending to the geographic localization and temporal expansion of the clusters harboring the most evolved sequences. Whereas for U8a, these are eastern European (Poland) sequences within the U8a1a1b clade with Neolithic coalescence (6741, 95% CI: 1450–12,032 ya), for U8b, they are of the Caucasus and Middle East ascendance and are found within Paleolithic lineages U8b1a2 (28,738, 95%CI: 18,155–39,321 ya) and U8b1b2 (20,658, 95% CI: 11,604–29,492 ya).
According to coalescent theory, trees can be subdivided by internode intervals (ϒi) with a decreasing number of lineages going backward in time [24]. I think that the ratio of the number of lineages (i) between adjacent intervals (i/i−1) could be a simple measure of population size growth in the (i) period relative to that in the (i-1) period. Applying this ratio for U8a, the greatest values are between i2/i1 (3.17) and i2/i3 (2.53), which corresponds to time periods of 21.6 and 19.2 kya, pointing to the beginning of the end of the LGM. For U8b, they are between i2/i1 (4.0) and i2/i3 (6.13), in Paleolithic (22.4 kya) and Neolithic (6.5 kya) times, respectively.
Finally, I detected a certain degree of geographic structure in some clades that diverged late in time. Examples of this for U8a are U8a1a1a1, limited to central Europe, U8a1a1a2 and U8a1a1b comprising only eastern European sequences, or U8a1a3 represented only by western European lineages. As for U8b, it harbors subclades within U8b1a1, connecting Caucasus–Anatolia–Armenia, and the Middle East with eastern Europe, or U8b1b2, grouping Caucasus, Middle East, and the Balkans (Figure S1).

4. Discussion

4.1. The Extinction of mtDNA Lineages

Ancient DNA studies reveal that prehistoric populations had a genetic variation that has not been transmitted to modern populations [25,26]. This extinction process is evident at the level of mtDNA lineages. For example, the Mal’ta 1 [27] and Cioclovina 1 [11] specimens had haplogroup U basal mtDNA lineages (Figure S1) with 9 and 1 particular mutations, respectively, which are not found as diagnostic of any of the present-day U haplogroups. In the same way, all the Paleolithic lineages that arose from the basal clade U2′3′4′7′8′9 (Figure S1) should be considered extinct because none of their particular or shared mutations are diagnostic of any of the six lineages that persist today. Haplogroup U8, studied here, is one of these lineages, and the mtDNA of the Bacho Kiro 1653 Paleolithic specimen belonged to this clade [26], but it is now also an extinct lineage (Figure S1). The case of the entire haplogroup U8c, which was present in the Paleolithic from northeastern Europe [28] to southern Italy [23] is, perhaps, the most striking example of a wide extinction. In the same way, if we look at the prehistoric specimens, indicated in red along the phylogenetic tree (Figure S1), we will find lineages that belonged to branches U8a and U8b but that have not left descendants today. In some cases, this occurs for entire subclades such as the U8b1b subclade characterized by transitions in the 6465 and 8572 positions, which groups only Neolithic samples from eastern Europe (Figure S1). As a haploid, non-recombining marker with a high mutation rate, mtDNA genealogies that include prehistoric samples are especially well suited for visualizing the extinction of many of these past lineages.

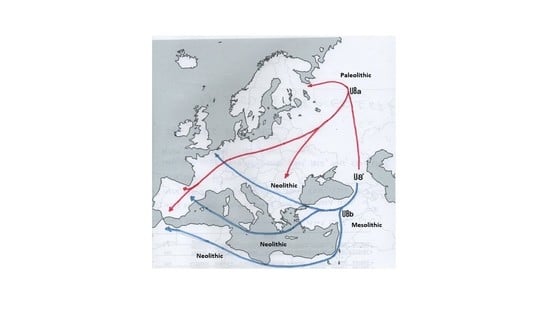
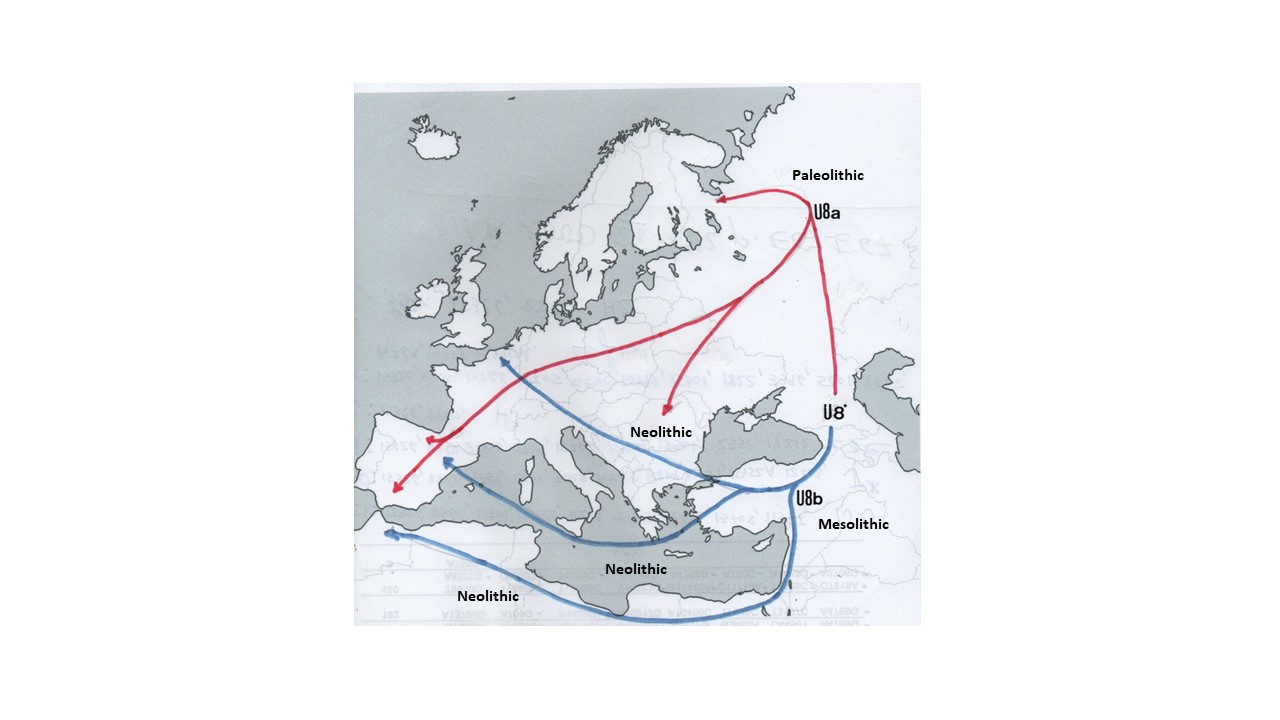
4.2. The Peopling of Europe from an U8a Perspective

Our phylogenetic analysis supports U8 radiation in western Eurasia around 50 kya, following, in short, previous radiation of macrohaplogroup U* in central Asia [2]. The most probable geographic origin for the U8 branching phenomenon seems to be the Caucasus because there is where the deepest lineages of U8b had their roots. This would explain the generalized expansion of the now-extinct U8c clade throughout Europe [11,12,23,28], the high presence of U8a lineages in the Paleolithic of central and western Europe [11,12], and the old age of some U8b lineages in the Middle East. After LGM, U8c was completely extinct; however, some lineages of the U8a branch survived this period but never reached the high frequencies of earlier times, remaining to this day mainly in areas of western and northern Europe where the Neolithic demic wave had less influence. At this point, it is pertinent to introduce the Basque people in this discussion. It has been previously proposed that U8a reveals a Paleolithic settlement in the Basque country and that their primitive founders most probably came from western Asia and did not follow a north African route [13]. Our results closely agree with these hypotheses. Basques significantly differ from the rest of the Iberian Peninsula by their comparatively higher frequency of U8a and lower frequency of U8b lineages (p = 0.0126). In this respect, Basques are more similar to southern France populations [29]. This could be attributed to a comparatively minor influence on the Basques of the Neolithic maternal gene flow. The fact that the Basque U8a lineages are spread in both of the oldest clusters (U8a1 and U8a2) is proof of their ancient implantation in the Basque country. The close relationship of northern African U8a haplotypes with the Near East, and its large distance from those of the Basques (Figure 1), also confirm that the affinities of the Basque lineages are with those of European populations. Basques also actively participated in European regional interchanges that occurred since the Mesolithic (Table 4). Britain was singularly affected by these migrations, potentially receiving consecutive gene flows from Iberia, including Basques, and western, northern, and central Europe. For its part, northern Europe seems to have received migrating groups from both western and eastern regions. Finally, the younger U8a clades witness local expansions from Neolithic to Bronze Age that were particularly important in eastern Europe.

4.3. The Peopling of Europe from a U8b Perspective

Unlike its phylogenetic counterparts, U8a and U8c, haplogroup U8b is beginning to be detected in the Mesolithic period, already as derived lineages, in Jordan as U8b1a [30], in Serbia as U8b1b [31], and in Anatolia as U8b1b1 [32]. Furthermore, its sister branch haplogroup K already appears in the Paleolithic of the Caucasus as a Georgian Satsurblia K3 lineage [33]. K3 is a rare clade that, nevertheless, has had continuity until the present day. It was later detected in Armenia during the Bronze Age [34], and today in the Caucasus [35], but also as far as China [36]. Other K lineages were coeval to those of U8b in the Mesolithic. Examples are the presence of K2b in Mesolithic Anatolia [37], and K1c in Mesolithic Greece [38]. These data point to double radiation of haplogroup U8 before LGM. One occurred in Europe (U8a), and the other in the Caucasus (U8b). The data also point to a genetic continuity of the surviving Paleolithic lineages through the Mesolithic. Other K lineages, mainly those belonging to the K1a subclade, are considered a dominant sign of a demic Neolithic expansion through continental and Mediterranean Europe [10,39,40]. It seems that with minor frequencies, U8b1a, and mainly U8b1b branches, also participated in these Neolithic expansions. In fact, compared with its sister branch, U8a, the number of Neolithic/Chalcolithic samples belonging to U8b (Figure S1) is significantly greater in the latter (p < 0.0001), and the same occurs in the Bronze/Iron Ages (p = 0.0029). However, the majority of the more derived subclades of U8b (Table 5) have Paleolithic and Mesolithic coalescences and, regionally, are still connected to the Caucasus and the Middle East. The U8b data seem to indicate that a Mesolithic wave from these areas preceded the Neolithic expansion.
Haplogroup U8 is a rare clade of a small gene with only maternal inheritance. However, from its phylogeny and past and present phylogeography, it outlines a history of the Europe settlement by modern humans that does not differ in its main traits from those proposed using larger mtDNA lineages [12] or even complete genomes [11]. Thus, the U8a branch complements the contractions and expansions across western and northern Europe described by haplogroup U5 from the Paleolithic onwards [41], and those of haplogroup U4 in eastern and northern Europe since the Mesolithic [42,43]. In the case of the U8b branch, it seems to indicate a primitive Paleolithic diversification in the Caucasus or central Asia, perhaps similar in time and location to the U4′9 bifurcation [44], Mesolithic migrations to the Balkans and northern Africa (Table 5), as well as later westward expansions to Continental and Mediterranean Europe since the Neolithic onwards, affecting again northern Africa. These later movements have been previously visualized by the phylogeographies of haplogroup K, the sister branch of U8b1 [8,45,46], and haplogroup U3 [2,45,46].

5. Conclusions

Haplogroup U8 (x K) had three main Paleolithic branches. One of them, U8c, although widely extended across Europe in that period, did not subsist during the LGM. The two extant branches have had two very different demographic histories. U8a survived the LGM and recovered after it, albeit in low frequencies, mainly in northern and western Europe, including the Basques. U8b had deep Paleolithic roots in the Caucasus and the Middle East. From there, it accompanied other female lineages in the Mesolithic, Neolithic, and subsequent periods, reaching continental Europe and the Mediterranean basin, including northern Africa, from the East, but always at low frequencies (≈1%). Only subhaplogroup K, the sister clade of U8b1, reached average frequencies of around 7%.

Supplementary Materials

The following supporting information can be downloaded at: https://www.mdpi.com/article/10.3390/dna2020008/s1, Figure S1: U8 phylogeny; Table S1: U8 frequencies in the Iberian Peninsula; Table S2: U8 frequencies in Italy; Table S3: U8 frequencies in the Balkans; Table S4 U8 frequencies in central Europe; Table S5: U8 frequencies in western Europe; Table S6: U8 frequencies in eastern Europe; Table S7: U8 frequencies in northern Europe; Table S8: U8 frequencies in the Caucasus; Table S9: U8 frequencies in Turkey; Table S10: U8 frequencies in the Middle East; Table S11: U8 frequencies in Central Asia; Table S12: U8 frequencies in South Asia; Table S13: U8 frequencies in northern Africa; Table S14: Prehistoric and historic frequencies (%) for haplogroup U8 and its subclades; Table S15: Pairwise genetic distance matrix based on U8a haplotype matches between regions; Table S16: U8a and U8b haplotype mathes among regions; Table S17: Pairwise genetic distance matrix based on U8b haplotype matches between regions; Table S18: Paleolithic frequencies (%) of haplogroups U8a, U8b and U8c in different geographic regions; Table S19: Mesolithic frequencies (%) of haplogroups U8a and U8b in different geographic regions; Table S20: Neolithic frequencies (%) of haplogroups U8a and U8b in different geographic regions; Table S21: Chalcolithic frequencies (%) of haplogroups U8a and U8b in different geographic regions; Table S22: Bronze Age frequencies (%) of haplogroups U8a and U8b in different geographic regions; Table S23: Historic/Iron Age frequencies (%) of haplogroups U8a and U8b in different geographic regions.

Funding

This study has not had any funding.

Institutional Review Board Statement

This study underwent formal review and was approved by the Ethics Committee for Human Research at the University of La Laguna as proposal NR157.

Informed Consent Statement

Not applicable.

Data Availability Statement

The data presented in this study are available in the article and Supplementary Materials.

Acknowledgments

I thank P. Marrero for her valuable and selfless technical assistance.

Conflicts of Interest

The author declares no conflict of interest.

References

  1. Maca-Meyer, N.; González, A.M.; Larruga, J.M.; Flores, C.; Cabrera, V.M. Major genomic mitochondrial lineages delineate early human expansions. BMC Genet. 2001, 2, 13. [Google Scholar] [CrossRef] [Green Version]
  2. Larruga, J.M.; Marrero, P.; Abu-Amero, K.K.; Golubenko, M.V.; Cabrera, V.M. Carriers of mitochondrial DNA macrohaplogroup R colonized Eurasia and Australasia from a southeast Asia core area. BMC Evol. Biol. 2017, 17, 115. [Google Scholar] [CrossRef] [PubMed]
  3. Lappalainen, T.; Laitinen, V.; Salmela, E.; Andersen, P.; Huoponen, K.; Savontaus, M.-L.; Lahermo, P. Migration waves to the Baltic Sea region. Ann. Hum. Genet. 2008, 72, 337–348. [Google Scholar] [CrossRef] [PubMed]
  4. Lunkina, A.V.; Denisova, G.A.; Derenko, M.V.; Malarchuk, B.A. Mitochondrial DNA variation in two Russian populations from Novgorod oblast. Genetika 2004, 40, 975–980. [Google Scholar] [CrossRef] [PubMed]
  5. Varesi, L.; Memmi, M.; Cristofari, M.-C.; Mameli, G.; Calo, C.; Vona, G. Mitochondrial control-region sequence variation in the Corsican population, France. Am. J. Hum. Biol. Off. J. Hum. Biol. Assoc. 2000, 12, 339–351. [Google Scholar] [CrossRef]
  6. Cherni, L.; Loueslati, B.Y.; Pereira, L.; Ennafaa, H.; Amorim, A.; El Gaaied, A.B.A. Female gene pools of Berber and Arab neighboring communities in central Tunisia: Microstructure of mtDNA variation in North Africa. Hum. Biol. 2005, 77, 61–70. [Google Scholar] [CrossRef] [Green Version]
  7. Ermini, L.; Olivieri, C.; Rizzi, E.; Corti, G.; Bonnal, R.; Soares, P.; Luciani, S.; Marota, I.; De Bellis, G.; Richards, M.B.; et al. Complete mitochondrial genome sequence of the Tyrolean Iceman. Curr. Biol. 2008, 18, 1687–1693. [Google Scholar] [CrossRef]
  8. Richards, M.; Macaulay, V.; Hickey, E.; Vega, E.; Sykes, B.; Guida, V.; Rengo, C.; Sellitto, D.; Cruciani, F.; Kivisild, T.; et al. Tracing European founder lineages in the Near Eastern mtDNA pool. Am. J. Hum. Genet. 2000, 67, 1251–1276. [Google Scholar] [CrossRef]
  9. Costa, M.D.; Pereira, J.B.; Pala, M.; Fernandes, V.; Olivieri, A.; Achilli, A.; Perego, U.A.; Rychkov, S.; Naumova, O.; Hatina, J.; et al. A substantial prehistoric European ancestry amongst Ashkenazi maternal lineages. Nat. Commun. 2013, 4, 2543. [Google Scholar] [CrossRef] [Green Version]
  10. Isern, N.; Fort, J.; de Rioja, V.L. The ancient cline of haplogroup K implies that the Neolithic transition in Europe was mainly demic. Sci. Rep. 2017, 7, 11229. [Google Scholar] [CrossRef]
  11. Fu, Q.; Posth, C.; Hajdinjak, M.; Petr, M.; Mallick, S.; Fernandes, D.; Furtwängler, A.; Haak, W.; Meyer, M.; Mittnik, A.; et al. The genetic history of ice age Europe. Nature 2016, 534, 200–205. [Google Scholar] [CrossRef] [Green Version]
  12. Posth, C.; Renaud, G.; Mittnik, A.; Drucker, D.G.; Rougier, H.; Cupillard, C.; Valentin, F.; Thevenet, C.; Furtwängler, A.; Wißing, C.; et al. Pleistocene mitochondrial genomes suggest a single major dispersal of non-Africans and a Late Glacial population turnover in Europe. Curr. Biol. 2016, 26, 827–833. [Google Scholar] [CrossRef] [Green Version]
  13. González, A.M.; García, O.; Larruga, J.M.; Cabrera, V.M. The mitochondrial lineage U8a reveals a Paleolithic settlement in the Basque country. BMC Genom. 2006, 7, 124. [Google Scholar] [CrossRef] [Green Version]
  14. Weissensteiner, H.; Pacher, D.; Kloss-Brandstätter, A.; Forer, L.; Specht, G.; Bandelt, H.-J.; Kronenberg, F.; Salas, A.; Schönherr, S. HaploGrep 2: Mitochondrial haplogroup classification in the era of high-throughput sequencing. Nucleic Acids Res. 2016, 44, W58–W63. [Google Scholar] [CrossRef]
  15. Van Oven, M.; Kayser, M. Updated comprehensive phylogenetic tree of global human mitochondrial DNA variation. Hum. Mutat. 2009, 30, E386–E394. [Google Scholar] [CrossRef]
  16. Saillard, J.; Forster, P.; Lynnerup, N.; Bandelt, H.J.; Nørby, S. mtDNA variation among Greenland Eskimos: The edge of the Beringian expansion. Am. J. Hum. Genet. 2000, 67, 718–726. [Google Scholar] [CrossRef] [Green Version]
  17. Soares, P.; Ermini, L.; Thomson, N.; Mormina, M.; Rito, T.; Röhl, A.; Salas, A.; Oppenheimer, S.; Macaulay, V.; Richards, M.B. Correcting for purifying selection: An improved human mitochondrial molecular clock. Am. J. Hum. Genet. 2009, 84, 740–759. [Google Scholar] [CrossRef] [Green Version]
  18. Cabrera, V.M. Counterbalancing the time-dependent effect on the human mitochondrial DNA molecular clock. BMC Evol. Biol. 2020, 20, 78. [Google Scholar] [CrossRef]
  19. Cabrera, V.M. Human molecular evolutionary rate, time dependency and transient polymorphism effects viewed through ancient and modern mitochondrial DNA genomes. Sci. Rep. 2021, 11, 5036. [Google Scholar] [CrossRef]
  20. Zaidi, A.A.; Wilton, P.R.; Su, M.S.-W.; Paul, I.M.; Arbeithuber, B.; Anthony, K.; Nekrutenko, A.; Nielsen, R.; Makova, K.D. Bottleneck and selection in the germline and maternal age influence transmission of mitochondrial DNA in human pedigrees. Proc. Natl. Acad. Sci. USA 2019, 116, 25172–25178. [Google Scholar] [CrossRef] [Green Version]
  21. Fu, Q.; Mittnik, A.; Johnson, P.L.; Bos, K.; Lari, M.; Bollongino, R.; Sun, C.; Giemsch, L.; Schmitz, R.; Burger, J.; et al. A revised timescale for human evolution based on ancient mitochondrial genomes. Curr. Biol. 2013, 23, 553–559. [Google Scholar] [CrossRef] [Green Version]
  22. Behar, D.M.; van Oven, M.; Rosset, S.; Metspalu, M.; Loogväli, E.-L.; Silva, N.M.; Kivisild, T.; Torroni, A.; Villems, R. A “Copernican” reassessment of the human mitochondrial DNA tree from its root. Am. J. Hum. Genet. 2012, 90, 675–684. [Google Scholar] [CrossRef] [Green Version]
  23. Modi, A.; Vai, S.; Posth, C.; Vergata, C.; Zaro, V.; Diroma, M.A.; Boschin, F.; Capecchi, G.; Ricci, S.; Ronchitelli, A.; et al. More data on ancient human mitogenome variability in Italy: New mitochondrial genome sequences from three Upper Palaeolithic burials. Ann. Hum. Biol. 2021, 48, 213–222. [Google Scholar] [CrossRef]
  24. Ho, S.Y.; Shapiro, B. Skyline-plot methods for estimating demographic history from nucleotide sequences. Mol. Ecol. Resour. 2011, 11, 423–434. [Google Scholar] [CrossRef]
  25. Prüfer, K.; Posth, C.; Yu, H.; Stoessel, A.; Spyrou, M.A.; Deviese, T.; Mattonai, M.; Ribechini, E.; Higham, T.; Velemínský, P.; et al. A genome sequence from a modern human skull over 45,000 years old from Zlatý kůň in Czechia. Nat. Ecol. Evol. 2021, 5, 820–825. [Google Scholar] [CrossRef]
  26. Hublin, J.-J.; Sirakov, N.; Aldeias, V.; Bailey, S.; Bard, E.; Delvigne, V.; Endarova, E.; Fagault, Y.; Fewlass, H.; Hajdinjak, M.; et al. Initial Upper Palaeolithic Homo sapiens from Bacho Kiro Cave, Bulgaria. Nature 2020, 581, 299–302. [Google Scholar] [CrossRef]
  27. Raghavan, M.; Skoglund, P.; Graf, K.E.; Metspalu, M.; Albrechtsen, A.; Moltke, I.; Rasmussen, S.; Stafford, T.W., Jr.; Orlando, L.; Metspalu, E.; et al. Upper Palaeolithic Siberian genome reveals dual ancestry of Native Americans. Nature 2014, 505, 87–91. [Google Scholar] [CrossRef]
  28. Sikora, M.; Seguin-Orlando, A.; Sousa, V.C.; Albrechtsen, A.; Korneliussen, T.; Ko, A.; Rasmussen, S.; Dupanloup, I.; Nigst, P.R.; Bosch, M.D.; et al. Ancient genomes show social and reproductive behavior of early Upper Paleolithic foragers. Science 2017, 358, 659–662. [Google Scholar] [CrossRef] [Green Version]
  29. Dubut, V.; Chollet, L.; Murail, P.; Cartault, F.; Béraud-Colomb, E.; Serre, M.; Mogentale-Profizi, N. mtDNA polymorphisms in five French groups: Importance of regional sampling. Eur. J. Hum. Genet. 2004, 12, 293–300. [Google Scholar] [CrossRef] [Green Version]
  30. Lazaridis, I.; Nadel, D.; Rollefson, G.; Merrett, D.C.; Rohland, N.; Mallick, S.; Fernandes, D.; Novak, M.; Gamarra, B.; Sirak, K.; et al. Genomic insights into the origin of farming in the ancient Near East. Nature 2016, 536, 419–424. [Google Scholar] [CrossRef] [Green Version]
  31. Mathieson, I.; Alpaslan-Roodenberg, S.; Posth, C.; Szécsényi-Nagy, A.; Rohland, N.; Mallick, S.; Olalde, I.; Broomandkhoshbacht, N.; Candilio, F.; Cheronet, O.; et al. The genomic history of southeastern Europe. Nature 2018, 555, 197–203. [Google Scholar] [CrossRef] [PubMed] [Green Version]
  32. Mathieson, I.; Lazaridis, I.; Rohland, N.; Mallick, S.; Patterson, N.; Roodenberg, S.A.; Harney, E.; Stewardson, K.; Fernandes, D.; Novak, M.; et al. Genome-wide patterns of selection in 230 ancient Eurasians. Nature 2015, 528, 499–503. [Google Scholar] [CrossRef] [PubMed] [Green Version]
  33. Jones, E.R.; Gonzalez-Fortes, G.; Connell, S.; Siska, V.; Eriksson, A.; Martiniano, R.; McLaughlin, R.L.; Llorente, M.G.; Cassidy, L.M.; Gamba, C.; et al. Upper Palaeolithic genomes reveal deep roots of modern Eurasians. Nat. Commun. 2015, 6, 8912. [Google Scholar] [CrossRef] [PubMed] [Green Version]
  34. Margaryan, A.; Derenko, M.; Hovhannisyan, H.; Malyarchuk, B.; Heller, R.; Khachatryan, Z.; Avetisyan, P.; Badalyan, R.; Bobokhyan, A.; Melikyan, V.; et al. Eight millennia of matrilineal genetic continuity in the south Caucasus. Curr. Biol. 2017, 27, 2023–2028. [Google Scholar] [CrossRef] [Green Version]
  35. Schönberg, A.; Theunert, C.; Li, M.; Stoneking, M.; Nasidze, I. High-throughput sequencing of complete human mtDNA genomes from the Caucasus and West Asia: High diversity and demographic inferences. Eur. J. Hum. Genet. 2011, 19, 988–994. [Google Scholar] [CrossRef] [Green Version]
  36. Zheng, H.-X.; Yan, S.; Qin, Z.-D.; Wang, Y.; Tan, J.-Z.; Li, H.; Jin, L. Major population expansion of East Asians began before neolithic time: Evidence of mtDNA genomes. PLoS ONE 2011, 6, e25835. [Google Scholar] [CrossRef]
  37. Feldman, M.; Fernández-Domínguez, E.; Reynolds, L.; Baird, D.; Pearson, J.; Hershkovitz, I.; May, H.; Goring-Morris, N.; Benz, M.; Gresky, J.; et al. Late Pleistocene human genome suggests a local origin for the first farmers of central Anatolia. Nat. Commun. 2019, 10, 1218. [Google Scholar] [CrossRef] [Green Version]
  38. Hofmanová, Z.; Kreutzer, S.; Hellenthal, G.; Sell, C.; Diekmann, Y.; Díez-del-Molino, D.; Van Dorp, L.; López, S.; Kousathanas, A.; Link, V.; et al. Early farmers from across Europe directly descended from Neolithic Aegeans. Proc. Natl. Acad. Sci. USA 2016, 113, 6886–6891. [Google Scholar] [CrossRef] [Green Version]
  39. Lipson, M.; Szécsényi-Nagy, A.; Mallick, S.; Pósa, A.; Stégmár, B.; Keerl, V.; Rohland, N.; Stewardson, K.; Ferry, M.; Michel, M.; et al. Parallel palaeogenomic transects reveal complex genetic history of early European farmers. Nature 2017, 551, 368–372. [Google Scholar] [CrossRef]
  40. Olalde, I.; Schroeder, H.; Sandoval-Velasco, M.; Vinner, L.; Lobón, I.; Ramirez, O.; Civit, S.; García Borja, P.; Salazar-García, D.C.; Talamo, S.; et al. A common genetic origin for early farmers from Mediterranean Cardial and Central European LBK cultures. Mol. Biol. Evol. 2015, 32, 3132–3142. [Google Scholar] [CrossRef] [Green Version]
  41. Malyarchuk, B.; Derenko, M.; Grzybowski, T.; Perkova, M.; Rogalla, U.; Vanecek, T.; Tsybovsky, I. The peopling of Europe from the mitochondrial haplogroup U5 perspective. PLoS ONE 2010, 5, e10285. [Google Scholar] [CrossRef] [Green Version]
  42. Malyarchuk, B.; Grzybowski, T.; Derenko, M.; Perkova, M.; Vanecek, T.; Lazur, J.; Gomolcák, P.; Tsybovsky, I. Mitochondrial DNA phylogeny in eastern and western Slavs. Mol. Biol. Evol. 2008, 25, 1651–1658. [Google Scholar] [CrossRef]
  43. Derenko, M.; Malyarchuk, B.; Denisova, G.; Perkova, M.; Litvinov, A.; Grzybowski, T.; Dambueva, I.; Skonieczna, K.; Rogalla, U.; Tsybovsky, I.; et al. Western Eurasian ancestry in modern Siberians based on mitogenomic data. BMC Evol. Biol. 2014, 14, 217. [Google Scholar] [CrossRef] [Green Version]
  44. Kivisild, T.; Reidla, M.; Metspalu, E.; Rosa, A.; Brehm, A.; Pennarun, E.; Parik, J.; Geberhiwot, T.; Usanga, E.; Villems, R. Ethiopian mitochondrial DNA heritage: Tracking gene flow across and around the gate of tears. Am. J. Hum. Genet. 2004, 75, 752–770. [Google Scholar] [CrossRef] [Green Version]
  45. Haak, W.; Forster, P.; Bramanti, B.; Matsumura, S.; Brandt, G.; Tänzer, M.; Villems, R.; Renfrew, C.; Gronenborn, D.; Alt, K.W.; et al. Ancient DNA from the first European farmers in 7500-year-old Neolithic sites. Science 2005, 310, 1016–1018. [Google Scholar] [CrossRef] [Green Version]
  46. Haak, W.; Balanovsky, O.; Sanchez, J.J.; Koshel, S.; Zaporozhchenko, V.; Adler, C.J.; Der Sarkissian, C.S.I.; Brandt, G.; Schwarz, C.; Nicklisch, N.; et al. Ancient DNA from European early neolithic farmers reveals their near eastern affinities. PLoS Biol. 2010, 8, e1000536. [Google Scholar] [CrossRef] [Green Version]
Figure 1. PCA depicting regional affinities based on haplogroup U8a diversity (abbreviations as in Table 1).
Dna 02 00008 g001
Figure 2. PCA depicting regional affinities based on haplogroup U8b diversity (abbreviations as in Table 1).
Dna 02 00008 g002
Figure 3. Alternative spread of U8a (Red) and U8b (Blue) branches across Europe, from its U8* Caucasus ancestor.
Dna 02 00008 g003
Table 1. Present-day frequencies (%) of haplogroups U8a and U8b in different geographic regions (abbreviations).
RegionSample (Ref.)U8aU8bU8U8a/U8b Ratio
Iberia (IB)9704 (Table S1)23 (0.24)20 (0.21)43 (0.44)1.15
Italy (IT)5049 (Table S2)6 (0.12)16 (0.32)22 (0.44)0.375
Balkans (BK)3762 (Table S3)1 (0.03)6 (0.16)7 (0.19)0.167
Turkey (ME)818 (Table S9)02 (0.24)2 (0.24)0.0
Basque Country (BQ)1985 (Table S1)10 (0.50)2 (0.10)12 (0.60)5.0
France (WE)2397 (Table S5)13 (0.54)1 (0.04)14 (0.58)13.0
British Islands (WE)327,665 (Table S5)655 (0.20)131 (0.04)786 (0.24)5.0
Central Europe (CE)2891 (Table S4)6 (0.21)3 (0.10)9 (0.31)0.334
Northern Europe (NE)8166 (Table S7)61 (0.75)3 (0.04)64 (0.79)20.3
Eastern Europe (EE)22,112 (Table S6)100 (0.45)29 (0.13)129 (0.58)3.45
Caucasus (CU)4183 (Table S8)2 (0.05)23 (0.55)25 (0.60)0.087
Middle East (ME)13,000 (Table S10)2 (0.01)55 (0.42)57 (0.44)0.036
South Asia (SA)12,753 (Table S12)1 (0.008)3 (0.023)4 (0.031)0.333
Central Asia (CA)9421 (Table S11)4 (0.04)7 (0.07)11 (0.12)0.571
Northern Africa (NA)5145 (Table S13)2 (0.04)18 (0.35)20 (0.39)0.111
Table 2. Prehistoric and historic frequencies (%) of haplogroups U8a, U8b, and U8c in different archaeological periods.
PeriodDateSample (Table S14)U8aU8bU8cU8
Paleolithic(2 My–12,000 BCE)558 (14.5)04 (7.3)12 (21.8)
Mesolithic(12,000–8300 BCE)30003 (1.0)03 (1.0)
Neolithic(8300–4500 BCE)20784 (0.19)27 (1.30)031 (1.49)
Chalcolithic(4500–3300 BCE)9361 (0.11)6 (0.64)07 (0.75)
Bronze(3300–1200 BCE)17011 (0.06)12 (0.71)013 (0.77)
Iron/Historic(1200–present)26695 (0.19)15 (0.56)020 (0.75)
Table 3. Different estimates for the MRCA of haplogroup U lineages.
LineagesHaplogroupYears per MutationMean95% CI
Mal’ta 1U*245446,39132,769–60,013
Cioclovina 1U*245432,43521,275–44,043
U2′3′4′7′8′9U*245445,15531,717–58,593
PaleolithicU2′3′4′7′8′9245442,69137,447–47,934
PaleolithicU8c245433,44331,222–35,666
U8cU8*245443,25931,115–55,404
Extant (1)U8*362453,09238,532–67,652
Extant + 0.05 interval (2)U8*320573,33056,242–90,418
ExtantU8*Time dependent42,06229,101–55,023
ExtantU8a362429,89818,981–40,815
Extant + 0.05 intervalU8a320533,33221,843–44,821
ExtantU8aTime dependent25,99415,796–36,192
ExtantU8b362443,99530,729–57,261
Extant + 0.05 intervalU8b320568,13151,639–84,623
ExtantU8bTime dependent39,08826,592–51,578
(1) Present-day lineages; (2) Only sequences with number of mutations in the +0.05 Poisson interval.
Table 4. Haplogroup U8a connections among European regions.
CladeAge in Years ± 2 seConnected Regions
U8a212,322 ± 7014Iberia–Basque–Britain
U8a1a + 15,90310,872 ± 6573Eastern Europe–northern Europe
U8a1a1a + 16,146!9060 ± 6020Basque–Britain–northern Europe
U8a1b7248 ± 5367Britain–northern Europe
U8a1a1b6741 ± 5177Eastern Europe
U8a1a36342 ± 5010Western Europe–England
U8a1a1a26342 ± 5036Eastern Europe
U8a1a46052 ± 4920Basque–northern Europe
U8a1a26052 ± 4899Central Europe–Britain
U8a1a1 + 63806052 ± 4900Western Europe–northern Europe
U8a1a1b14059 ± 4050Eastern Europe–northern Europe
U8a1a1a13624 ± 3704Central Europe
Table 5. Haplogroup U8b connections among regions.
CladeAge in Years ± 2 seConnected Regions
U8b1a2 + 14,364, 16,25936,240 ± 12,033Middle East
U8b1b220,536 ± 8967Caucasus–Middle East–Balkans
U8b1a1 + 10,45418,120 ± 8508Caucasus–Middle East–Italy
U8b1a2b17,033 ± 8246Caucasus–M.East–Balkans–E.Europe–N.Europe–N.Africa
U8b1b1 + 994715,704 ± 7745Caucasus–northern Africa
U8b1b + 146, 3432, 13,15515,221 ± 7771Central Asia–eastern Europe–Italy
U8b1a1 + 10,454,12,308!13,046 ± 7211Middle East–eastern Europe
U8b1a1 + 6515G,10,63211,959 ± 6809Middle East–northern Europe
U8b1b + 7705,14,323,16,2908154 ± 5692Central Europe–Britain–Iberia
U8b1b1 + 16,0945177 ± 4494Eastern Europe–Italy–C.Europe–N.Europe
U8b1b1 (X16,094, 9947)4918 ± 4050Middle East–E.Europe–C.Europe–Italy–Iberia
Publisher’s Note: MDPI stays neutral with regard to jurisdictional claims in published maps and institutional affiliations.

