Article

Characterization of Poultry Litter Biochar and Activated Biochar as a Soil Amendment for Valorization

1
Department of Poultry Science, University of Arkansas, Fayetteville, AR 72701, USA
2
Poultry Production and Product Safety Research Unit, USDA-ARS, Fayetteville, AR 72701, USA
3
Biological and Agricultural Engineering, North Carolina State University, Raleigh, NC 27695, USA
*
Author to whom correspondence should be addressed.
Biomass 2022, 2(4), 209-223; https://doi.org/10.3390/biomass2040014
Submission received: 1 September 2022 / Revised: 12 September 2022 / Accepted: 16 September 2022 / Published: 21 September 2022

Abstract

:
Biochar applications to soils may enhance soil quality, hydrological properties, and agronomic productivity. Modification of biochar by activation via introduction of heteroatoms at different pyrolysis conditions can alter physical and chemical characteristics, which may enhance soil properties, although the extent of this is unknown. The objective of this study was to investigate the impacts of pyrolysis temperature (400, 500, 600, and 700 °C) on activated (activated with methanesulfonic acid) and unactivated biochar produced from poultry litter to identify optimum production conditions for end use as a soil amendment. Physical, chemical, and surface properties of biochars were determined using wet chemistry and spectroscopic analyses. Results showed that activation with methanesulfonic acid increased biochars’ oxygen content, while decreasing its point of zero charge and electrical conductivity. Conversion of raw poultry litter to activated and unactivated biochar increased concentration of P (3-fold), K (1.8-fold), Ca (3-fold), Mg (2.3-fold), and S (4.8-fold), with concentrations increasing with increasing temperatures (p < 0.05) except for C and N. Activated biochar had lower recovery of C and N, but greater water-holding capacity than unactivated biochar. Concentrations of NH4-N, NO3-N, and water-soluble P were greater in unactivated biochar (p < 0.05). Among all biochars, activated biochar produced at 400 °C had the lowest bulk density, total P, K, Ca, and Mg, and greatest water-holding capacity, water-soluble P, Ca, and Mg concentrations, thereby suggesting improved soil amendment characteristics and subsequent soil health under poultry litter biochars produced under these conditions.

1. Introduction

With the production of over 9 billion broilers annually [1], poultry farming in the U.S. generates more than 14 billion kg of poultry litter (PL: combination of manure, bedding material, and feed) each year [2]. Currently, most of the litter produced by the poultry industry is surface-applied to agricultural lands as a fertilizer source [3]. Raw PL typically consists of approximately 3% nitrogen (N) and phosphorus (P), and applications based on N crop needs can often lead to excessive application of P. Consequently, during land application, N and P losses may occur via volatilization of ammonia from the litter, as well as through runoff and leaching to nearby water bodies, thus causing eutrophication [3,4,5]. Therefore, it is critical to devise environmentally and economically sustainable management strategies for not only reducing the disposal and subsequent non-point source pollution of this important nutrient source, but also valorizing PL for ensuring the sustainability of the poultry industry.
Conversion of PL to poultry litter biochar (PLB) can serve both purposes of reducing the environmental concerns associated with the disposal of raw PL by targeting its nutrient composition (reducing soluble P and increasing N) and converting it into useful value-added product for use as a soil amendment. Biochar is a carbon (C)-rich solid material obtained by pyrolysis, i.e., slow heating of biomass at relatively low temperatures (<700 °C) with little or no oxygen [6]. The thermochemical process during pyrolysis results in the formation of biochar consisting of a highly porous structure with large surface area enriched with stable organic carbon (OC), and thus, this has potential to provide various environmental and agronomic benefits [7,8]. Addition of biochar to soil reportedly enhances a range of soil physical and hydraulic properties such as total porosity, pore-size distribution, water-holding capacity (WHC), and hydraulic conductivity [9,10,11,12], and improves soil fertility [13] and nutrient retention, thereby reducing nutrient leaching to the environment [14]. Additionally, due to the presence of stable OC in biochar, once applied to soils biochar may increase soil OC levels [11,15]. Owing to the high porosity, large specific surface area, high C content, and its adsorption to metal and organic substances, biochar is also beneficial for soil and water contaminant remediation [16,17].
The response of a soil to biochar application can vary with biochar properties [9,18], which are controlled by both feedstock characteristics and the thermal–chemical process employed during production [18,19,20,21]. Generally, pyrolysis at lower temperatures (250 to 400 °C) yields greater amounts of biochar with overall greater recovery of OC from the feedstock [21], and high volatile matter content and more functional groups, which impart higher negative surface charge favoring nutrient exchange and microbial activity [18]. With increasing temperatures and/or residence time (400 to 700 °C), the conversion of aliphatic-C to condensed aromatic-C structures reduces ion exchange functional groups and the total surface charge, which potentially limits its usefulness in retaining soil nutrients, although this may increase its potential to sequester carbon due to recalcitrant nature of the condensed aromatic-C [18]. Increasing production temperatures has also been reported to decrease hydrophobicity of biochar and biochar amended soil, with simultaneous increases in specific surface area and porosity, thus enhancing soil WHC [22,23]. While the properties of a biochar vary with pyrolysis conditions, the effect of biochar on soil quality and soil hydrology is equally dependent on soil properties [24,25,26]. This means that to receive maximum benefits from biochar, biochar should be tailored for its use to address a specific soil issue taking into account soil type, climate, and management goals [18,27].
Recent studies have shown that the physical and especially chemical properties of biochars can be altered by introducing heteroatoms (i.e., non-carbon atoms such as N, P, oxygen (O), and sulfur (S)) in the C ring structure [28,29,30]. The production of heteroatom-enriched or activated biochar is gaining attention for the potential use as energy storage materials [31,32] and metal-free catalysts [33] because of the positive effects of doping heteroatoms in increasing total pore volume, micropore volume, and specific surface area as compared to undoped biochar [33,34,35]. Doping of heteroatoms in the C structure of chars is achieved either by (1) multistep procedures involving the production of chars, followed by heteroatom incorporation with the use of heteroatom-containing precursors at high temperatures, or (2) in situ doping in which feedstocks with high heteroatom contents are used [28]. Gao et al. [36] demonstrated that heteroatom-enriched biochar (O, N, and S) produced using raw materials rich in heteroatoms has the potential to produce value-added biochar with reduced production costs. Considering that PL is chemically equipped with significant amounts of N and P, enrichment of PL biochar with doped N and P may have the potential to add economic and environmental value through its use as a soil amendment and a slow-release fertilizer (or a fertilizer containing a plant nutrient in a form that delays its availability), which has not been explored to date.
In order to valorize litter into high-value products via pyrolysis, evaluation of best production conditions and subsequent properties of carbonized PL is necessary. Therefore, the objective of this study was to evaluate physical and chemical properties of PLB doped with N and P under different production regimes (pyrolysis temperature and activation). Through this study we intend to identify optimal pyrolysis temperatures for converting PL to PLB (unactivated and activated) for use as a soil amendment. We hypothesize that the amount of N and P doped in the carbon ring structure of biochar depends on the pyrolysis temperature and activation, which in turn affects the quality of biochar as a soil quality enhancer. Quantitative comparison of physical and chemical properties of PLB is essential for soil amendment characterization.

2. Materials and Methods

2.1. Preparation of Biochar and Activated Biochar

Selected litter properties are presented in Supplementary Table S1. A schematic representation of the production process of unactivated biochar (UB) and activated biochar (AB) from PL is presented in Figure 1. Poultry litter was placed in a stainless-steel container and pyrolyzed in a furnace with a constant N flow of 2 L/min. Unactivated biochar was obtained by carbonizing PL at 400, 500, 600, and 700 °C for 3 h at a heating rate of 10 °C/min. All pyrolysis experiments were performed in a 1215 cm3 custom-built stainless-steel reactor. Typically, a predetermined mass of litter (225–477 g) was loaded in the reactor and the reactor was placed in the furnace to initiate pyrolysis. Nitrogen was allowed to flow through the stainless-steel container even after carbonization was completed, until the temperature decreased to 150 °C. Subsequently, biochar was weighed to determine yield (described in Section 2.2).
Using biochar obtained at each temperature, AB was obtained by mixing 10 g of UB with 20 mL of methanesulfonic acid (CH4O3S) and heating the mixture in the furnace at the same temperature used for UB production (i.e., 400, 500, 600, and 700 °C) for 1 h at a heating rate of 10 °C/min using a N flow rate of 2 L/min. After cooling, the AB was soaked overnight in excess water to remove unreacted acid. Subsequently, the AB was filtered, dried overnight at 105 °C in an oven, and weighed to calculate yield. Triplicate samples of UB and duplicate samples of AB were obtained for each production setting (i.e., n = 12 for AB and n = 12 for UB samples). Homogeneous subsamples were obtained for determination of physical, chemical, and surface characteristics.

2.2. Physical and Chemical Properties of Biochars

Biochar (activated and unactivated) yield was calculated as the mass of biochar generated from a unit of dry mass of PL. The pH and electrical conductivity (EC) were measured in a suspension of dry and ground biochar (<2 mm) and deionized water (1:10 w/v) following 1 h equilibrium after vigorously stirring using a pH and EC meter [37].
Total C and N in the biochar were determined by combustion using a Vario Max CN analyzer (Elementar Americas Inc, Mount Laurel, NJ, USA). Recovery of C and N in the biochars was calculated as the product of biochar yield and the ratio of C (or N) content in biochar to that in PL. Nitrate-nitrogen (NO3-N) and ammonium-nitrogen (NH4-N) were determined by colorimetric analysis on 1:10 biochar/water extraction following filtration through a 0.45 µm filter paper [37] on a Skalar San++ autoanalyzer (Skalar, Analytical B.V, North Brabant, Netherlands). NO3-N was analyzed by the Cd-reduction method according to American Public Health Association Method 418-F [38] and NH4-N was analyzed by the salicylate-nitroprusside USEPA Method 351.2 [39]. Total metals (Al, As, Ca, Cd, Co, Cr, Fe, K, Mg, Mn, Mo, Na, Ni, P, Pb, S, Se, Ti, and Zn) were determined by inductively coupled optical emission spectroscopy (ICP-OES) on an Agilent 5110 ICP-OES (Agilent Technologies, Santa Clara, CA, USA) after digesting oven dried-biochar samples with HNO3 and H2O2 [40]. Water-soluble metals (Al, As, Ca, Cd, Co, Cr, Fe, K, Mg, Mn, Mo, Na, Ni, P, Pb, S, Se, Ti, and Zn) were extracted using biochar and a 1:10 (biochar/water) extraction ratio [37] and analyzed by ICP-OES.
Bulk density of biochars was determined as described by Lima and Marshall [41] by filling a 10 mL tube with oven-dried sample, about 1 mL at a time, capping and tapping to a constant (minimum) volume. The density (g cm−3) was calculated as the ratio of oven-dry weight and volume of packed biochar.
Water-holding capacity is a measure of water retention by adhesion and cohesion forces. The WHC was determined following the procedure by Ashworth et al. [7]. Ground and sieved (<2-mm) biochar samples were mixed uniformly, placed in PVC collars (about 100 cm3) and saturated, following which they were placed in a pressure plate extractor (Soilmoisture Equip. Corp., Santa Barbara, CA, USA) under a pressure of 33 kPa for 2 to 3 days until a constant moisture content was obtained. The amount of moisture retained at 33 kPa per unit dry weight of biochar provided its WHC (g g−1).
The persistence of hydrophobicity/water repellency of biochar was tested with a water droplet penetration time (WDPT) test. WDPT is an easy and rapid means of determining water repellency. This method includes measuring the time a droplet of water retains on the surface of biochar, which depends on the degree of biochar hydrophobicity. Three drops of deionized water droplet (~0.5 mL) from a pipet (from a height <10 mm) were added to 2 g of ground and homogenized biochar and the time of penetration was recorded, which provided an indication of water repellency [42]. The biochars were categorized into five degrees of hydrophobicity as hydrophilic, slightly hydrophobic, strongly hydrophobic, very strongly hydrophobic, and extremely hydrophobic based on the water droplet penetration time of ≤5, 5–60, 60–600, 600–3600, ≥3600 s, respectively, as defined by Bisdom et al. [43].

2.3. Biochar Surface Characteristics

Point of zero charge (PZC), pH at which the surface of a material acquires a net neutral charge, was determined using a series of 50 mL 0.01 M NaCl solution calibrated in a pH range of 4–13 (pHinitial) using either 0.1 M HCl or 0.1 M NaOH in which 0.15 g of biochar was added. The solution was stirred for 48 h, filtered, and the pH of the filtrate (pHinitial) was recorded. The change in pH of the filtrate (pHfinal–pHinital) was plotted against pHfinal and the pH value corresponding to the intersection of the curve with the line, pHinitial = pHfinal [43,44].

2.4. Surface Characterization of Unactivated Biochar (UB) and Activated Biochar (AB)

Surface chemical features of UB and AB were analyzed by a Bruker Platinum ATR spectrometer (Bruker, Billerica, MA, USA). Briefly, biochar samples were placed in a sample compartment and the infrared (IR) data were recorded for a range of 400–4500 cm−1. The SPECS X-ray Photoelectron Spectroscopy (XPS) system (SPECS, Berlin, Germany) was used to determine the elemental composition of biochar surface and the chemical speciation by using PHOIBOS 150 Analyzer (<1 eV resolution). Mg Kα radiation (1253.6 eV) was used as the X-ray source under 3 × 10⁻¹⁰ mbar pressure. Additionally, X-ray Diffraction (XRD) studies of UB and AB were performed with PANalytical Empyrean (Malvern Panalytical, Malvern, UK) to obtain information about their crystalline properties. Cu X-ray tube was used as X-ray source and PIXcel 1D as a detector. The operating voltage was 40–45 kV and the operating current was 20–40 mA.

2.5. Statistical Analysis

The effect of UB and AB and production temperature on physical, chemical, and surface characteristics was determined by analysis of variance (ANOVA) using the mixed model (MIXED) procedure in SAS version 9.4 (Cary, NC, USA) [45]. Biochar activation (activated and unactivated) and pyrolysis temperature (400–700 °C) were the main effects, with replication being a random effect. If main effect differences were found, means were separated by Fisher’s least significant difference (LSD), at a probability level of 0.05 using SAS macro ‘pdmix800’ [46]. The XRD and IR data were processed using Origin 2021b software (version 2021, OriginLab Corporation, Northampton, MA, USA).

3. Results and Discussion

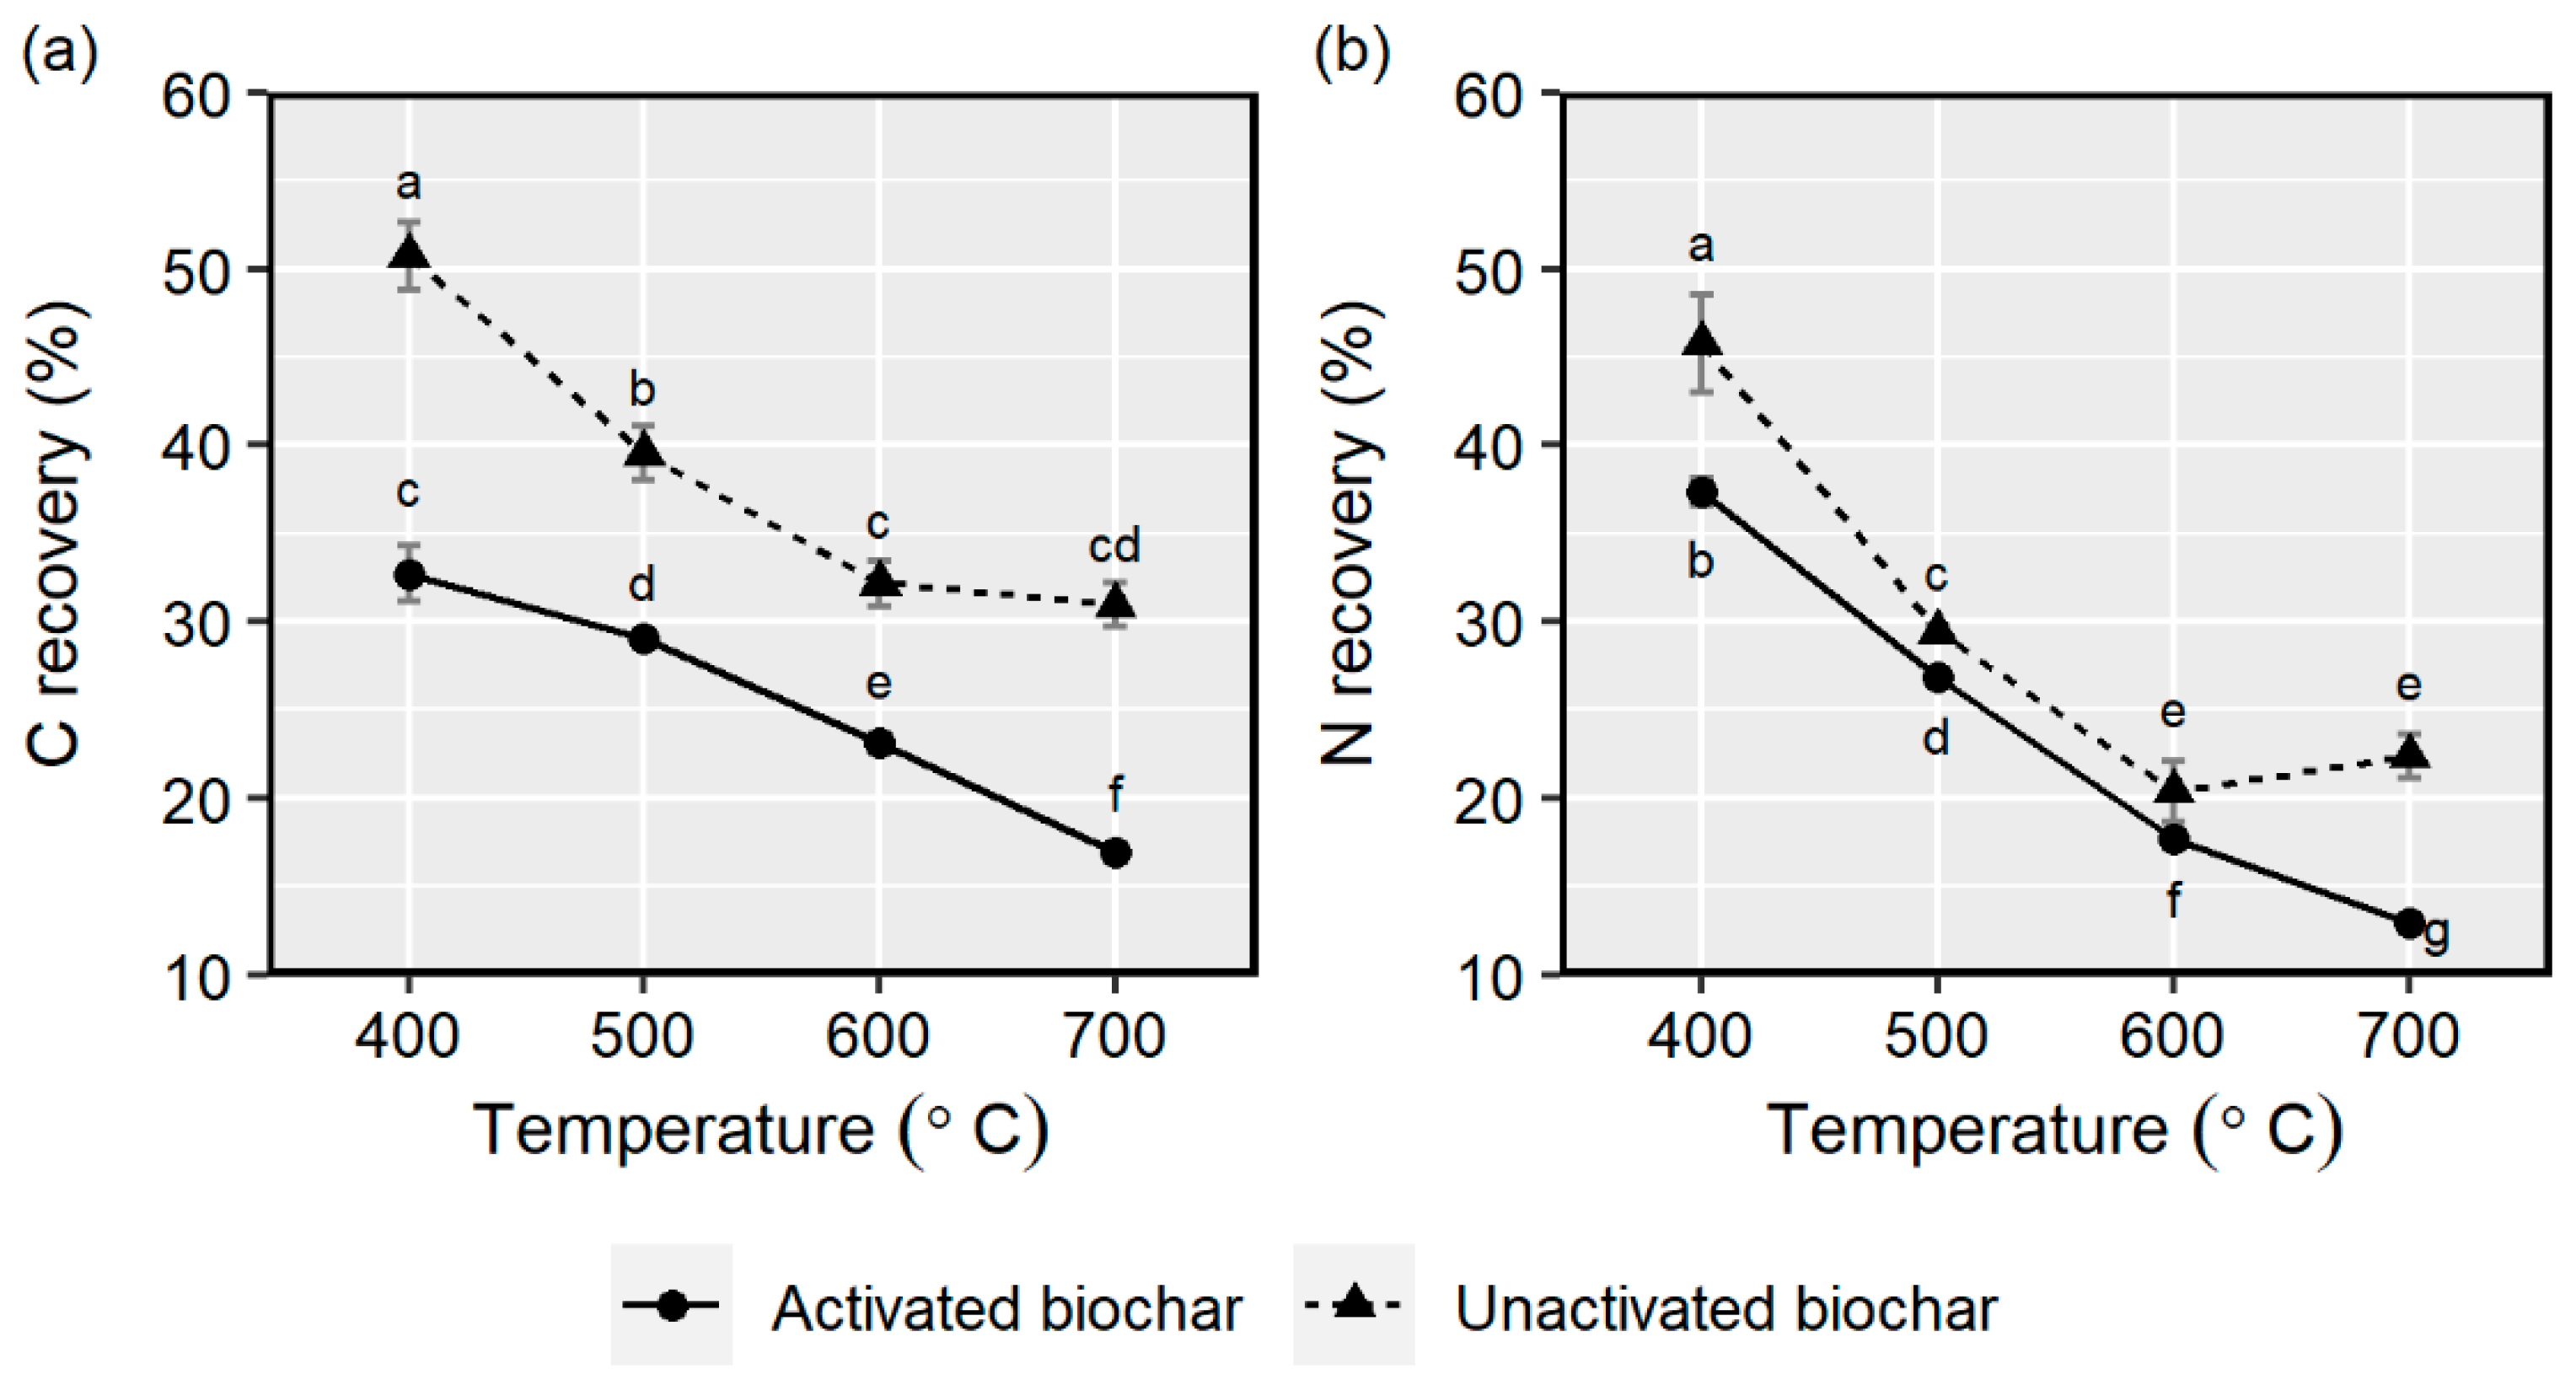
3.1. Biochar Yield and C and N Content

Biochar yield had a range of 37.5–52.8% for the UB and 24.9–40.5% for the AB (Table 1). The loss of water and volatiles during the pyrolysis processes resulted in decreasing yield with increasing temperatures.
Total C in all biochars decreased from initial C content of litter (46.3%) to 37.74–44.49% in UB and 31.57–37.68% in AB produced at 400 to 700 °C (Table 1). The recovery range of C in raw biochar was 31–51% and much lower (p < 0.0001) in activated biochar, 17–33% (Figure 2). The C content and recovery of C in UB decreased with increasing pyrolysis temperature up to 600 °C, whereas in UB-600 and UB-700 both measures were not different (p = 0.001). The C content of AB produced at 400–600 °C and UB produced at 600–700 °C were similar, with a lower content for AB-700 °C. The recovery of C from the raw PL litter decreased constantly with increasing temperatures (Figure 2).
The total N content decreased from the initial N content in raw PL (3.54%) and with increasing pyrolysis temperatures (p = 0.0001) in both the biochars, except for UB-700 with greater N content than UB-600 (Table 1). Interestingly, the N content of AB was greater (p < 0.0001) than UB produced at the same temperatures with the exception of UB-700 and AB-700. Greatest N content was obtained in AB-400. Conversion of PL to UB resulted in loss of 54–80% N and loss of 63–88% N in AB. The reduction in N content in biochar compared to the feedstock, coupled with the high N-adsorption capacity, has often cited reduced N availability for plant uptake and thus N-deficiency in plants where high rates of biochar are applied without supplementary N fertilizer [47]. Immobilization of N following biochar amendment can result especially with biochars with high C:N ratios [48]. The biochars produced in this study had C:N ratios between 14.5 and 20.7 (Table 1). With the lower C:N ratio and greater N content of PL biochars than most plant-derived biochars [18], N immobilization with PL biochars should not be a concern when used as a soil amendment, especially for AB with lower (p < 0.0001) C:N ratios than UB.

3.2. Physical and Chemical Properties

3.2.1. pH and EC

Biochar pH increased with increasing pyrolysis temperatures, with the highest pH for UB-600 and UB-700 (Table 2). Activated biochar produced at 400 °C had pH lower than PL (8.49), whereas at temperatures above 400 °C, pH was above 9. Increasing pyrolysis temperature removes more volatile compounds, thus increasing the concentration of inorganic elements, i.e., ash content and subsequently pH [49]. Because of the high pH values, addition of PLB (2% w/w) would increase the pH of acidic soils [18], which suggests the potential use of PLB as a liming agent to improve the quality of acidic soils.
The EC of UB was considerably greater (p < 0.0001) than AB and raw PL (6.74 mS cm−1). In AB-400 °C, the EC values were lower compared to raw PL (Table 2). Activated biochar produced between 500 and 700 °C had EC values close to that of PL, which could be associated with the washing of inorganic elements (minerals) during soaking with excess water to remove unreacted acid.

3.2.2. Bulk Density, Water Holding Capacity, and Hydrophobicity

Both biochars had bulk density ranges between 0.28 and 0.56 g cm−3, with the lowest bulk density occurring for AB-400 and the greatest bulk density for AB-700 (Table 2). The biochars produced at all temperatures were considerably lower than those of typical agricultural soils, indicating that application of biochar to soil has the potential to reduce soil bulk density. Soil application of biochar at application rates as low as 5 g kg−1 has been reported to significantly reduce soil bulk density of a loamy soil [11].
Water holding capacity of biochars was in the range of 0.52 (UB-400)–1.29 g g−1 (AB-400). WHC was affected by activation (p < 0.0001), with greater values in AB compared to UB and temperature × activation (p < 0.0001) but not by temperature (p = 0.26). Among the UB, lowest WHC was associated with UB-400, whereas for UB produced between 500 and 700 °C WHC was not different (p < 0.0001). Activated biochar produced at 400 °C had higher WHC compared to the AB produced at higher temperatures, which could be associated with the low density of AB (high porosity) generated at 400 °C.
Apart from UB produced at 400 °C, which was very strongly hydrophobic, and AB-700, which showed slightly hydrophobic behavior, all biochars were hydrophilic in nature. Kinney et al. [23] observed a decreasing pattern of biochar hydrophobicity with increasing pyrolysis temperatures for three plant-derived biochars with the highest degree of hydrophobicity associated with biochars produced at 300 °C. The degree of hydrophobicity was strongly correlated with the presence of aliphatic functional groups (C–H corresponding to a peak area between 3000 and 2800 cm−1 in an FTIR spectra) on the surface of biochars that were volatilized at temperatures greater than 400 °C. The strong hydrophobicity of UB-400 may negatively impact soil hydraulic properties, which needs to be investigated as a part of future field-based studies.

3.2.3. Nutrient Concentration

Raw PL used for biochar production contained 16.3, 33.0, 21.5, 6.6, and 5.5 g kg−1 of total P, K, Ca, Mg, and S, respectively. Conversion of PL to biochar increased the concentrations of P (UB: 3-fold, AB: 3-fold), K (UB: 2.5-fold, AB: 1.1-fold), Ca (UB: 2.9-fold, AB: 3.1-fold), Mg (UB: 2.5-fold, AB: 2.1-fold), and S (UB: 1.2-fold, AB: 8.4-fold) at all temperatures except for AB-400, which had lower K and Mg contents than raw PL (Table 3). The lowest concentration of P was obtained for AB-400. Concentrations of P, K, Ca, and Mg increased with increasing pyrolysis temperatures for both biochars (p < 0.0001). The activation process resulted in greater (p < 0.0001) Ca and S concentrations and lower (p < 0.0001) concentrations of K and Mg in AB compared to UB, whereas the overall P concentration was not different in the two biochars (p > 0.05). There was a drastic increase in S concentration in AB compared to UB produced at 400–700 °C. Unlike in UB, the S concentration in AB decreased with increasing pyrolysis temperatures. The increase in S content in AB compared to UB could be associated with the input of S due to the addition of methanesulfonic acid (CH4O3S) during the generation of AB.
Water-soluble nutrients P, K, Ca, Mg, and S in both biochars constituted less than 8, 53, 0.6, 2, and 34% of the total biochar P, K, Ca, Mg, and S, respectively, except for AB-400, in which the proportions of water-soluble P, K, Ca, Mg, and S were 13, 89, 5, 40, and 10% of the respective total values. Water-soluble P, K Ca, Mg, and S concentrations were affected by temperature × activation (p < 0.0001), temperature (p < 0.0001), and activation (p < 0.0001). Water-soluble P in UB increased with pyrolysis temperatures, with the greatest value occurring under UB-600, whereas no clear trend was observed for AB. In UB-600, UB-700, and AB-400, water-soluble P contents were greater than that of raw PL (1.29 g kg−1). Water-soluble Ca, Mg, and S contents in ABs were greater than in UBs produced at the same pyrolysis temperatures, whereas water-soluble P and K were lower for ABs except for water-soluble P content of AB-400 (Table 3). Though the concentrations of nutrients (total and water-soluble) especially P, Ca, and Mg, were elevated in the biochars compared to PL, it does not necessarily increase the risk of losses with leaching or runoff when applied as soil amendment. Liang et al. [50] reported a much slower rate of P release from dairy manure-derived biochar compared to that from raw manure due to formation of less-soluble P forms, i.e., [(Ca, Mg)3(PO4)2]. Additionally, the slight increase in pH that occurs after biochar application may stabilize the water-soluble P fraction in soil and thus reduce P release [51,52]. This also means that biochar may act as a slow-release fertilizer with oxidation of biochar surfaces with ageing [53]. However, various factors such as biochar properties, inherent soil properties, and biochar application rate affect the behavior of biochar P release and retention in soils [51].
Conversion of PL to PLB drastically decreased the biochar NH4-N concentration from 2630 mg kg−1 in PL to 8–102 mg kg−1 in the biochars (Table 3). Among all biochars, UB-700 had the highest NH4-N content, yet the concentrations were only about 4% of the raw PL. Interestingly, the NO3-N concentration of UB increased with increasing temperatures with greater NO3-N content in UB produced at 600 and 700 °C compared to the PL (5.44 mg kg−1). NO3-N concentrations were below detection limit for Abs, except for AB-700 with an average concentration of 1.71 mg kg−1.

3.2.4. Concentration of Heavy Metals

Concentrations of As, Cr, Mo, Ni, Pb, Se, and Zn were affected by activation (p < 0.0001), with greater concentrations in AB compared to UB except for Se, which was greater in UB. Concentrations of Cu and Zn increased with increasing pyrolysis temperature (p < 0.0001) in both biochars (Table 4), whereas there was no effect of temperature on As (p = 0.90) and Se (p = 0.67) concentrations. The concentration of the 9 heavy metals (As, Cd, Cu, Cr, Mo, Ni, Pb, Se, and Zn) for all biochars was much lower than the U.S. standards for concentration limits in biosolids for land application, indicating that PLB can be safely applied to agricultural lands as soil amendment [54]. However, long-term effects of repeated PLB application on concentrations of heavy metals in soil is not clear and should be a subject of future research. We therefore accept the hypothesis that doping biochar will likely affect the soil amendment quality.

3.3. Biochar Surface Characteristics

3.3.1. Point of Zero Charge

Point of zero charge (PZC) is the pH at which the net surface charge is zero. A negatively charged surface has PZC less than 7 and attracts cations, whereas surfaces with PZC above 7 attracts anions in a solution. In this research, the unactivated biochar had a PZC greater than 9, which indicates the surface was positively charged (Figure 3). It also indicates that biochar has a high affinity to anions due to the high PZC, which may contribute to the adsorption of phosphates, anionic-fertilizers, and soil organic matter [55].

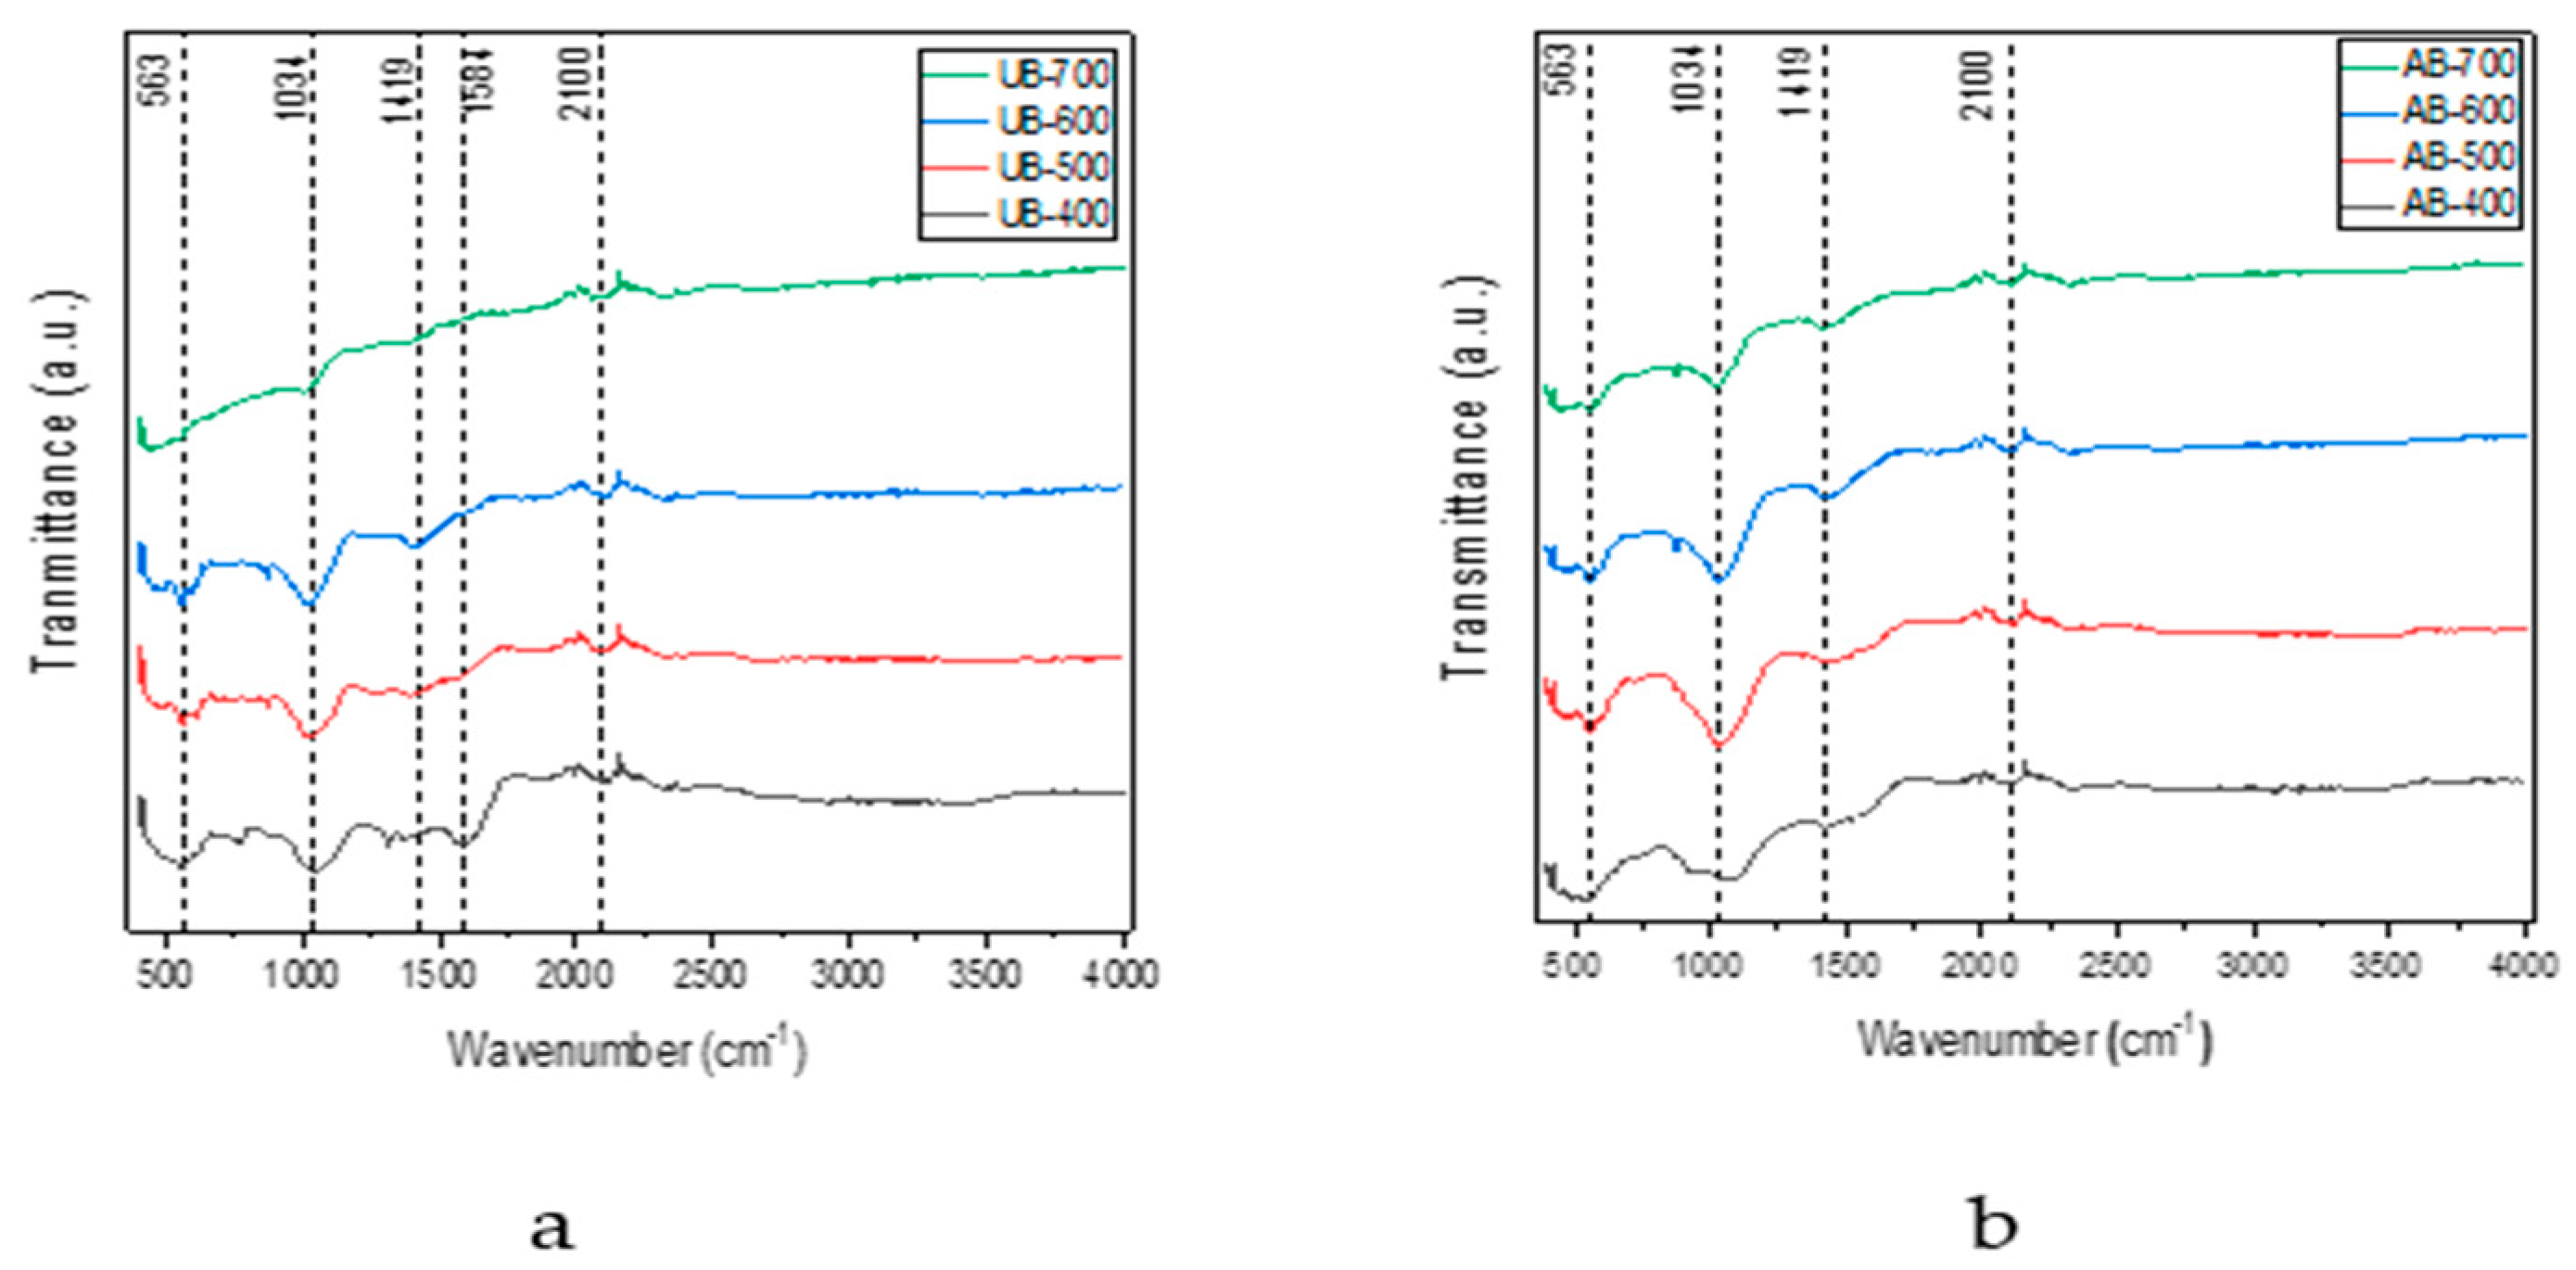
3.3.2. Infrared Analysis

The IR data summarizing the effect of temperature and methanesulfonic acid on the surface of the UB and AB are presented in Figure 4. The peak at 1034 cm−1 was attributed to SO2– symmetric stretching, which became more pronounced in AB than UB because of methanesulfonic acid [56,57]. The decrease of peak intensity with the increase of temperature in UB and AB indicates a decrease in S concentration on the surface, which was also reported by Zhang et al. (2019) [58]. The peak at 563 cm−1 was attributed to the presence of sulfate and P-O bonds [59,60,61]. The peak at 1584 cm−1 was attributed to N–H bending and aromatic C=C, which decreased with an increase in temperature in UB and disappeared in AB [62,63]. The decrease and disappearance of N, S, and P peaks with temperature rise and activation could have occurred due to oxidation and volatilization of the biochar matrix as oxides of N, S, and P. The peak at 1419 cm−1 was from O-H bending of carboxylic acid and alcohol, which became weaker with a subsequent temperature increase in UB and AB [59]. The weakening of the O-H bond also indicated probable oxidation of S, P, and N. The weak peak at 2100 cm−1 was assigned to C≡C stretching and remained unaltered with temperature change and methanesulfonic acid use.

3.3.3. X-ray Diffraction Analysis

UB and AB were analyzed using XRD to identify the crystalline and/or amorphous phases present (Figure 5). A strong peak at 2θ = 29.08° indicated the presence of inorganic compounds such as KCl (sylvite) and K2SO4 [32,64]. The peak at 2θ = 41.45° was perhaps due to Ca9MgNa(PO4)7 [63]. These properties are attributed to high ash fraction of poultry litter arising from poultry feed [64,65]. The crystalline features of UB decreased with an increase in temperature, as evident by the gradual fading away of the sharp peaks. The XRD patterns of AB at higher temperatures contained noise, which created ambiguity with temperature and the methanesulfonic acid effect. Wang et al. (2015) also reported noisy XRD background of poultry litter-derived biochar [65]. Activated biochars XRD patterns at lower temperatures such as AB-400 and AB-500 clearly depicted an increase of amorphous nature after activation, which is in agreement with Pontiroli et al. (2019) [32]. The broad and weak peak at 2θ = 20°–35° was assigned to the graphitic C(002) plane, which indicated the presence of amorphous C consisting of disordered aromatic C [66].

3.3.4. X-ray Photoelectron Spectroscopy Analysis

XPS spectra of UB and AB were obtained to collect additional information on biochar surface properties. Table 5 represents biochars’ atomic percentage (At%) before and after activation with methanesulfonic acid. The UB and AB had different percentages of N, P, and S, likely originating from poultry litter [66]. The activation process generally increased the number of surface species. The UB N content gradually decreased with an increase of temperature, which is supported by the gradual weakening of N-H bending with temperature increase from FT-IR analysis. The appearance of N and P in AB, despite their absences in UB, was likely owing to surfacing of N and P present within the biochar after activation. The subsequent decrease of C with temperature increase might have been due to the oxidation of C by trace amounts of oxygen in N that was flown through the reactor during the carbonization and also the presence of sulfonic acid during activation. These data also suggested that the oxygen content in activated biochar increased due to its interaction with methanesulfonic acid, as was also reported by Fan et al. (2018) [67].

4. Conclusions

Unactivated (not treated with any chemicals) biochar and activated biochar (activated with methanesulfonic acid) produced from poultry litter at pyrolysis temperatures between 400 and 700 °C were characterized for physical, chemical, and surface properties for potential use as a soil amendment. Activation resulted in an overall decrease of biochars’ pH and electrical conductivity and an increase in oxygen content. Recovery of C and N decreased with increased pyrolysis temperature and was lower in activated biochar than unactivated biochar. The conversion of poultry litter to biochar increased its pH and EC in unactivated biochar. Activated biochar had greater water-holding capacity than raw biochar due to greater surface area and porosity of activated biochar. Nutrient concentrations (P, K, Ca, Mg, and S) in both unactivated biochar and activated biochar were elevated from poultry litter, with concentrations increasing with increasing temperatures. Unactivated biochar produced at 600 and 700 °C had greater NO3-N concentrations than poultry litter. Concentrations of heavy metals were lower than the U.S. standards for ceiling concentration limits of heavy metals for land application.
Among the two types of biochars, activated biochar had greater total P, total Ca, total S, water-soluble Ca, water-soluble Mg, and water-soluble S contents but lower NH4-N, NO3-N, total K, total Mg, water-soluble P, and water-soluble K than unactivated biochar. Among all biochars evaluated, activated biochar produced at 400 °C had the lowest bulk density and greatest water-holding capacity, suggesting that this biochar has the greatest potential to improve soil hydraulic properties. With the greatest concentration of N, water-soluble P, Ca, and Mg in activated biochar produced at 400 °C, this biochar can readily provide plant nutrients when used as a fertilizer. However, the potential losses of nutrients in runoff and leaching from this biochar requires further investigation.

Supplementary Materials

The following supporting information can be downloaded at: https://www.mdpi.com/article/10.3390/biomass2040014/s1, Table S1: Properties of poultry litter used for biochar production. Values are means ± standard deviation (n = 3).

Author Contributions

Conceptualization, A.J.A., S.K., and P.K.; methodology, S.K. and N.-A.-S.R.; software; S.K. and N.-A.-S.R. validation, S.K. and N.-A.-S.R.; formal analysis, S.K. and N.-A.-S.R.; investigation, S.K. and N.-A.-S.R.; resources, P.K. and A.J.A.; data curation, S.K. and N.-A.-S.R.; writing—original draft preparation, S.K., A.J.A., and N.-A.-S.R.; writing—review and editing, A.J.A. and P.K.; visualization, S.K. and N.-A.-S.R.; supervision, A.J.A. and P.K.; project administration, A.J.A. and P.K.; funding acquisition, A.J.A. and P.K. All authors have read and agreed to the published version of the manuscript.

Funding

This research was supported by USDA Sustainable Agricultural Systems Poultry Project Grant. USDA-NIFA-SAS-2020-69012-31823.

Institutional Review Board Statement

Not applicable.

Informed Consent Statement

Not applicable.

Data Availability Statement

Not applicable.

Acknowledgments

Authors gratefully acknowledge technical assistance from Taylor Adams and Kelsey Anderson with USDA-ARS and NCSU AIF for analytical services.

Conflicts of Interest

The authors declare no conflict of interest.

References

  1. USDA-NASS (United States Department of Agriculture—National Agricultural Statistics Service). Poultry Production and Value. Available online: https://usda.library.cornell.edu/concern/publications/m039k491c (accessed on 24 August 2020).
  2. Ashworth, A.J.; Chastain, J.P.; Moore, P.A. Nutrient Characteristics of Poultry Manure and Litter. In Animal Manure: Production, Characteristics, Environmental Concerns, and Management; Waldrip, H., Pagliari, P.H., He, Z., Eds.; Soil Science Society of America Monongraph; John Wiley & Sons, Ltd.: Madison, WI, USA, 2020; pp. 63–87. [Google Scholar]
  3. Sharpley, A.N.; Herron, S.; Daniel, T. Overcoming the Challenges of Phosphorus-Based Management in Poultry Farming. J. Soil Water Conserv. 2007, 62, 375–389. [Google Scholar]
  4. Bolan, N.S.; Szogi, A.A.; Chuasavathi, T.; Seshadri, B.; Rothrock, M.J.; Panneerselvam, P. Uses and Management of Poultry Litter. World’s Poult. Sci. J. 2010, 66, 673–698. [Google Scholar] [CrossRef]
  5. Sharpe, R.R.; Schomberg, H.H.; Harper, L.A.; Endale, D.M.; Jenkins, M.B.; Franzluebbers, A.J. Ammonia Volatilization from Surface-Applied Poultry Litter under Conservation Tillage Management Practices. J. Environ. Qual. 2004, 33, 1183–1188. [Google Scholar] [CrossRef]
  6. Lehmann, J. Bio-Energy in the Black. Front. Ecol. Environ. 2007, 5, 381–387. [Google Scholar] [CrossRef]
  7. Ashworth, A.J.; Sadaka, S.S.; Allen, F.L.; Sharara, M.A.; Keyser, P.D. Influence of Pyrolysis Temperature and Production Conditions on Switchgrass Biochar for Use as a Soil Amendment. BioResources 2014, 9, 7622–7635. [Google Scholar] [CrossRef]
  8. Sadaka, S.; Sharara, M.; Ashworth, A.; Keyser, P.D.; Allen, F.L.; Wright, A. Characterization of Biochar from Switchgrass Carbonization. Energies 2014, 7, 548–567. [Google Scholar] [CrossRef]
  9. Lei, O.; Zhang, R. Effects of Biochars Derived from Different Feedstocks and Pyrolysis Temperatures on Soil Physical and Hydraulic Properties. J. Soils Sediments 2013, 13, 1561–1572. [Google Scholar] [CrossRef]
  10. Abel, S.; Peters, A.; Trinks, S.; Schonsky, H.; Facklam, M.; Wessolek, G. Impact of Biochar and Hydrochar Addition on Water Retention and Water Repellency of Sandy Soil. Geoderma 2013, 202–203, 183–191. [Google Scholar] [CrossRef]
  11. Laird, D.A.; Fleming, P.; Davis, D.D.; Horton, R.; Wang, B.; Karlen, D.L. Impact of Biochar Amendments on the Quality of a Typical Midwestern Agricultural Soil. Geoderma 2010, 158, 443–449. [Google Scholar] [CrossRef]
  12. Hardie, M.; Clothier, B.; Bound, S.; Oliver, G.; Close, D. Does Biochar Influence Soil Physical Properties and Soil Water Availability? Plant Soil 2014, 376, 347–361. [Google Scholar] [CrossRef]
  13. Novak, J.M.; Busscher, W.J.; Laird, D.L.; Ahmedna, M.; Watts, D.W.; Niandou, M.A.S. Impact of Biochar Amendment on Fertility of a Southeastern Coastal Plain Soil. Soil Sci. 2009, 174, 105–112. [Google Scholar] [CrossRef]
  14. Laird, D.; Fleming, P.; Wang, B.; Horton, R.; Karlen, D. Biochar Impact on Nutrient Leaching from A Midwestern Agricultural Soil. Geoderma 2010, 158, 436–442. [Google Scholar] [CrossRef]
  15. Lehmann, J.; Gaunt, J.; Rondon, M. Bio-Char Sequestration in Terrestrial Ecosystems—A Review. Mitig. Adapt. Strateg. Glob. Change 2006, 11, 403–427. [Google Scholar] [CrossRef]
  16. Mohan, D.; Sarswat, A.; Ok, Y.S.; Pittman, C.U., Jr. Organic and Inorganic Contaminants Removal from Water with Biochar, A Renewable, Low Cost and Sustainable Adsorbent—A Critical Review. Bioresour. Technol. 2014, 160, 191–202. [Google Scholar] [CrossRef]
  17. Cao, X.; Harris, W. Properties of Dairy-Manure-Derived Biochar Pertinent to Its Potential Use in Remediation. Bioresour. Technol. 2010, 101, 5222–5228. [Google Scholar] [CrossRef]
  18. Novak, J.M.; Lima, I.; Xing, B.; Gaskin, J.W.; Steiner, C.; Das, K.C.; Ahmedna, M.; Rehrah, D.; Watts, D.W.; Busscher, W.J.; et al. Characterization of Designer Biochar Produced at Different Temperatures and Their Effects on a Loamy Sand. Ann. Environ. Sci. 2009, 3, 195–206. [Google Scholar]
  19. Song, W.; Guo, M. Quality Variations of Poultry Litter Biochar Generated at Different Pyrolysis Temperatures. J. Anal. Appl. Pyrolysis 2012, 94, 138–145. [Google Scholar] [CrossRef]
  20. Brewer, C.E.; Schmidt-Rohr, K.; Satrio, J.A.; Brown, R.C. Characterization of Biochar from Fast Pyrolysis and Gasification Systems. Environ. Prog. Sustain. Energy 2009, 28, 386–396. [Google Scholar] [CrossRef]
  21. Cantrell, K.B.; Hunt, P.G.; Uchimiya, M.; Novak, J.M.; Ro, K.S. Impact of Pyrolysis Temperature and Manure Source on Physicochemical Characteristics of Biochar. Bioresour. Technol. 2012, 107, 419–428. [Google Scholar] [CrossRef]
  22. Gray, M.; Johnson, M.G.; Dragila, M.I.; Kleber, M. Water Uptake in Biochars: The Roles of Porosity and Hydrophobicity. Biomass Bioenergy 2014, 61, 196–205. [Google Scholar] [CrossRef]
  23. Kinney, T.J.; Masiello, C.A.; Dugan, B.; Hockaday, W.C.; Dean, M.R.; Zygourakis, K.; Barnes, R.T. Hydrologic Properties of Biochars Produced at Different Temperatures. Biomass Bioenergy 2012, 41, 34–43. [Google Scholar] [CrossRef]
  24. Herath, H.; Camps-Arbestain, M.; Hedley, M. Effect of biochar on Soil Physical Properties in Two Contrasting Soils: An Alfisol and an Andisol. Geoderma 2013, 209–210, 188–197. [Google Scholar] [CrossRef]
  25. Jeffery, S.; Meinders, M.B.; Stoof, C.R.; Bezemer, T.M.; van de Voorde, T.F.; Mommer, L.; van Groenigen, J.W. Biochar Application Does Not Improve the Soil Hydrological Function of a Sandy Soil. Geoderma 2015, 251–252, 47–54. [Google Scholar] [CrossRef]
  26. Ouyang, L.; Wang, F.; Tang, J.; Yu, L.; Zhang, R. Effects of Biochar Amendment on Soil Aggregates and Hydraulic Properties. J. Soil Sci. Plant Nutr. 2013, 13, 991–1002. [Google Scholar] [CrossRef]
  27. Abiven, S.; Schmidt, M.W.I.; Lehmann, J. Biochar by Design. Nat. Geosci. 2014, 7, 326–327. [Google Scholar] [CrossRef]
  28. Rangraz, Y.; Heravi, M.M. Recent Advances in Metal-Free Heteroatom-Doped Carbon Heterogonous Catalysts. RSC Adv. 2021, 11, 23725–23778. [Google Scholar] [CrossRef]
  29. Xu, M.; Li, D.; Yan, Y.; Guo, T.; Pang, H.; Xue, H. Porous High Specific Surface Area-Activated Carbon with Co-Doping N, S and P for High-Performance Supercapacitors. RSC Adv. 2017, 7, 43780–43788. [Google Scholar] [CrossRef]
  30. Kasera, N.; Hall, S.; Kolar, P. Effect of Surface Modification by Nitrogen-Containing Chemicals on Morphology and Surface Characteristics of N-Doped Pine Bark Biochars. J. Environ. Chem. Eng. 2021, 9, 105161. [Google Scholar] [CrossRef]
  31. Gao, F.; Qu, J.; Zhao, Z.; Wang, Z.; Qiu, J. Nitrogen-Doped Activated Carbon Derived from Prawn Shells for High-Performance Supercapacitors. Electrochimica Acta 2016, 190, 1134–1141. [Google Scholar] [CrossRef]
  32. Pontiroli, D.; Scaravonati, S.; Magnani, G.; Fornasini, L.; Bersani, D.; Bertoni, G.; Milanese, C.; Girella, A.; Ridi, F.; Verucchi, R.; et al. Super-Activated Biochar from Poultry Litter for High-Performance Supercapacitors. Microporous Mesoporous Mater. 2019, 285, 161–169. [Google Scholar] [CrossRef]
  33. Pei, X.; Peng, X.; Jia, X.; Wong, P.K. N-Doped Biochar from Sewage Sludge for Catalytic Peroxydisulfate Activation Toward Sulfadiazine: Efficiency, Mechanism, and Stability. J. Hazard. Mater. 2021, 419, 126446. [Google Scholar] [CrossRef] [PubMed]
  34. Ma, G.; Yang, Q.; Sun, K.; Peng, H.; Ran, F.; Zhao, X.; Lei, Z. Nitrogen-Doped Porous Carbon Derived from Biomass Waste for High-Performance Supercapacitor. Bioresour. Technol. 2015, 197, 137–142. [Google Scholar] [CrossRef] [PubMed]
  35. Sundriyal, S.; Shrivastav, V.; Pham, H.D.; Mishra, S.; Deep, A.; Dubal, D.P. Advances in Bio-Waste Derived Activated Carbon for Supercapacitors: Trends, Challenges and Prospective. Resour. Conserv. Recycl. 2021, 169, 105548. [Google Scholar] [CrossRef]
  36. Gao, Y.; Xu, S.; Yue, Q.; Ortaboy, S.; Gao, B.; Sun, Y. Synthesis and Characterization of Heteroatom-Enriched Biochar from Keratin-Based and Algous-Based Wastes. Adv. Powder Technol. 2016, 27, 1280–1286. [Google Scholar] [CrossRef]
  37. Self-Davis, M.L.; Moore, P.A. Determining Water-Soluble Phosphorus in Animal Manure. In Methods of Phosphorus Analysis for Soils, Sediments, Residuals, and Waters, Southern Cooperative Series Bulletin; Pierzynski, G.M., Ed.; North Carolina State University: Raleigh, NC, USA, 2000; Volume 396, pp. 74–76. [Google Scholar]
  38. APHA. Standard Methods for the Examination of Water and Wastewater, 18th ed.; Greenberg, A.E., Clesceri, L.S., Eaton, A.D., Eds.; American Public Health Association: Washington, DC, USA, 1992. [Google Scholar]
  39. USEPA. Methods for Chemical Analysis of Water and Wastes; USEPA Rep. EPA/600/4-79/020; USEPA: Washington, DC, USA, 1979.
  40. Zarcinas, B.A.; Cartwright, B.; Spouncer, L.R. Nitric Acid Digestion and Multi-Element Analysis of Plant Material by Inductively Coupled Plasma Spectrometry. Commun. Soil Sci. Plant Anal. 1987, 18, 131–146. [Google Scholar] [CrossRef]
  41. Lima, I.M.; Marshall, W.E. Granular Activated Carbons from Broiler Manure: Physical, Chemical and Adsorptive Properties. Bioresour. Technol. 2005, 96, 699–706. [Google Scholar] [CrossRef]
  42. Usevičiūtė, L.; Baltrėnaitė, E. Methods for Determining Lignocellulosic Biochar Wettability. Waste Biomass Valorization 2019, 11, 4457–4468. [Google Scholar] [CrossRef]
  43. Bisdom, E.; Dekker, L.; Schoute, J. Water Repellency of Sieve Fractions from Sandy Soils and Relationships with Organic Material and Soil Structure. Geoderma 1993, 56, 105–118. [Google Scholar] [CrossRef]
  44. Augoustides, V.; Kasera, N.; Kolar, P. Chemical Characterization Data of Raw Loblolly Pine Bark Nuggets. Chem. Data Collect. 2021, 33, 100727. [Google Scholar] [CrossRef]
  45. SAS Institute. SAS 9.4; SAS Institute: Cary, NC, USA, 2017. [Google Scholar]
  46. Saxton, A.M. A Macro for Converting Mean Separation Output to Letter Groupings in Proc Mixed. In Proceedings of the SAS Users Group International 23, Nashville, TN, USA, 22–25 March 1998; pp. 1243–1246. [Google Scholar]
  47. Chan, K.Y.; Van Zwieten, L.; Meszaros, I.; Downie, A.; Joseph, S. Using Poultry Litter Biochars as Soil Amendments. Soil Res. 2008, 46, 437–444. [Google Scholar] [CrossRef]
  48. Bruun, E.W.; Ambus, P.; Egsgaard, H.; Hauggaard-Nielsen, H. Effects of Slow and Fast Pyrolysis Biochar on Soil C and N Turnover Dynamics. Soil Biol. Biochem. 2012, 46, 73–79. [Google Scholar] [CrossRef]
  49. Novak, J.M.; Cantrell, K.B.; Watts, D.W.; Busscher, W.J.; Johnson, M.G. Designing Relevant Biochars as Soil Amendments Using Lignocellulosic-Based and Manure-Based Feedstocks. J. Soils Sediments 2014, 14, 330–343. [Google Scholar] [CrossRef]
  50. Liang, Y.; Cao, X.; Zhao, L.; Xu, X.; Harris, W. Phosphorus Release from Dairy Manure, the Manure-Derived Biochar, and Their Amended Soil: Effects of Phosphorus Nature and Soil Property. J. Environ. Qual. 2014, 43, 1504–1509. [Google Scholar] [CrossRef] [PubMed]
  51. Li, F.; Liang, X.; Niyungeko, C.; Sun, T.; Liu, F.; Arai, Y. Effects of Biochar Amendments on Soil Phosphorus Transformation in Agricultural Soils. Adv. Agron. 2019, 158, 131–172. [Google Scholar] [CrossRef]
  52. Parvage, M.M.; Ulén, B.; Eriksson, J.; Strock, J.; Kirchmann, H. Phosphorus Availability in Soils Amended with Wheat Residue Char. Biol. Fertil. Soils 2012, 49, 245–250. [Google Scholar] [CrossRef]
  53. Bruun, S.; Harmer, S.L.; Bekiaris, G.; Christel, W.; Zuin, L.; Hu, Y.; Jensen, L.S.; Lombi, E. The Effect of Different Pyrolysis Temperatures on the Speciation and Availability in Soil of P In Biochar Produced from the Solid Fraction of Manure. Chemosphere 2017, 169, 377–386. [Google Scholar] [CrossRef]
  54. USEPA (United States Enviornmental Protection Agency). A Plain English Guide to the EPA Part 503 Biosolids Rule; Technol. Rep. EPA/832-R-93-003; U.S. Environmental Protection Agency, Office of Wastewater Management: Washington, DC, USA, 1994.
  55. Breton, L.A.; Mahdi, Z.; Pratt, C.; El Hanandeh, A. Modification of Hardwood Derived Biochar to Improve Phosphorus Adsorption. Environments 2021, 8, 41. [Google Scholar] [CrossRef]
  56. Fadhil, A.B.; Aziz, A.M.; Al-Tamer, M.H. Biodiesel Production from Silybum Marianum L. Seed Oil with High FFA Content Using Sulfonated Carbon Catalyst for Esterification and Base Catalyst for Transesterification. Energy Convers. Manag. 2016, 108, 255–265. [Google Scholar] [CrossRef]
  57. Nuradila, D.; Ghani, W.A.W.A.K.; Alias, A.B. Biochar dan Pemangkin Berasaskan Tempurung Kelapa Sawit Untuk Penghasilan Biodiesel. Malays. J. Anal. Sci. 2017, 21, 197–203. [Google Scholar]
  58. Zhang, H.; Wang, T.; Sui, Z.; Zhang, Y.; Sun, B.; Pan, W.-P. Enhanced Mercury Removal by Transplanting Sulfur-Containing Functional Groups to Biochar Through Plasma. Fuel 2019, 253, 703–712. [Google Scholar] [CrossRef]
  59. del Bosque, I.S.; Martínez-Ramírez, S.; Blanco-Varela, M. FTIR Study of the Effect of Temperature and Nanosilica on the Nano Structure of C–S–H Gel Formed by Hydrating Tricalcium Silicate. Constr. Build. Mater. 2014, 52, 314–323. [Google Scholar] [CrossRef]
  60. Wang, S.; Yuan, H.; Wang, Y.; Shan, R. Transesterification of Vegetable Oil on Low Cost and Efficient Meat and Bone Meal Biochar Catalysts. Energy Convers. Manag. 2017, 150, 214–221. [Google Scholar] [CrossRef]
  61. Lu, Z.; Zhang, H.; Shahab, A.; Zhang, K.; Zeng, H.; Bacha, A.-U.; Nabi, I.; Ullah, H. Comparative study on Characterization and Adsorption Properties of Phosphoric Acid Activated Biochar and Nitrogen-Containing Modified Biochar Employing Eucalyptus as a Precursor. J. Clean. Prod. 2021, 303, 127046. [Google Scholar] [CrossRef]
  62. Chen, D.; Wang, X.; Wang, X.; Feng, K.; Su, J.; Dong, J. The Mechanism of Cadmium Sorption by Sulphur-Modified Wheat Straw Biochar and Its Application Cadmium-Contaminated Soil. Sci. Total Environ. 2020, 714, 136550. [Google Scholar] [CrossRef]
  63. Azargohar, R.; Nanda, S.; Kozinski, J.A.; Dalai, A.K.; Sutarto, R. Effects of Temperature on the Physicochemical Characteristics of Fast Pyrolysis Bio-Chars Derived from Canadian Waste Biomass. Fuel 2014, 125, 90–100. [Google Scholar] [CrossRef]
  64. Subedi, R.; Taupe, N.; Ikoyi, I.; Bertora, C.; Zavattaro, L.; Schmalenberger, A.; Leahy, J.; Grignani, C. Chemically and Biologically-Mediated Fertilizing Value Of Manure-Derived Biochar. Sci. Total Environ. 2016, 550, 924–933. [Google Scholar] [CrossRef]
  65. Wang, Y.; Lin, Y.; Chiu, P.C.; Imhoff, P.T.; Guo, M. Phosphorus Release Behaviors of Poultry Litter Biochar as a Soil Amendment. Sci. Total Environ. 2015, 512–513, 454–463. [Google Scholar] [CrossRef]
  66. Lokman, I.M.; Rashid, U.; Taufiq-Yap, Y.H. Production of Biodiesel from Palm Fatty Acid Distillate Using Sulfonated-Glucose Solid Acid Catalyst: Characterization and Optimization. Chin. J. Chem. Eng. 2015, 23, 1857–1864. [Google Scholar] [CrossRef]
  67. Fan, Q.; Sun, J.; Chu, L.; Cui, L.; Quan, G.; Yan, J.; Hussain, Q.; Iqbal, M. Effects of Chemical Oxidation on Surface Oxygen-Containing Functional Groups and Adsorption Behavior of Biochar. Chemosphere 2018, 207, 33–40. [Google Scholar] [CrossRef]
Figure 1. Production process of unactivated biochar (UB) and activated biochar (AB) at temperatures between 400–700 °C from poultry litter for their characterization.
Biomass 02 00014 g001
Figure 2. Recovery of (a) carbon (C) and (b) nitrogen (N) in activated biochar and unactivated biochar produced from poultry litter at pyrolysis temperatures between 400 and 700 °C. Error bars represent one standard deviation (n = 3). Different letters above/below error bars represent significant differences at p ≤ 0.05.
Biomass 02 00014 g002
Figure 3. Point of zero charge of unactivated biochar (UB) and activated biochar (AB) synthesized at various pyrolysis temperatures of 400–700 °C.
Biomass 02 00014 g003
Figure 4. Infrared spectra of (a) unactivated biochar (UB) and (b) activated biochar (AB) synthesized at various pyrolysis temperatures of 400–700 °C.
Biomass 02 00014 g004
Figure 5. X-ray diffraction pattern of (a) unactivated biochar (UB) and (b) activated biochar (AB) synthesized at temperatures of 400–700 °C.
Biomass 02 00014 g005
Table 1. Production of biochar from poultry litter at different temperatures (n = 3).
Biochar 1Yield 2CNC:N Ratio
――――――― % ―――――――
UB-40052.79 a 344.49 a3.07 b14.5 c
UB-50044.48 ab41.17 b2.34 d17.6 b
UB-60039.49 b37.74 c1.83 f20.7 a
UB-70037.50 b38.19 c2.11 e18.14 b
AB-40040.48 437.41 c3.27 a11.45 d
AB-50035.6837.68 c2.67 c14.13 c
AB-60028.4337.75 c2.20 de17.15 b
AB-70024.8931.57 d1.84 f17.2 b
1 Unactivated biochar (UB) and activated biochar (AB) produced at 400–700 °C. 2 % of dry poultry litter, C and N are % of dry biochar. 3 Different letters along a column represent significant differences at p ≤ 0.05. 4 Statistical analysis was not performed for activated biochar yield as only two replicates were available.
Table 2. Properties of biochar obtained from poultry litter at different temperatures (n = 3).
Biochar 1pHEC 2Bulk DensityWHCHydrophobicity Class
mS cm−1g cm−3g g−1
UB-40010.70 c 310.76 c0.49 b0.52 dVery strongly hydrophobic
UB-50011.38 b10.59 c0.40 c0.67 cHydrophilic
UB-60012.71 a21.40 a0.48 b0.64 cHydrophilic
UB-70012.65 a20.87 b0.44 bc0.69 cHydrophilic
AB-4006.03 f3.75 f0.28 d1.29 aHydrophilic
AB-5009.07 e6.26 e0.47 b0.86 bHydrophilic
AB-6009.77 d6.73 d0.50 ab0.84 bHydrophilic
AB-7009.07 e6.41 de0.56 a0.89 bSlightly hydrophobic
1 Unactivated biochar (UB) and activated biochar (AB) produced at 400–700 °C. 2 EC, electrical conductivity; WHC, water holding capacity. 3 Different letters along a column represent significant differences at p ≤ 0.05.
Table 3. Nutrient content (dry-weight basis) of biochar obtained from poultry litter at different temperatures (n =3).
Biochar 1NO3-NNH4-NPKCaMgS
Total nutrients (g kg−1)
UB-400NA 2NA40.00 f 370.33 d54.67 d13.98 e5.50 f
UB-500NANA45.80 e80.50 c56.167 d16.07 c6.18 ef
UB-600NANA51.33 cd87.83 b67.50 c18.03 b7.47 e
UB-700NANA55.17 b95.83 a69.17 c18.77 a7.67 e
AB-400NANA27.65 g6.80 f34.82 e4.78 f65.33 a
AB-500NANA49.32 d49.62 e67.50 c15.25 d47.42 b
AB-600NANA52.50 c47.68 e78.50 b16.47 c37.53 c
AB-700NANA62.83 a47.53 e83.83 a18.35 ab35.28 d
Water-soluble nutrients (mg kg−1)Water-soluble nutrients (g kg−1)
UB-4000.64 c72.02 c0.41 e26.27 b0.04 d0.07 e1.34 c
UB-5002.45 c85.93 b0.82 c27.57 b0.01 h0.03 f1.24 c
UB-60012.34 b73.81 c3.60 a46.33 a0.01 h<0.01 h1.04 d
UB-70060.75 a102.12 a1.76 b48.26 a0.02 f<0.01 h0.70 e
AB-400BDL80.17 bc3.57 a6.02 e1.76 a1.90 a6.77 b
AB-500BDL10.75 d0.19 f17.21 cd0.20 c0.19 c13.02 a
AB-600BDL7.76 d0.70 d19.44 c0.02 e0.09 d12.54 a
AB-7001.71 c8.16 d0.08 g16.55 d0.43 b0.38 b11.39 a
1 Unactivated biochar (UB) and activated biochar (AB) produced at 400–700 °C. 2 NA, not available; BDL, below detection limit. 3 Different letters along a column represent significant differences at p ≤ 0.05.
Table 4. Concentration of heavy metals (dry-weight basis) in biochars obtained from poultry litter at different temperatures (n =3).
Biochar 1AsCdCuCrMoNiPbSeZn
mg kg−1
UB-4001.27 cd 20.63 c1188 e12.43 c9.62 e18.32 f1.28 ns2.27 ns1407 f
UB-5000.95 de0.65 bc1242 e12.52 c9.68 e19.1 ef1.18 ns1.85 ns1603 e
UB-6001.10 de0.15 d1740 cd12.55 c11.03 c19.53 ef1.47 ns2.05 ns1943 c
UB-7000.78 eBDL 31900 b12.52 c10.70 cd20.7 e0.68 ns1.80 ns1757 d
AB-4001.53 bc0.77 ab1663 d17.5 b17.62 a35.55 c1.97 ns1.22 ns1258 g
AB-5001.92 ab0.85 a1880 bc17.98 b11.35 bc30.83 d1.63 ns1.20 ns1993 bc
AB-6001.90 ab0.80 a2012 b33.38 a12.12 b49.18 a1.82 ns1.03 ns2082 b
AB-7002.13 a0.18 d2488 a33.40 a9.83 de46.12 b1.70 ns1.52 ns2395 a
Ceiling conc. limit 4758543003000754208401007500
1 Unactivated biochar (UB) and activated biochar (AB) produced at 400–700 °C. 2 Different letters along a column represent significant differences at p ≤ 0.05. 3 Below detection limit. 4 Ceiling concentration limit of heavy metals in biosolids for land application [54].
Table 5. Surface compositions of unactivated biochar (UB) and activated biochar (AB) obtained by X-ray Photoelectron Spectroscopy.
Pyrolysis ConditionsElementsUB (At%)AB (At%)
400 °CC64.632.1
N7.10.9
S-2.1
P0.9-
O21.847.7
500 °CC36.835.2
N2.3-
S--
P-5.8
O37.751.0
600 °CC22.432.4
N-4.4
S1.71.1
P0.64.8
O42.350.9
700 °CC25.626.9
N-1.3
S--
P-3.7
O47.256.1
Publisher’s Note: MDPI stays neutral with regard to jurisdictional claims in published maps and institutional affiliations.

