Article

Fatigue Strength Curve for Tubular Joints of Offshore Structures under Dynamic Loading

by
Sudath C. Siriwardane
*,
Nirosha D. Adasooriya
and
Dimitrios Pavlou
Department of Mechanical and Structural Engineering and Materials Science, University of Stavanger, N-4036 Stavanger, Norway
*
Author to whom correspondence should be addressed.
Dynamics 2021, 1(1), 125-133; https://doi.org/10.3390/dynamics1010007
Submission received: 13 June 2021 / Revised: 13 August 2021 / Accepted: 15 August 2021 / Published: 22 August 2021

Abstract

:
Offshore structures are subjected to dynamic environmental loads (wave and wind loads). A stress-life fatigue strength curve is proposed for tubular joints which are in the splash zone area of offshore jacket structures. The Det Norske Veritas (DNV) offshore structures standards given design T-curve in the air is modified with the environment-dependent parameters to obtain this fatigue strength curve. Validity of the curve is done by comparing fatigue lives given by the proposed curve with experimental fatigue lives of tubular joints tested in seawater under different loading conditions. The fatigue assessment of a case study tubular joint is performed using the proposed curve. Nominal stress ranges of the members, which are connected to the joint, are obtained by dynamic analysis of the jacket structure. Stress concentration factors are utilized with the nominal stresses to obtain the hot spot stress ranges. Fatigue lives are calculated and compared with the conventional approach. Hence the applicability and significance of the proposed fatigue strength curve are discussed.

1. Introduction

Offshore structures under dynamic loading conditions are generally subjected to material degradation issues such as fatigue, corrosion, dent, and damages which are termed functional aging. Structural details in the splash-zone of these offshore structures are generally subjected to harsh environmental conditions and dynamic loadings. Fatigue assessment of these joints is generally performed by using the fatigue strength curve provided by the offshore structures standards. The curve was obtained by applying the reduction factor to the relevant fatigue strength curve in the air [1,2]. This reduction factor has been obtained by corrosion fatigue test results in a limited cycle range. A constant slope is proposed for the whole region of the corroded S-N curve based on the reduction factor. The average value for the reduction factor has been determined by very scattered corrosion fatigue (CF) test results in the range from 6 × 10⁴ to 2 × 10⁶ cycles. Therefore, these test results do not represent CF behavior in a very high cycle region which is around the variable amplitude fatigue limit (i.e., around 108 cycles). Since the majority of the structural details in offshore jackets are subjected to variable amplitude low-stress ranges, it is essential to have accurate fatigue strength curves for tabular joints in seawater especially in very high cycle fatigue (VHCF) regions. However, the recommended curve for seawater has been proposed based on the mentioned reduction factor. Therefore, the proposed curve has the same slope for the whole region, and this is against the mechanism of corrosion fatigue of steel [2,3,4] which exhibits a larger difference between fatigue lives in corrosive and non-corrosive environments in the VHCF region than the low-cycle fatigue region [2,3,4,5,6,7]. A new theory for fatigue damage assessment is presented recently by Pavlou [8] based on S-N curves. The concept of the theory is that the area enclosed by the stress and life axes, and the S-N curve, provide a characteristic damage map of the materials. This is termed as “S-N fatigue damage envelope theory” and it can be comfortably used for accurate fatigue damage estimation under variable amplitude loading. Therefore, it is essential to have precise S-N curves for tubular joints in seawater to take account of the interaction effect of the CF mechanism and the loading sequence effect due to harsh environmental conditions and random dynamic loadings.
A stress-life fatigue curve is proposed for tubular joints in the splash zone of offshore jacket structures to overcome the above-mentioned shortcoming of the Det Norske Veritas (DNV) code provided curve. The novelty of the paper is the proposed stress-life fatigue strength curve. The fatigue assessment of a tubular joint of a bottom fixed offshore jacket is done by using the proposed curve, and the results are compared with fatigue lives obtained based on the conventional practice.

2. Proposed Stress Life Fatigue Curve

Corrosion fatigue tests of steel specimen show the negligible degradation of fatigue strength in the low-cycle fatigue (LCF) region while a significant reduction of the strength has been observed in the very high cycle fatigue region [3,5,6,7,9]. This is because of the physical damage state of materials due to stress ranges and the combined effect of stress and time in the corrosive environment. The phenomenological reasons and corresponding mechanisms of mentioned fatigue strength degradation of metals are clearly presented in the authors’ previous papers [10,11]. Hence, the degraded fatigue strength curves were proposed for metals that are exposed to corrosive environments. The same concept/behavior of fatigue strength degradation in seawater is used to derive the formula for tubular joints which are located in the splash zone of the offshore jacket structures. This behavior is used with the design T-curve in air, which is given in the DNV code [1] to obtain the stress life fatigue curve for corroded joints in the splash zone area of offshore jacket structures.
Design T curve (Figure 1) for tubular joints which are not exposed to a corrosive environment [1] (i.e., T-curve given in DNV-GL code), can be expressed by the formula:
log N = log a ¯ m log Δ σ
The N is the predicted number of cycles to fatigue failure of the stress range Δσ. The m is the negative inverse slope pf the S-N curve. The slope of the fatigue strength curve is −1/m. The m = m1 is equal to 3 when Δσ ≥ ΔσD and m = m2 is equal to 5 when Δσ < ΔσD The ΔσD is the stress range at the fatigue curve slope changing point, which corresponds to the NCAFL cycles as shown in Figure 1. ΔσL is the stress range at the fatigue curve slope changing point, which corresponds to the NVAFL cycles as shown in Figure 1. The subscripts “CAFL” and “VAFL” index the constant amplitude fatigue limit and variable amplitude fatigue limits respectively. The log a ¯ is the intercept of log N axis by the design T-curve. There are two respective values for a ¯ as the curve is bilinear. The a ¯ = a ¯ 1 when Δσ ≥ ΔσD and a ¯ = a ¯ 2 when Δσ < ΔσD, respectively. These curve parameters, slopes, and details of knee points are listed in Table 1 for design T-curves in the air by referring to the DNV GL standards [1]. The formula for T-curve is rearranged as,
Δ σ = ( a ¯ N ) 1 m
The relative difference in the log-log scale is linearly deducted from T-curves in the air to obtain the S-N curves of tubular joints which are located in seawater by following the recently published concept [10,11] as shown in Figure 1. Hence, the fatigue stress range of tubular joints in seawater, Δσcor, corresponding to N, can be derived, if Δσcor ΔσD,cor,
log ( Δ σ c o r ) = log ( Δ σ ) [ log Δ σ D log Δ σ D , c o r log N C A F L log N L C F ] ( log N log N L C F )
where ΔσD,cor is the stress range corresponding to NCAFL cycles at the intersection of the two slopes of the curve. The subscript “cor” represents the corrosion which represents the seawater condition. NLCF is the number of cycles to fatigue failure of the intersection point of their high cycle fatigue (HCF) and LCF regions, which is generally equal to 104 cycles.
The formula is further simplified as,
Δ σ c o r Δ σ = ( N N L C F ) c where   c = log Δ σ D log Δ σ D , c o r log N C A F L log N L C F
By substituting Δσ from Equation (2), the above formula for the tubular joints exposed to corrosion in seawater is obtained as,
Δ σ c o r = a ¯ 1 1 / m 1 N L C F c N ( c 1 m 1 )
If Δσcor ΔσD,cor, the formula of the curve for tubular joints exposed to corrosion in seawater can be obtained,
log ( Δ σ D , c o r ) log ( Δ σ c o r ) = [ log Δ σ D , c o r log Δ σ L , c o r ] [ log N C A F L log N V A F L ] ( log N C A F L log N )
or,
Δ σ c o r Δ σ D , c o r = ( N R N C A F L ) c ´ where   c ´ = log Δ σ D , c o r log Δ σ L , c o r log N C A F L log N V A F L
when Δσcor ΔσD,cor, the derived formula is further simplified as,
Δ σ c o r = Δ σ D , c o r [ N C A F L c ´ ] N R c ´
By obtaining the value for ΔσD,cor from Equation (5), the above formula for the tubular joints splash zone is further simplified as,
Δ σ c o r = a ¯ 1 1 / m 1 N L C F c N C A F L ( c ´ c 1 m 1 ) N c ´
The c and ć parameters depend on the corrosive environment, which is seawater free corrosive environment. The statistical analysis of the CF lab test results, the corresponding mean, and conservative values (i.e., design value = mean-2 × standard deviation) are calculated and listed in Table 1. Hence, the mean and design c and ć values are calculated for both the mean and design T curves, as shown in Table 1.

3. Experimental Verification

The proposed fatigue curve of tubular joints is compared with fatigue lives obtained from full-scale fatigue tests of tubular joints exposed to free corrosion in seawater to confirm the validity of the proposed curve. The curve for tubular joints exposed to free corrosion in seawater was obtained from the formulas in Equations (5) and (9) together with the parameters given in Table 1. The design T curve in the air was obtained by Equation (1) and Table 1. The experimental fatigue lives of the tubular joints were obtained from the Health and Safety Executive’s (HSE) offshore technology report [2]. The full-scale tubular joints have been tested in the seawater. Ring stiffened tubular joints have also been tested in addition to ordinary tubular joints. The axial load and out-of-plane bending have been applied for various types of joints. The four stages (i.e., N1, N2, N3, and N4) of fatigue failures were recorded for each test [2]. The comparison was based on hot spot stresses measured during the test.
The comparison of the proposed curves with experimental fatigue lives are shown in Figure 2. The proposed S-N curve (which is obtained from the formulas shown in Equations (5) and (9)) has a conservative agreement with the corresponding experimental fatigue lives. The design S-N curves (i.e., mean-2× standard deviation) have been used as the base for fatigue strength of tubular joints in air, and design T-curve parameters are used to develop the proposed S-N curve for tubular joints in seawater. Hence, the proposed curve shows quite a conservative prediction. Therefore, it is nice to fit the exact mean curve and its parameters as a base for developing the S-N curve for tubular joints in seawater under future studies. The DNV code provided free corrosion fatigue curve [1] is conservative when the number of cycles to failure is lower than 106 cycles. But it is quite doubtful in a very high cycle fatigue region as this violates the real behavior/mechanism of CF endurance.

4. Case Study: Fatigue Assessment of Tubular Joint in the Splash Zone

A case study is performed for a critical joint in the splash zone of an offshore jacket structure.

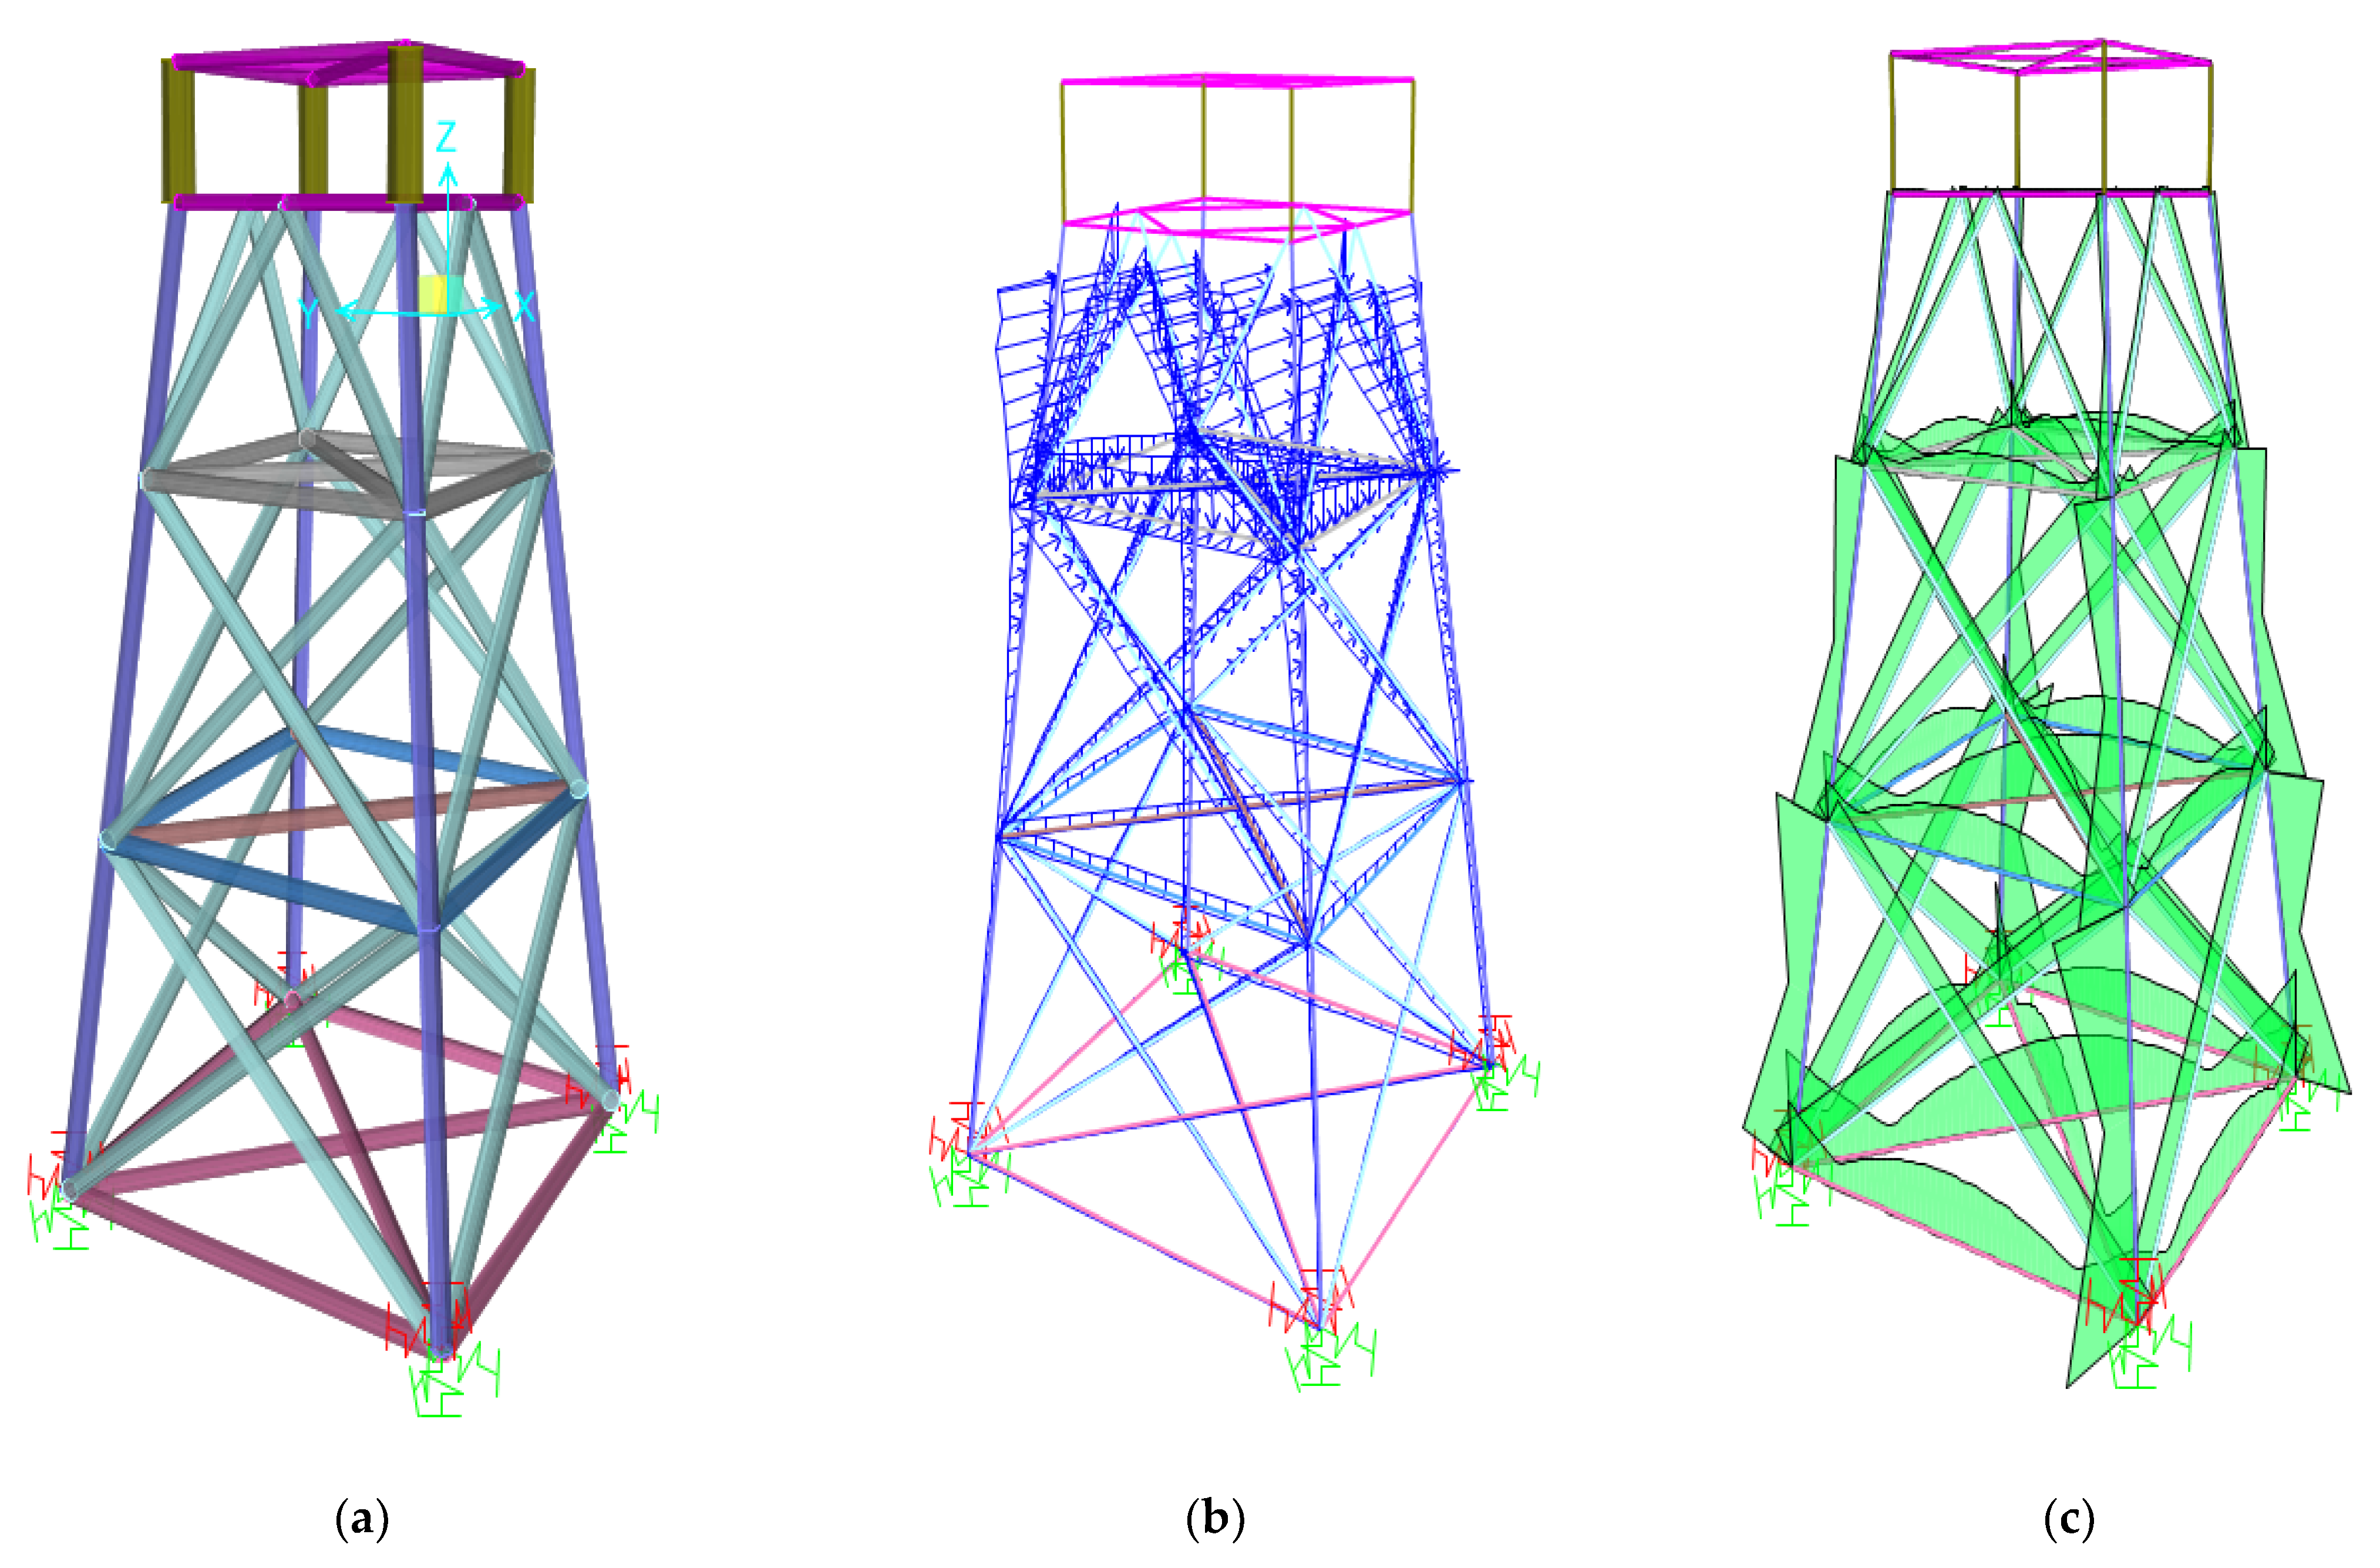
4.1. Considered Offshore Jacket Structure

The considered jacket is bottom-fixed at a 50 m depth and has four main legs [12,13]. All members of the jacket platform are tubular cross-sections of steel grade S355. The outer width, breadth, and height of the structure are 27 m × 27 m × 62.5 m, respectively. The dimensions of the members are shown in Table 2. The mass of the topside is considered as 4.8 × 10⁶ kg [12,13] and is equally distributed to the four-deck legs which transfer the loads from the cellar deck to the jacket legs. Soil-structure interaction in the foundation plane has been recommended to simulate by flexible springs and the horizontal, vertical and rotational stiffnesses are 1.2 × 10⁵, 1.0 × 10⁶, and 1.2 × 10⁶, respectively. Even though the cathodic protection is still effective for submerged members, details in the splash zone are exposed to free corrosion after the loss of coating which is generally assumed as five years of service life [14]. The tubular joint, which is considered in this paper for fatigue assessment, is shown in Figure 3. It is one of the critical joints in the jacket and it is located in the splash zone.

4.2. Wave Load Modelling

A time history dynamic analysis is required to be performed against the wave loads to obtain the hot spot histories at eight spots around the circumference at the considered joint of each member. The linear wave theory [15] is used in this study as the conditions: (i) continuity of mass, (ii) incompressible fluids, and (iii) frictionless fluid flow, are fulfilled.
The considered jacket structure consists of slender cylinders, which implies the diameter D is small relative to wavelength λ (i.e., for legs and braces of the jacket). Wave and current-induced loads on slender members can be obtained from Morrison‘s equation. The hydrodynamic force on slender members due to the wave developed by the inertia force, F1(t) proportional to acceleration and the drag force FD(t) proportional to the square of velocity [15]. The total force acting on the tubular member is given as,
F ( t ) = F I ( t ) + F D ( t ) = d ξ ρ π 4 C M D 2 u ˙ ( t )   d z + d ξ 1 2 ρ C D D u ( t ) | u ( t ) |   d z  
where ρ is the mass density of seawater and the D is the diameter of the cross-section of the tubular member. The CM is inertia/mass coefficient which is equal to 1 + CA. The CA is added mass coefficient and the CD is drag coefficient. These coefficients depend on the Reynolds number Re, the Keulegan–Carpenter number Kc and the surface roughness k. The hydrodynamic coefficients have been determined based on the recommended guideline given in Section 6.6 of the DNV-RP-C205 [16]. u(z,t) is the time-dependent horizontal wave flow velocity at elevation z and the corresponding time dependent wave flow acceleration is u ˙ ( z , t ) . The effective diameters of the members are determined by following the recommended thickness provided in NORSOK-N003 [17] to take into account the effect of marine growth. The horizontal tubular members which are axis parallel to the direction of the wave, which is perpendicular to wave crest, are subjected to vertical forces [15].
The wave simulation is conducted based on a scatter diagram for the North Sea [13], which describes the sea state. Eight wave heights were chosen from the scatter diagram based on the dominancy of the probability of occurrence of each wave [18,19,20]. These waves are assumed to be consecutively generating during a single day. Generally, sea states are stationary for a certain interval, which is 20 min up to 3 to 6 h, as mentioned by the literature [17,20]. This situation is generally termed a sort-term wave condition. Hence, each sea state is assumed to be stationary for 3 h and the wave loads acting on the members were calculated from the maximum wave height. Time-dependent drag and inertia loads were calculated for each sea state for each jacket member respectively. Hence the total hydrodynamic force is calculated by Equation (10) and applied to each submerged member of the jacket as shown in Figure 3b. The hydrodynamic loads of each sea state were extrapolated to obtain time-history functions for 24 h (i.e., valid for a single day) under short-term wave scatter. This loading history was considered throughout the service life of the jacket for conservative remaining fatigue life prediction. The long-term wave scatters are also considered for fatigue life assessment by considering all the seas states in the scatter as the next major step of the case study.

4.3. Time History Dynamic Analysis

A finite element employed time history dynamic analysis is conducted to obtain the nominal stress histories of the fatigue critical members. The dynamic time history analysis for the tubular members is performed as,
m X ¨ + c X ˙ + k X = F ( t )
where X, X ˙ ,   and   X ¨ are time-dependent displacement, velocity, and acceleration of the cylinder/tubular element. The c is the material damping coefficient. The damping due to drag forces was neglected as this is a bottom fixed jacket structure where the response amplitude is small relative to the wave-induced water particle motions. Wave loads described by time history functions F(t), obtained in the previous section based on Equation (10), are utilized as input load time histories. The general purpose SAP2000 FEM software (Version 19, CSI Computers & Structures, Inc., Berkeley, CA, USA) [21] is unutilized for the dynamic analysis. Load effects for each member, which are connected to the considered joint, are plotted as time-history functions as outputs of the analysis. Hot spot stress concentration factors for each member connected to the considered joint were calculated by following the recommended formulas in the DNV standard [1]. Hence, the stress histories were calculated for hot spot histories at 8 spots around the circumference of each member of the considered joint.

4.4. Fatigue Life Assessment

The fatigue assessment for the considered corroded tubular joint located in the splash zone (i.e., joint located in the proximity of the splash of the case study jacket), was performed by a deterministic stress-life approach. The conventional Miner’s rule is used to calculate cumulative damage and remaining lives [22]. The classification of the design fatigue factor (DFF) is dependent on the significance, accessibility, and inspection feasibility. A DFF of 3 was applied in this case study by following the recommended design guidelines [1,17]. The proposed formulas of the fatigue curve in the seawater-free corrosion (i.e., Equations (5) and (9)) were used to determine the fatigue endurance Ni for each stress block. Fatigue assessment was based on the deterministic approach due to the linear relation between wave loads and the structural responses.
The fatigue damage for considered joints was determined using both DNV code given free corrosion curve and proposed formulas in Equations (5) and (9). The estimated fatigue lives are shown in Table 3 for both approaches. The difference between the fatigue lives which are calculated based on short-term wave scatter is significant and over predicts about 3 times. This difference is low when the fatigue lives are calculated based on long-term scatter which considered all the sea states, which is more realistic. The main reason for this difference is that the fatigue lives calculated by the proposed curve is lower than the lives calculated based on the conventional curve for large wave heights and this is the opposite for smaller wave heights. The reduction of fatigue lives clearly shows the importance of the application of the proposed formula for the safe life assessment of corroded tubular joints in seawater. As the proposed curve represents the real CF mechanism and it is quite conservative, it is advisable to reduce the safety factors given in the fatigue design standard for tubular joints in the splash zone area.

5. Conclusions

The proposed formula of fatigue strength curve provides a conservative prediction to fatigue endurance of tubular joints tested in the seawater. Even though the predicted endurance by the proposed formula is lower than the experimental fatigue lives, the slope is quite matching with the mean curve of the experimental fatigue lives of corroded tubular joints in seawater. This is due to the fact that the proposed formula follows the real CF mechanism. The reason for lower predicted endurance is that the DNV code-provided design curve in air is used as the intact fatigue endurance for obtaining the proposed fatigue strength curve in seawater-free corrosion. Calculated fatigue lives of the considered tubular joint in the splash zone show significant reduction when the proposed curve is considered. These reductions highlight the importance of having a fatigue strength curve which represents the real mechanism of CF and the corrosive environment. The proposed curve can be directly applied to any tubular joint in seawater without having additional CF tests and this is an advantage. Further verification and the modification of the proposed curve are currently in process. Application of the curve for more cases to confirm the significance and the applicability are recommended for future studies.

Author Contributions

Conceptualization, S.C.S., N.D.A. and D.P.; methodology, S.C.S., N.D.A. and D.P.; software, S.C.S.; validation, S.C.S., N.D.A. and D.P.; formal analysis, S.C.S., N.D.A. and Pavlou, D.; investigation, S.C.S. and D.P.; resources, D.P.; data curation, S.C.S., N.D.A. and D.P.; writing—original draft preparation, S.C.S., N.D.A. and D.P.; writing—review and editing, S.C.S. and D.P.; visualization, S.C.S., N.D.A. and D.P.; supervision, D.P.; project administration, D.P.; All authors have read and agreed to the published version of the manuscript.

Funding

This research received no external funding.

Institutional Review Board Statement

Not applicable.

Informed Consent Statement

Not applicable.

Conflicts of Interest

The authors declare no conflict of interest.

References

  1. DNV Recommended Practices. DNVGL-RP-0005: Fatigue Design of Offshore Steel Structures; Det Norske Veritas: Bellum, Norway, 2016. [Google Scholar]
  2. HSE. HSE. HSE OTH 92 390. In Background to New Fatigue Guidance for Steel Joints and Connections in Offshore Structures, Offshore Technology Report; Health Safety Executives: London, UK, 1999. [Google Scholar]
  3. Brandi, R. Behavior of unstiffened tubular joints. In Proceedings of the Steel in Marine Structures Conference, Paris, France, 5–8 October 1981. [Google Scholar]
  4. Iwasaki, T.; Wylde, J.G. Corrosion fatigue test on welded tubular joints. Trans. ASME 1985, 107, 68–73. [Google Scholar] [CrossRef]
  5. Gangloff, R.P. Environmental cracking—corrosion fatigue. In Corrosion Tests and Standards Manual; Baboian, R., Dean, S.W., Jr., Hack, H.P., Hibner, E.L., Scully, J.R., Eds.; ASTM Internationals: West Conshohocken, PA, USA, 2005. [Google Scholar]
  6. Revie, R.W.; Uhlig, H.H. Corrosion and Corrosion Control, an Introduction to Corrosion Science and Engineering, 4th ed.; Wiley and Sons: Hoboken, NJ, USA, 2008. [Google Scholar]
  7. Glaser, W.; Wright, L.G. Mechanically Assisted Degradation. ASM Handbooks; ASM Internationals: West Conshohocken, PA, USA, 1992; pp. 137–144. [Google Scholar]
  8. Pavlou, D. The theory of the S-N fatigue damage envelope: Generalization of linear, double-linear, and non-linear fatigue damage models. Int. J. Fatigue 2018, 110, 204–214. [Google Scholar] [CrossRef]
  9. El Aghoury, I. Numerical Tool for Fatigue Life Prediction of Corroded Steel Riveted Connections Using Various Damage Models. Ph.D. Thesis, Concordia University, Montreal, QC, Canada, 2012. [Google Scholar]
  10. Adasooriya, N.D.; Pavlou, D.; Hemmingsen, T. Fatigue strength degradation of corroded structural details: A formula for S-N curve. Fat. Fract. Eng. Mater. Struct. 2020, 43, 721–733. [Google Scholar] [CrossRef] [Green Version]
  11. Adasooriya, N.D.; Hemmingsen, T.; Pavlou, D. Fatigue strength degradation of metals in corrosive environments. In Proceedings of First Conference of Computational Methods in Offshore Technology-COTech 2017; IOP Conference Series: Materials Science and Engineering; IOP Publishing: Stavanger, Norway, 2017. [Google Scholar]
  12. Sigurdsson, G. Probablistic Fatigue Analysis of Jacket Type Offshore Structures. Reliab. Optim. Struct. Syst. 88 1989, 48, 91–309. [Google Scholar]
  13. Redion, K.; Siriwardane, S.C.; Gudmestad, O.T. Fatigue life estimation of an offshore steel jacket considering the loading sequence effect. In Proceedings of the ASME 2014 Conferences, 33rd International Conference on Ocean, Offshore and Arctic Engineering, San Francisco, CA, USA, 8–13 June 2014. [Google Scholar]
  14. Dong, W.; Moan, T.; Gao, Z. Fatigue reliability analysis of the jacket support structure for offshore wind turbine considering the effect of corrosion and inspection. Reliab. Eng. Syst. Saf. 2012, 106, 11–27. [Google Scholar] [CrossRef]
  15. Journee, J.M.J.; Massie, M.W. Offshore Hydromechanics, 1st ed.; Delf University of Technology: Delft, The Netherlands, 2001. [Google Scholar]
  16. DNV Recommended Practices. DNV-RP-C205: Environmental Conditions and Environmental Loads; Det Norske Veritas: Oslo, Norway, 2010. [Google Scholar]
  17. NORSOK. NORSOK. NORSOK N-003. In Action and Action Effects; NORSOK: Lysaker, Norway, 2017. [Google Scholar]
  18. Larsen, C.M. Notes for Special Topics: Dynamic Analysis of Marine Structures; Norwegian University of Science and Technology: Trondheim, Norway, 2005. [Google Scholar]
  19. Gudmestad, O.T.; Connor, J.J. Linearization Methods and the Influence of Current on the Nonlinear Hydrodynamic Force. Appl. Ocean. Res. 1983, 5, 184–194. [Google Scholar] [CrossRef]
  20. Weldeslassie, M.W. Investigation of the Which Seas State Yield the Dominating Contribution to Fatigue Accumulation in Offshore Structures. Master’s Thesis, NTNU, Trondhiem, Norway, 2014. [Google Scholar]
  21. SAP 2000, Analysis Reference Manual, Version 19; CSI Computers and Structures. Available online: https://wiki.csiamerica.com/display/doc/CSI+Analysis+Reference+Manual (accessed on 21 August 2021).
  22. Miner, M.A. Cumulative damage in fatigue. J. Appl. Mech. 1945, 12, 159–164. [Google Scholar] [CrossRef]
Figure 1. Schematic representation of the S-N curve of tubular joints exposed to free corrosion in seawater.
Dynamics 01 00007 g001
Figure 2. Comparison of the proposed fatigue curve with the fatigue test of corroded tubular joints in seawater [1,2].
Dynamics 01 00007 g002
Figure 3. (a) Finite element model of the case study jacket structure and considered critical joint (c). Hydrodynamic loads when the significant wave height is 3.5 m and peak period is 9 s and wave approach angle zero (b). Stress envelope of the members when the significant wave height is 3.5 m and peak period is 9 s.
Dynamics 01 00007 g003
Table 1. Parameters used in the proposed S-N curve of tubular joints in the splash zone.
ParameterDesign T-Curve
m13
log a 1   o r   log a ¯ 1   12.164
m15
log a 1   o r   log a ¯ 1   15.606
NLCF104
NCAFL107
Corrosion parametersMean valueConservative value
ΔσD,cor(MPa)24.2214.21
c0.11240.1895
ć−0.3113−0.3883
Table 2. Cross-sectional details of the jacket members [12,13].
MembersDiameter [m]Thickness [mm]
Deck legs2.050.0
Jacket legs1.216.0
Braces in the vertical plane1.216.0
Braces in the horizontal plane El: +5 m0.88.0
Braces in the horizontal plane El: −10 m 1.214.0
Braces in the horizontal plane El: −30 m1.214.0
Braces in the horizontal plane El: −30 m (diagonal)1.216.0
Braces in the horizontal plane El: −50 m1.214.0
Table 3. Remaining fatigue lives in years of the considered joint.
Fatigue Strength CurveFrom Dominant 8 Sea States From Long-Term Wave Scatter
Design T-curve-free corrosion [1]
Proposed curve Equations (5) and (9)
89
22
97
46
Publisher’s Note: MDPI stays neutral with regard to jurisdictional claims in published maps and institutional affiliations.

