Article

Macrophage-Induced Exacerbation of Nasopharyngeal Inflammatory Lymphocytes in COVID-19 Disease

Ayass Bioscience LLC, 8501 Wade Blvd, Building 9, Frisco, TX 75034, USA
*
Author to whom correspondence should be addressed.
COVID 2023, 3(4), 567-591; https://doi.org/10.3390/covid3040041
Submission received: 8 March 2023 / Revised: 7 April 2023 / Accepted: 11 April 2023 / Published: 13 April 2023
(This article belongs to the Special Issue Immune Responses in Coronavirus Disease)

Abstract

:
The nasal microenvironment plays a crucial role in the transmission, modulation, and clinical progression of COVID-19; however, the immune responses at the site of viral entry remain poorly understood. We deciphered the link between nasopharyngeal (NP) immune and inflammatory response that triggers cytokine/chemokine storms in the nasal route of COVID-19-positive patients. We used RT-PCR, multiplex ELISA, flow cytometry, and LC-MS/MS to decipher nasopharyngeal immune perturbations associated with severe COVID-19. In addition, we performed in vitro assays using cultured human monocytes-derived macrophages trained both in the presence and absence of SARS-CoV-2 trimeric spike protein(s) and co-cultured with and without autologous human peripheral blood mononuclear cells (hPBMCs)/total T-cells/CD8 T-cells. In vitro immune perturbations were examined by flow cytometry and LC-MS/MS assays. Our findings confirm that macrophages orchestrate NP immune inflammatory responses and highlight the cytokine/chemokine storms associated with the increased CD8 + T-cells along with Tregs, Th1, and Th17.1 T-helper cells. We observed a correlation between in vitro and nasal findings that trained macrophages, profoundly M2c, differentially promote the inflammatory surfactome on CD8 T-cells, including ITGAM, LGALS3, CD38, TKT, LRPAP1, and SSBP1. The findings of this study conclude that inflammatory lymphocyte perturbations within the nasopharynx of COVID-19 patients may enforce immune homeostasis during SARS-CoV-2-infection and contribute to COVID-19 pathology. This study explored the therapeutic target proteins that could facilitate the development of new medications, which could allow for immediate treatment of possible emerging viral infections.

1. Introduction

Coronavirus disease 2019 (COVID-19) is caused by severe acute respiratory syndrome coronavirus 2 (SARS-CoV-2). The clinical presentation ranges from asymptomatic to severe symptoms and even death [1]. Although COVID-19 vaccines and a few therapies have been approved and shown benefits, the mechanisms of SARS-CoV-2 pathogenesis are not fully understood. The emergence of new variants that escape vaccine-induced immunity in addition to post-COVID conditions/long COVID among survivors is the reason why SARS-CoV-2 continues to thread the efforts of public health [2,3]. Thus, continued research efforts are important to understand the underlying mechanism of SARS-CoV-2–host interaction and identify how new variants escape from either innate or adaptive immune responses.
The innate immune system is the first line of the body’s defences for fighting viruses, bacteria, parasites and toxins, or trauma. Antiviral innate immune responses can be triggered via pattern recognition receptors (PRRs). Activated PRRs detect the presence of viruses through the myeloid/lymphoid cells such as plasmacytoid dendritic cells (pDCs) and alveolar macrophages [4]. Upon engagement of PRRs, such as Toll-like receptors and retinoic acid-inducible gene I (RIG-1)-like receptors (RLRs), RNA viral infections activate the interferons (IFN) regulatory factor 3 (IRF3)/IRF7-dependent transcription of type-I and type-III IFNs as well as nuclear factor kB (NF-kB)-dependent pro-inflammatory cytokines/chemokines [5,6,7]. The SARS-CoV-2 has evolved multiple strategies to avoid host recognition by impeding the function of antiviral proteins using various viral proteins, such as Nsp1-8, Nsp13-16, ORF3-4, ORF6, ORF7, and ORF9 [8,9]. This results in triggering an antiviral signalling cascade to elicit the production of type-I or type-III IFN as well as pro-inflammatory cytokine/chemokine storms which further limit the number of immune sentinel cells in blood and lungs and impairs their antiviral function [10,11].
COVID-19 also impairs adaptive immunity, including humoral and T-cell-mediated responses [12,13,14]. Immunosuppressed patients and those undergoing dialysis have been shown to have an antibody response that further contributes to the chronic persistence of the virus favouring the selection of variants [3]. Furthermore, severe COVID-19 causes profound T-cell lymphopenia that affects the host’s ability to mount a robust immune response [15].
Although much research has been conducted on the systematic human immunogenic response to SARS-CoV-2, the nasopharyngeal (NP) mucosal immune system has been neglected and poorly understood. There are two major types of nasal mucosal defence responses to SARS-CoV-2: the physicochemical barrier and the immunological barrier [16]. The physicochemical barrier is composed of airway mucus, a layer formed by tightly bound ciliated, goblet, and basal epithelial cells, and the basement membrane [17]. Mucins are the most represented glycoproteins in the airway mucus and many cytokines (IL-1, IL-4, IL-6, IL-9, IL-13, and IFNs) have been shown to up-regulate the expression of mucin genes due to infection with the influenza virus. Thus, mucins might limit viral entry and inflammatory damage [18]. Furthermore, mucins contribute to innate immunity through an interaction with other components, such as IgA [19]. The nasal immunological barrier is made of a network of cells of the innate (resident microfold (M) cells, macrophages (M ϕ ), and innate lymphoid cells) and adaptive immune (dendritic cells (DCs), B-, and T-lymphocytes) systems [20].
Once SARS-CoV-2 enters the human body mainly through the ACE2 + TMPRSS2 + nasal epithelial cells, the initial host response to this pathogen occurs in the nasopharynx-associated lymphoid tissue (NALT) system. Notably, the nose and NALT represent the main components of mucosal immunity in the upper airways (UA) and play a central role in the induction of mucosal innate and acquired immunity including the generation of Th1- and Th2-polarized lymphocytes, B-cells, DCs, M-cells, and M ϕ [16,21]. Given that COVID-19 is an upper respiratory disease, understanding the initial host–viral interaction in the nasal and NALT microenvironments is key to understanding and modulating the systemic inflammatory response. Biomarker identification in the NP microenvironment has been reported to be associated with viral clearance, vaccine implementation, potential drug target, and monitoring of infection-induced immunity [22]. Hence, the nasal microenvironment plays a crucial role in the transmission, modulation, and clinical progression of COVID-19.
In this study, we analysed the NP inflammatory immune profile of COVID-19 positive patients and its link to “monocytic”-derived cells in disease progression and modulation.

2. Materials and Methods

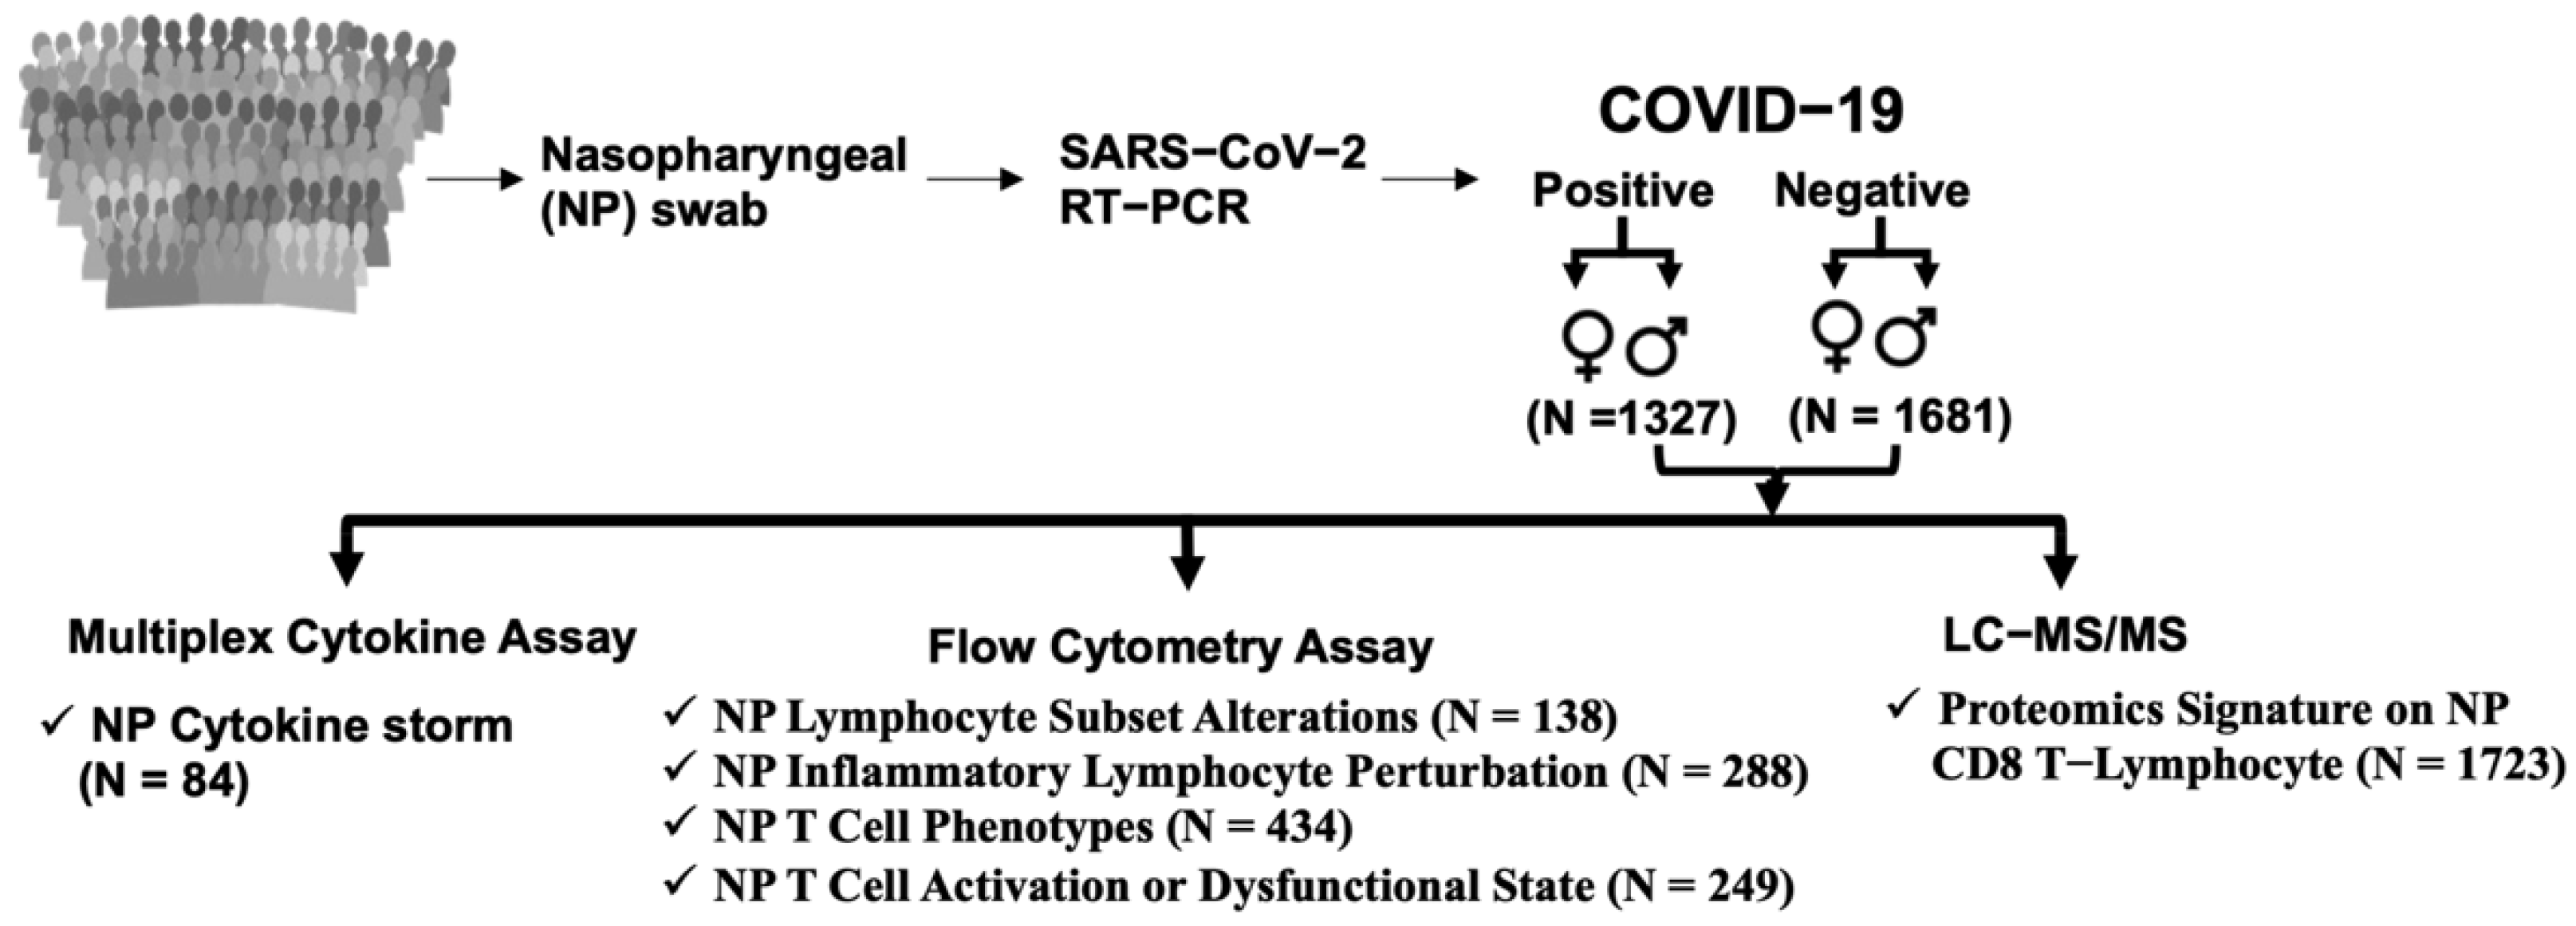
2.1. Subject Details

This research was reviewed and approved by Salus IRB Review Board (protocol number #ABS001_01_01_2022). The research involved no more than minimal risk and the data used for the research was de-identified. The full waiver of informed consent was approved by Salus IRB. The aim of the study was to decipher the nasopharyngeal (NP) immune profiling of COVID-19 and explore the possible immune perturbation in COVID-19 modulation and progression by re-using the samples of SARS-CoV-2-positive and -negative patients collected for RT-PCR test [23]. All patient samples were collected from Ayass Laboratory in Frisco, Texas, and all patients consented to allow their samples to be collected for research purposes. All NP swabs were utilized by a medical practitioner practicing proper infection control. A sterile cotton swab was used to collect the NP specimen and stored in a 15 mL falcon tube containing 2 mL viral transport media (VTM) (Hank’s balanced salt solution (HBSS), 2% fetal bovine serum, 100 µg/mL of gentamicin, and 0.5 µg/mL of amphotericin B) at room temperature. Samples were first tested by RT-PCR and classified according to CT values. Patients were eligible for inclusion in the COVID-19-positive group if they were diagnosed positive and in the COVID-19-negative group if they were diagnosed negative by the SARS-CoV-2 RT-PCR test. Patients were excluded if they were younger than 18 years old (Supplementary Tables S1–S10).

2.2. Characteristics of Patients

The patients had symptoms ranging from mild to severe, such as fever/chest pain/shortness of breath/cough/body pain/loss of smell and taste/headache/fatigue, etc. Patient samples were pre-characterized with RT-PCR as COVID-19 positive or negative. Pre-characterized NP samples were used to decipher the inflammatory lymphocyte perturbations associated with COVID-19 by FLEXMAP-3D multiplexing platform, flow cytometry, and LC-MS/MS analysis as shown in a schematic diagram (Figure 1).

2.3. SARS-CoV-2 RT-PCR Assay

Total viral nucleic acid was extracted from 0.2 mL of viral transport media containing the patient’s nasal swab sample. Automated extraction was performed on the Biomek I5 system with the RNAdvance Viral Kit according to the standard protocol provided by Beckman Coulter. The purified nucleic acids were reverse transcribed and amplified using the TaqPath 1-Step RT-PCR MM, CG reagent (ThermoFisher Scientific, cat. #15299) and StepOnePlus Real-Time PCR System from Applied Biosystems. For detection of the viral gene-nucleocapsid protein gene (N gene) and host gene-human RNase P, we used the CDC RUO-approved primer and probe set (from Integrated DNA Technologies, cat.# 10006713): N1 and N2 sets for the viral N gene and RP set for the human RNase P gene. The cycle threshold (Ct) value (Ct is the number of RT-PCR cycles at which the nucleic acid target sequence becomes detectable) was used to discriminate COVID-19-positive or -negative patient samples. In our experiments we only used strictly positive samples; specifically, if Ct values for two N-gene targets were less than 35, then the sample was considered positive. If Ct values for the N1 and N2 targets were more than 40, then the sample was considered negative. Ct at 40 cycles was recommended by CDC (document# CDC-006-00019, Revision: 07 CDC/DDID/NCIRD/ Division of Viral Diseases Effective: 07/21/2021) as positive–negative boundary for the primer–probe sets and instrument we used.

2.4. Sample Collection and Processing

COVID-19-positive and -negative patient NP swabs were collected after diagnosis by RT-PCR and included in this study. Nasal cells and cell supernatants were isolated from NP swabs as described previously [24]. NP swabs were vigorously vortexed to dissociate the cells and mucus and centrifuged for 10 min at 300× g. NP swabs’ supernatants were collected separately and stored at −80 C and later used for cytokines/chemokines by the multiplex cytokine assay. Cell pellets from NP swabs were then rinsed with PBS (with 2 MM EDTA + 2% FBS), and the cell suspension was filtered through a 100 µm nylon cell strainer (Becton Dickinson, Franklin Lakes, NJ, USA) fitted into a 50 mL tube. Cells were washed twice prior to use for flow cytometry or surfactome analysis by LC-MS/MS mass spectrometry.

2.5. Multiplex Cytokine Assay

Cytokine estimation for COVID-19-positive (N = 44) and COVID-19-negative (N = 40) patients was performed using a Human XL Cytokine 44-plex Fixed Panel kit (R&D Systems) on a multiplex cytokine ELISA [25]. On the day of the assay, NP swab supernatant samples were centrifuged again at 300× g for 10 min prior to use. A two-fold dilution with a calibrator was used for all samples. All samples were measured in the same experiment. The assay was run according to manufacturer’s instructions. The panel included CD40 ligand, EGF, Eotaxin, FGF basic, Flt-3 ligand, G-CSF, GM-CSF, granzyme B, GRO α , GRO β , IFN- α , IFN- β , IFN- γ , IL-1 α , IL-1 β , IL-1r α , IL-2, IL-3, IL-4, IL-5, IL-6, IL-7, IL-8, IL-10, IL-12p70, IL-13, IL-15, IL-17A, IL-17E, IL-33, IP-10, MCP-1, MIP-1 α , MIP-1 β , MIP-3 α , MIP-3 β , PDGF-AA, PDGF-AB/BB, PD-L1/B7-H1, RANTES, TGF- α , TNF- α , TRAIL, and VEGF. Multiplex cytokine assay plates were measured using a FLEXMAP 3D instrument with xPONENT 4.2 (Luminex Corp, Austin, TX, USA). Data acquisition and analysis was performed using xPONENT® software. The standard curve for each analyte has a R 2 value > 0.95. The protein content in NP swabs was quantified using the BCA protein assay, and units were reported as pg/mL normalized against mg/mL total protein (pg/mg).

2.6. Flow Cytometric Staining of Nasal Cells

Nasal cell isolation from nasopharyngeal (NP) swabs and flow cytometric staining of nasal cells were followed as previously described [26]. Briefly, with slight modification of the protocol, NP swabs of COVID-19-positive and COVID-19-negative patients in 1 mL VTM media were vigorously vortexed to dissociate the cells and mucus, and then filtered through a 100 µm nylon cell strainer followed by centrifugation at 300× g for 10 min. Cell pellets were resuspended and washed with cell staining buffer and centrifuged at 300× g for 5 min. The pellets were incubated with 0.5 µg of Fc receptor binding inhibitor antibody in 50 µL cell staining buffer (2 mM EDTA DPBS+2% FBS) at 4 C in dark conditions for 20 min before a second wash with cell staining buffer followed by centrifugation (300× g, 5 min) at room temperature (RT). Cells were stained with viability exclusion dye, together with a panel of surface antibodies (Supplementary Table S11) in cell staining buffer, and incubated at 4 C in dark conditions for 30 min. After incubation, cells were washed with cell staining buffer followed by centrifugation. Samples were fixed with 50 µL of FluroFix TM Buffer. For intracellular staining, after surface staining, 300 µL FluroFix was added and incubated at 4 C in dark conditions for 20 min. Cells were then permeabilized using 300 µL of 1× intracellular staining permeabilization wash buffer at 4 C in dark conditions for 20 min, and then washed with permeabilization wash buffer followed by centrifugation at 300× g for 5 min at RT. The cells were then stained with 50 µL of an intracellular staining (ICS) antibody (Supplementary Table S11) cocktail mix (prepared in permeabilization wash buffer) at 4 C in dark condition for 20 min. After incubation, the cells were washed in permeabilization wash buffer followed by centrifugation at 300× g for 5 min at RT. For transcription factor staining, the cells were stained with a surface staining (SS) antibody (Supplementary Table S11) cocktail mix, and then fixed and permeabilized with FOXP3/transcription factor in staining buffer set. After permeabilization, the cells were incubated with an intracellular staining (ICS) antibody (Supplementary Table S11) cocktail mix (prepared in permeabilized wash buffer) at 4 C in dark conditions for 20 min. The panels for staining are provided in Table S11. The stained cells were resuspended in cell staining buffer and acquired using the Navios TM EX Flow Cytometer (Beckman Coulter Inc., Pasadena, CA, USA) as previously described [27]. Flow cytometry data were analysed using FlowJo TM v10.8.1 (Becton Dickinson Life Sciences).

2.7. PBMCs Isolation and Differentiation into Macrophages

PBMCs were isolated from healthy donors’ buffy coats (N = 8) (Carter BloodCare) by density-gradient centrifugation using a Ficoll-Paque Plus (Cytiva Life Sciences). The primary human M ϕ were cultured as described [28,29]. Briefly, monocytes were obtained from PBMCs by the EasySep TM Human Monocyte Enrichment Kit and were cultured in complete RPMI-1640 (cRPMI) media. cRPMI media contains RPMI-1640 media supplemented with 10% fetal bovine serum (FBS), 100 U/mL penicillin–streptomycin, 1X MEM non-essential amino acids, 1 mM sodium pyruvate, and 25 mM HEPES. For culturing macrophages from the monocytes, 1 × 10 6 cells/mL in cRPMI-1640 media were supplemented with 20 ng/mL recombinant human M-CSF at 37 C with 5% CO 2 for six days followed with a media change at day 3, which subsequently differentiated the monocytes into macrophages (M0). On day 6, M0 macrophages were then cultured for 48 h in cRPMI-1640 media supplemented with 100 ng/mL lipopolysaccharides (LPS) and 100 ng/mL recombinant human IFN γ protein, 50 ng/mL recombinant human IL-4 protein, and 50 ng/mL of recombinant human IL-10, respectively, to differentiate the M0 macrophage into M1, M2a, and M2c macrophages. Macrophages were collected by gentle dissociation using the StemPro Accutase Cell Disassociation Reagent and washed with fresh RPMI-1640 media followed by centrifugation at 500× g for 5 min.

2.8. SARS-CoV-2 Spike (S) Protein Induces the Production of Cytokines from Human PBMCs

PBMCs from healthy donors (N = 8) in cRPMI media were stimulated in the presence or absence of trimer S proteins from wild-type strain, Delta-, and Omicron-variants of SARS-CoV-2, and haemagglutinin/HA antigen protein from H1N1 and H3N2 influenza A, 5nM, respectively, for 24 h as previously described [29]. Cell supernatant was collected by centrifugation at 200× g for 5 min and cytokine levels were assessed using the LEGENDplex Human Anti-Virus Response Panel according to the manufacturer’s protocol. Soluble analytes were acquired using Navious TM EX flow cytometry [27] and analysed with BioLegend’s LEGENDplex TM .

2.9. Role of Macrophages upon SARS-CoV-2 Infection

Macrophages (M ϕ ) M0, M1, M2a, and M2c were stimulated with 5nM trimer S proteins from wild-type strain, Delta-, Lambda-, Alpha-, and Delta plus-variants of SARS-CoV-2, and 5nM with haemagglutinin/HA antigen protein from H1N1 and H3N2 influenza A, respectively, for 24 h as a previously used stimulant for hPBMCs stimulation [29,30]. After incubation, the cells were studied for the expression of surface receptors using antibody markers against the cluster of differentiation (CD) CD11c, CD14, CD16, CD40, CD68, CD206, CD163, CD80, CD86, CD38, CD252 (OX40L), MARCO and PD-L1 (Supplementary Table S11). After staining, the cells were acquired using Navios TM EX Flow cytometry (Beckman Coulter Inc.). Flow cytometry data were analysed using FlowJo TM v10.8.1 (Becton Dickinson Life Sciences).

2.10. In Vitro Analysis of T-Cell Inflammatory Responses

Total T cells and CD8 T cells were enriched from healthy donors’ PBMCs using EasySep TM human T cell kit and EasySep TM human CD8 T-cell Enrichment kit, respectively, according to the manufacturer’s instructions. The M ϕ M0, M1, M2a, and M2c were stimulated with trimer S proteins of wild-type strain, Lambda-, Delta-, Delta plus-, and Mu-variant; H1N1 and H3N2 for 24 h [29,30]. M ϕ were then co-cultured with autologous PBMCs, enriched total T-cells, and CD8 T cells at the ratio of 4:1 (CD8 T cells: M ϕ ) at 37 C with 5% CO 2 for 3 days. T-cell cytokine expression was assessed by intracellular cytokine staining (Supplementary Table S11). The cells were acquired using Navios TM EX Flow Cytometer (Beckman Coulter Inc.) [27]. Flow cytometry data were analyzed using FlowJo TM v10.8.1 (Becton Dickinson Life Sciences).

2.11. The Proliferation of Lymphocyte Subsets in the Presence of Distinct Macrophages Co-Culture

Macrophages ( M ϕ ) M0, M1, M2a, and M2c were stimulated with trimer S proteins of Wild type, Lambda-, Delta-, Delta plus-, and Mu-variant; H1N1 and H3N2, respectively, for 24 h [29,30]. Next, PBMCs, enriched total T-cells, and enriched CD8 T-cells were stained with the CellTrace TM CFSE Cell Proliferation Kit as per the manufacturer’s protocol. Briefly, 1 × 10 6 cells/mL in PBS, were stained with 5 µM of CFSE for 20 min at 4 C in the dark. After staining, the cells were washed with DPBS containing 2 mM EDTA+2% FBS. Stimulated M ϕ were then co-cultured with CFSE-stained PBMCs, enriched total T-cells, and CD8 T-cells at the ratio of 4:1 (CD8 T-cells/macrophages) at 37 C in 5% CO 2 for three days. The proliferation of the lymphocyte subsets was determined by surface staining including a viability exclusion dye with the antibody panel CD3, CD20, CD56, CD4, and CD8. The cells were acquired using the Navios TM EX Flow Cytometer (Beckman Coulter Inc.) [27]. Flow cytometry data were analysed using FlowJo TM v10.8.1 (Becton Dickinson Life Sciences).

2.12. Identification of SARS-CoV-2-Induced Nasopharyngeal (NP) Surfactome in CD8 T-Cells from Patient NP Samples

Nasopharyngeal samples from SARS-CoV-2-positive (N = 705) and -negative (N = 1018) patients were collected and pooled separately (Supplementary Table S10). CD8 T-cells from the pooled positive and pooled negative patient samples were enriched using the EasySep TM human CD8 T-Cell Enrichment Kit (StemCell). CD8 T -cells (approximately 4 × 10 6 from each group) were processed for sample preparation for surfactome analysis by mass spectrometry.

2.13. Identification of a Surfactome in CD8 T-Cells in the Presence of SARS-CoV-2 Trimer S Protein-Induced Macrophage Subsets

Human monocyte-derived macrophages (M0, M1, M2a, and M2c) were cultured from fresh healthy donors’ PBMCs (N = 8) and stimulated in the presence or absence of SARS-CoV-2 trimer S protein from wild-type strain or H1N1 at 37 C for 24 h. CD8 T-cells were enriched from the autologous PBMCs using the EasySep TM human CD8 T-Cell Enrichment Kit (StemCell). CD8 T-cells were then co-cultured with macrophage subsets at a ratio of 4:1 (CD8 T cells/macrophages) for three days at 37 C with 5% CO 2 . After co-culturing, the CD8 T-cells were collected and washed with sterile DPBS. CD8 T-cells of approximately 4 × 10 6 from each macrophage subset co-culture were processed for sample preparation for surfactome analysis by mass spectrometry [31].

2.14. Sample Preparation for Surfactome Analysis by Mass Spectrometry

The surface proteins of the CD8 T-cells were isolated using the Pierce cell surface biotinylation and isolation kit and then processed with the EasyPep Mini MS sample prep kit as per the ThermoFisher Scientific kits (A44390 and A40006) manual for DDA MS analysis on a nanoelectrospray Q Exactive Mass Spectrometry. Samples were processed in duplicates and injected in duplicate as well (N = 4 in total).

2.15. LC-MS/MS Analysis and Data Processing

Surfactome analysis was performed as described previously [23]. Briefly, for each sample, 1.5 µL of reconstituted peptide mixture was separated on a Thermo Scientific UltiMate TM 3000 RSLCnano system using a Thermo Scientific PepMap TM RSLC C18 column (2 µM, 100 Å, 75 µM × 25 cm) at a flow rate of 300 nL/min. Peptides were separated using a linear gradient with 2–32% solvent A over 90 min and 32–95% solvent B for 15 min (solvent A: 0.1% FA in H 2 O, solvent B: 0.1% FA in ACN). A TOP 10 data-dependent acquisition method was conducted on a Thermo Scientific Q Exactive Mass Spectrometry with the following parameters: full scan: 70,000 resolution, 375–1500 m/z scan range, 3 × 10 6 automatic gain control target, 100 ms maximum injection times; MS2: 17 , 500 resolution, 1 × 10 5 automatic gain control target, 60 ms maximum injection times, 2.0 m/z isolation window, normalized collision energy of 27, minimum AGC target at 8 × 10 3 for an intensity threshold at 1.3 × 10 5 . Data were processed as described previously [23]. Raw MS files and protein identification files in this study have been uploaded to PRIDE (PXD039699).

2.16. Statistical Analysis

Significance was determined in Prism 9.4.0 (GraphPad Software) using a non-parametric (Mann–Whitney) test or unpaired Student’s t test for two-group comparisons. Data are expressed as mean ± SD. p values ≤ 0.05 were considered statistically significant. * denotes p ≤ 0.05, ** denotes p ≤ 0.01, *** denotes p ≤ 0.001. All data analyses of LC-MS/MS were performed using R statistical software (v4.2.1; R core Team 2022). Proteins between samples were classified as significantly changed if Log2 FC >1.3 and the p value < 0.05.

3. Results

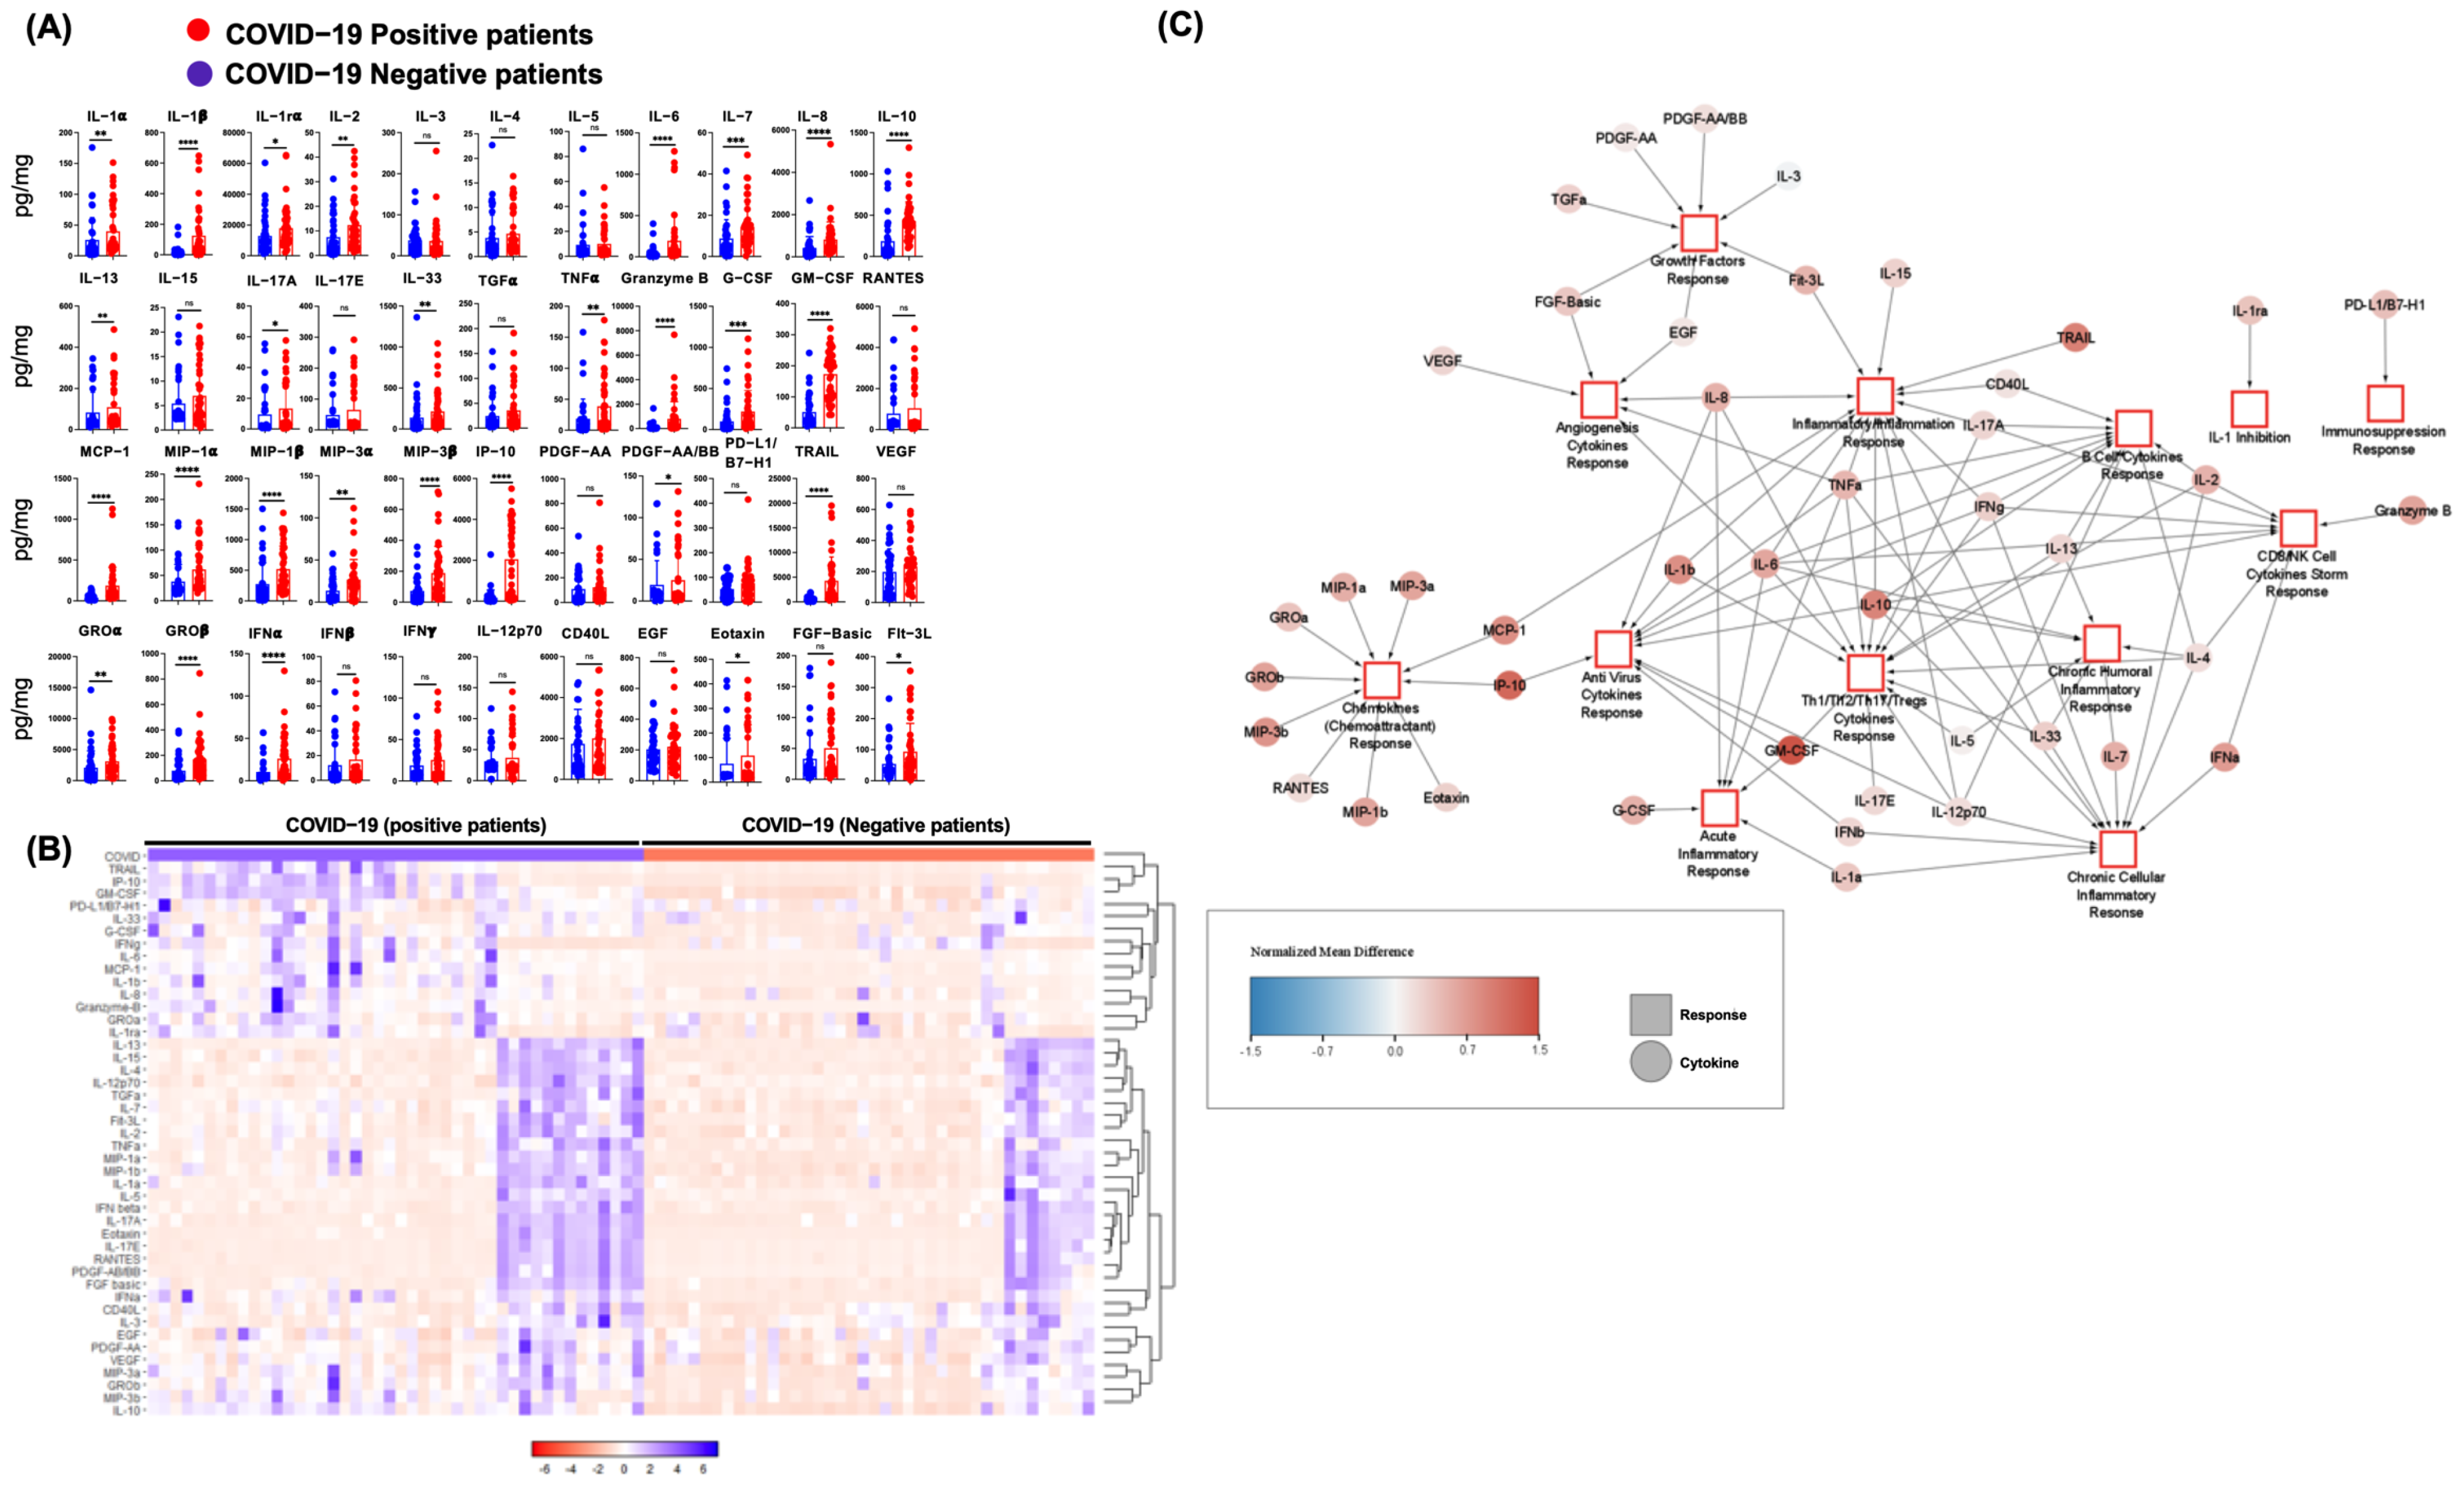
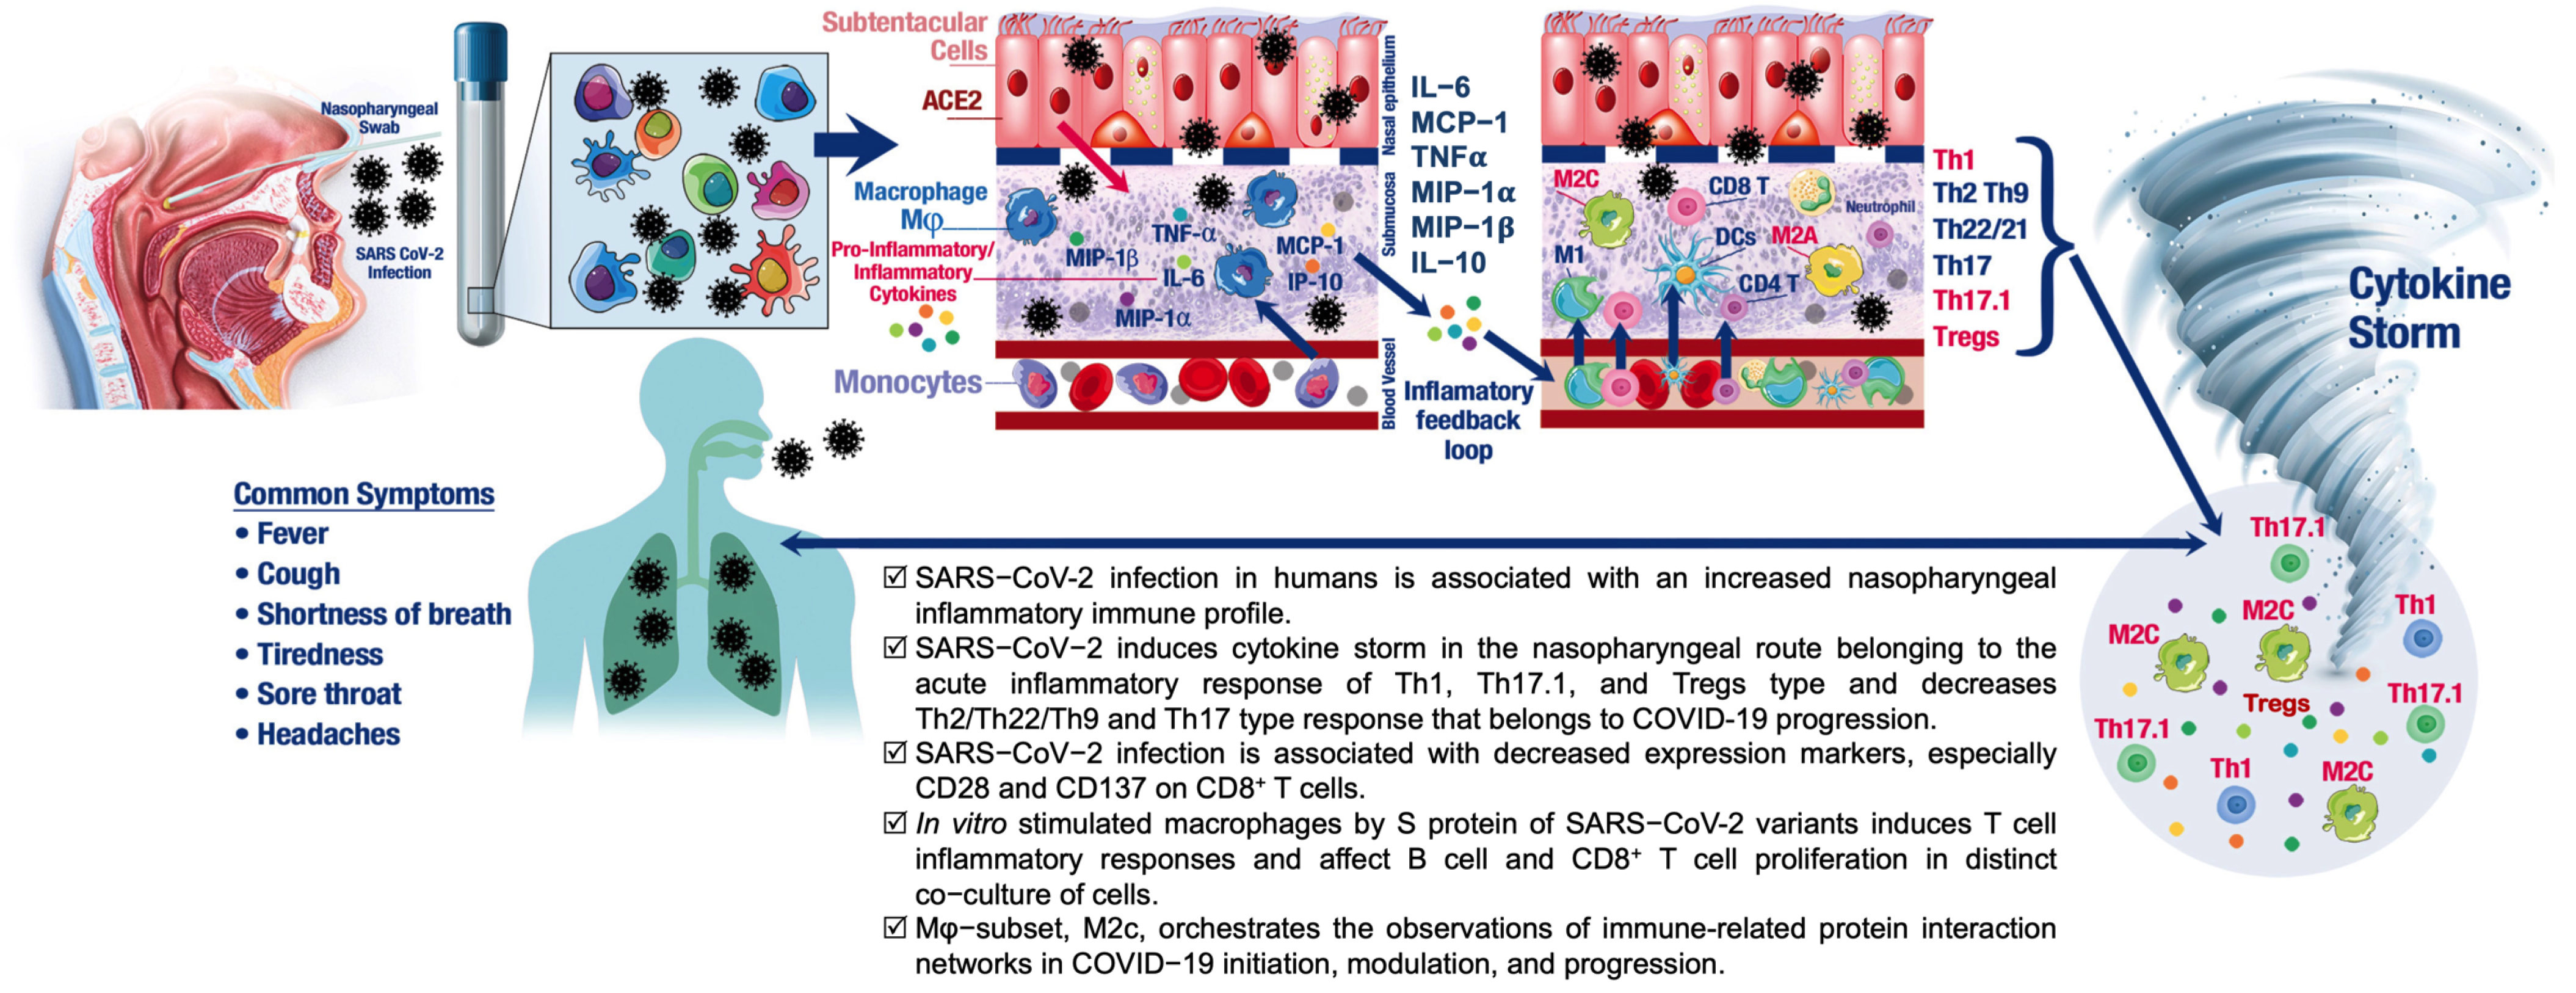
3.1. SARS-CoV-2 Infection in Humans Is Associated with an NP Cytokine Storm

To understand how the perturbations of cytokines in UA are widely associated with COVID-19, we analysed a panel of 44 cytokines in NP swabs (Figure 2 and Supplementary Table S1). A total of 28 cytokines (IL-1 α , IL-1 β , IL-1r α , IL-2, IL-6, IL-7, IL-8, IL-10, IL-13, IL-17A, IL-33, TNF α , Granzyme-B, G-CSF, GM-CSF, MCP-1, MIP-1 α , MIP-1 β , MIP-3 α , MIP-3 β , IP-10, PDGF-AA/BB, TRAIL, GRO α , GRO β , IFN α , Eotaxin, and Flt-3L) were significantly high in COVID-19-positive patients compared to COVID-19-negative patients (Figure 2A,B). In addition, by using the Cytoscape network [32], we found a correlated network response in the cytokines (Figure 2C, Supplementary Figure S1A–K) which demonstrates an uncontrolled generalized immune response in the nasopharynx. Several investigative groups studied the higher level of nasal cytokine production in adults during the “common cold” with an underlying viral infection such as rhinoviruses, Coxsackie, influenza, parainfluenza, respiratory syncytial virus (RSV), and adenovirus. These studies support IL-6, IL-33, and TNF α as predictive markers of nasal symptoms/signs for influenza A infection, and IL-6, IL-17A, IL-29, IFN γ and IP-10 for influenza B infection, but not for symptoms/signs during coronavirus (IL-1 β , IFN γ ), RSV (IL-8), and rhinovirus (IL-6 or IL-8) infections [33,34,35,36,37]. Thus, our study supports the findings of the cytokine storm is associated with the development of SARS-CoV-2 infection in the upper respiratory NP tract [38,39]. To seek underlying unobservable factors that may contribute to COVID-19 development, an exploratory factor analysis was conducted on the whole panel of 44 cytokines. As a result, a five-factor model was identified (eigenvalue > 1) (Supplementary Figure S2). The figure depicts how each cytokine contributes to each factor and identifies significant factor-cytokine loading pairs. For example, factor 1 had greater loading for MIP-1 β , FGF basic, MIP-1 α , RANTES, eotaxin, IFN β , IL-13, IL-1r α , TGF α , IL-5, IL-12p70, IL-17A, IL-17E, PDGF-AB/BB, IL-1 α , IL-15, and IL-4. Factor 2 had greater loading for IL-6, IL-10, IP-10, IL-1 β , G-CSF, TRAIL, MCP-1, MIP-3 β , GM-CSF, and granzyme B (loading value > 0.5).
Next, we investigated if gender differences affect the cytokine storm in NP samples (Supplementary Table S1 and Figure S3). Our data show that COVID-19-positive male patients had an elevated fold-change of PD-L1, MIP-3 β , MCP-1, MIP-3 α , GRO α , IP-10, IL-8, G-CSF, GM-CSF, granzyme B, IFN α , IFN γ , IL-10, IL-1 β , IL-6, and TRAIL. Our findings agree with Qi et al. [40] who showed that males with severe disease had significantly higher levels of pro-inflammatory cytokines (IL-6, IL-8, and MCP-1) than females. Thus, our findings are consistent with other studies [41,42] showing that males are more susceptible to develop severe symptoms than females upon SARS-CoV-2 infection.

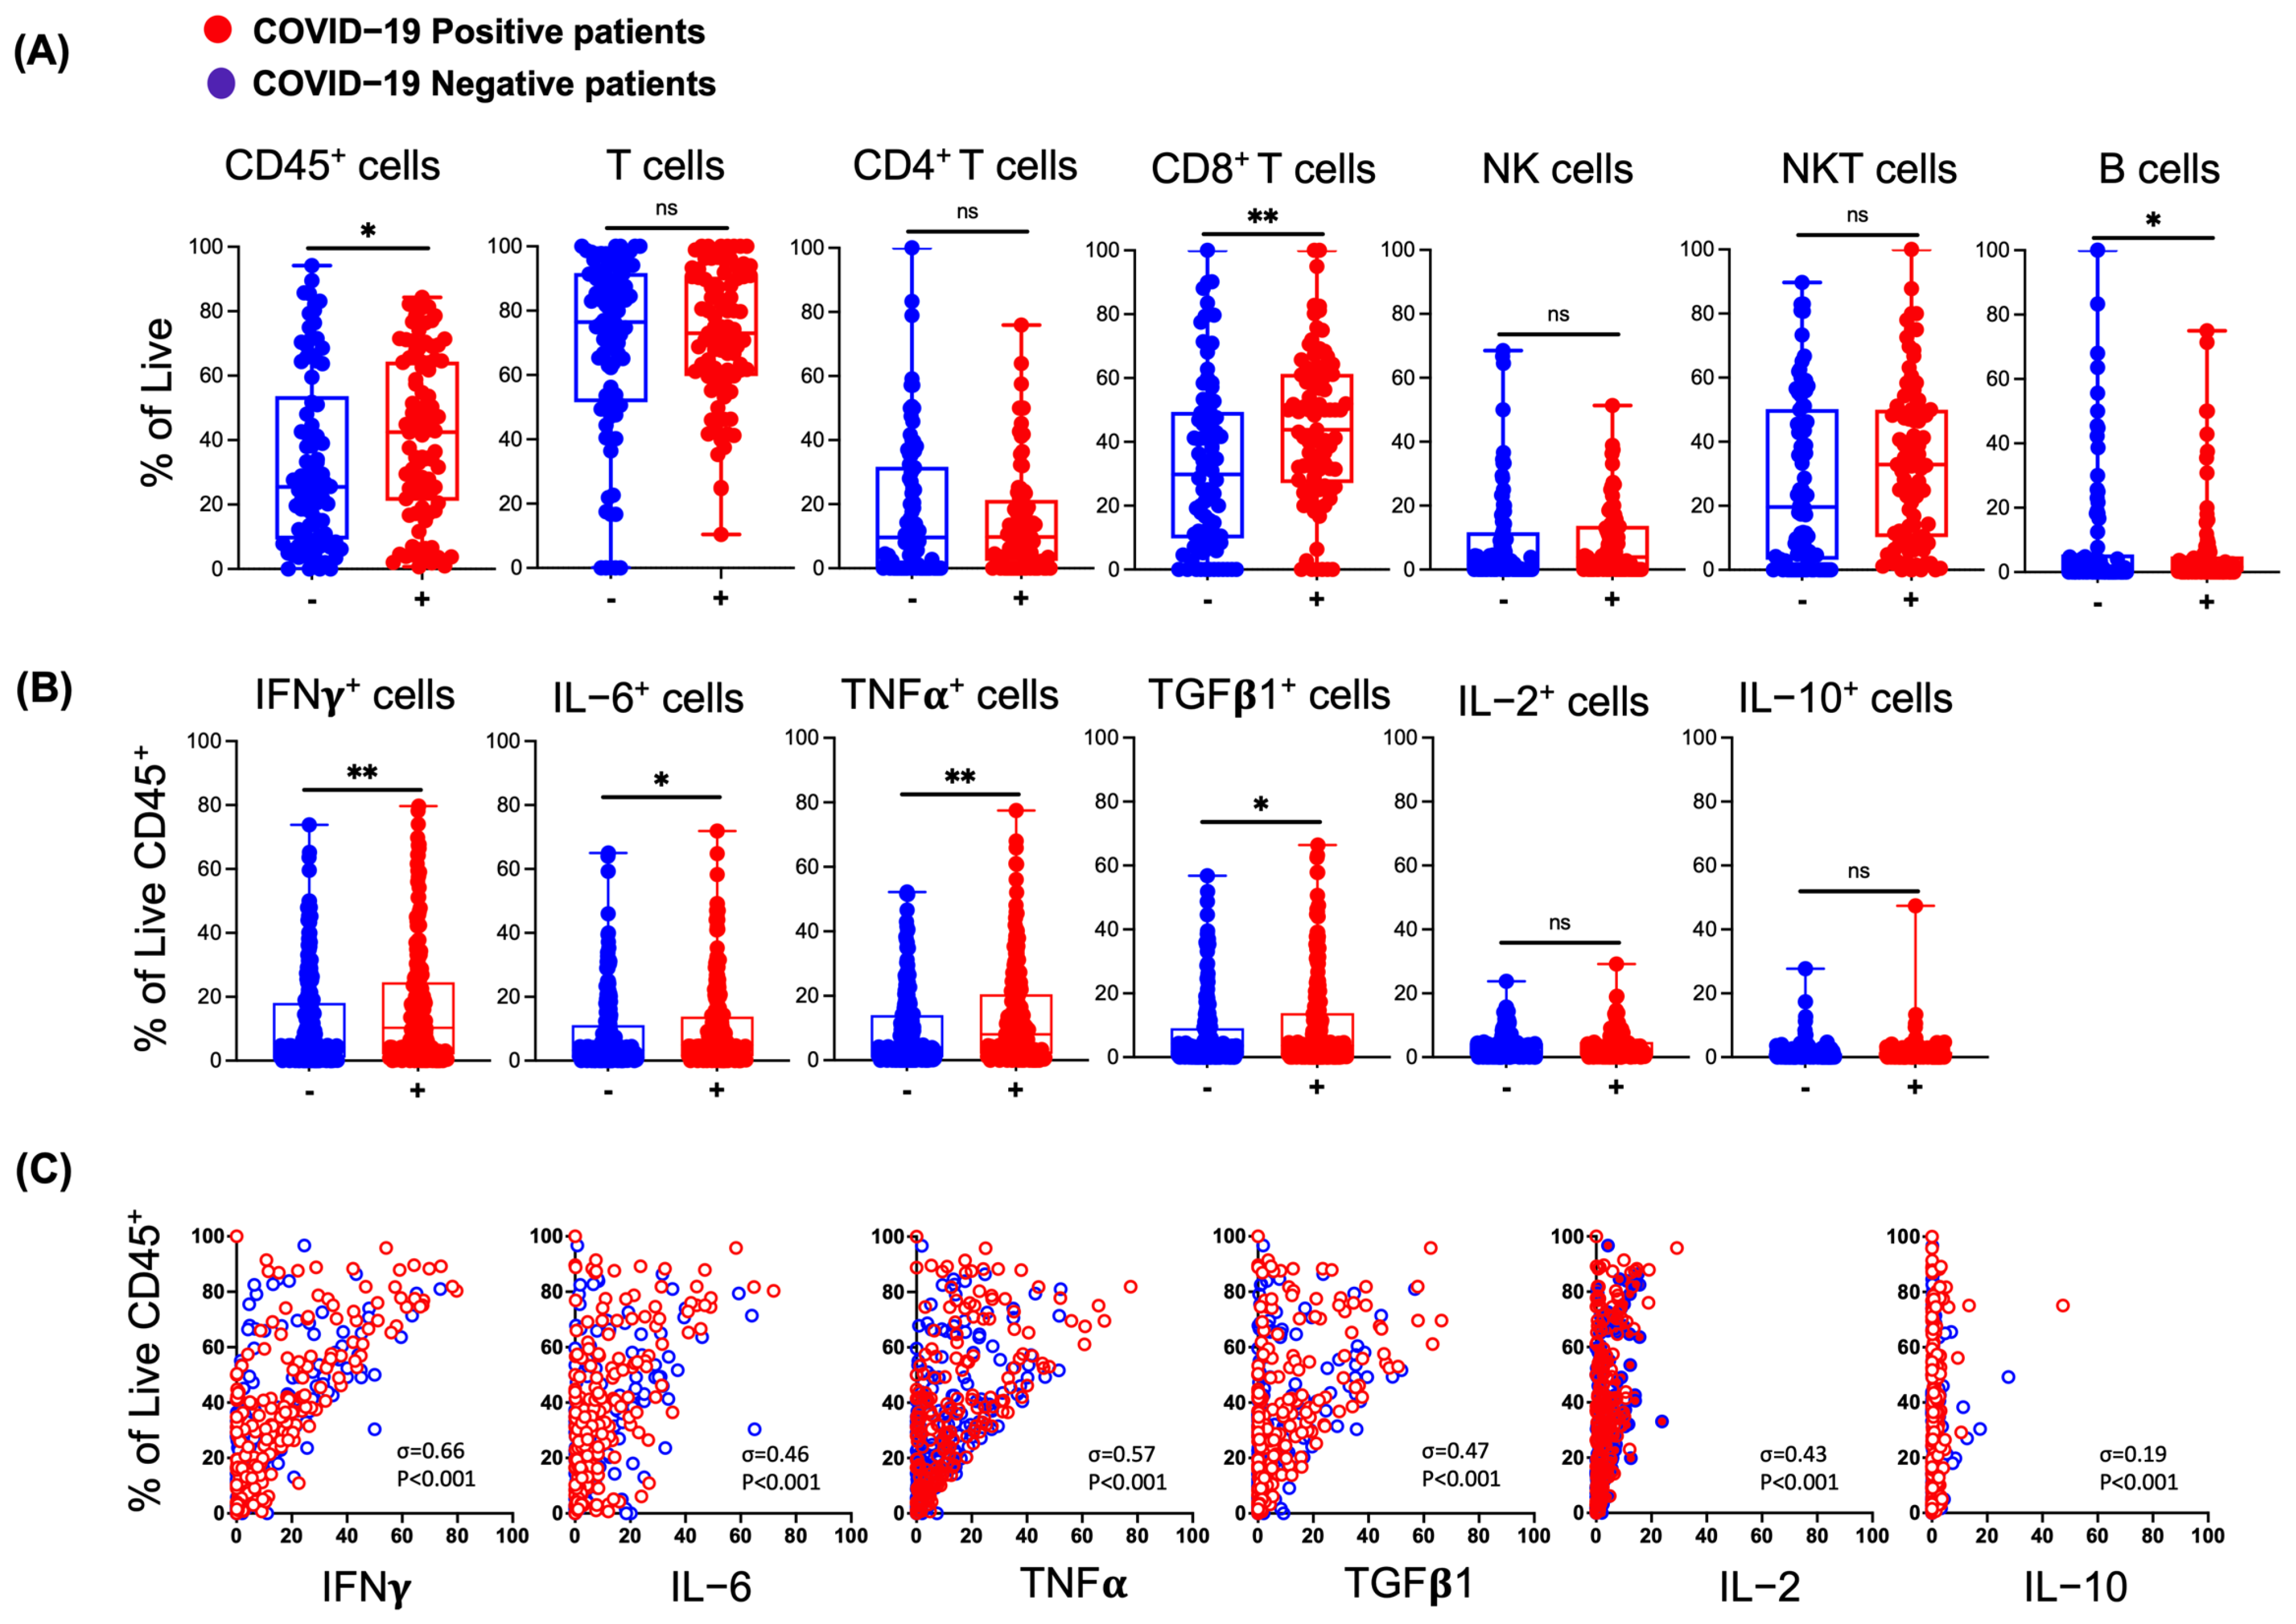
3.2. Effects of SARS-CoV-2 Infection on Lymphocytes in the Nasal Mucosa

Next, we evaluated lymphocyte populations in nasal swabs of COVID-19-positive and -negative patients (Supplementary Tables S2 and S3 and Figure S4). We observed that nasal CD45 + immune cells were significantly elevated in nasal swabs of COVID-19-positive patients compared to negative patients. Upon further gating of nasal CD45 + cell lineages, CD3 + (T-cells), CD3 + CD4 + CD8 (CD4 + T-cells), CD3 + CD4 CD8 + (CD8 + T-cells), CD3 + CD56 + (NKT cells), CD3 CD56 + (NK cells), and CD3 CD20 + (B-cells) immune cells, we noticed that only CD8 + T-cells were significantly augmented compared to B-cells, NK, and NKT cells, which did not show a significant increase in positive patients. We did not observe a significant increase in CD4 + T-cells in negative patients, and B-cell frequency was not significantly noticeable in both groups (Figure 3A and Supplementary Table S2).
To assess whether the nasal immune cells are correlated with their inflammatory properties during COVID-19, the release of intracellular cytokines by CD45 + immune cells was studied. Frequencies of CD45 + IFN γ + , CD45 + IL-6 + , CD45 + TNF α + , and CD45 + TGF β 1 + cells were significantly high in COVID-19-positive patients, whereas that of CD45 + IL-2 + and CD45 + IL-10 + were not statistically different between COVID-19-positive and -negative patients (Figure 3B and Supplementary Table S3). Spearman correlation analysis between the frequency of NP CD45 + immune cells and intracellular cytokines showed a significant correlation with COVID-19-positive patients (Figure 3C and Supplementary Table S3), supporting that nasal CD45 + cytokines + cell frequencies are associated with SARS-CoV-2 infection. Thus, our findings in NP swabs agree with previous reports belonging to nasopharynx and blood observations, and suggest that nasal lymphocytes + cytokine + (IL-10, IL-6, TNF α , TGF β 1, and IL-2) may play important roles in the development of Th imbalance [43].

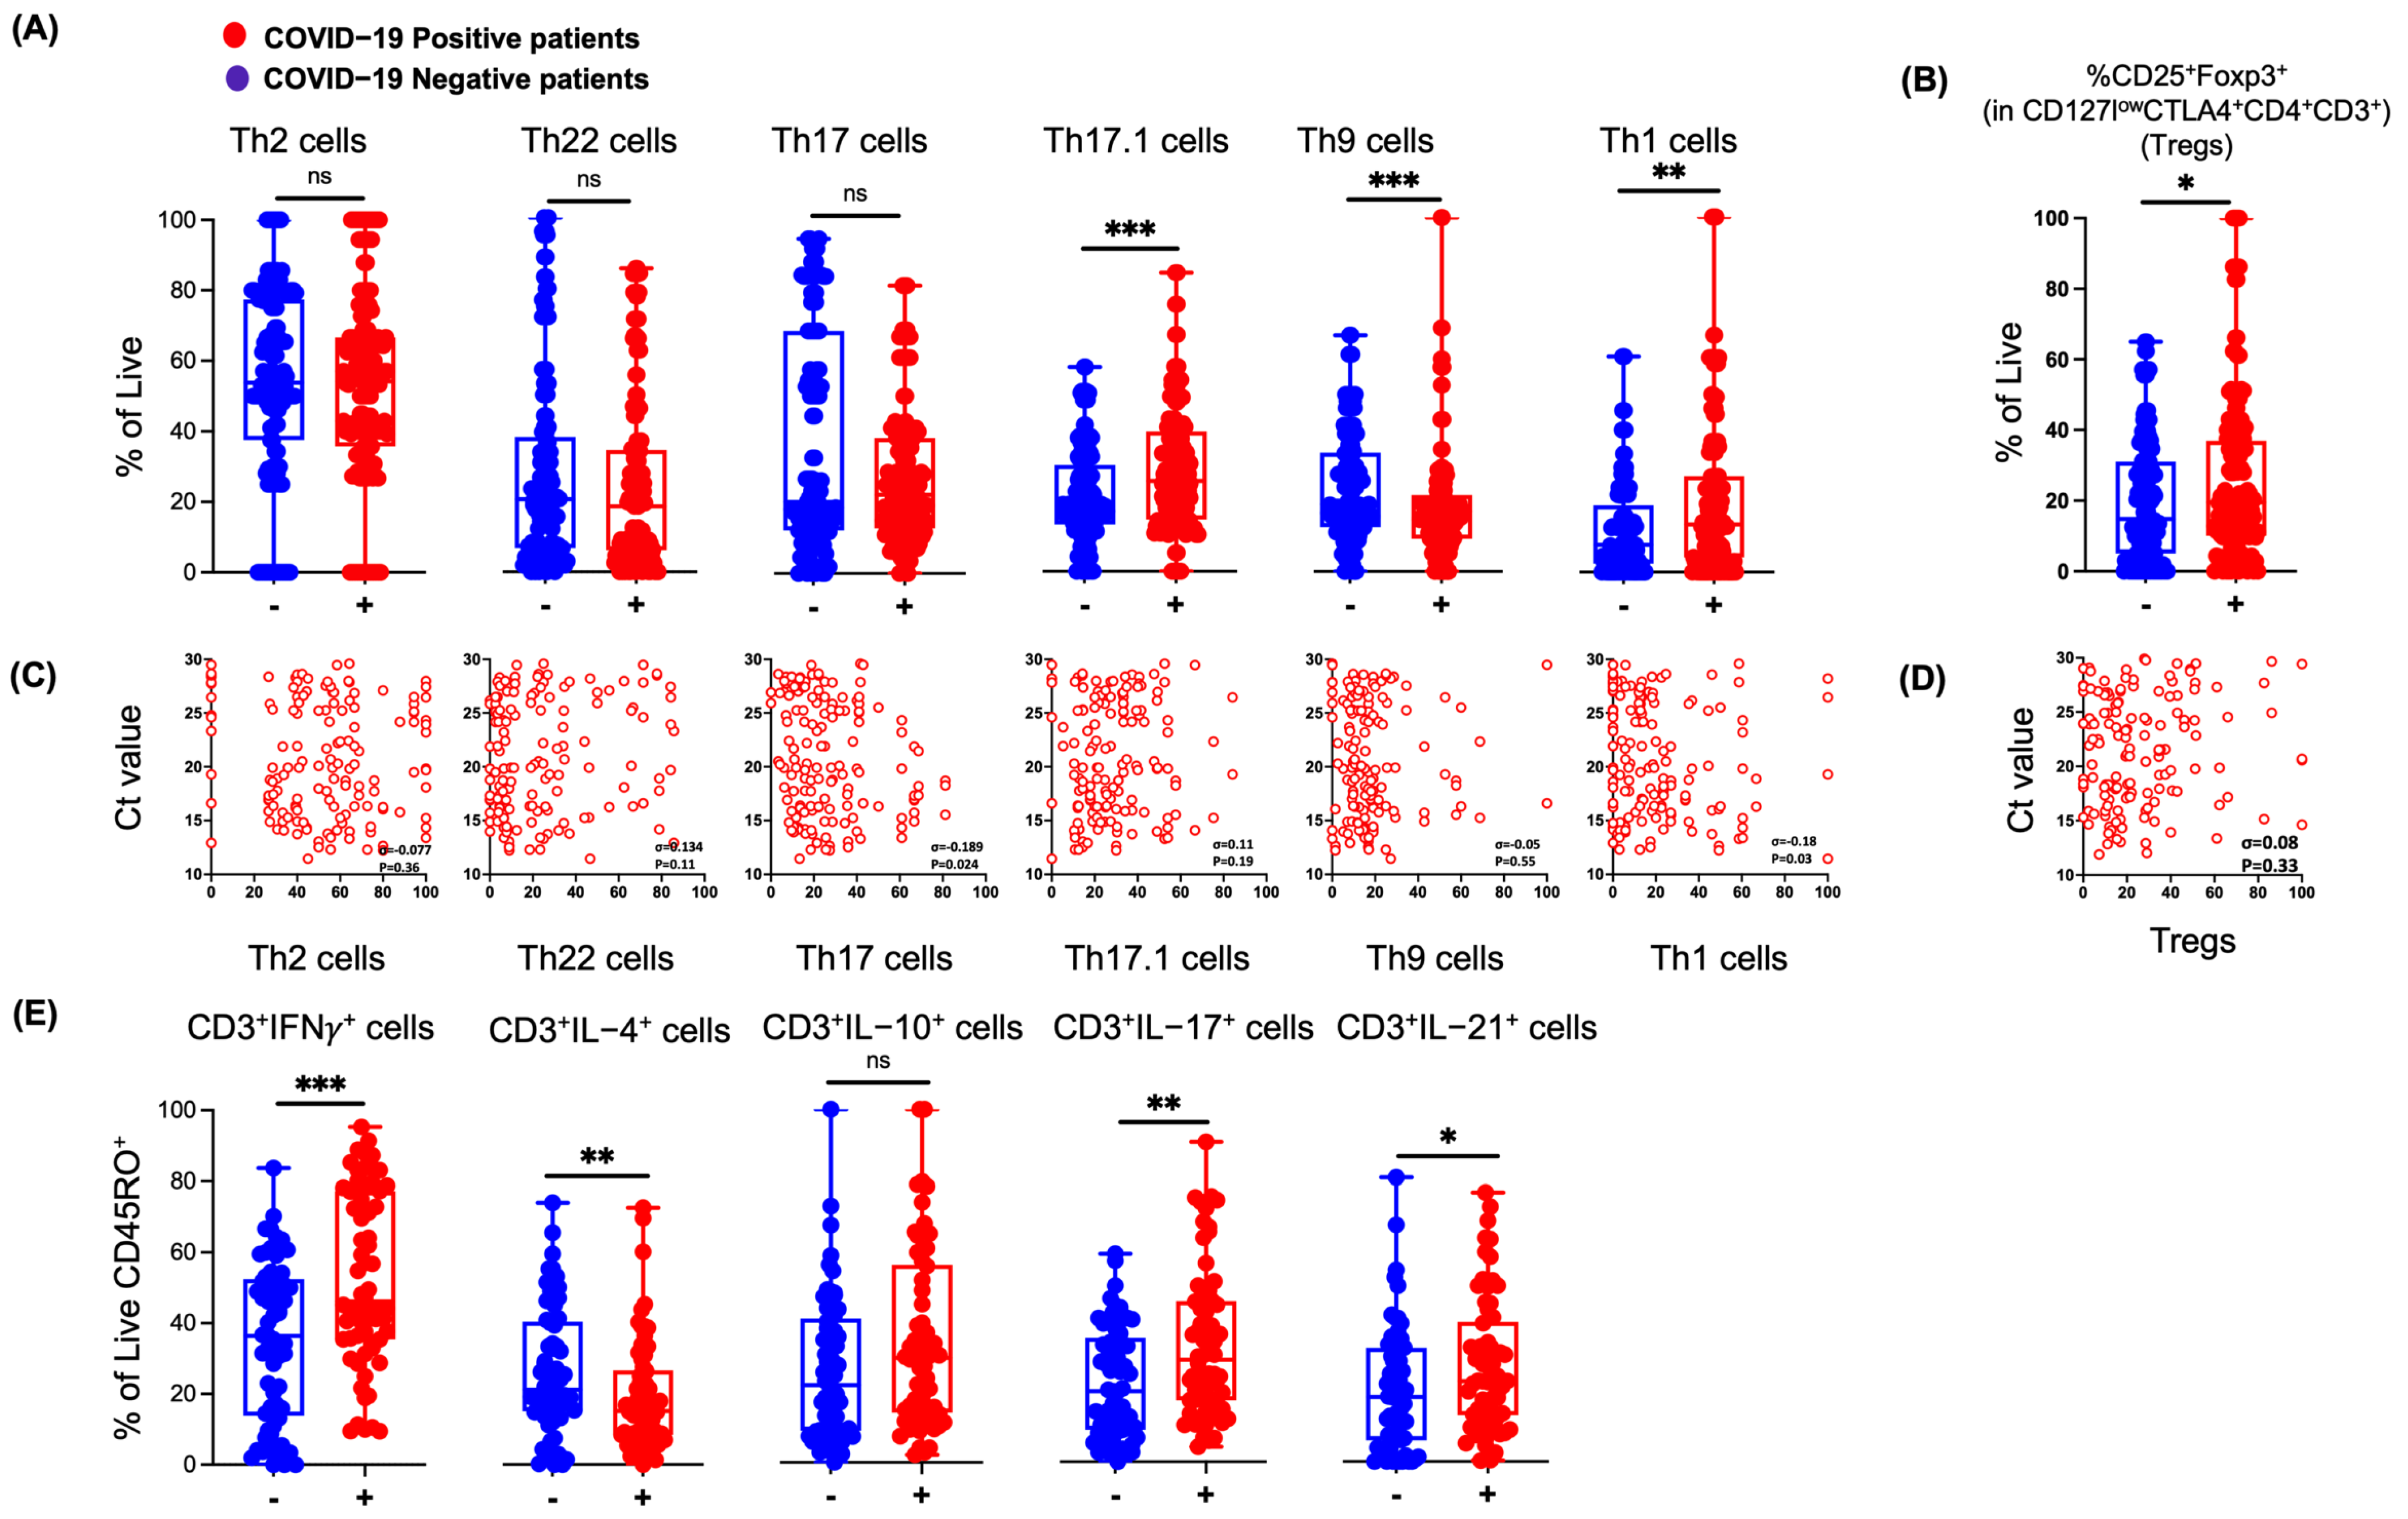
3.3. SARS-CoV-2 Infection in Humans Results in Changes in NP Th Lymphocytes

We examined different CD45 + CD4 + T-cell subsets (Th2, Th22, Th17, Th17.1, Th9, and Th1) (Figure 4) by using a gating strategy based on chemokine receptor expression as previously described [44] (Supplementary Tables S4–S6 and Figure S5). The chemokine receptor expression profile indicated Th cell subsets: CD45 + CD4 + CCR6 CCR4 + CCR10 CXCR3 phenotype (Th2 cells), CD45 + CD4 + CCR6 + CCR4 + CCR10 + phenotype (Th22 cells), CD45 + CD4 + CCR6 + CCR4 + CXCR3 CCR10 phenotype (Th17 cells), CD45 + CD4 + CCR6 + CCR4 CCR10 CXCR3 + phenotype (Th17.1 cells), CD45 + CD4 + CCR6 + CCR4 phenotype (Th9 cells), CD45 + CD4 + CCR6 CCR4 CCR10 CXCR3 + phenotype (Th1 cells). Our data shows that COVID-19-positive patients had significantly higher frequencies of Th1 and Th17.1 subsets, whereas COVID-19-negative patients had significantly higher frequencies of the Th9 subset. No significant differences were observed in Th2, Th22, and Th17 cell distributions between COVID-19-positive and -negative patients (Figure 4A). Our results indicated that increased frequencies of Th1 and Th17.1 subsets of Th cells in COVID-19-positive patients may play an important role in disease progression.
In addition, the significantly increased frequency of Tregs (CD3 + CD4 + CTLA4 + CD127 l o w CD25 + FoxP3 + as shown in Supplementary Figure S6), were detected in COVID-19-positive patients (Supplementary Table S6 and Figure 3B). These data agree with profound circulating blood Tregs across confirmed COVID-19 patients [45], suggesting that Tregs may enforce immune homeostasis during SARS-CoV-2 infection and contribute to COVID-19 pathology. Th17 and Th1 showed a significant Spearman correlation with the viral load, as determined by the Ct value of the PCR, while Th2, Th22, Th17.1, and Tregs did not show a significant correlation with viral load (Figure 4C,D). Next, we assessed if Th cell subsets are involved in the secretion of distinct cytokines specific to cell subsets and exert immunological functions. We observed a statistically significant increased frequency of CD45RO + CD3 + IFN γ + (Th1 trait), CD45RO + CD3 + IL-17 + (Th17 traits), and CD45RO + CD3 + IL-21 + (Th17/Th21 trait), while a not significantly high frequency of CD45RO + CD3 + IL-10 + (Tregs traits) was observed in COVID-19-positive patients. Furthermore, a statistically significant decreased frequency of CD45RO + CD3 + IL-4 + (Th2 trait) was found in COVID-19-positive patients (Figure 4E and Supplementary Table S6). Thus, increased Th1, Th17.1, and Tregs and decreased Th22, Th17, and Th9 in the nasal route of COVID-19-positive patients confirm the profound association of inflammatory Th lymphocytes during SARS-CoV-2 infection.

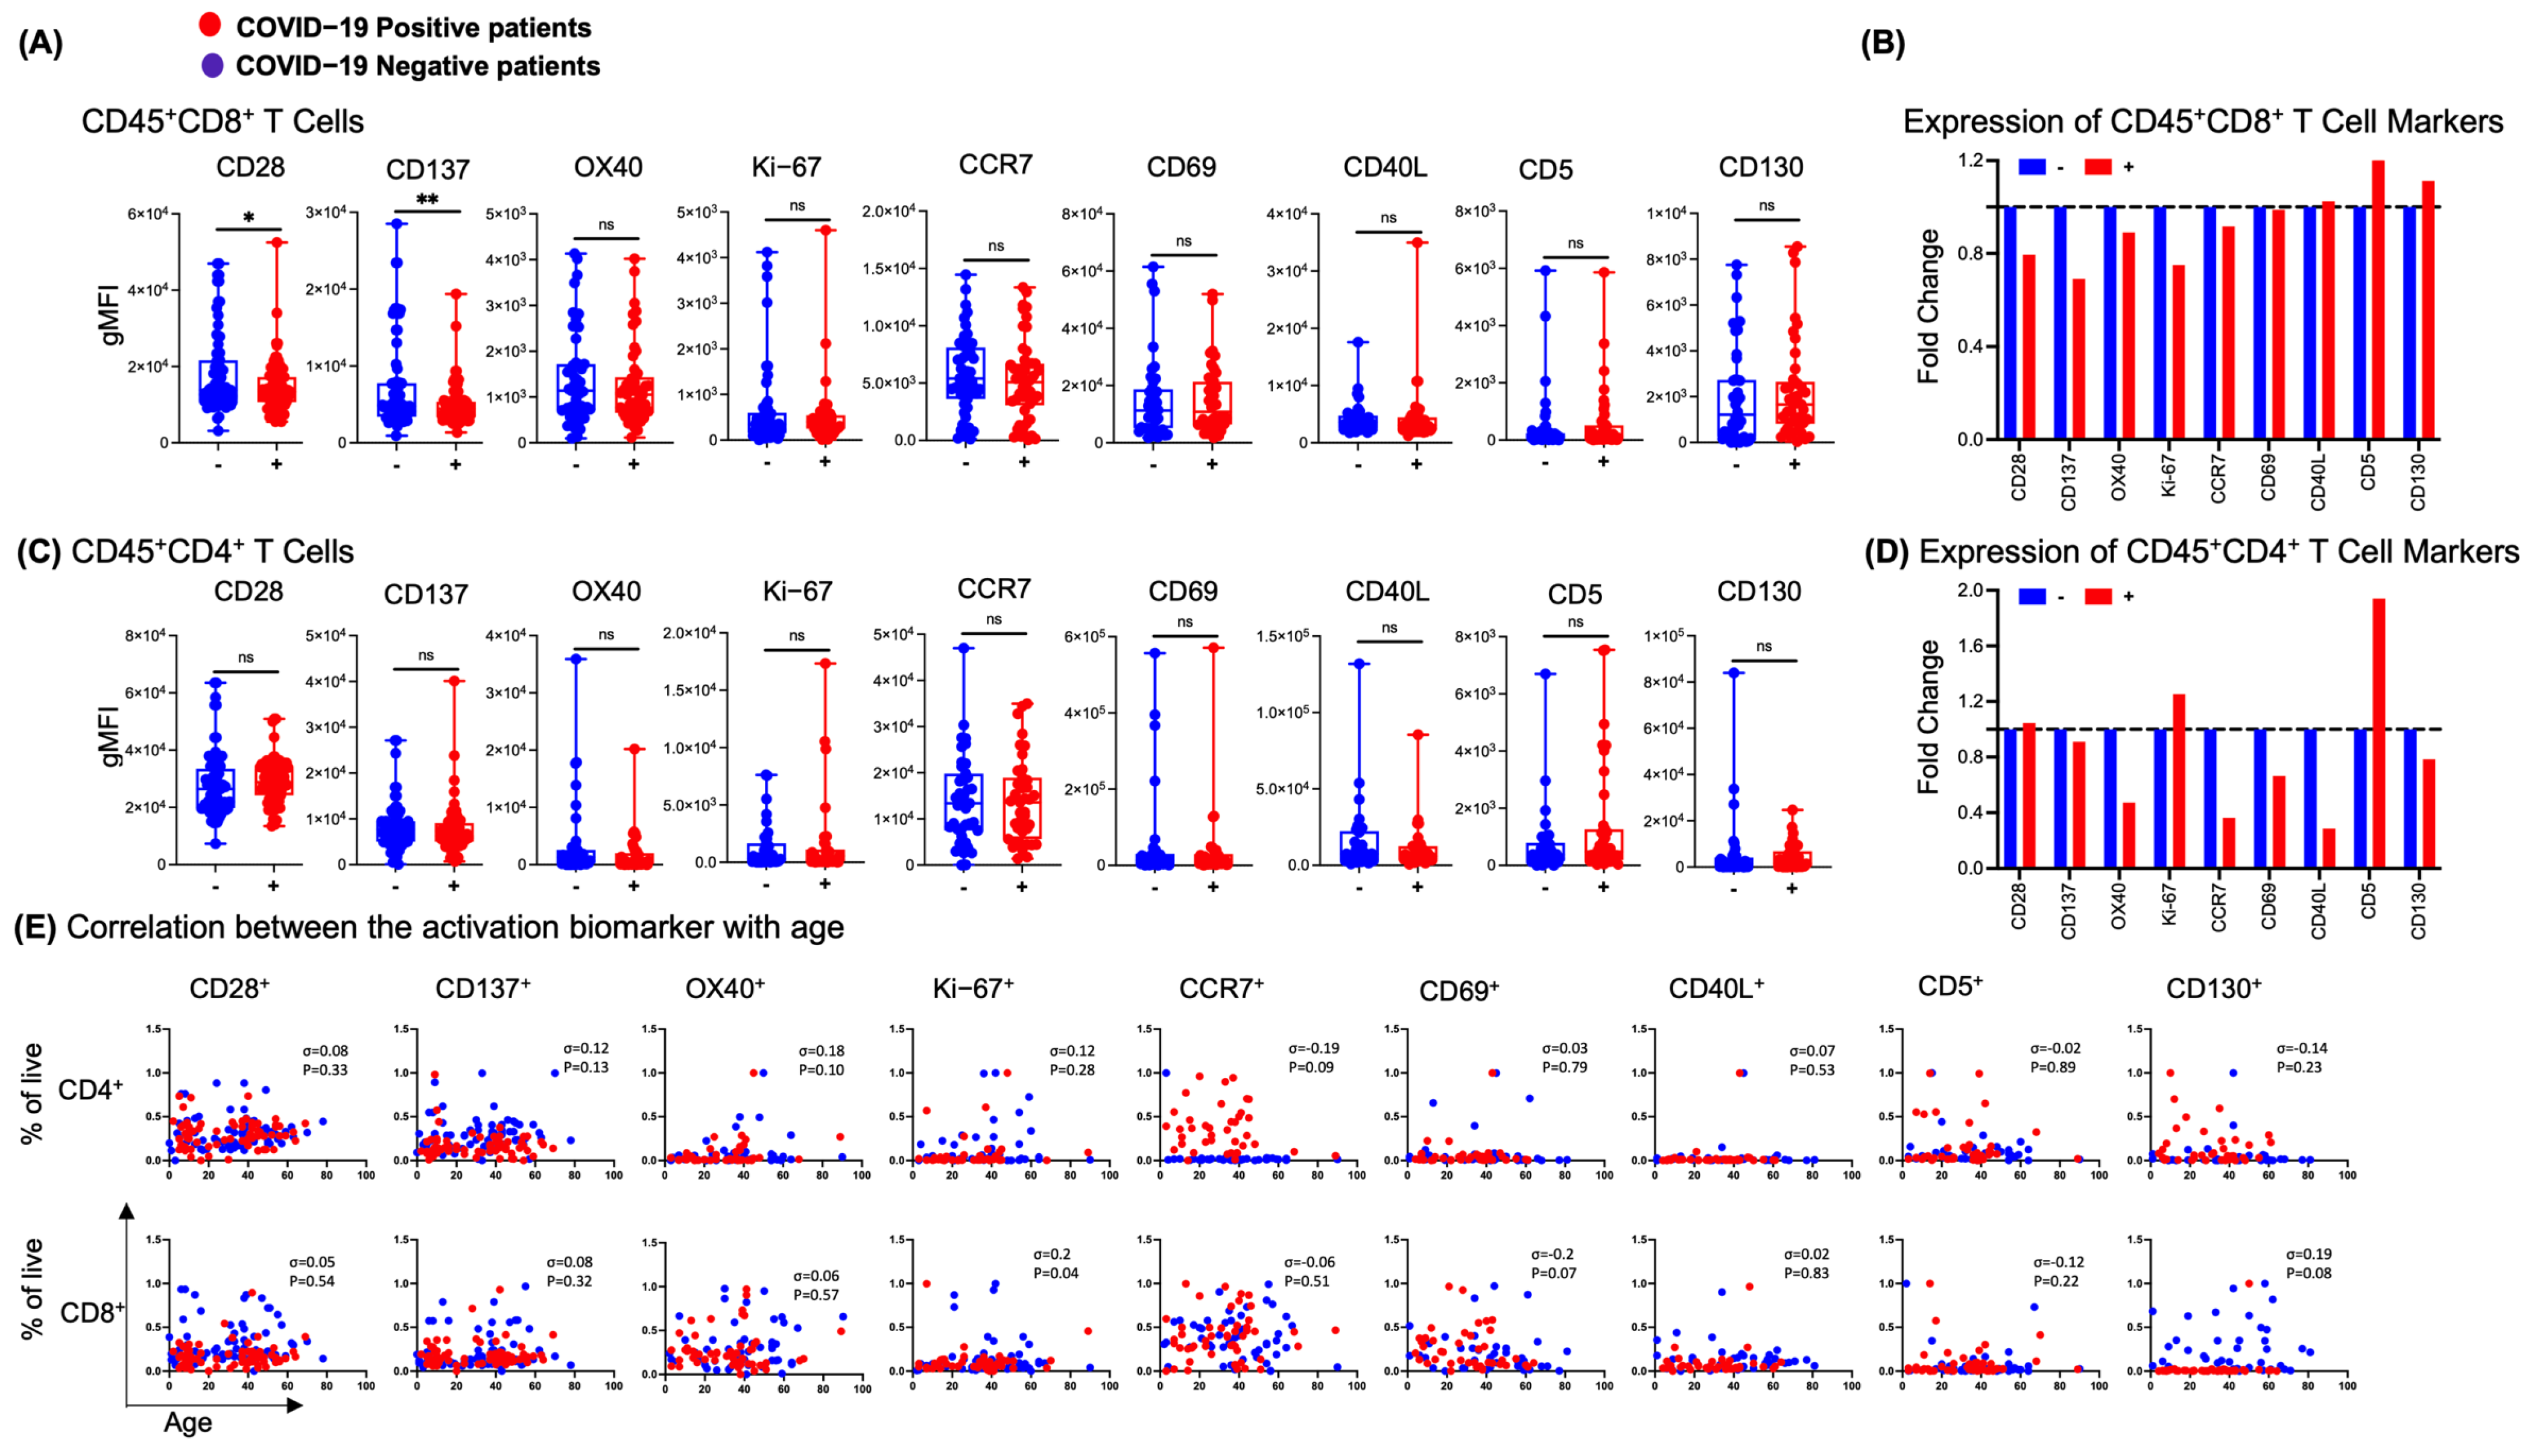
3.4. NP T-Cell Activation or Dysfunctional State Is Associated with SARS-CoV-2 Infection

Next, we examined the expression of co-stimulatory molecules on CD45 + CD8 + T-cells and CD45 + CD4 + T-cells from NP swabs of COVID-19 patients (Supplementary Tables S7–S9 and Figure 5). Notably, COVID-19-positive patients showed a statistically significant decrease in the expression of CD28 and CD137 on CD8 + T-cells; however, the expression of OX40, Ki-67, and CCR7 was unaffected. CD8 + T-cells showed a non-significant increase in the expression of CD5 and CD130 in COVID-19-positive patients (Figure 5A). Further, we compared the expression of co-stimulatory molecules with the fold-change to negative. The expression of CD28, CD137, OX40, Ki-67, and CCR7 on CD8 + T-cells was less than 1 (Figure 5B), correlating with increased susceptibility of CD8 T-cells to SARS-CoV-2 infection, supporting the findings of CD8 T-cell apoptosis due to loss of CD28 [46,47,48,49]. On the other hand, the expression of CD137, OX40, CCR7, CD69, CD40L, and CD130 on CD4 + T-cells was not significantly decreased while the expression of CD28, Ki-67, and CD5 was slightly increased (Figure 5C). Moreover, we investigated the expression of co-stimulatory molecules on CD4 + and CD8 + T-cells and how they change with age by Spearman correlation in COVID-19-positive and -negative patients. We observed no (in the expression of CD28, CD137, OX40, Ki-67, CD69, CD40L, CD5, and CD130) or very weak (CCR7) correlation for CD4 + T-cells with age. Similarly, we observed no (in the expression of CD28, CD137, OX40, CCR7, CD40L, and CD5) or very weak (Ki-67, CD69, and CD130) correlation with age on CD8 + T-cells (Figure 5E). Together these findings suggest that T-cell co-stimulatory molecules in the NP airway are down-regulated in COVID-19-positive patients and may lead to T-cell replicative senescence and immune exhaustion, independent of age.

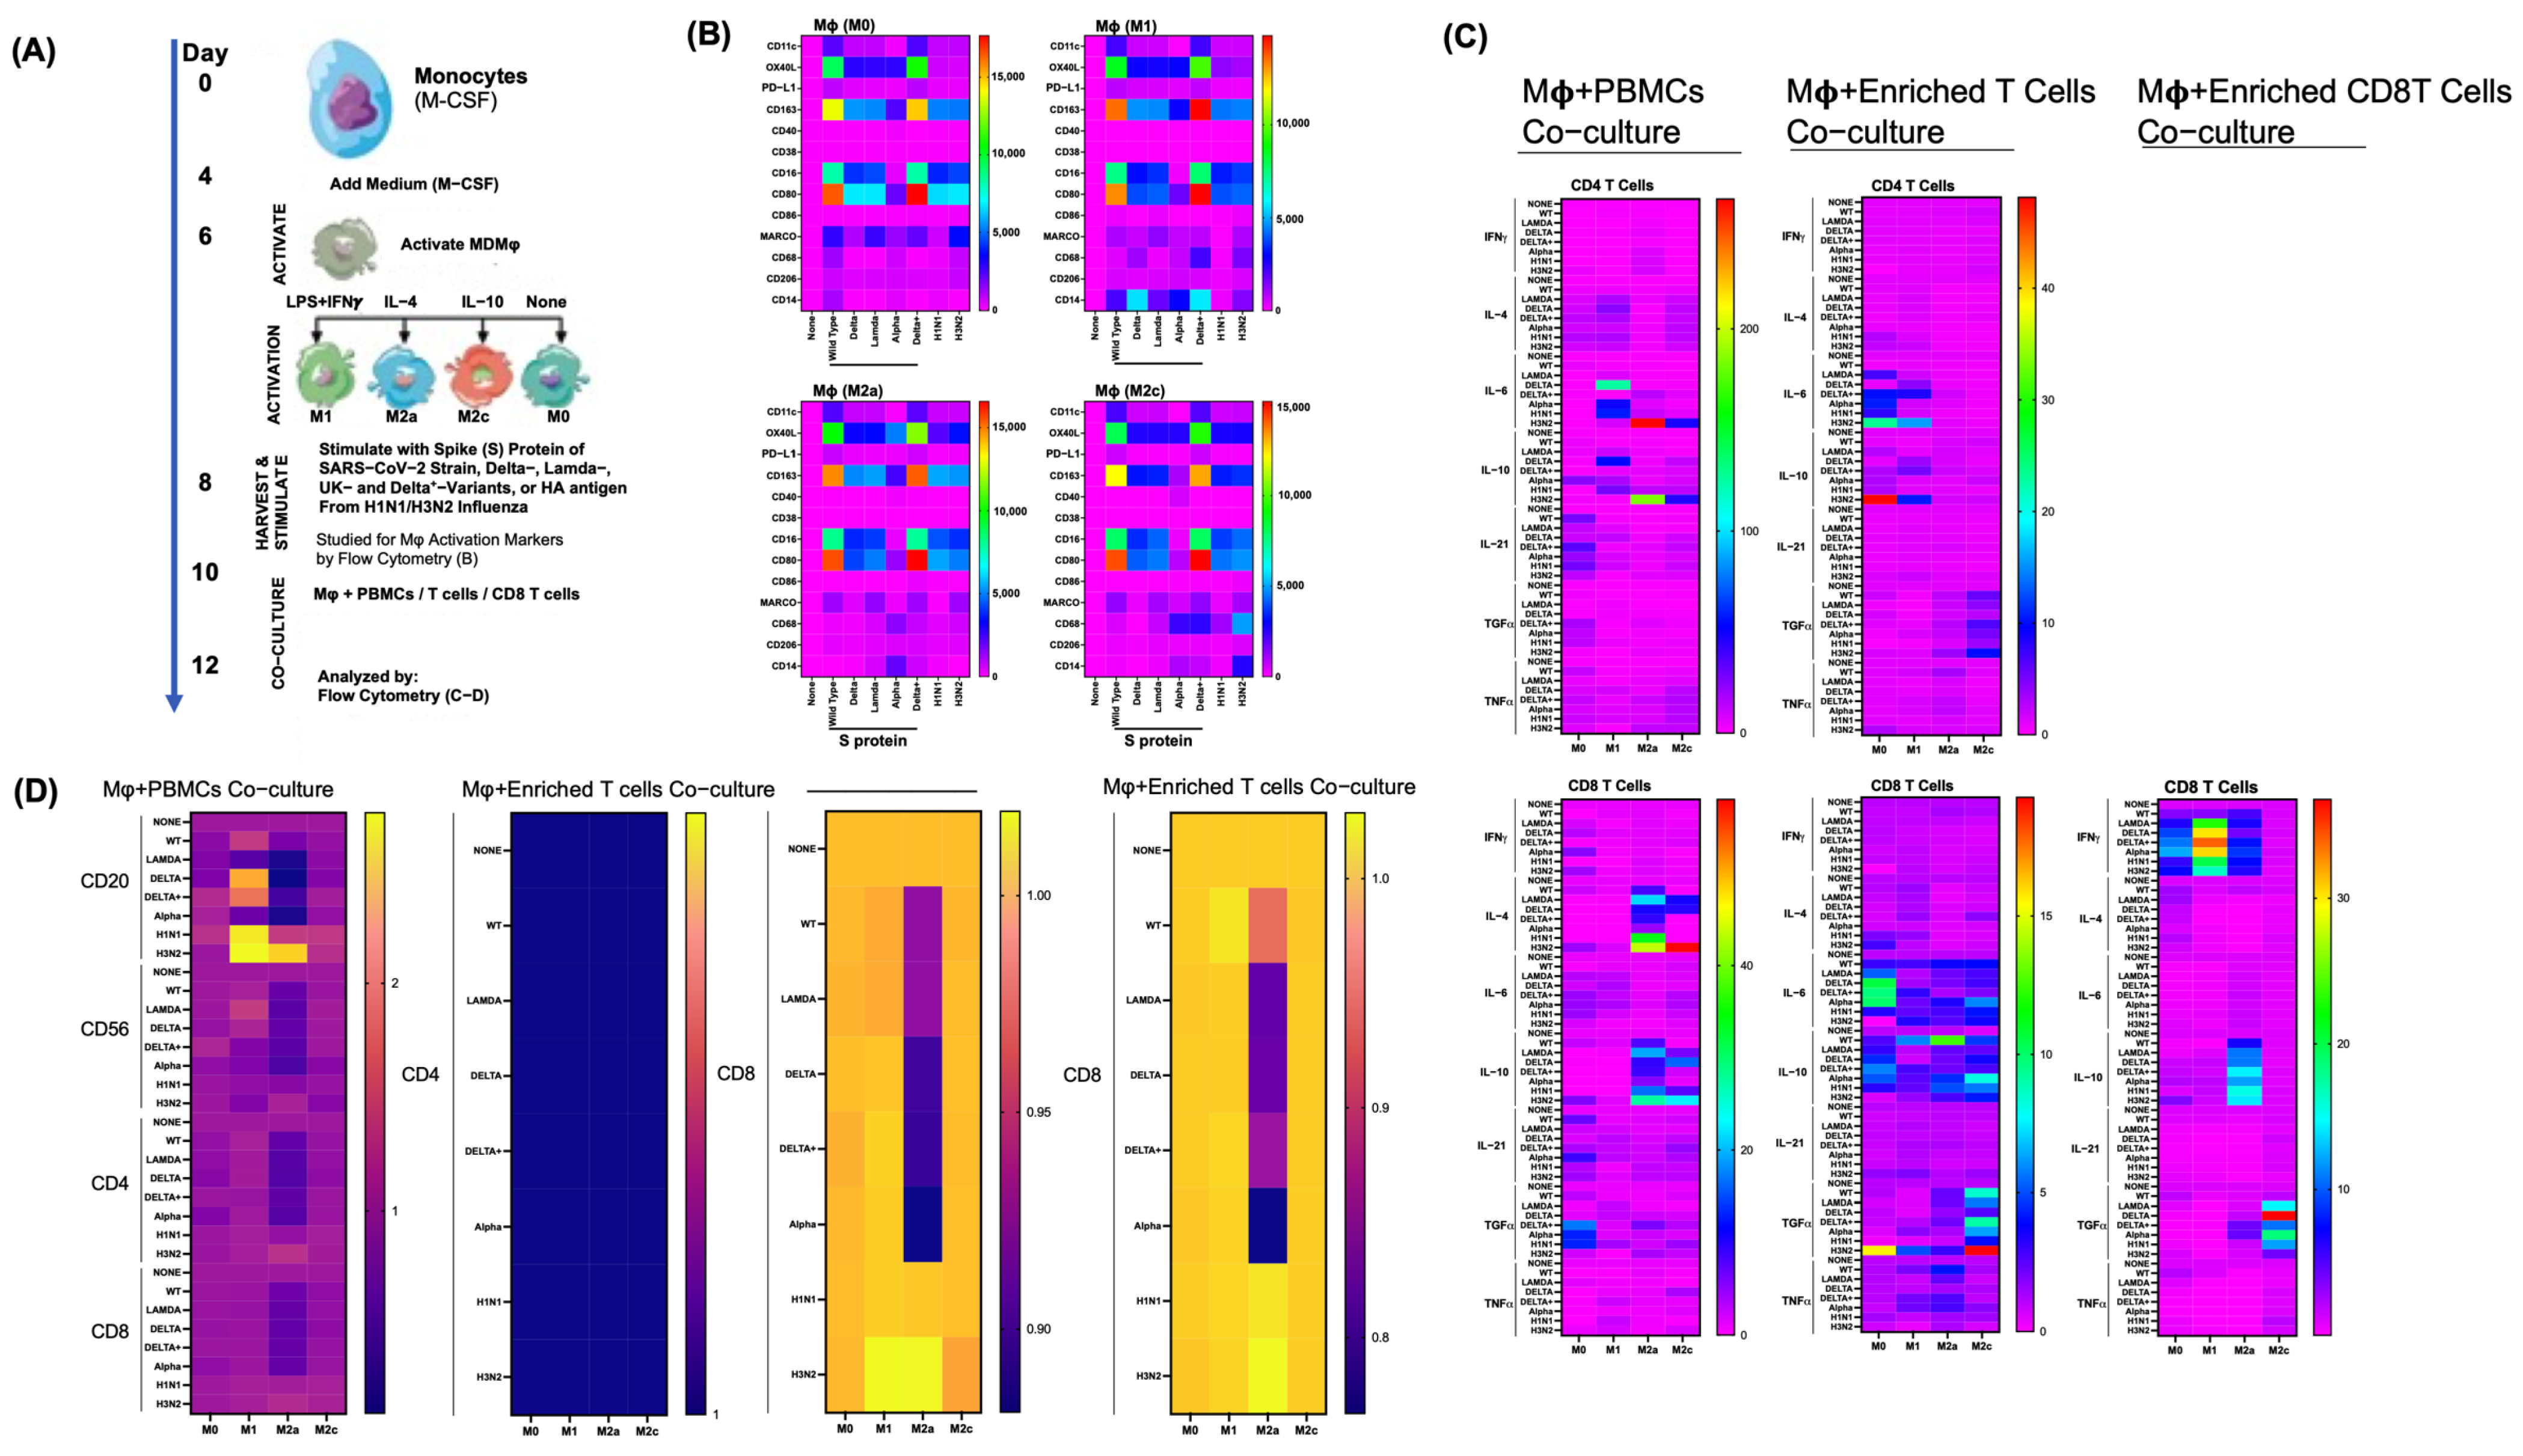
3.5. Differential Effects of Macrophage (M ϕ ) Subtypes on SARS-CoV-2 Infection

Notably, in vitro SARS-CoV-2 infection of whole PBMCs from healthy donors allowed viral replication and revealed that monocytes, as well as B- and T-lymphocytes, are susceptible to SARS-CoV-2 active infection and viral replication [50]. Thus, we sought to observe the cytokines released from PBMCs from healthy donors cultured in the presence of purified trimer S protein of the SARS-CoV-2 wild-type strain, Delta-, and Omicron-variants (Supplementary Figure S7). We noticed that the fold-change of IFN- λ 1 was significantly elevated upon stimulation with the trimer S protein (from wild-type, Delta-, and Omicron-variants), IL-6 (from wild-type and Delta-variant), IL-1 β (from Delta-variant) and GM-CSF (from Delta- and Omicron-variants). None of the S protein variants induced the production of IFN β and/or were below the limit of detection (IFN γ 2/3, IFN α , IL-10, IL-8, and IL-12p70) from PBMCs. Our findings agree with Hsu RJ et al. [51] that a hyperactive host immune response to SARS-CoV-2-infection leads to an exaggerated inflammatory reaction.
SARS-CoV-2-infected patients demonstrated similarities to those observed in cytokine release syndromes, such as macrophage activation syndrome, with increased production of inflammatory cytokines/chemokines, which suggested a dysregulated activation of the mononuclear phagocyte compartment that contributes to COVID-19-associated hyper inflammation [52,53,54,55]. Immunohistochemistry of post-mortem tissue from patients who had died from COVID-19 revealed that the SARS-CoV-2 entry receptor ACE2 is expressed on tissue-resident CD169 + macrophages in the spleen and lymph nodes and contained SARS-CoV-2 nucleoprotein also observed in ACE2 + cells, but not in CD3 + T-cells or B220 + B-cells in the spleen and LNs [56]. Though SARS-CoV-2 nucleoprotein was observed in secondary lymphoid tissue M ϕ , it is still unknown if the virus productively infected M ϕ or if recruited M ϕ interact with the virus through the binding of surface receptors, transmitting the virus to more susceptible cells. Therefore, to understand the role of M ϕ , we polarized human monocyte-derived M ϕ (MDMs) into M1/M2a/M2c phenotypes and stimulated the cells in the presence or absence of the SARS-CoV-2 trimer S proteins or the haemagglutinin/HA antigen protein from H1N1/H3N2 influenza A (Figure 6A). The expression of M ϕ activation markers including CD11c, OX40L, CD163, CD206, CD16, CD80, CD86, CD38, PD-L1, MARCO, CD68, CD40, and CD14 [57,58,59,60,61,62,63,64,65,66,67,68,69,70,71] was analysed (Figure 6A,B and Supplementary Figure S8A–M). The expression of M ϕ surface markers on stimulated (with the trimer S protein of SARS-CoV-2 variants or with H1N1/H3N2) M ϕ was normalized to unstimulated (none)-M ϕ and data are presented as the fold-change shown by the heatmap (Figure 6B) and on the gMFI (Supplementary Figure S8A–M). We observed that M ϕ -subtypes, in the presence of different variants of the SARS-CoV-2 trimer S protein, differentially increased the expression of CD11c, CD16, MARCO, CD163, CD80, CD206, OX40L, and PD-L1, whereas the expression of CD14, CD68, CD86, and CD38 had noticeable up- and down-regulation depending on the condition of M ϕ -subtypes, and the expression of CD40 was unaffected by any conditions of M ϕ -subtypes. Expression of M ϕ surface receptors by the stimulation of trimer S proteins of SARS-CoV-2 was comparable to the stimulation of HA antigen from H1N1/H3N2.
We next measured CD4/CD8 T-cell cytokines from the co-cultured PBMCs/enriched T-cells/enriched CD8 T-cells in the presence of distinct M ϕ -subtypes stimulated by various stimuli, as shown in Figure 6. We noticed that M ϕ -subtypes, upon various trimer S protein stimuli in co-culture with PBMCs, affect the production of CD4/CD8 T-cell cytokines. We detected a distinct increase in the fold-change of CD4 + T-cell cytokines by M0 (IL-4, IL-10, IL-21, TGF α , and TNF α ), M1 (IL-4, IL-6, IL-10, IL-21, and TNF α ), M2a (IL-6 and TNF α ) and M2c (IL-4, IL-10, IL-21, and TNF α ); however, there was no difference in the fold-change of CD8 + T-cell cytokines by M0 (IFN α , IL-6, IL-10, IL-21, and TGF α ), M1 (IL-6, IL-21, TGF α , and TNF α ), M2a (IL-4, IL-10, IL-21, and TGF α ) and M2c (IL-4, IL-6, IL-10, IL-21, TGF α and TNF α ). The co-culture of M2a M ϕ with PBMC CD8 + T-cells demonstrated an increased fold-change in IL-4 and IL-10 production mainly in the presence of all stimuli (Figure 6C, upper and lower left panel; Supplementary Figure S9A,B). We analysed the fold-change of CD4 and CD8 T-cell cytokines co-cultured with M ϕ -subtypes with enriched T-cells. T-cell (CD4 and CD8) cytokine fold-change in the presence of stimulated M ϕ -subtypes normalized to unstimulated (none) M ϕ were distinctly affected by M ϕ -subtypes upon trimer S protein stimulation. We noticed the increased fold-change of CD4 + T-cell cytokines by M0 (IL-4 and IL-10), M1 (IL-6 and IL-10), M2a (TGF α and TNF α ), and M2c (TGF α ); moreover, an increased fold-change of CD8 + T-cell cytokines by M0 (IL-6 and IL-10), M1 (IL-4, IL-6, IL-10, and TNF α ), M2a (IL-6, IL-10,TGF α , and TNF α ) and M2c (IL-4,IL-6, IL-10, and TGF α ) were observed. We observed that the co-cultures of M2a M ϕ with enriched T-cells, and/or CD8 + T-cells demonstrated an increased fold-change in IL-6, IL-10, TGF α , and TNF α production mainly in the presence of each stimulus of trimer S protein as well as H1N1 and H3N2 (Figure 6, upper and lower middle panel; Supplementary Figure S10A,B). M ϕ -subtypes stimulated with trimer S proteins and co-cultured with enriched CD8 T-cells had an increased fold-change of CD8 + T-cell cytokines IFN γ (by M0 and M1), IFN λ and IL-10 (by M2a), and TGF α (M2c) (Figure 6C, lower right panel; Supplementary Figure S11).
Furthermore, we investigated the role of M ϕ -subtypes on lymphocyte proliferation upon stimulation with the trimer S protein, as shown in Figure 6A. The M ϕ -subtype M2a showed a decreased fold-change in lymphocyte proliferation, including CD3 CD20 + (B-cells), CD3 CD56 + (NK-cells), CD3 + CD4 + T-cells, and CD3 + CD8 + T-cells when stimulated by the trimer S protein compared to H1N1 or H3N2, while M1 mostly showed an increased fold-change in B-cell proliferation when stimulated compared to M2a (Figure 6D, left panel). These data show that B-cells are more susceptible in the presence of the M1 M ϕ -subtype upon trimer S protein or H1N1/H3N2 stimulation, agreeing with the findings of Pontelli et al. [50] reporting that B-lymphocytes are susceptible to active SARS-CoV-2 infections. However, CD3 + CD4 + T-cells were unaffected by the presence of M ϕ -subtypes stimulated by trimer S proteins, H1N1 or H3N2 (Figure 6D, middle panel). In contrast to CD3 + CD4 + T-cells, CD3 + CD8 + T-cells co-cultured with trimer S protein-stimulated M2a M ϕ with enriched T-cells or CD8 T-cells had a decreased fold-change in proliferation, while M ϕ -subtypes, M0, M1, and M2c, in the co-culture conditions showed a similar fold-change in CD3 + CD8 + T-cell proliferation compared to none at the indicated stimulation. Moreover, compared to H1N1/H3N2, trimer S protein-stimulated M2a M ϕ showed decreased CD8 + T-cell proliferation (Figure 6D, middle and right panel). Our data suggests that M ϕ , upon SARS-CoV-2-infection, may play distinct roles in the sequelae of COVID-19 progression.

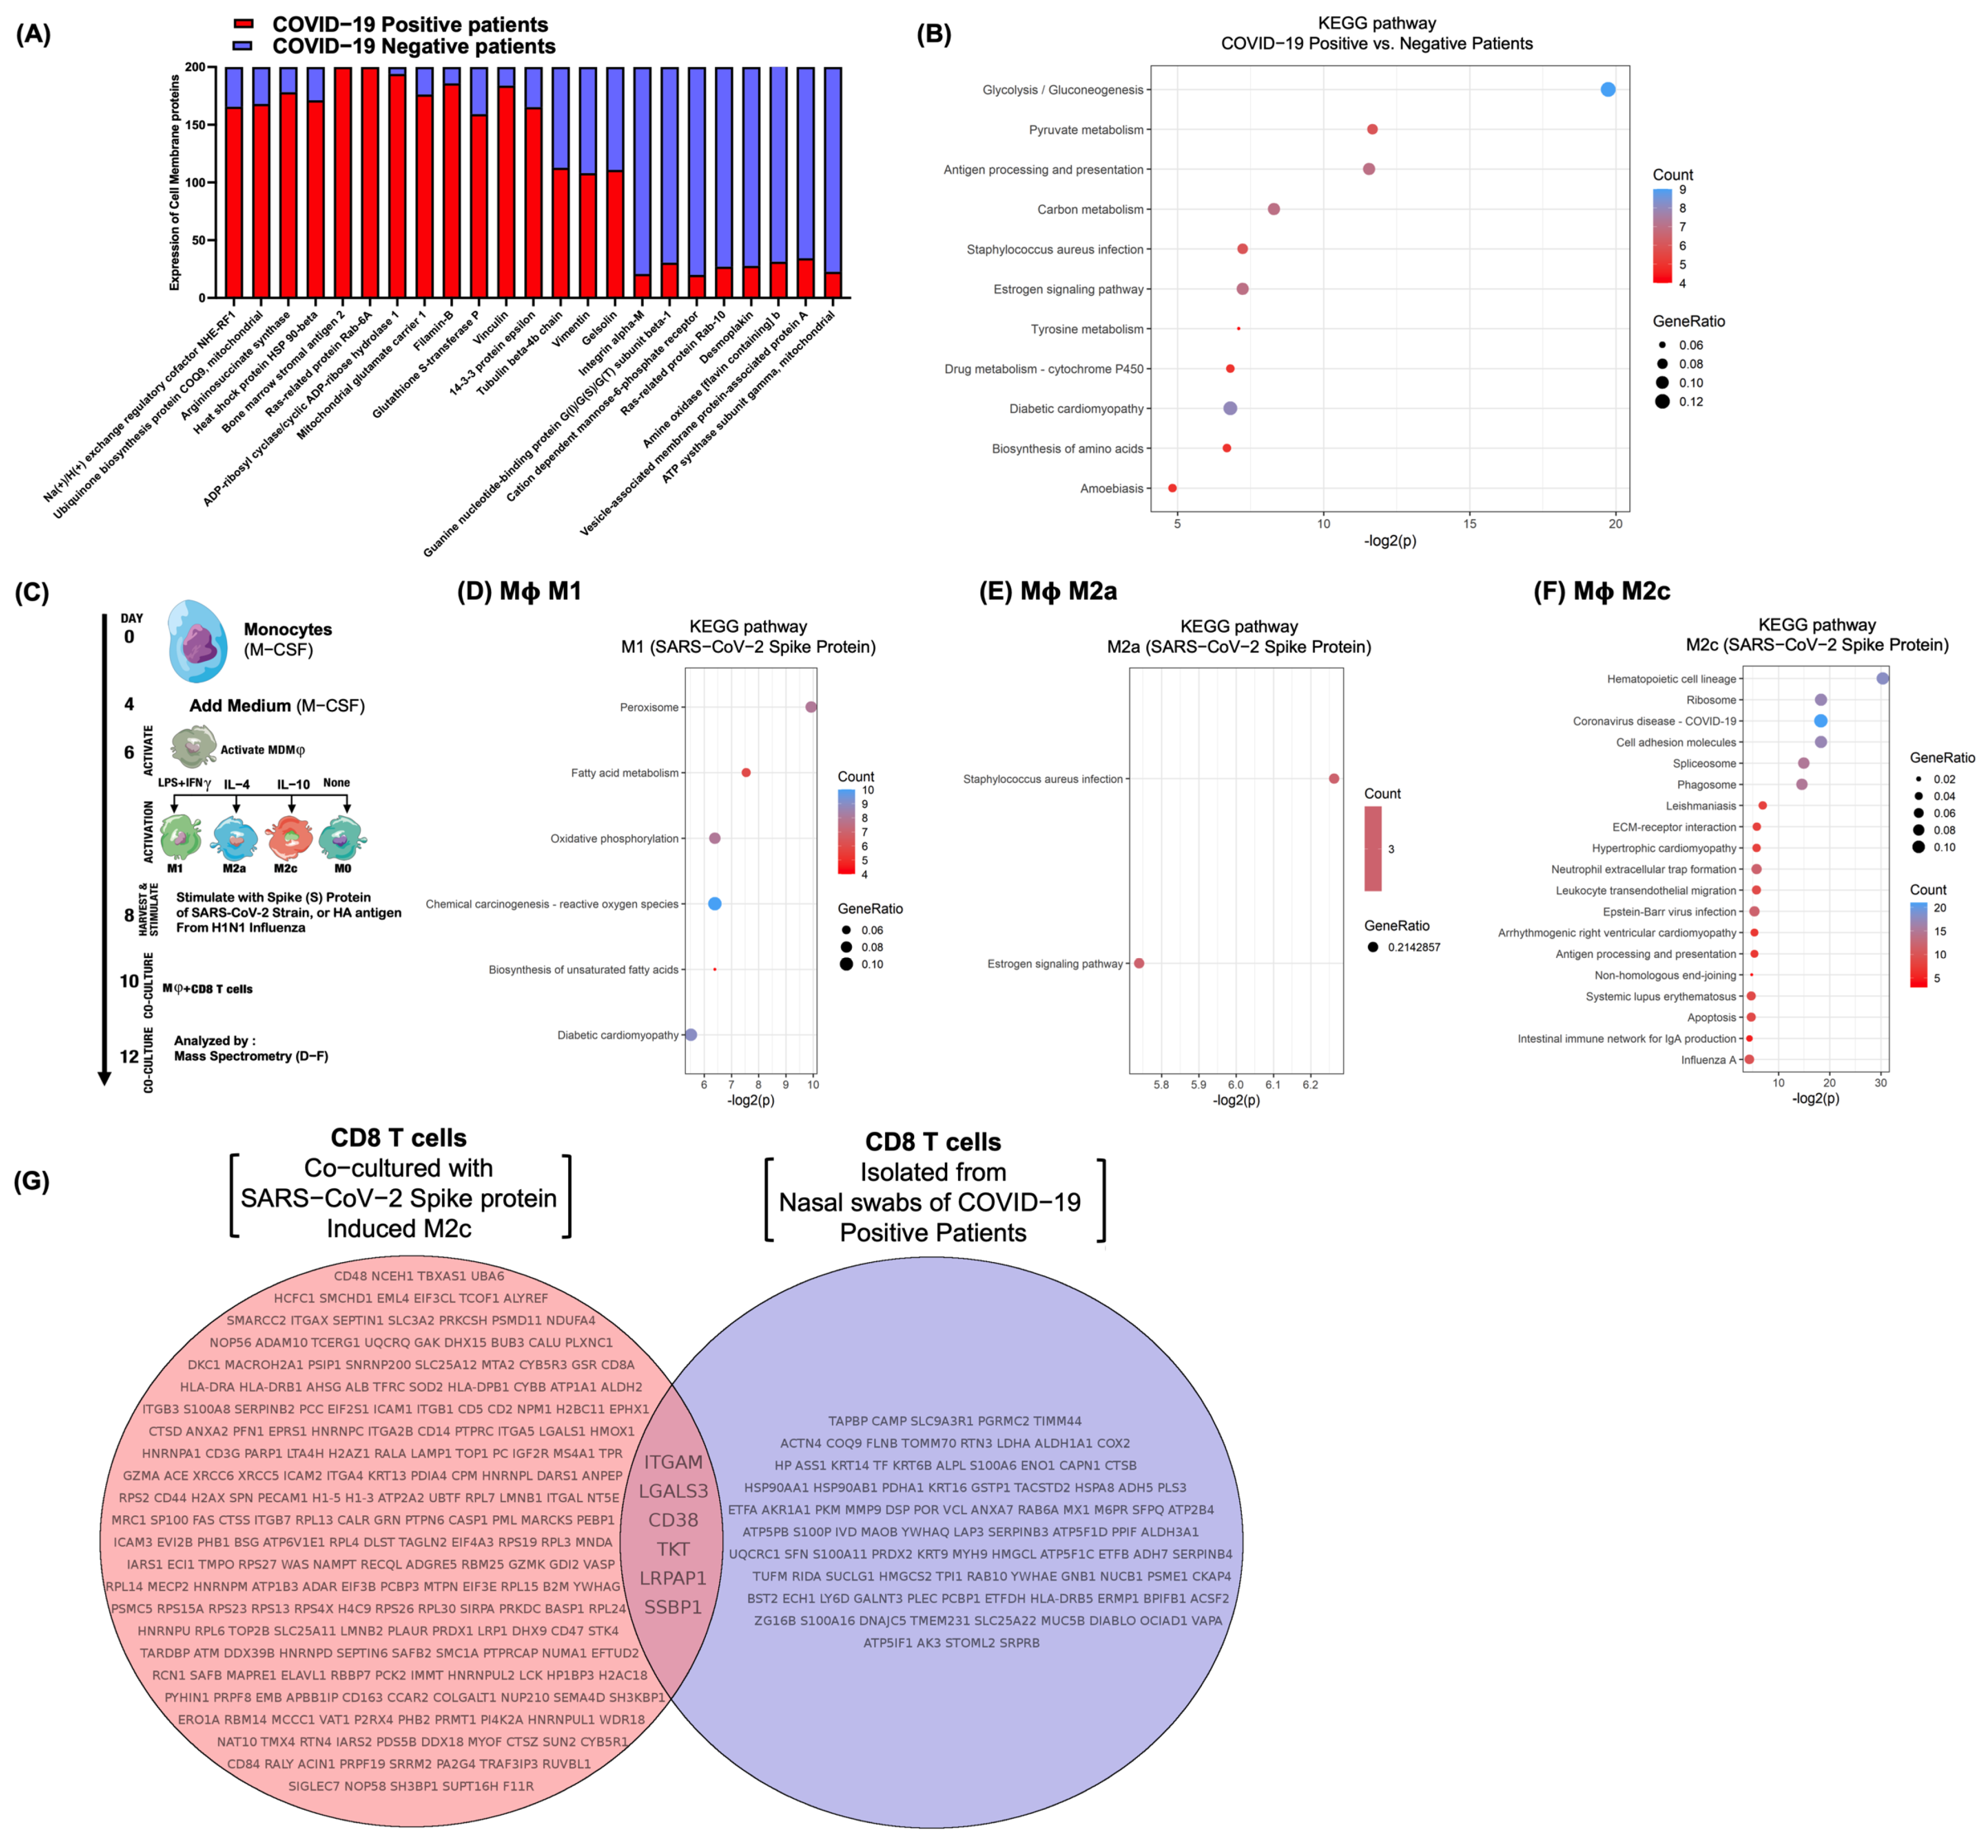
3.6. Differential Surfactome Expression on NP CD8 T-Lymphocytes

We examined the surfactome signatures on T-lymphocytes from NP samples of COVID-19 patients, using similar approaches to our recent findings [23]. We identified up- and down-regulated surfactomes on enriched T-cells from NP samples of COVID-19 patients. We showed several differentially expressed proteins on T-cells from SARS-CoV-2-positive patients compared to negative patients. Proteins identified on T-cells (Figure 7A) are representative COVID-19 biomarkers and targets for the treatment of COVID-19, and its progression [72,73,74,75,76,77,78,79,80,81,82,83,84,85,86,87,88,89,90,91,92,93,94,95,96,97,98,99,100,101,101]. Further, we analysed all the identified proteins in COVID-19-positive and -negative patients by Kyoto Encyclopedia of Genes and Genomes (KEGG) pathways analysis [102] (Figure 7B). The significantly changed pathways in COVID-19-positive patients compared to negative patients were glycolysis/gluconeogenesis [103], pyruvate metabolism [104], antigen processing and presentation [105], carbon metabolism [103], Staphylococcus aureus infection [106], oestrogen signalling pathway [107], tyrosine metabolism [108], drug metabolism cytochrome P450 [109], diabetic cardiomyopathy [110], biosynthesis of amino acids [108], and amoebiasis [111]. We observed that glycolysis/gluconeogenesis [103], pyruvate metabolism [104], and antigen processing and presentation [105] cascades were significantly enriched and showed the highest enrichment ratio scores.
In vitro assessment of the M ϕ –CD8 T-cells co-culture (Figure 7C) identified several differentially expressed proteins on CD8 T-cells in the presence of the SARS-CoV-2 spike (S) protein or H1N1-stimulated M ϕ -subtypes (Supplementary Figure S12). Interestingly, we noticed that CD8 T-cells co-cultured with trimer S protein-stimulated M ϕ -subtype (M2c) differentially down-regulated 105 proteins and up-regulated 32 proteins, such as PFN1, H4C9, KRT6A, KRT6B, KRT16, WDR1, PHB1, PPLA, DECRA, TAGLN2, PHB2, HNRNPC, RPL6, PRKDC, DHX9, HNRNPU, HNRNPL, XRCC5, CCT3, H2BC11, H1-5, H1-3, HP1BP3, RPS23, HNRNPF, RPL8, AGK, RPS2, TMPO, RPS4X, CNN2, and IQGAP2, with important immunoregulatory roles in SARS-CoV-2 infection. Of note, CD8 T-cells co-cultured with M ϕ (M1/M2a)-subtypes (stimulated with the trimer S protein or H1N1) showed comparable differentially up- and down-regulated protein expression (Supplementary Figure S12). Moreover, KEGG pathway analysis revealed the significant role of M ϕ -subtypes (Figure 7D–F), especially M ϕ -subset M2c (Figure 7F), in orchestrating immune-related protein interactions in COVID-19 progression and modulation. To confirm the biological functional enrichment analysis of KEGG, we next conducted gene ontology (GO) analysis [112] to further identify biological processes impacted in different CD8 T-cell and M ϕ -subtype co-cultures stimulated in the presence or absence of the trimer S protein or H1N1 (Supplementary Figures S13–S16). We noticed that CD8 T-cells in the presence of trimer S protein-stimulated M2c compared to H1N1-stimulated M2c (Supplementary Figure S16) showed high protein interactions with biological processes belonging to the cellular/molecular and immunoregulatory mechanisms, important in the pathogenesis of COVID-19. Importantly, we observed that CD8 T-cells co-cultured with trimer S protein-stimulated M2c differentially expressed the up-regulation of 241 proteins, while NP CD8 T-cells from COVID-19-positive patients up-regulated 101 proteins, from which we observed six proteins, including (macrophage-1 antigen, mac-1) ITGAM [113,114], LGALS3 (mac-2) [115], CD38 [114], TKT [116], LRPAP1 [117], and SSBP1 [118], were commonly up-regulated and known for regulating macrophage proliferation, cell cycle, adhesion, migration, chemotaxis, polarization, viability, apoptosis, and metabolic flux. These might be notable biomarkers to highlight the possible role of macrophages in COVID-19 (Figure 7G). Thus, our in vitro observations of KEGG and GO-BP pathway analysis demonstrate the immune-related protein interactions in COVID-19 patients and highlight the possible role of M ϕ -subtypes, especially M2c, in the initiation and progression of COVID-19.

4. Discussion

In this study, we aimed to comprehensively characterize immune cells and cytokines from human nasal mucosa, assess how the human immune system responds to SARS-CoV-2 at the primary site of infection, and how it may differ from the host systemic immune response. Using flow cytometry, mass spectrometry, and multiplex ELISA, we analysed NP swabs collected from patients with COVID-19 disease and compared them to negative patients. Our study revealed several striking observations such as (a) SARS-CoV-2 infection in humans is associated with an increased NP inflammatory immune profile; (b) SARS-CoV-2 induces a cytokine storm in the NP route due to an increased acute inflammatory response of Th1, Th17.1, and Tregs and decreased Th2, Th22, Th9 and Th17 responses; (c) SARS-CoV-2 infection is associated with decreased expression markers, especially CD28 and CD137 on CD8 + T-cells; (d) stimulated M ϕ by the trimer S protein of SARS-CoV-2 variants induces T-cell inflammatory responses and affects B-cell and CD8 + T-cell proliferation in distinct co-culture of cells; and (e) the M ϕ -subset M2c orchestrates an immune-related protein interaction networks. Our data correlates with COVID-19 initiation, modulation, and progression in NALT.
Unexpectedly, we found a significantly increased acute inflammatory Th1 and Th17.1 cytokine/chemokine response, consistent with Broos’s findings that Th17.1 cell migration is attracted to high local co-expression of IP-10 and MIP-3 α [119]. Notably, Ramstein et al. [120] reported the pathogenic role of Th17.1 cells which is more prevalent than Th1 in lung sarcoidosis. An increased frequency of both Th1 and Th17.1 in this study clarifies our understanding of the functional repertoire in COVID-19 progression and highlights the value of Th1 and Th17.1 cells as potential diagnostic/prognostic markers as well as therapeutic targets for COVID-19. An intriguing observation of our study was the identification of increased Tregs in the NP swabs of COVID-19-positive patients. This agrees with the findings of Galván-Peña et al. [45] that found Treg perturbations correlated with COVID-19 severity. Furthermore, we observed that in vitro stimulated M ϕ by different variants of the SARS-CoV-2 trimer S protein induced T-cell inflammatory responses in distinct co-cultures (PBMCs/T-cells/CD8 T-cells). In summary, our study reveals a previously unknown biological pathway and cytokine storm modality in the link of human T-cells with M ϕ that clarifies the overall functionality of the T-cell population in the NP route of COVID-19 initiation, progression, and modulation (Figure 8, graphic summary).
The nasal airway is the initial site for viral replication and shedding [121]. During SARS-CoV-2 infection, NALT is the first lymphoepithelial barrier to provide a “gate control” over airborne antigen and an inductive site to regulate local immune responses, especially the mucosal innate immune system [122]. Once SARS-CoV-2 enters into NALT, it induces a highly inflammatory form of programmed cell death and increased secretion of IL-6, IFN γ , MCP-1, and IP-10, which rapidly activates cells of the innate immunity. An intriguing observation of our study was the loss of CD28 and CD137 expression on CD8 T-lymphocytes, marker of replicative senescence, retention, and innate-like function [46,47,48,49]. Moreover, TLRs associated with the mucosal compartment were shown to recognize the pathogen-associated molecular patterns of a variety of pathogenic and commensal microorganisms [123]. Unlike blood, no general lymphopenia was observed in the nasal mucosa and the depleted lymphocyte population in blood did not show a concurrent increase in the nasal mucosa. SARS-CoV-2-specific CD8 T-cells persist 2 months after viral clearance in the nasal mucosa [21]. It seems that the activation of the innate immunity by NALT regulated the early site of viral replication and modulation of the systemic immune response [124]. Nasal infectivity may be affected by different concentrations of environmental agents, resulting in a more variable host immune response and COVID-19 clinical syndrome [125,126]. Thus, generating a UA mucosal response, preventing viral shedding and transmission, and inducing a more potent mucosal immunity is key to stopping disease progression. This evokes the idea that the danger signal can be part of a T-cell-associated cytokine/chemokine memory that is re-excitable on cognate antigen recognition. Therefore, we performed a comprehensive comparative surfactome analysis of CD8 T-cells co-cultured with the trimer S protein-stimulated M ϕ subset M2c, and CD8 T-cells from NP samples of COVID-19-positive patients. Our study identified a differentially promoted inflammatory surfactome on CD8 T-cells, including ITGAM, LGALS3, CD38, TKT, LRPAP1, and SSBP1. This study clarifies our understanding of inflammatory lymphocyte perturbations within the nasopharynx of COVID-19 patients that may enforce immune homeostasis during SARS-CoV-2-infection and contribute to COVID-19 pathology. Recently, Smith et al. [127] compared systemic and NP cytokine responses between healthy donors and COVID-19 patients. They observed that 13 out of 46 cytokines in plasma and 7 out of 46 cytokines in the NP were significant different between healthy donors and COVID-19 patients. Interestingly, out of the 46 cytokines, only IL-10 and CCL2 (MCP-1) were increased in plasma and the NP during the COVID-19 infection, showing that the NP cytokine response is regulated in a distinct fashion. Moreover, in our study, we noticed that out of the 10 cytokines in factor 2 of the factor analysis (Supplementary Figure S2), IL-10, MCP-1/CCL2, IL-1 β , and GM-CSF showed greater loading (loading value >0.8) indicating the importance of NP cytokines in COVID-19 modulation and progression. Correlation studies between peripheral blood and NP samples from the tested patients are still to be explored in the future to understand the immunological dynamics of NALT during the SARS-CoV-2 infection. Notably, we observed (a) no significant increase in or immunomodulation of CD4 + T-cells, suggesting that COVID-19 impairs the natural immune response in the UA by self modulating cytokine/chemokine induction by CD8 + T-cells through monocytic cells. (b) The naturally low levels of CD19 + B-cells/CD4 T-cells makes the viral port of entry an almost ideal primary site to induce a cytokine storm but also avoid a future memory response (no sufficient helper T-cells and no plasma cell-induced immunoglobulin production) in subsequent infections. (c) CD28 down-regulation in CD8-positive T-cells might be associated with the virus avoiding the activation of helper follicular T-cells, and subsequent proliferation, survival, and maintenance of a type-I IFN viral response by the host.
To accelerate our understanding of the host–pathogen response to respiratory viruses, we studied the effect of H1N1 and H3N2 haemagglutinin/HA antigen proteins (as positive controls) on inflammatory immune responses to viral infection. We observed a similar mechanistic approach of M ϕ triggering CD8 Th-type inflammatory reactions. Meanwhile, in the nose/UA microenvironment and its impact factors are complex. The UA is exposed to different environmental agents (e.g., bacterial, fungal, and/or viral pathogens) and the NP microbial communities are believed to be partly mediated by the immune response to SARS-COV-2 symptoms and severity [127,128]. Additionally, host and environmental factors may influence individual human cytokine responses, such as age, gender, health condition, smoking, mental health, or medications such as antibodies or anti-inflammatory drugs [129,130]. Therefore, more studies will be needed in the future.

5. Conclusions

In conclusion, our findings reveal that COVID-19 progression correlates with M ϕ , especially the M2c-subtype, that induces exhaustion of CD8 + T-cells and modulates inflammatory Th1/Th17 responses. Our findings also highlight the importance of the cytokine storm in COVID-19 initiation, modulation, and progression, and thus demonstrated the association of inflammatory Th-lymphocytes during SARS-CoV-2 infection. We identified potential therapeutic target protein receptors, such as MAC-1(ITGAM), MAC-2(IGALS3), TKT, CD38, LRPAP1, and SSBP1 in COVID-19. Our study has laid a decisive foundation for the discovery of the pathomechanism of the SARS-CoV-2 virus, which could facilitate the development of targeted therapies against COVID-19.

Supplementary Materials

The following supporting information can be downloaded at: https://www.mdpi.com/article/10.3390/covid3040041/s1. Figure S1: The COVID-19 cytokine/chemokine storm in the nasopharyngeal microenvironment belongs to the responses; Figure S2: Exploratory factor analysis; Figure S3: The nasopharyngeal cytokines/chemokines storm is associated with male gender susceptibility to being infected by the SARS-CoV-2; Figure S4: A representative gating strategy illustrating the lymphocyte population being subgated to the level of CD3 CD20 + B cells, CD3 CD56 + (NK), CD3 + CD56 + (NKT), CD3 + T cells, CD3 + CD4 + CD8 T cells, and CD3 + CD4 CD8 + T cells; Figure S5: Gating strategy for assessing the percentages of T cell subsets (Th2, Th22, Th17, Th17.1, Th9, and Th1) in nasopharyngeal swabs of COVID-19 positive and negative patients; Figure S6: A representative gating strategy illustrating the T regulatory cells (Tregs) lymphocyte subset being gated to the level of CD3 + CD4 + CTLA4 + CD127LOWCD25 + FOXP3 + ; Figure S7: Human PBMCs from healthy donors (n = 8) cultured in the presence or absence of S protein of the SARS-CoV-2 wild-type strain, Delta- and Omicron-variants as well as H1N1 and H3N2 at 37 C for 48 hr; Figure S8: Macrophage (M ϕ ) subtypes in lymphocyte dysregulation during SARS-CoV-2 infection; Figure S9: Macrophage subtypes of SARS-CoV-2 infection affect T-cell cytokines responses; Figure S10: Macrophage subtypes of SARS-CoV-2 infection affect T-cell cytokines responses; Figure S11: Macrophage subtypes of SARS-CoV-2 infection affect T-cell cytokines responses; Figure S12: Macrophage subtypes modulate immune-related protein interaction networks in CD8 T lymphocytes during SARS-CoV-2 infection; Figure S13: Proteomics alterations-associated GO terms in CD8 T lymphocytes during SARS-CoV-2 infection identified using the TopGO package in R. CD8 T cells cocultured with macrophage subset, M0, stimulated in the presence of SARS-CoV-2 S protein or HA protein of H1N1; Figure S14: Proteomics alterations-associated GO terms in CD8 T lymphocytes during SARS-CoV-2 infection identified using the TopGO package in R. CD8 T cells cocultured with macrophage subset, M1, stimulated in the presence of SARS-CoV-2 S protein or HA protein of H1N1; Figure S15: Proteomics alterations-associated GO terms in CD8 T lymphocytes during SARS-CoV-2 infection identified using the TopGO package in R. CD8 T cells cocultured with macrophage subset, M2a, stimulated in the presence of SARS-CoV-2 S protein or HA protein of H1N1; Figure S16: Proteomics alterations-associated GO terms in CD8 T lymphocytes during SARS-CoV-2 infection identified using the TopGO package in R. CD8 T cells cocultured with macrophage subset, M2c, stimulated in the presence of SARS-CoV-2 S protein or HA protein of H1N1; Table S1: Patient Demographic Information and the Average of Cytokine/chemokine Level per Category; Table S2: Patient demographics belonging to Figure 3A; Table S3: Patient demographics belonging to Figure 3B,C; Table S4: Patient demographics belonging to Figure 4A; Table S5: Patient demographics belonging to Figure 4B; Table S6: Patient demographics belonging to Figure 4E; Table S7: Patient demographics belonging to Figure 5 that were stained with cell surface markers (CD5, CCR7, Ki-67 and OX40; Table S8: Patient demographics belong to Figure 5 that were stained with cell surface markers (CD130, CD40, and CD69; Table S9: Patient demographics belong to Figure 5 that were stained with cell surface markers (CD28 and CD130; Table S10: Patient demographics belonging to Figure 7A,B; Table S11: Materials used in the study; Table S12: The lists of abbreviation.

Author Contributions

M.A.A. participated in the conceptualization and design of the research project, reviewing the data, and supervised in conducting the research and reporting the results. T.T., N.G. and L.A.-M. designed the experiments. T.T., W.C., R.R.N. and T.O. conducted the experiments. N.G. and V.P. supervised COVID-19 PCR testing. T.T., J.Z. and K.Z. conducted data analyses. J.Z., T.T. and R.R.N. conducted the literature review and manuscript writing. L.A.-M., T.T. and S.K.S. reviewed the data. L.A.-M. supervised the research. All authors contributed to manuscript editing and discussion of the results in the final manuscript. All authors have read and agreed to the published version of the manuscript.

Funding

The research was funded by Ayass Bioscience, LLC, a privately-held Texas limited liability company.

Institutional Review Board Statement

This research was reviewed and approved by the Salus IRB Review Board (protocol# ABS001_01_01_2022).

Informed Consent Statement

This research was reviewed and approved by the Salus IRB Review Board (protocol# ABS001_01_01_2022). Informed consent form was waived by Salus IRB.

Data Availability Statement

This article has accompanying supplementary files. All data generated or analysed during this study are included in this published article (and its Supplementary Material Files).

Acknowledgments

We thank all patients who were willing to participate in this study. We thank Larisa Marder for all illustrative work.

Conflicts of Interest

The authors declare no conflict of interests.

References

  1. Lai, C.; Shih, T.; Ko, W.; Tang, H.; Hsueh, P. Severe acute respiratory syndrome coronavirus 2 (SARS-CoV-2) and coronavirus disease-2019 (COVID-19): The epidemic and the challenges. Int. J. Antimicrob. Agents 2020, 55, 105924. [Google Scholar] [CrossRef]
  2. Raveendran, A.; Jayadevan, R.; Sashidharan, S. Long COVID: An overview. Diabetes Metab. Syndr. Clin. Res. Rev. 2021, 15, 869–875. [Google Scholar] [CrossRef]
  3. Merad, M.; Blish, C.; Sallusto, F.; Iwasaki, A. The immunology and immunopathology of COVID-19. Science 2022, 375, 1122–1127. [Google Scholar] [CrossRef] [PubMed]
  4. Kumagai, Y.; Takeuchi, O.; Kato, H.; Kumar, H.; Matsui, K.; Morii, E.; Aozasa, K.; Kawai, T.; Akira, S. Alveolar macrophages are the primary interferon-α producer in pulmonary infection with RNA viruses. Immunity 2007, 27, 240–252. [Google Scholar] [CrossRef] [Green Version]
  5. Kasuga, Y.; Zhu, B.; Jang, K.; Yoo, J. Innate immune sensing of coronavirus and viral evasion strategies. Exp. Mol. Med. 2021, 53, 723–736. [Google Scholar] [CrossRef]
  6. Schultze, J.; Aschenbrenner, A. COVID-19 and the human innate immune system. Cell 2021, 184, 1671–1692. [Google Scholar] [CrossRef]
  7. Yoo, J.; Kato, H.; Fujita, T. Sensing viral invasion by RIG-I like receptors. Curr. Opin. Microbiol. 2014, 20, 131–138. [Google Scholar] [CrossRef] [Green Version]
  8. Wathelet, M.; Orr, M.; Frieman, M.; Baric, R. Severe acute respiratory syndrome coronavirus evades antiviral signaling: Role of nsp1 and rational design of an attenuated strain. J. Virol. 2007, 81, 11620–11633. [Google Scholar] [CrossRef] [Green Version]
  9. Ratia, K.; Saikatendu, K.; Santarsiero, B.; Barretto, N.; Baker, S.; Stevens, R.; Mesecar, A. Severe acute respiratory syndrome coronavirus papain-like protease: Structure of a viral deubiquitinating enzyme. Proc. Natl. Acad. Sci. USA 2006, 103, 5717–5722. [Google Scholar] [CrossRef] [PubMed] [Green Version]
  10. Sladkova, T.; Kostolansky, F. The role of cytokines in the immune response to influenza A virus infection. Acta Virol. 2006, 50, 151. [Google Scholar] [PubMed]
  11. Prokunina-Olsson, L.; Alphonse, N.; Dickenson, R.; Durbin, J.; Glenn, J.; Hartmann, R.; Kotenko, S.; Lazear, H.; O’Brien, T.; Odendall, C.; et al. COVID-19 and emerging viral infections: The case for interferon lambda. J. Exp. Med. 2020, 217. [Google Scholar] [CrossRef] [Green Version]
  12. Primorac, D.; Vrdoljak, K.; Brlek, P.; Pavelić, E.; Molnar, V.; Matišić, V.; Ivkošić, I.; Parčina, M. Adaptive Immune Responses and Immunity to SARS-CoV-2. Front. Immunol. 2022, 13, 848582. [Google Scholar] [CrossRef]
  13. Hue, S.; Beldi-Ferchiou, A.; Bendib, I.; Surenaud, M.; Fourati, S.; Frapard, T.; Rivoal, S.; Razazi, K.; Carteaux, G.; Delfau-Larue, M.; et al. Uncontrolled innate and impaired adaptive immune responses in patients with COVID-19 acute respiratory distress syndrome. Am. J. Respir. Crit. Care Med. 2020, 202, 1509–1519. [Google Scholar] [CrossRef] [PubMed]
  14. Lyudovyk, O.; Kim, J.; Qualls, D.; Hwee, M.; Lin, Y.; Boutemine, S.; Elhanati, Y.; Solovyov, A.; Douglas, M.; Chen, E.; et al. Impaired humoral immunity is associated with prolonged COVID-19 despite robust CD8 T-cell responses. Cancer Cell 2022, 40, 738–753.e5. [Google Scholar] [CrossRef] [PubMed]
  15. Adamo, S.; Chevrier, S.; Cervia, C.; Zurbuchen, Y.; Raeber, M.; Yang, L.; Sivapatham, S.; Jacobs, A.; Baechli, E.; Rudiger, A.; et al. Profound dysregulation of T cell homeostasis and function in patients with severe COVID-19. Allergy 2021, 76, 2866–2881. [Google Scholar] [CrossRef]
  16. Gallo, O.; Locatello, L.; Mazzoni, A.; Novelli, L.; Annunziato, F. The central role of the nasal microenvironment in the transmission, modulation, and clinical progression of SARS-CoV-2 infection. Mucosal Immunol. 2021, 14, 305–316. [Google Scholar] [CrossRef]
  17. Hellings, P.; Steelant, B. Epithelial barriers in allergy and asthma. J. Allergy Clin. Immunol. 2020, 145, 1499–1509. [Google Scholar] [CrossRef]
  18. McAuley, J.; Corcilius, L.; Tan, H.; Payne, R.; McGuckin, M.; Brown, L. The cell surface mucin MUC1 limits the severity of influenza A virus infection. Mucosal Immunol. 2017, 10, 1581–1593. [Google Scholar] [CrossRef] [Green Version]
  19. Linden, S.; Sutton, P.; Karlsson, N.; Korolik, V.; McGuckin, M. Mucins in the mucosal barrier to infection. Mucosal Immunol. 2008, 1, 183–197. [Google Scholar] [CrossRef] [PubMed] [Green Version]
  20. Panda, S.; Colonna, M. Innate lymphoid cells in mucosal immunity. Front. Immunol. 2019, 10, 861. [Google Scholar] [CrossRef] [Green Version]
  21. Roukens, A.; Pothast, C.; König, M.; Huisman, W.; Dalebout, T.; Tak, T.; Azimi, S.; Kruize, Y.; Hagedoorn, R.; Zlei, M.; et al. Prolonged activation of nasal immune cell populations and development of tissue-resident SARS-CoV-2-specific CD8+ T cell responses following COVID-19. Nat. Immunol. 2022, 23, 23–32. [Google Scholar] [CrossRef]
  22. Tomazic, P.; Darnhofer, B.; Birner-Gruenberger, R. Nasal mucus proteome and its involvement in allergic rhinitis. Expert Rev. Proteom. 2020, 17, 191–199. [Google Scholar] [CrossRef] [Green Version]
  23. Ayass, M.; Cao, W.; Zhang, J.; Dai, J.; Zhu, K.; Tripathi, T.; Griko, N.; Pashkov, V.; Abi-Mosleh, L. Noninvasive nasopharyngeal proteomics of COVID-19 patient identify abnormalities related to complement and coagulation cascade and mucosal immune system. PLoS ONE 2022, 17, e0274228. [Google Scholar] [CrossRef]
  24. Ssemaganda, A.; Nguyen, H.; Nuhu, F.; Jahan, N.; Card, C.; Kiazyk, S.; Severini, G.; Keynan, Y.; Su, R.; Ji, H.; et al. Expansion of cytotoxic tissue-resident CD8+ T cells and CCR6+ CD161+ CD4+ T cells in the nasal mucosa following mRNA COVID-19 vaccination. Nat. Commun. 2022, 13, 1–9. [Google Scholar] [CrossRef] [PubMed]
  25. Song, L.; Jiang, J.; Li, J.; Zhou, C.; Chen, Y.; Lu, H.; He, F. The Characteristics of Microbiome and Cytokines in Healthy Implants and Peri-Implantitis of the Same Individuals. J. Clin. Med. 2022, 11, 5817. [Google Scholar] [CrossRef]
  26. Jochems, S.; Piddock, K.; Rylance, J.; Adler, H.; Carniel, B.; Collins, A.; Gritzfeld, J.; Hancock, C.; Hill, H.; Reine, J.; et al. Novel analysis of immune cells from nasal microbiopsy demonstrates reliable, reproducible data for immune populations, and superior cytokine detection compared to nasal wash. PLoS ONE 2017, 12, e0169805. [Google Scholar] [CrossRef]
  27. Hedley, B.; Cheng, G.; Keeney, M.; Kern, W.; Padurean, A.; Luider, J.; Chin-Yee, I.; Lowes, L.; Rohrbach, J.; Ortega, R.; et al. A multicenter study evaluation of the ClearLLab 10C panels. Cytom. Part B Clin. Cytom. 2021, 100, 225–234. [Google Scholar] [CrossRef] [PubMed]
  28. Lurier, E.; Dalton, D.; Dampier, W.; Raman, P.; Nassiri, S.; Ferraro, N.; Rajagopalan, R.; Sarmady, M.; Spiller, K. Transcriptome analysis of IL-10-stimulated (M2c) macrophages by next-generation sequencing. Immunobiology 2017, 222, 847–856. [Google Scholar] [CrossRef] [Green Version]
  29. Vuorela, A.; Freitag, T.; Leskinen, K.; Pessa, H.; Härkönen, T.; Stracenski, I.; Kirjavainen, T.; Olsen, P.; Saarenpää-Heikkilä, O.; Ilonen, J.; et al. Enhanced influenza A H1N1 T cell epitope recognition and cross-reactivity to protein-O-mannosyltransferase 1 in Pandemrix-associated narcolepsy type 1. Nat. Commun. 2021, 12, 2283. [Google Scholar] [CrossRef]
  30. Bispo, E.; Silva-Carvalho, A.; Sousa, M.; Neves, F.; Carvalho, J.; Arganaraz, E.; Saldanha-Araujo, F. Differential peripheral blood mononuclear cell reactivity against SARS-CoV-2 proteins in naive and previously infected subjects following COVID-19 vaccination. Clin. Immunol. Commun. 2022, 2, 172–176. [Google Scholar] [CrossRef]
  31. Bausch-Fluck, D.; Hofmann, A.; Bock, T.; Frei, A.; Cerciello, F.; Jacobs, A.; Moest, H.; Omasits, U.; Gundry, R.; Yoon, C.; et al. A mass spectrometric-derived cell surface protein atlas. PLoS ONE 2015, 10, e0121314. [Google Scholar] [CrossRef] [PubMed] [Green Version]
  32. Shannon, P.; Markiel, A.; Ozier, O.; Baliga, N.; Wang, J.; Ramage, D.; Amin, N.; Schwikowski, B.; Ideker, T. Cytoscape: A software environment for integrated models of biomolecular interaction networks. Genome Res. 2003, 13, 2498–2504. [Google Scholar] [CrossRef] [PubMed]
  33. Doyle, W.; Skoner, D.; Gentile, D. Nasal cytokines as mediators of illness during the common cold. Curr. Allergy Asthma Rep. 2005, 5, 173–181. [Google Scholar] [CrossRef] [PubMed]
  34. Patel, J.; Nair, S.; Revai, K.; Grady, J.; Chonmaitree, T. Nasopharyngeal acute phase cytokines in viral upper respiratory infection: Impact on acute otitis media in children. Pediatr. Infect. Dis. J. 2009, 28, 1002. [Google Scholar] [CrossRef] [Green Version]
  35. Bian, J.; Nie, W.; Zang, Y.; Fang, Z.; Xiu, Q.; Xu, X. Clinical aspects and cytokine response in adults with seasonal influenza infection. Int. J. Clin. Exp. Med. 2014, 7, 5593. [Google Scholar]
  36. Lopez, S.; Shaikh, N.; Johnson, M.; Liu, H.; Martin, J.; Williams, J. Viral Coinfection and Nasal Cytokines in Children With Clinically Diagnosed Acute Sinusitis. Front. Pediatr. 2022, 9, 1563. [Google Scholar] [CrossRef]
  37. Lee, N.; Wong, C.; Chan, P.; Chan, M.; Wong, R.; Lun, S.; Ngai, K.; Lui, G.; Wong, B.; Lee, S.; et al. Cytokine response patterns in severe pandemic 2009 H1N1 and seasonal influenza among hospitalized adults. PLoS ONE 2011, 6, e26050. [Google Scholar] [CrossRef]
  38. Coperchini, F.; Chiovato, L.; Croce, L.; Magri, F.; Rotondi, M. The cytokine storm in COVID-19: An overview of the involvement of the chemokine/chemokine-receptor system. Cytokine Growth Factor Rev. 2020, 53, 25–32. [Google Scholar] [CrossRef]
  39. Bandopadhyay, P.; D’Rozario, R.; Lahiri, A.; Sarif, J.; Ray, Y.; Paul, S.; Roy, R.; Maiti, R.; Chaudhuri, K.; Bagchi, S.; et al. Nature and dimensions of systemic hyperinflammation and its attenuation by convalescent plasma in severe COVID-19. J. Infect. Dis. 2021, 224, 565–574. [Google Scholar] [CrossRef]
  40. Takahashi, T.; Ellingson, M.; Wong, P.; Israelow, B.; Lucas, C.; Klein, J.; Silva, J.; Mao, T.; Oh, J.; Tokuyama, M.; et al. Sex differences in immune responses that underlie COVID-19 disease outcomes. Nature 2020, 588, 315–320. [Google Scholar] [CrossRef]
  41. Doerre, A.; Doblhammer, G. The influence of gender on COVID-19 infections and mortality in Germany: Insights from age-and gender-specific modeling of contact rates, infections, and deaths in the early phase of the pandemic. PLoS ONE 2022, 17, e0268119. [Google Scholar] [CrossRef]
  42. Jin, J.; Bai, P.; He, W.; Wu, F.; Liu, X.; Han, D.; Liu, S.; Yang, J. Gender differences in patients with COVID-19: Focus on severity and mortality. Front. Public Health 2020, 8, 152. [Google Scholar] [CrossRef] [PubMed]
  43. Stenvinkel, P.; Ketteler, M.; Johnson, R.; Lindholm, B.; Pecoits-Filho, R.; Riella, M.; Heimbürger, O.; Cederholm, T.; Girndt, M. IL-10, IL-6, and TNF-α: Central factors in the altered cytokine network of uremia—The good, the bad, and the ugly. Kidney Int. 2005, 67, 1216–1233. [Google Scholar] [CrossRef] [Green Version]
  44. Zhong, W.; Jiang, Y.; Ma, H.; Wu, J.; Jiang, Z.; Zhao, L. Elevated levels of CCR6+ T helper 22 cells correlate with skin and renal impairment in systemic lupus erythematosus. Sci. Rep. 2017, 7, 1–11. [Google Scholar] [CrossRef] [Green Version]
  45. Galván-Peña, S.; Leon, J.; Chowdhary, K.; Michelson, D.; Vijaykumar, B.; Yang, L.; Magnuson, A.; Chen, F.; Manickas-Hill, Z.; Piechocka-Trocha, A.; et al. Profound Treg perturbations correlate with COVID-19 severity. Proc. Natl. Acad. Sci. USA 2021, 118, e2111315118. [Google Scholar] [CrossRef]
  46. Borthwick, N.; Lowdell, M.; Salmon, M.; Akbar, A. Loss of CD28 expression on CD8+ T cells is induced by IL-2 receptor γ chain signalling cytokines and type I IFN, and increases susceptibility to activation-induced apoptosis. Int. Immunol. 2000, 12, 1005–1013. [Google Scholar] [CrossRef] [PubMed] [Green Version]
  47. Xu, M.; Ménoret, A.; Nicholas, S.; Günther, S.; Sundberg, E.; Zhou, B.; Rodriguez, A.; Murphy, P.; Vella, A. Direct CD137 costimulation of CD8 T cells promotes retention and innate-like function within nascent atherogenic foci. Am. J. -Physiol.-Heart Circ. Physiol. 2019, 316, H1480–H1494. [Google Scholar] [CrossRef] [PubMed]
  48. Files, J.; Boppana, S.; Perez, M.; Sarkar, S.; Lowman, K.; Qin, K.; Sterrett, S.; Carlin, E.; Bansal, A.; Sabbaj, S.; et al. Sustained cellular immune dysregulation in individuals recovering from SARS-CoV-2 infection. J. Clin. Investig. 2021, 131, e140491. [Google Scholar] [CrossRef] [PubMed]
  49. Effros, R. Loss of CD28 expression on T lymphocytes: A marker of replicative senescence. Dev. Comp. Immunol. 1997, 21, 471–478. [Google Scholar] [CrossRef]
  50. Pontelli, M.; Castro, I.; Martins, R.; Veras, F.; La Serra, L.; Nascimento, D.; Cardoso, R.; Rosales, R.; Lima, T.; Souza, J.; et al. Infection of human lymphomononuclear cells by SARS-CoV-2. BioRxiv 2020. [Google Scholar] [CrossRef]
  51. Hsu, R.; Yu, W.; Peng, G.; Ye, C.; Hu, S.; Chong, P.; Yap, K.; Lee, J.; Lin, W.; Yu, S. The role of cytokines and chemokines in severe acute respiratory syndrome coronavirus 2 infections. Front. Immunol. 2022, 13, 832394. [Google Scholar] [CrossRef] [PubMed]
  52. Darif, D.; Hammi, I.; Kihel, A.; Saik, I.; Guessous, F.; Akarid, K. The pro-inflammatory cytokines in COVID-19 pathogenesis: What goes wrong? Microb. Pathog. 2021, 153, 104799. [Google Scholar] [CrossRef] [PubMed]
  53. Costela-Ruiz, V.; Illescas-Montes, R.; Puerta-Puerta, J.; Ruiz, C.; Melguizo-Rodrıiguez, L. SARS-CoV-2 infection: The role of cytokines in COVID-19 disease. Cytokine Growth Factor Rev. 2020, 54, 62–75. [Google Scholar] [CrossRef] [PubMed]
  54. Tang, Y.; Liu, J.; Zhang, D.; Xu, Z.; Ji, J.; Wen, C. Cytokine storm in COVID-19: The current evidence and treatment strategies. Front. Immunol. 2020, 11, 1708. [Google Scholar] [CrossRef]
  55. Merad, M.; Martin, J. Pathological inflammation in patients with COVID-19: A key role for monocytes and macrophages. Nat. Rev. Immunol. 2020, 20, 355–362. [Google Scholar] [CrossRef]
  56. Feng, Z.; Diao, B.; Wang, R.; Wang, G.; Wang, C.; Tan, Y.; Liu, L.; Wang, C.; Liu, Y.; Liu, Y.; et al. The novel severe acute respiratory syndrome coronavirus 2 (SARS-CoV-2) directly decimates human spleens and lymph nodes. MedRxiv, 2020; in press. [Google Scholar] [CrossRef] [Green Version]
  57. Torres-Castro, I.; Arroyo-Camarena, U.; Martıinez-Reyes, C.; Gomez-Arauz, A.; Duenas-Andrade, Y.; Hern ez-Ruiz, J.; Bejar, Y.; Zaga-Clavellina, V.; Morales-Montor, J.; Terrazas, L.; et al. Human monocytes and macrophages undergo M1-type inflammatory polarization in response to high levels of glucose. Immunol. Lett. 2016, 176, 81–89. [Google Scholar] [CrossRef]
  58. Lee, J.; Boyce, S.; Powers, J.; Baer, C.; Sassetti, C.; Behar, S. CD11cHi monocyte-derived macrophages are a major cellular compartment infected by Mycobacterium tuberculosis. PLoS Pathog. 2020, 16, e1008621. [Google Scholar] [CrossRef]
  59. Palipane, M.; Snyder, J.; LeMessurier, K.; Schofield, A.; Woolard, S.; Samarasinghe, A. Macrophage CD14 impacts immune defenses against influenza virus in allergic hosts. Microb. Pathog. 2019, 127, 212–219. [Google Scholar] [CrossRef]
  60. Perussia, B.; Ravetch, J. FcγRIII (CD16) on human macrophages is a functional product of the FcγRIII-2 gene. Eur. J. Immunol. 1991, 21, 425–429. [Google Scholar] [CrossRef]
  61. Ziegler-Heitbrock, H.; Fingerle, G.; Ströbel, M.; Schraut, W.; Stelter, F.; Schütt, C.; Passlick, B.; Pforte, A. The novel subset of CD14+/CD16+ blood monocytes exhibits features of tissue macrophages. Eur. J. Immunol. 1993, 23, 2053–2058. [Google Scholar] [CrossRef] [PubMed]
  62. Ito, Y.; Kitakawa, M.; Koshikawa, S.; Watanabe, H.; Sueki, H. CD14 and CD16 expression in noninfectious granulomatous skin diseases. J. Cutan. Immunol. Allergy 2020, 3, 10–16. [Google Scholar] [CrossRef]
  63. Dong, L.; Wang, S.; Chen, M.; Li, H.; Bi, W. The activation of macrophage and upregulation of CD40 costimulatory molecule in lipopolysaccharide-induced acute lung injury. J. Biomed. Biotechnol. 2008, 2008, 852571. [Google Scholar] [CrossRef] [PubMed] [Green Version]
  64. Niles, M.; Gogesch, P.; Kronhart, S.; Ortega, I.S.; Kochs, G.; Waibler, Z.; Anzaghe, M. Macrophages and dendritic cells are not the major source of pro-inflammatory cytokines upon SARS-CoV-2 infection. Front. Immunol. 2021, 12, 647824. [Google Scholar] [CrossRef] [PubMed]
  65. Chen, S.; Park, M.; Del Valle, D.; Buckup, M.; Tabachnikova, A.; Simons, N.; Mouskas, K.; Lee, B.; Geanon, D.; D’Souza, D.; et al. Shift of lung macrophage composition is associated with COVID-19 disease severity and recovery. BioRxiv 2022. [Google Scholar] [CrossRef]
  66. Salina, A.; Santos, D.; Rodrigues, T.; Fortes-Rocha, M.; Freitas-Filho, E.; Alzamora-Terrel, D.; Castro, I.; Fraga, T.; Lima, M.; Nascimento, D.; et al. Efferocytosis of SARS-CoV-2-infected dying cells impairs macrophage anti-inflammatory programming and continual clearance of apoptotic cells. eLife 2022, 11, e74443. [Google Scholar] [CrossRef] [PubMed]
  67. Julia, A.; Bonafonte-Pardas, I.; Gomez, A.; Lopez-Lasanta, M.; Lopez-Corbeto, M.; Martinez-Mateu, S.; Llados, J.; Rodriguez-Nunez, I.; Myers, R.; Marsal, S. Targeting of the CD80/86 proinflammatory axis as a therapeutic strategy to prevent severe COVID-19. Sci. Rep. 2021, 11, 1–14. [Google Scholar] [CrossRef]
  68. Horenstein, A.; Faini, A.; Malavasi, F. CD38 in the age of COVID-19: A medical perspective. Physiol. Rev. 2021, 101, 1457–1486. [Google Scholar] [CrossRef]
  69. Amici, S.; Young, N.; Narvaez-Mir, J.; Jablonski, K.; Arcos, J.; Rosas, L.; Papenfuss, T.; Torrelles, J.; Jarjour, W.; Arellano, M. CD38 is robustly induced in human macrophages and monocytes in inflammatory conditions. Front. Immunol. 2018, 9, 1593. [Google Scholar] [CrossRef] [Green Version]
  70. Lam, J.; Ng, H.; Lim, C.; Sim, X.; Malavasi, F.; Li, H.; Loh, J.; Sabai, K.; Kim, J.; Ong, C.; et al. Expression of CD38 on macrophages predicts improved prognosis in hepatocellular carcinoma. Front. Immunol. 2019, 10, 2093. [Google Scholar] [CrossRef] [Green Version]
  71. Bonam, S.; Chauvin, C.; Mathew, M.; Bayry, J. IFN-γ Induces PD-L1 Expression in Primed Human Basophils. Cells 2022, 11, 801. [Google Scholar] [CrossRef]
  72. Kammala, A.; Syed, M.; Yang, C.; Occhiuto, C.; Subramanian, H. A Critical Role for Na+/H+ Exchanger Regulatory Factor 1 in Modulating FcεRI-Mediated Mast Cell Activation. J. Immunol. 2021, 206, 471–480. [Google Scholar] [CrossRef]
  73. Zhang, Q.; Gefter, J.; Sneddon, W.; Mamonova, T.; Friedman, P. ACE2 interaction with cytoplasmic PDZ protein enhances SARS-CoV-2 invasion. IScience 2021, 24, 102770. [Google Scholar] [CrossRef]
  74. Abdel, H.R.; Cormet-Boyaka, E.; Kuebler, W.; Uddin, M.; Berdiev, B. SARS-CoV-2 may hijack GPCR signaling pathways to dysregulate lung ion and fluid transport. Am. J. -Physiol.-Lung Cell. Mol. Physiol. 2021, 320, L430–L435. [Google Scholar] [CrossRef]
  75. Fernández-Ayala, D.; Navas, P.; Lopez-Lluch, G. Age-related mitochondrial dysfunction as a key factor in COVID-19 disease. Exp. Gerontol. 2020, 142, 111147. [Google Scholar] [CrossRef] [PubMed]
  76. Hernández-Camacho, J.; Garcia-Corzo, L.; Fernández-Ayala, D.; Navas, P.; Lopez-Lluch, G. Coenzyme Q at the Hinge of Health and Metabolic Diseases. Antioxidants 2021, 10, 1785. [Google Scholar] [CrossRef]
  77. Durante, W. Targeting Arginine in COVID-19-Induced Immunopathology and Vasculopathy. Metabolites 2022, 12, 240. [Google Scholar] [CrossRef] [PubMed]
  78. Wyler, E.; Mösbauer, K.; Franke, V.; Diag, A.; Gottula, L.; Arsiè, R.; Klironomos, F.; Koppstein, D.; Hönzke, K.; Ayoub, S.; et al. Transcriptomic profiling of SARS-CoV-2 infected human cell lines identifies HSP90 as target for COVID-19 therapy. IScience 2021, 24, 102151. [Google Scholar] [CrossRef] [PubMed]
  79. Russo, C.; Morello, G.; Malaguarnera, R.; Piro, S.; Furno, D.; Malaguarnera, L. Candidate genes of SARS-CoV-2 gender susceptibility. Sci. Rep. 2021, 11, 1–16. [Google Scholar] [CrossRef] [PubMed]
  80. Schmidt, N.; Lareau, C.; Keshishian, H.; Ganskih, S.; Schneider, C.; Hennig, T.; Melanson, R.; Werner, S.; Wei, Y.; Zimmer, M.; et al. The SARS-CoV-2 RNA–protein interactome in infected human cells. Nat. Microbiol. 2021, 6, 339–353. [Google Scholar] [CrossRef]
  81. Park, J.; Kim, H.; Kim, S.; Kim, Y.; Lee, J.; Dan, K.; Seong, M.; Han, D. In-depth blood proteome profiling analysis revealed distinct functional characteristics of plasma proteins between severe and non-severe COVID-19 patients. Sci. Rep. 2020, 10, 1–10. [Google Scholar] [CrossRef]
  82. Guarnieri, J.; Dybas, J.; Fazelinia, H.; Kim, M.; Frere, J.; Zhang, Y.; Albrecht, Y.; Murdock, D.; Angelin, A.; Singh, L.; et al. Targeted down regulation of core mitochondrial genes during SARS-CoV-2 infection. BioRxiv, 2022; preprint. [Google Scholar] [CrossRef]
  83. Srivastava, R.; Daulatabad, S.; Srivastava, M.; Janga, S. Role of SARS-CoV-2 in altering the RNA-binding protein and miRNA-directed post-transcriptional regulatory networks in humans. Int. J. Mol. Sci. 2020, 21, 7090. [Google Scholar] [CrossRef] [PubMed]
  84. Ahern, D.; Ai, Z.; Ainsworth, M.; Allan, C.; Allcock, A.; Ansari, A.; Arancibia-Carcamo, C.; Aschenbrenner, D.; Attar, M.; Baillie, J.; et al. A blood atlas of COVID-19 defines hallmarks of disease severity and specificity. MedRxiv 2021. [Google Scholar] [CrossRef] [PubMed]
  85. Brown, C.; Morham, S.; Walsh, D.; Naghavi, M. Focal adhesion proteins talin-1 and vinculin negatively affect paxillin phosphorylation and limit retroviral infection. J. Mol. Biol. 2011, 410, 761–777. [Google Scholar] [CrossRef]
  86. Nathan, K.; Lal, S. The multifarious role of 14–3-3 family of proteins in viral replication. Viruses 2020, 12, 436. [Google Scholar] [CrossRef] [Green Version]
  87. Souza, D.; Guest, P.; Mann, D.; Roeber, S.; Rahmoune, H.; Bauder, C.; Kretzschmar, H.; Volk, B.; Baborie, A.; Bahn, S. Proteomic analysis identifies dysfunction in cellular transport, energy, and protein metabolism in different brain regions of atypical frontotemporal lobar degeneration. J. Proteome Res. 2012, 11, 2533–2543. [Google Scholar] [CrossRef]
  88. Chan, C.; Wong, S.; Lam, M.; Hui, E.; Chan, J.; Lo, E.; Cheuk, W.; Wong, M.; Tsao, S.; Chan, A. Proteomic comparison of nasopharyngeal cancer cell lines C666-1 and NP69 identifies down-regulation of annexin II and β2-tubulin for nasopharyngeal carcinoma. Arch. Pathol. Lab. Med. 2008, 132, 675–683. [Google Scholar] [CrossRef]
  89. Danielsson, F.; Peterson, M.; Caldeira, A.H.; Lautenschläger, F.; Gad, A. Vimentin diversity in health and disease. Cells 2018, 7, 147. [Google Scholar] [CrossRef] [PubMed] [Green Version]
  90. Li, Z.; Paulin, D.; Lacolley, P.; Coletti, D.; Agbulut, O. Vimentin as a target for the treatment of COVID-19. BMJ Open Respir. Res. 2020, 7, e000623. [Google Scholar] [CrossRef] [PubMed]
  91. Amraei, R.; Xia, C.; Olejnik, J.; White, M.; Napoleon, M.; Lotfollahzadeh, S.; Hauser, B.; Schmidt, A.; Chitalia, V.; Mühlberger, E.; et al. Extracellular vimentin is an attachment factor that facilitates SARS-CoV-2 entry into human endothelial cells. Proc. Natl. Acad. Sci. USA 2022, 119, e2113874119. [Google Scholar] [CrossRef]
  92. Saadat, M. The morbidity and mortality of COVID-19 are correlated with the Ile105Val glutathione S-transferase P1 polymorphism. Egypt. J. Med Hum. Genet. 2020, 21, 1–5. [Google Scholar] [CrossRef]
  93. Djukic, T.; Stevanovic, G.; Coric, V.; Bukumiric, Z.; Pljesa-Ercegovac, M.; Matic, M.; Jerotic, D.; Todorovic, N.; Asanin, M.; Ercegovac, M.; et al. GSTO1, GSTO2 and ACE2 Polymorphisms Modify Susceptibility to Developing COVID-19. J. Pers. Med. 2022, 12, 458. [Google Scholar] [CrossRef]
  94. Coric, V.; Milosevic, I.; Djukic, T.; Bukumiric, Z.; Savic-Radojevic, A.; Matic, M.; Jerotic, D.; Todorovic, N.; Asanin, M.; Ercegovac, M.; et al. GSTP1 and GSTM3 variant alleles affect susceptibility and severity of COVID-19. Front. Mol. Biosci. 2021, 8, 747493. [Google Scholar] [CrossRef]
  95. Simons, P.; Rinaldi, D.; Bondu, V.; Kell, A.; Bradfute, S.; Lidke, D.; Buranda, T. Integrin activation is an essential component of SARS-CoV-2 infection. Sci. Rep. 2021, 11, 1–12. [Google Scholar] [CrossRef]
  96. Atik, N.; Wirawan, F.; Amalia, R.; Khairani, A.; Pradini, G. Differences in endosomal Rab gene expression between positive and negative COVID-19 patients. BMC Res. Notes 2022, 15, 1–5. [Google Scholar] [CrossRef] [PubMed]
  97. Yuan, Z.; Cheng, L.; Wang, Z.; Wu, Y. Desmoplakin and clinical manifestations of desmoplakin cardiomyopathy. Chin. Med. J. 2021, 134, 1771–1779. [Google Scholar] [CrossRef] [PubMed]
  98. Hok, L.; Rimac, H.; Mavri, J.; Vianello, R. COVID-19 infection and neurodegeneration: Computational evidence for interactions between the SARS-CoV-2 spike protein and monoamine oxidase enzymes. Comput. Struct. Biotechnol. J. 2022, 20, 1254–1263. [Google Scholar] [CrossRef]
  99. Wyles, J.; McMaster, C.; Ridgway, N. Vesicle-associated membrane protein-associated protein-A (VAP-A) interacts with the oxysterol-binding protein to modify export from the endoplasmic reticulum. J. Biol. Chem. 2002, 277, 29908–29918. [Google Scholar] [CrossRef] [Green Version]
  100. Galber, C.; Carissimi, S.; Baracca, A.; Giorgio, V. The ATP synthase deficiency in human diseases. Life 2021, 11, 325. [Google Scholar] [CrossRef]
  101. Panfoli, I.; Esposito, A. Beneficial effect of polyphenols in COVID-19 and the ectopic F1FO-ATP synthase: Is there a link? J. Cell. Biochem. 2022, 123, 1281–1284. [Google Scholar] [CrossRef] [PubMed]
  102. Kanehisa, M.; Furumichi, M.; Tanabe, M.; Sato, Y.; Morishima, K. KEGG: New perspectives on genomes, pathways, diseases and drugs. Nucleic Acids Res. 2017, 45, D353–D361. [Google Scholar] [CrossRef] [PubMed] [Green Version]
  103. Krishnan, S.; Nordqvist, H.; Ambikan, A.; Gupta, S.; Sperk, M.; Svensson-Akusjärvi, S.; Mikaeloff, F.; Benfeitas, R.; Saccon, E.; Ponnan, S.; et al. Metabolic perturbation associated with COVID-19 disease severity and SARS-CoV-2 replication. Mol. Cell. Proteom. 2021, 20, 100159. [Google Scholar] [CrossRef] [PubMed]
  104. Ceperuelo-Mallafré, V.; Reverté, L.; Peraire, J.; Madeira, A.; Maymo-Masip, E.; Lopez-Dupla, M.; Gutierrez-Valencia, A.; Ruiz-Mateos, E.; Buzon, M.; Jorba, R.; et al. Circulating pyruvate is a potent prognostic marker for critical COVID-19 outcomes. Front Immunol. 2022, 13, 912579. [Google Scholar] [CrossRef]
  105. Yoo, J.; Sasaki, M.; Cho, S.; Kasuga, Y.; Zhu, B.; Ouda, R.; Orba, Y.; Figueiredo, P.; Sawa, H.; Kobayashi, K. SARS-CoV-2 inhibits induction of the MHC class I pathway by targeting the STAT1-IRF1-NLRC5 axis. Nat. Commun. 2021, 12, 1–17. [Google Scholar] [CrossRef]
  106. Choudhury, I.; Han, H.; Manthani, K.; Gandhi, S.; Dabhi, R. COVID-19 as a possible cause of functional exhaustion of CD4 and CD8 T-cells and persistent cause of methicillin-sensitive Staphylococcus aureus bacteremia. Cureus 2020, 12, e9000. [Google Scholar] [CrossRef]
  107. Abramenko, N.; Vellieux, F.; Tesařová, P.; Kejik, Z.; Kaplánek, R.; Lacina, L.; Dvořánková, B.; Rösel, D.; Brábek, J.; Tesař, A.; et al. Estrogen Receptor Modulators in Viral Infections Such as SARS-CoV-2: Therapeutic Consequences. Int. J. Mol. Sci. 2021, 22, 6551. [Google Scholar] [CrossRef]
  108. Ansone, L.; Briviba, M.; Silamikelis, I.; Terentjeva, A.; Perkons, I.; Birzniece, L.; Rovite, V.; Rozentale, B.; Viksna, L.; Kolesova, O.; et al. Amino Acid Metabolism is Significantly Altered at the Time of Admission in Hospital for Severe COVID-19 Patients: Findings from Longitudinal Targeted Metabolomics Analysis. Microbiol. Spectr. 2021, 9, e00338-21. [Google Scholar] [CrossRef]
  109. Deb, S.; Arrighi, S. Potential effects of COVID-19 on cytochrome P450-mediated drug metabolism and disposition in infected patients. Eur. J. Drug Metab. Pharmacokinet. 2021, 46, 185–203. [Google Scholar] [CrossRef]
  110. Aluganti Narasimhulu, C.; Singla, D. Mechanisms of COVID-19 pathogenesis in diabetes. Am. J. -Physiol.-Heart Circ. Physiol. 2022, 323, H403–H420. [Google Scholar] [CrossRef]
  111. Dorantes, J.; Lopez-Becerril, J.; Zavala-Cerna, M. Fatal attraction: Intestinal amebiasis and COVID-19 as risk factors for colonic perforation. J. Surg. Case Rep. 2021, 2021, rjab301. [Google Scholar] [CrossRef]
  112. Consortium, G. The Gene Ontology (GO) database and informatics resource. Nucleic Acids Res. 2004, 32, D258–D261. [Google Scholar] [CrossRef] [Green Version]
  113. Mukund, K.; Nayak, P.; Ashokkumar, C.; Rao, S.; Almeda, J.; Betancourt-Garcia, M.; Sindhi, R.; Subramaniam, S. Immune Response in Severe and Non-Severe Coronavirus Disease 2019 (COVID-19) Infection: A Mechanistic Landscape. Front. Immunol. 2021, 12, 738073. [Google Scholar] [CrossRef] [PubMed]
  114. Daamen, A.; Bachali, P.; Owen, K.; Kingsmore, K.; Hubbard, E.; Labonte, A.; Robl, R.; Shrotri, S.; Grammer, A.; Lipsky, P. Comprehensive transcriptomic analysis of COVID-19 blood, lung, and airway. Sci. Rep. 2021, 11, 1–19. [Google Scholar] [CrossRef] [PubMed]
  115. Vasudevan, S.; Baraniuk, J. Understanding COVID-19 Pathogenesis: A Drug-Repurposing Effort to Disrupt Nsp-1 Binding to Export Machinery Receptor Complex. Pathogens 2021, 10, 1634. [Google Scholar] [CrossRef]
  116. Bojkova, D.; Costa, R.; Reus, P.; Bechtel, M.; Jaboreck, M.; Olmer, R.; Martin, U.; Ciesek, S.; Michaelis, M.; Cinatl, J., Jr. Targeting the pentose phosphate pathway for SARS-CoV-2 therapy. Metabolites 2021, 11, 699. [Google Scholar] [CrossRef]
  117. Beltrami, A.; De Martino, M.; Dalla, E.; Malfatti, M.; Caponnetto, F.; Codrich, M.; Stefanizzi, D.; Fabris, M.; Sozio, E.; D’Aurizio, F.; et al. Combining Deep Phenotyping of Serum Proteomics and Clinical Data via Machine Learning for COVID-19 Biomarker Discovery. Int. J. Mol. Sci. 2022, 23, 9161. [Google Scholar] [CrossRef]
  118. Jiang, H.; Sun, H.; Gao, S.; Li, L.; Huang, S.; Hu, X.; Liu, S.; Wu, J.; Shao, Z.; Jin, W. SSBP1 Suppresses TGFβ-Driven Epithelial-to-Mesenchymal Transition and Metastasis in Triple-Negative Breast Cancer by Regulating Mitochondrial Retrograde SignalingSSBP1 Suppresses Triple-Negative Breast Cancer Metastasis. Cancer Res. 2016, 76, 952–964. [Google Scholar] [CrossRef] [PubMed] [Green Version]
  119. Broos, C.; Koth, L.; Nimwegen, M.; Paulissen, S.; Hamburg, J.; Annema, J.; Heller-Baan, R.; Kleinjan, A.; Hoogsteden, H.; Wijsenbeek, M.; et al. Increased T-helper 17.1 cells in sarcoidosis mediastinal lymph nodes. Eur. Respir. J. 2018, 51. [Google Scholar] [CrossRef] [Green Version]
  120. Ramstein, J.; Broos, C.; Simpson, L.; Ansel, K.; Sun, S.; Ho, M.; Woodruff, P.; Bhakta, N.; Christian, L.; Nguyen, C.; et al. IFN-γ–producing T-helper 17.1 cells are increased in sarcoidosis and are more prevalent than T-helper type 1 cells. Am. J. Respir. Crit. Care Med. 2016, 193, 1281–1291. [Google Scholar] [CrossRef] [Green Version]
  121. Richard, M.; Br, J.; Bestebroer, T.; Lexmond, P.; Meulder, D.; Fouchier, R.; Lowen, A.; Herfst, S. Influenza A viruses are transmitted via the air from the nasal respiratory epithelium of ferrets. Nat. Commun. 2020, 11, 1–11. [Google Scholar] [CrossRef] [Green Version]
  122. Lehtinen, M.; Hibberd, A.; Männikkö, S.; Yeung, N.; Kauko, T.; Forssten, S.; Lehtoranta, L.; Lahtinen, S.; Stahl, B.; Lyra, A.; et al. Nasal microbiota clusters associate with inflammatory response, viral load, and symptom severity in experimental rhinovirus challenge. Sci. Rep. 2018, 8, 1–12. [Google Scholar] [CrossRef] [PubMed] [Green Version]
  123. Nochi, T.; Kiyono, H. Innate immunity in the mucosal immune system. Curr. Pharm. Des. 2006, 12, 4203–4213. [Google Scholar] [CrossRef] [PubMed]
  124. Giavina-Bianchi, P.; Aun, M.; Takejima, P.; Kalil, J.; Agondi, R. United airway disease: Current perspectives. J. Asthma Allergy 2016, 9, 93. [Google Scholar] [CrossRef] [Green Version]
  125. Hua, X.; Vijay, R.; Channappanavar, R.; Athmer, J.; Meyerholz, D.; Pagedar, N.; Tilley, S.; Perlman, S. Nasal priming by a murine coronavirus provides protective immunity against lethal heterologous virus pneumonia. JCI Insight 2018, 3. [Google Scholar] [CrossRef] [Green Version]
  126. Zhang, S.; Caldeira-Dantas, S.; Smith, C.; Snyder, C. Persistent viral replication and the development of T-cell responses after intranasal infection by MCMV. Med Microbiol. Immunol. 2019, 208, 457–468. [Google Scholar] [CrossRef]
  127. Smith, N.; Goncalves, P.; Charbit, B.; Grzelak, L.; Beretta, M.; Planchais, C.; Bruel, T.; Rouilly, V.; Bondet, V.; Hadjadj, J.; et al. Distinct systemic and mucosal immune responses during acute SARS-CoV-2 infection. Nat. Immunol. 2021, 22, 1428–1439. [Google Scholar] [CrossRef]
  128. Yu, Y.; Kong, W.; Yin, Y.; Dong, F.; Huang, Z.; Yin, G.; Dong, S.; Salinas, I.; Zhang, Y.; Xu, Z. Mucosal immunoglobulins protect the olfactory organ of teleost fish against parasitic infection. PLoS Pathog. 2018, 14, e1007251. [Google Scholar] [CrossRef] [Green Version]
  129. Ter Horst, R.; Jaeger, M.; Smeekens, S.; Oosting, M.; Swertz, M.; Li, Y.; Kumar, V.; Diavatopoulos, D.; Jansen, A.; Lemmers, H.; et al. Host and environmental factors influencing individual human cytokine responses. Cell 2016, 167, 1111–1124. [Google Scholar] [CrossRef] [PubMed] [Green Version]
  130. Schwarz, M. Cytokines, neurophysiology, neuropsychology, and psychiatric symptoms. Dialogues Clin. Neurosci. 2022, 5, 139–153. [Google Scholar] [CrossRef] [PubMed]
Figure 1. Overview of the nasopharyngeal (NP) data collection and immune perturbations associated with severe COVID-19 analysis workflow.
Covid 03 00041 g001
Figure 2. SARS-CoV-2 infection in humans is associated with increased cytokine/chemokine storms in the nasopharyngeal microenvironment. (A) A cytokine storm in the nasal swabs of RT-PCR COVID-19-positive (N = 44) and -negative (N = 40) patients was measured by a bead-based multiplex assay and analysed by FLEXMAP 3D. (B) A heatmap of cytokines between COVID-19-positive and -negative patients. Mean difference for each cytokine was calculated after z-score normalization and was used as a basis for hierarchical clustering analysis. (C) Cytoscape network displays cytokine storm responses in COVID-19-positive and -negative patients, represented as hubs (squares). Each dot represents an individual. * denotes p ≤0.05, ** denotes p ≤ 0.01, *** denotes p ≤ 0.001, **** denotes p ≤ 0.0001.
Covid 03 00041 g002
Figure 3. SARS-CoV-2 infection affects major immune subsets belonging to the nasopharynx-associated lymphoid tissue (NALT) and potential links to lymphocyte-driven cytokines. (A) Frequencies of major immune subsets in nasal swabs of RT-PCR COVID-19-positive (N = 64) and -negative (N = 74) patients. (B) Intracellular cytokine expression by the nasopharyngeal lymphocytes (CD45 + ) in nasal swabs of COVID-19-positive (N = 140) and -negative (N = 148) patients. (C) Spearman correlations of nasopharyngeal lymphocytes (CD45 + ) with various intracellular cytokines between COVID-19-positive (N = 140) versus -negative (N = 148) patients. Each dot represents an individual. * denotes p ≤ 0.05, ** denotes p ≤ 0.01.
Covid 03 00041 g003
Figure 4. SARS-CoV-2 infection in humans results in broad changes in the nasopharyngeal T lymphocyte subsets. (A) RT-PCR COVID-19-positive patients showed higher Th1 (CD45 + CD4 + CCR6 CCR4 CCR10 CXCR3 + ) and Th17.1 (CD45 + CD4 + CCR6 + CCR4 CCR10 + CXCR3 + ) T-cell subpopulation frequencies and lower Th2 (CD45 + CD4 + CCR6 CCR4 + CCR10 CXCR3 ), Th22 (CD45 + CD4 + CCR6 + CCR4 + CCR10 + ), Th17 (CD45 + CD4 + CCR6 + CCR4 + CXCR3 CCR10 ), and Th9 (CD45 + CD4 + CCR6 + CCR4 ) cell subpopulation frequencies (COVID-19-positive, N = 108, and -negative, N = 109, patients) as well as (B) higher Tregs (COVID-19-positive, N = 105, and -negative, N = 112, patients). (C,D) Spearman correlations of indicated subsets with Ct value (viral load). (E) COVID-19-positive patients showed higher IFN γ + , IL-17 + , IL-21 + , and IL-10 + T-cell frequencies and lower IL-4 + T-cell frequencies (COVID-19-positive, N = 45, and -negative, N = 47, patients). Each dot represents an individual. * denotes p ≤0.05, ** denotes p ≤ 0.01, *** denotes p ≤ 0.001.
Covid 03 00041 g004
Figure 5. SARS-CoV-2 infection is associated with a decreased expression of CD28 and CD137 on CD8 + T-cells in nasal swab samples. Activation phenotypes of nasopharyngeal T-cell subset, (A) CD8 + T-cells, and (B) the fold-change of activation markers on CD8 + T-cells. (C) Activation phenotypes of CD4 + T-cells and (D) the fold-change of activation markers on CD4 + T-cells. (E) Spearman correlations between the activation markers on CD4 + and CD8 + T-cells with the age of COVID-19-positive and -negative patients. (Activation markers, CD5, CCR7, Ki67 and OX40 were studied in COVID-19-positive (N = 38) and -negative (N = 45) patients); (Activation markers, CD130, CD40L, and CD69, were studied in COVID-19-positive (N = 32) and -negative (N = 33) patients) and (Activation markers, CD137 and CD28 were studied in COVID-19-positive (N = 46) and -negative (N = 55) patients). Each dot represents an individual. * denotes p ≤0.05, ** denotes p ≤ 0.01.
Covid 03 00041 g005
Figure 6. The trimer S protein of SARS-CoV-2 variant-stimulated macrophages in vitro induce T-cell inflammatory responses, and B-cell and CD8 T-cell proliferation in distinct co-cultures. (A) The schematic diagram represents an in vitro model of human macrophage (M ϕ ) cell co-culture and stimulation conditions. (B) The heatmap demonstrates the fold-change of co-stimulatory surface molecules expressed on polarized human M ϕ (N = 8) in the presence of the trimer S proteins of SARS-CoV-2 variants and haemagglutinin/HA antigen protein from H1N1/H3N2 influenza A normalized to none (unstimulated) conditions of distinct M ϕ . (C) The heatmap demonstrates the fold-change of cytokines under stimulated conditions, the trimer S proteins of SARS-CoV-2 variants, and haemagglutinin/HA antigen protein from H1N1/H3N2 influenza A normalized to none (unstimulated) conditions of distinct M ϕ with respective cytokine conditions. (D) The proliferation of lymphocyte subsets is represented by the heatmap of the fold-change normalized to the unstimulated conditions in the presence of distinct M ϕ cell co-cultures with and without stimulations of the trimer S proteins of SARS-CoV-2 variants, and haemagglutinin/HA antigen protein from H1N1/H3N2 influenza A. Data in each experiment condition represents a co-culture of eight individual donors (M ϕ co-cultured with PBMCs/T-cells/CD8 T-cells).
Covid 03 00041 g006
Figure 7. SARS-CoV-2 infection is exacerbated in the presence of M2c-type macrophages (M ϕ ), which lead to the activation or exhaustion of CD8 T-cells in COVID-19 patients. (A) Expression of cell membrane proteins on CD8 T-cells enriched from COVID-19-positive and -negative patients. (B) Proteomic alteration-associated pathways and diseases were studied based on KEGG pathway enrichment using the clusterprofiler package in R. Analysis was conducted on differentially expressed membrane proteins on CD8 T-cells enriched from COVID-19-positive versus -negative patients, after which significantly enriched KEGG pathways were identified. (C) The schematic diagram represents an in vitro model of macrophage (M ϕ ) cells co-cultures and stimulation conditions. Data in each experimental condition represents a co-culture of eight individual donors (M ϕ co-cultured with PBMCs/T-cells/CD8 T-cells). (DF) KEGG pathway analysis shows significantly enriched pathways associated with differentially up- and down-regulated proteins on CD8 T-cells in the presence of (D) M1 macrophage conditions with the SARS-CoV-2 S protein, (E) M2a macrophage conditions with the SARS-CoV-2 S protein, and (F) M2c macrophage conditions with the SARS-CoV-2 S protein. KEGG-based enrichment analysis of DEPs (two-sided hypergeometric test; p < 0.05) and the number of counts (count > 2). KEGG terms were sorted by adjusted p values using the Benjamini–Hochberg method. (G) Comprehensive comparative protein analysis of in vitro CD8 T-cells co-cultured with trimer S protein-stimulated M ϕ subset, M2c, and CD8 T-cells from NP samples of COVID-19-positive patients. Venn diagram shows the shared proteins among differentially expressed proteins.
Covid 03 00041 g007
Figure 8. Illustration of the proposed mechanism of disease progression and modulation: Graphical summary. The graph was created with a commercial license from Shutterstock.
Covid 03 00041 g008
Disclaimer/Publisher’s Note: The statements, opinions and data contained in all publications are solely those of the individual author(s) and contributor(s) and not of MDPI and/or the editor(s). MDPI and/or the editor(s) disclaim responsibility for any injury to people or property resulting from any ideas, methods, instructions or products referred to in the content.

