
Forensic Analysis of COVID-19 Data from 198 Countries Two Years after the Pandemic Outbreak


Abstract
:1. Introduction
2. Method
2.1. Benford’s Law and Goodness-of-Fit Tests
2.2. COVID-19 Data Sampling
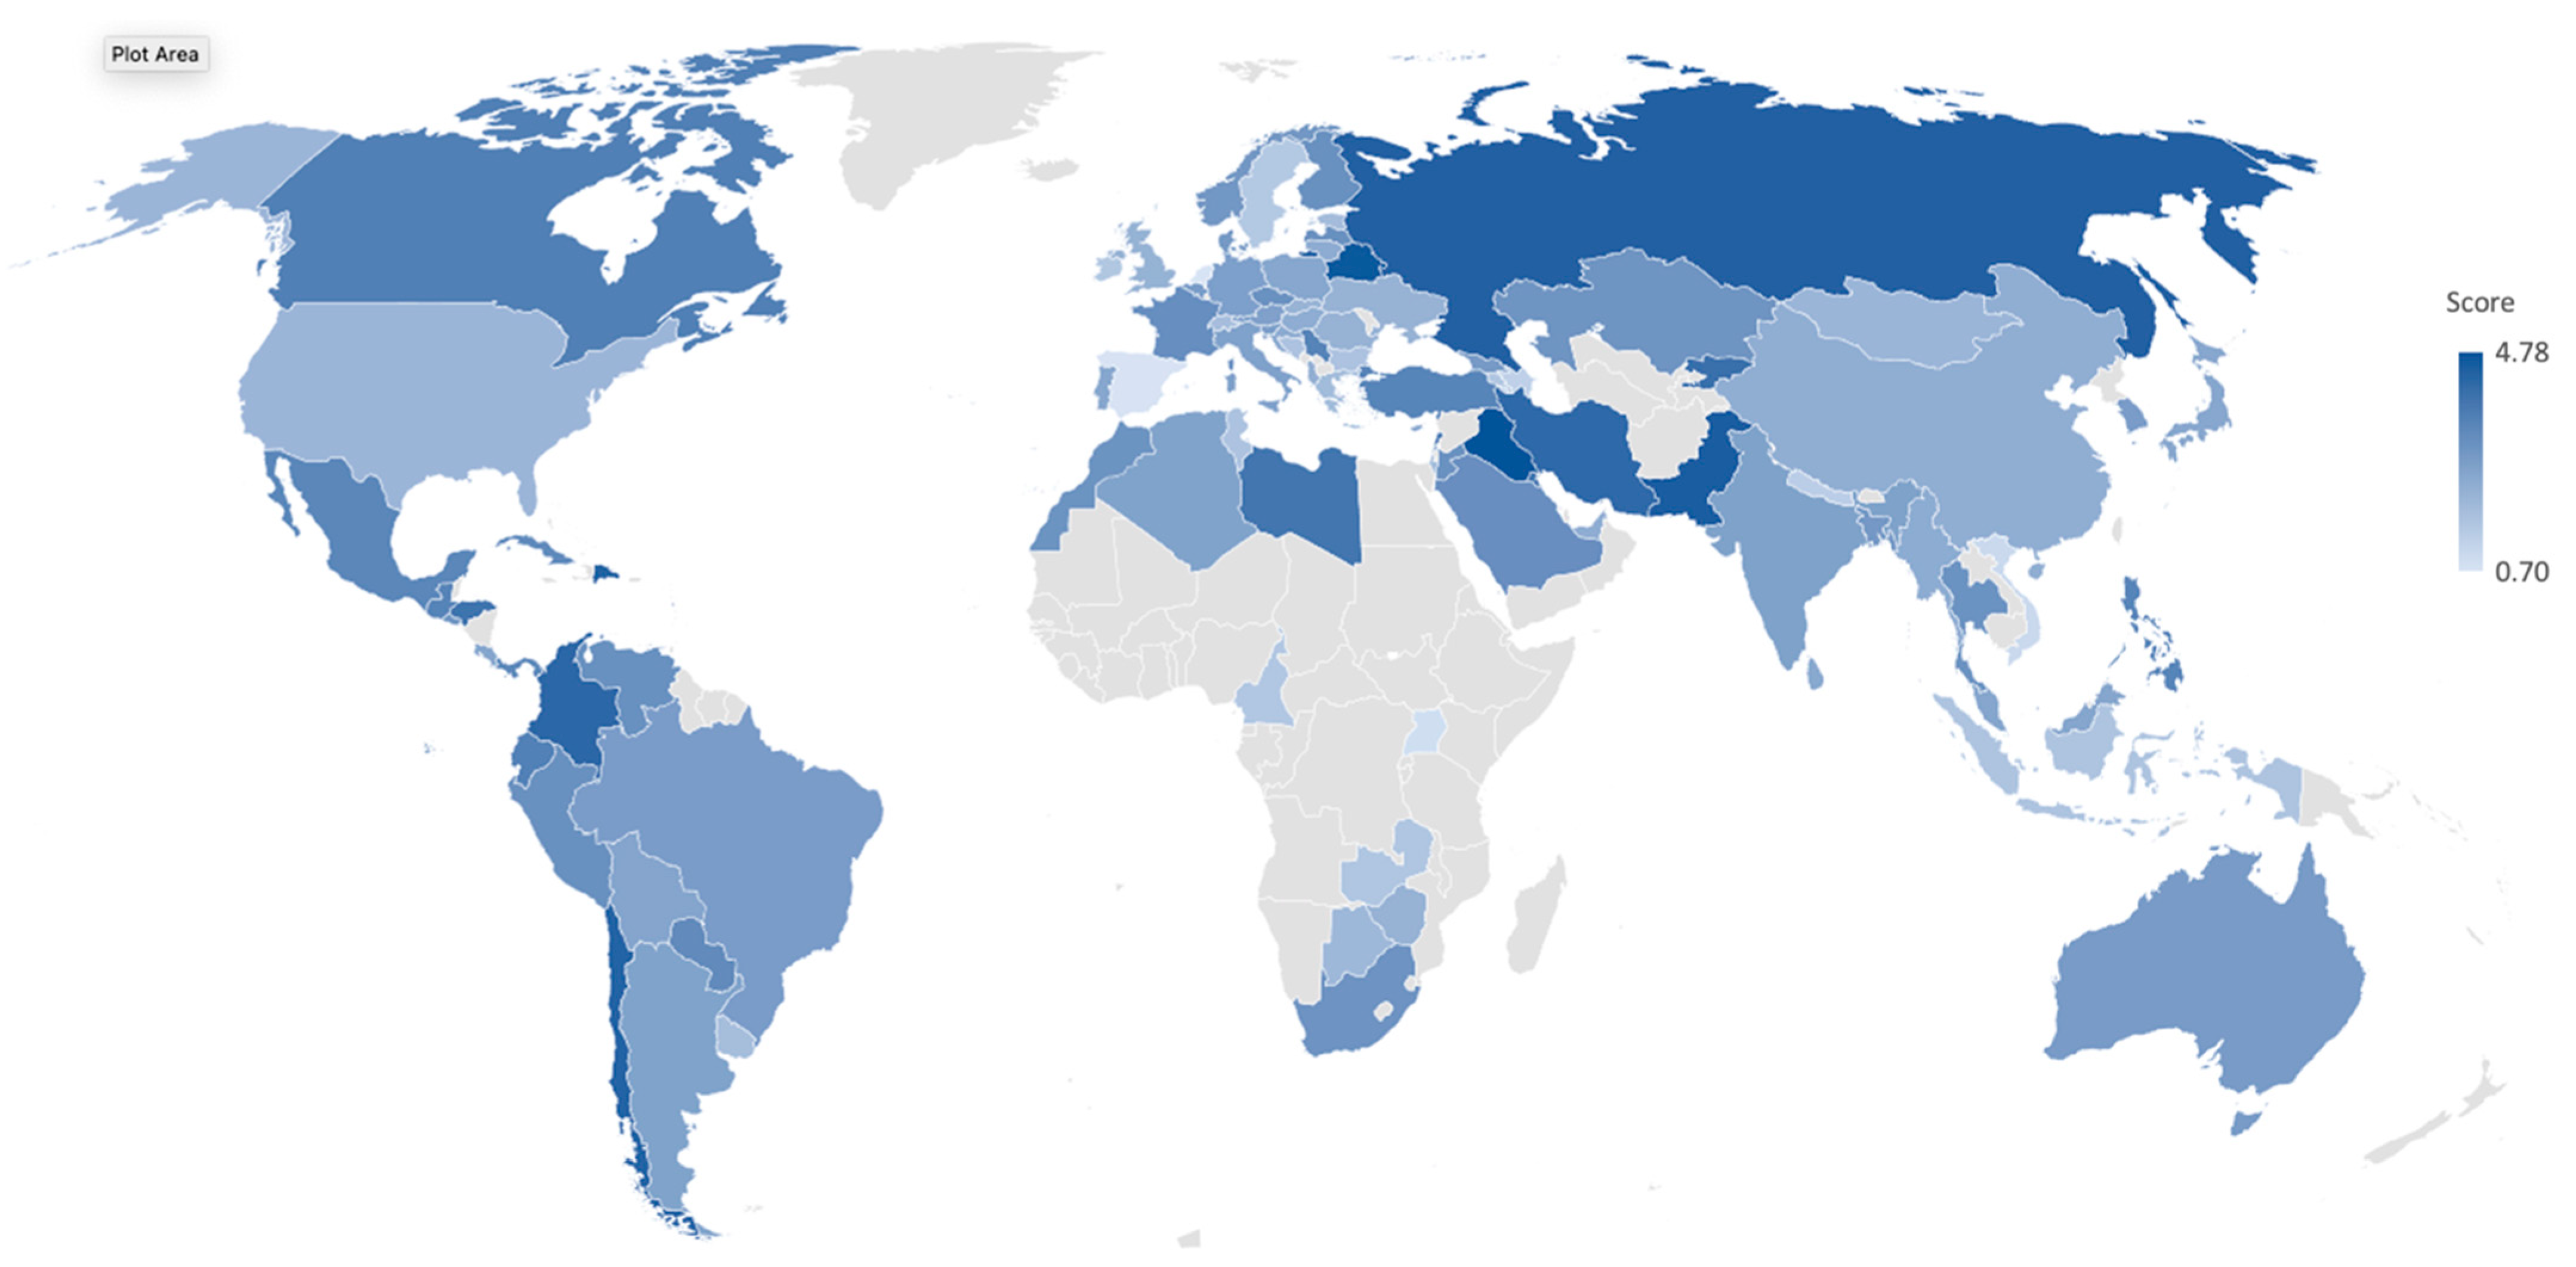
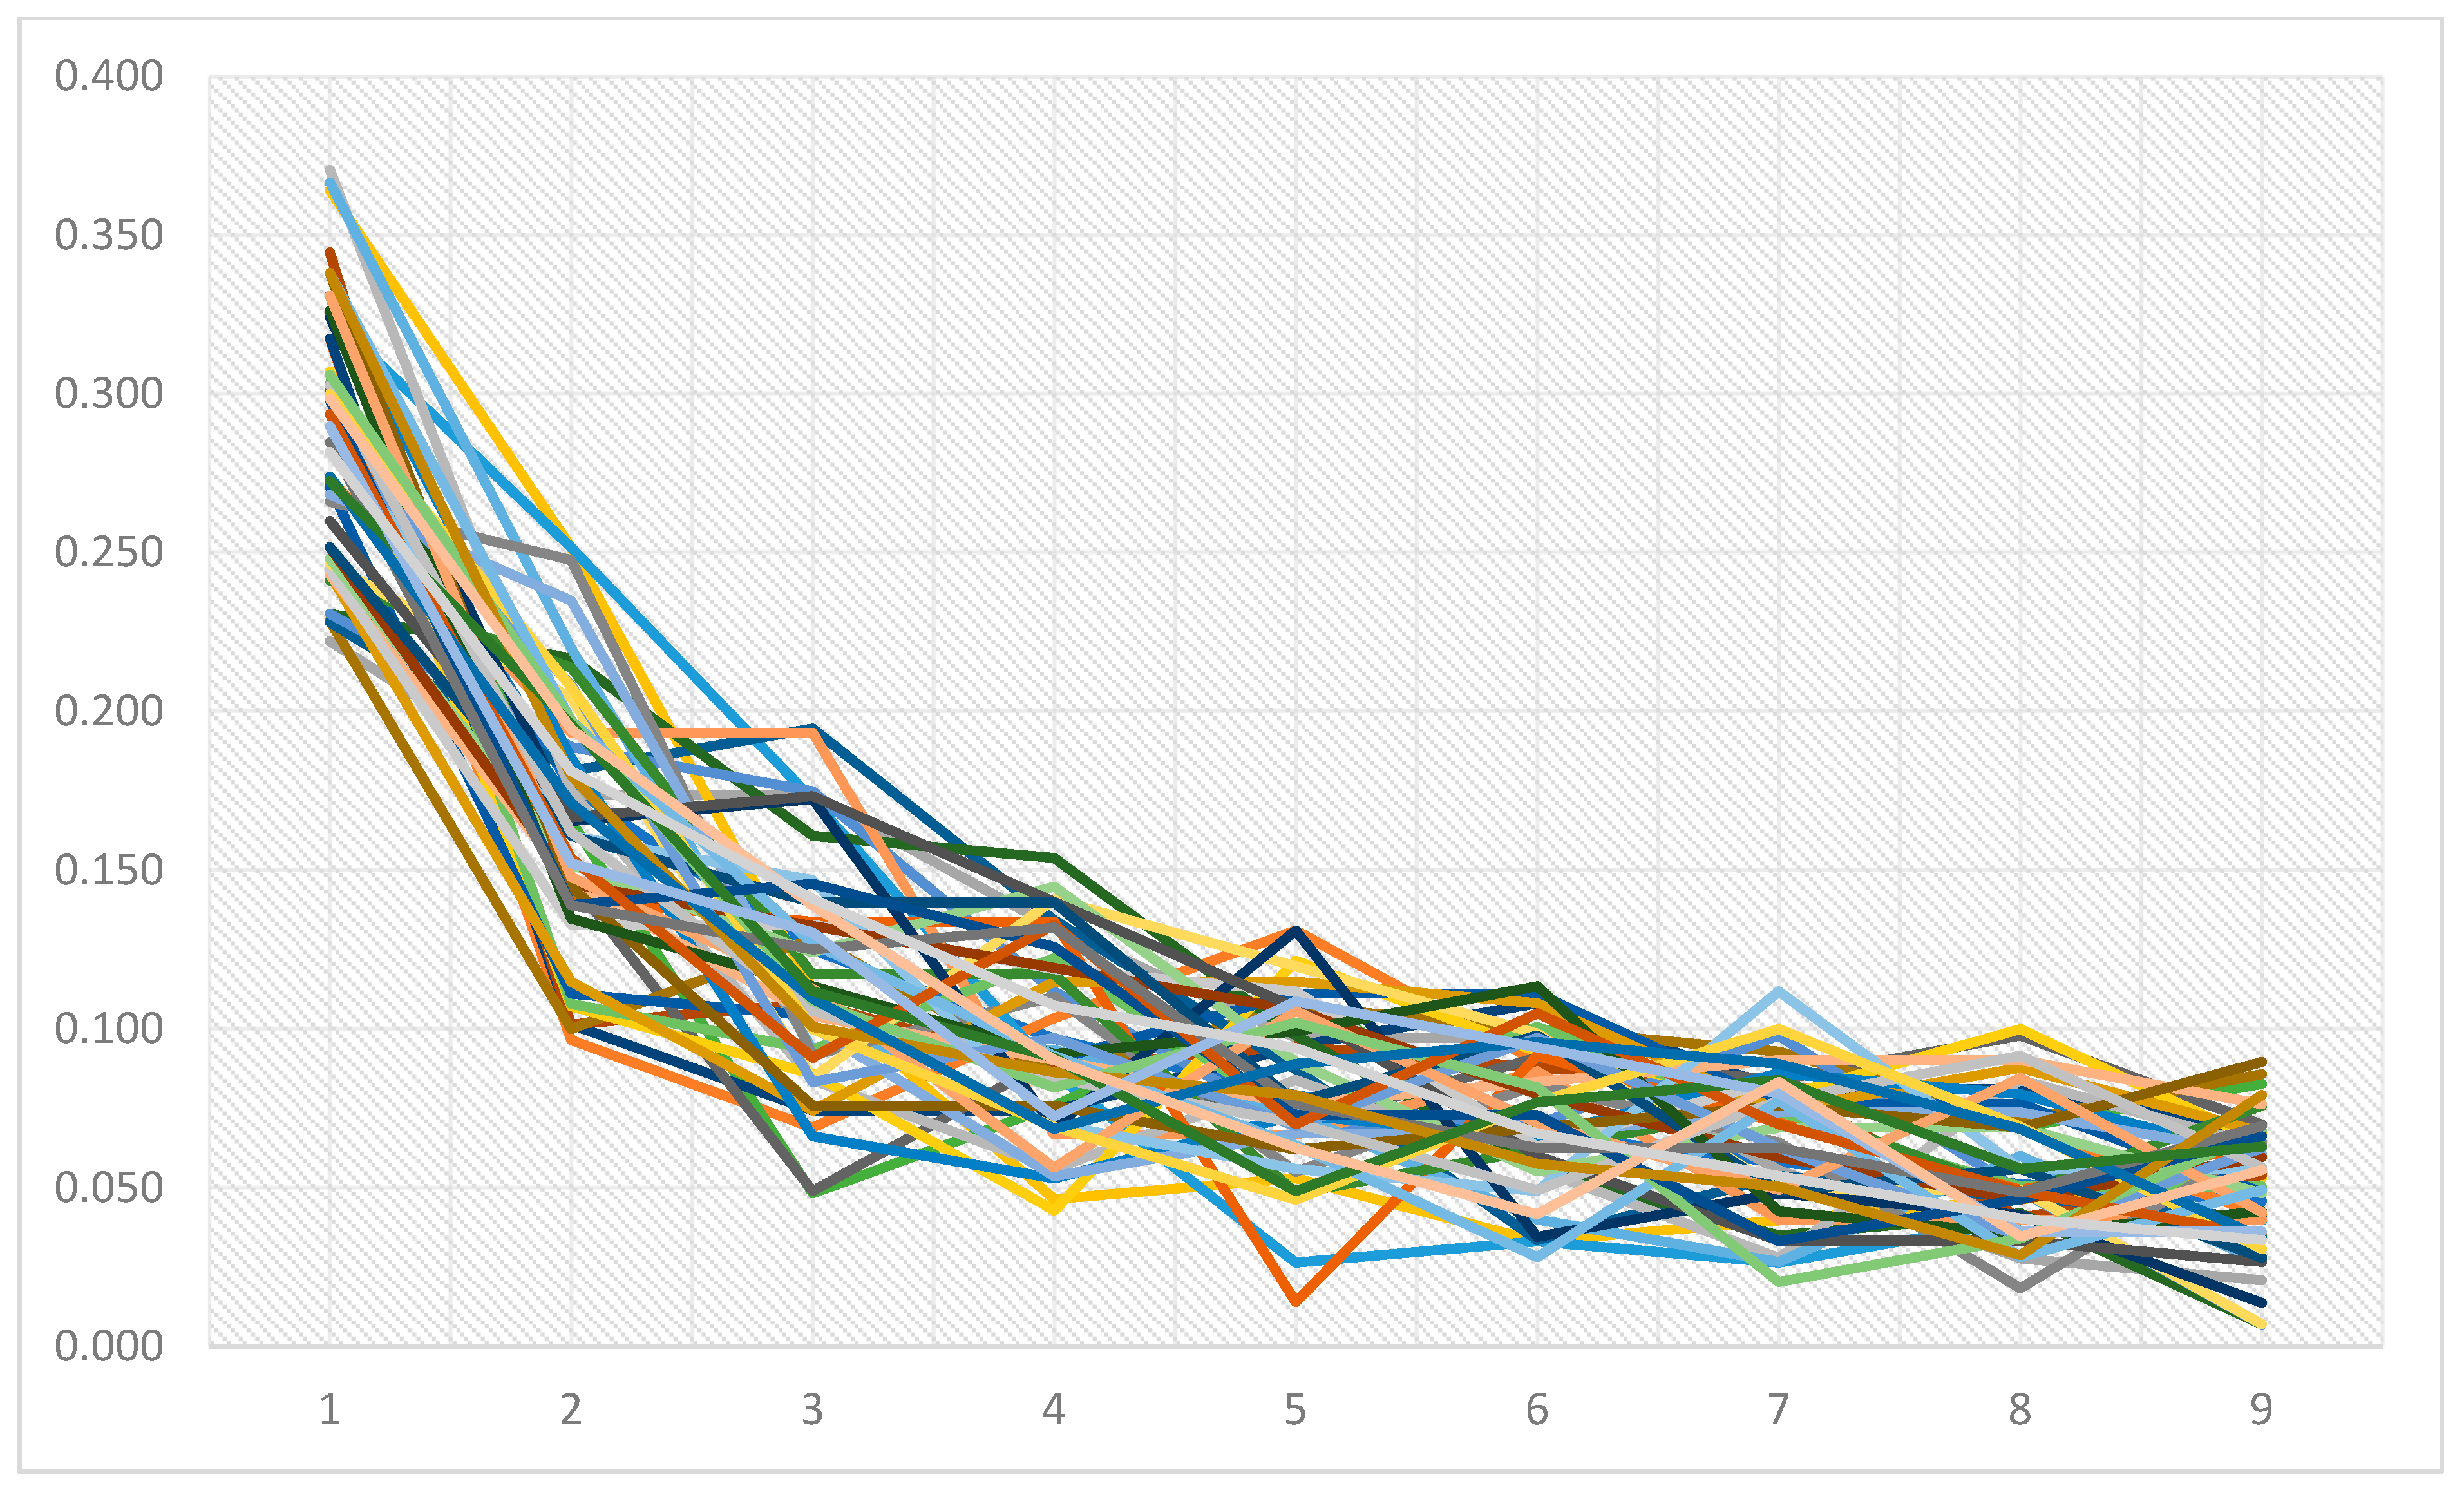
3. Results
4. Conclusions
5. Future Research
6. Limitation
Author Contributions
Funding
Institutional Review Board Statement
Informed Consent Statement
Data Availability Statement
Conflicts of Interest
References
- World Health Organization. Coronavirus Disease (COVID-19) Outbreak; WHO: Geneva, Switzerland, 2020; Available online: https://www.who.int/emergencies/diseases/novel-coronavirus-2019 (accessed on 13 June 2020).
- Farhadi, N. Cross-Industry Ecosystems; Springer: Wiesbaden, Germany, 2019. [Google Scholar] [CrossRef]
- Farhadi, N. Can we rely on COVID-19 data? An assessment of data from over 200 countries. Sci. Prog. 2021, 104, 00368504211021232. [Google Scholar] [CrossRef]
- Newcomb, S. Note on the Frequency of Use of the Different Digits in Natural 242 Numbers. Am. J. Math. 1881, 4, 39–40. [Google Scholar] [CrossRef] [Green Version]
- Benford, F. The Law of Anomalous Numbers. Proc. Am. Philos. Soc. 1938, 78, 551–572. [Google Scholar]
- Sambridge, M.; Jackson, A. National COVID Numbers—Benford’s Law Looks for Errors. Nature [Internet]. 2020. Available online: https://www.nature.com/articles/d41586-020-01565-5 (accessed on 31 January 2022).
- Koch, C.; Okamura, K. Benford’s Law and COVID-19 Reporting. 2020. Available online: https://papers.ssrn.com/sol3/papers.cfm?abstract_id=3586413 (accessed on 31 January 2022).
- Idrovo, A.J.; Manrique-Hernndez, E.F. Data Quality of Chinese Surveillance of 270 COVID-19: Objective Analysis Based on WHO’s Situation Reports. Asia Pac. J. Public Health 2020, 32, 165–167. [Google Scholar] [CrossRef]
- Lee, K.-B.; Han, S.; Jeong, Y. COVID-19 flattening the curve, and Benford’s law. Phys. A Stat. Mech. Appl. 2020, 559, 125090. [Google Scholar] [CrossRef] [PubMed]
- Isea, R. How Valid are the Reported Cases of People Infected with COVID-19 in the World? Int. J. Coronaviruses 2020, 1, 53–56. [Google Scholar] [CrossRef]
- Farhadi, N.; Lahooti, H. Are COVID-19 Data Reliable? A Quantitative Analysis of Pandemic Data from 182 Countries. COVID 2021, 1, 137–152. [Google Scholar] [CrossRef]
- Morillas-Jurado, F.G.; Caballer-Tarazona, M.; Caballer-Tarazona, V. Applying Benford’s Law to Monitor Death Registration Data: A Management Tool for the COVID-19 Pandemic. Mathematics 2022, 10, 46. [Google Scholar] [CrossRef]
- Farhadi, N.; Lahooti, H. Pandemic Growth and Benfordness: Empirical Evidence from 176 Countries Worldwide. COVID 2021, 1, 366–383. [Google Scholar] [CrossRef]
- Balashov, V.S.; Yan, Y.; Zhu, X. Using the Newcomb–Benford law to study the association between a country’s COVID-19 reporting accuracy and its development. Sci. Rep. 2021, 11, 22914. [Google Scholar] [CrossRef]
- Kilani, A. Authoritarian regimes’ propensity to manipulate Covid-19 data: A statistical analysis using Benford’s Law. Commonw. Comp. Polit. 2021, 59, 319–333. [Google Scholar] [CrossRef]
- Ley, L. On the Peculiar Distribution of the U.S. Stock Indexes’ Digits. Am. Stat. 1996, 50, 311–313. [Google Scholar] [CrossRef]
- Kossovsky, A. Benford’s Law: Theory, the General Law of Relative Quantities, and Forensic Fraud Detection Applications; World Scientific: Singapore, 2015. [Google Scholar]
- Silva, L.; Filho, D.F. Using Benford’s law to assess the quality of COVID-19 register data in Brazil. J. Public Health 2022, 10, 107–110. [Google Scholar] [CrossRef]
- Nigrini, M.J. Benford’s Law Applications for Forensic Accounting, Auditing and Fraud Detection; Wiley: Hoboken, NJ, USA, 2012. [Google Scholar]
- Fairweather, W.R. Sensitivity and Specificity in the Application of Benford’s Law to Explore for Potential Fraud. J. Forensic Investig. Account. 2017, 9, 953–961. [Google Scholar]
- Durtschi, C.; Hillison, W.; Pacini, C. The Effective Use of Benford’s law to Assist in Detecting Fraud in Accounting Data. J. Forensic Account. 2004, 5, 17–34. [Google Scholar]
- Grammatikos, T.; Papanikolaou, N.I. Applying Benford’s law to Detect Accounting 250 Data Manipulation in the Banking Industry. J. Financ. Serv. Res. 2020, 59, 115–142. [Google Scholar] [CrossRef]
- Cho, T.W.; Gaines, B.J. Breaking the (Benford) Law: Statistical Fraud Detection in Campaign Finance. Am. Stat. 2007, 61, 218–223. [Google Scholar]
- Roukema, B.F. A first-digit anomaly in the 2009 Iranian presidential election. J. Appl. Stat. 2014, 41, 164–199. [Google Scholar] [CrossRef] [Green Version]
- D’Alessandro, A. Benford’s law and metabolomics: A tale of numbers and blood. Transfus. Apher. Sci. 2020, 59, 103019. [Google Scholar] [CrossRef] [PubMed]
- Leemis, L.M. Reliability: Probabilistic Models and Statistical Methods; Prentice-Hall: New York, NY, USA, 1995. [Google Scholar]
- Leemis, L.M.; Schmeiser, B.W.; Evans, D.L. Survival Distributions Satisfying Benford’s Law. Am. Stat. 2000, 54, 236–241. [Google Scholar] [CrossRef]
- Rayner, J.C.W.; Best, D.J. Smooth Tests of Goodness of Fit; Oxford University Press: New York, NY, USA, 1989. [Google Scholar]
- Dadakis Horn, S. Goodness-of-Fit Tests for Discrete Data: A Review and an Application to a Health Impairment Scale. Biometrics 1977, 33, 237–247. [Google Scholar] [CrossRef]
- Goodman, Q. The promises and pitfalls of Benford’s law. Significance 2016, 13, 38–41. [Google Scholar] [CrossRef]
- Morrow, J. Benford’s Law, Families of Distributions and a Test Basis. 2014. Centre for Economic Performance Discussion Paper No 1291, London. Available online: http://johnmorrow.info/pdf/benford.pdf (accessed on 2 February 2022).
- Vector, D. What’s Happening in Belarus? Here Are the Basics. New York Times. 26 May 2021. Available online: https://www.nytimes.com/2021/05/26/world/europe/whats-happening-in-belarus.html (accessed on 23 January 2022).
- BBC. Coronavirus: Iran Cover-Up of Deaths Revealed by Data Leak. Available online: https://www.bbc.com/news/world-middle-east-53598965 (accessed on 15 August 2021).
- Cunningham, E.; Bennett, D. Coronavirus Burial Pits So Vast They’re Visible from Space. 2020. Available online: https://www.washingtonpost.com/graphics/2020/world/iran-coronavirus-outbreak-graves (accessed on 25 February 2022).
- Farge, E. WHO to Start Coronavirus Testing in Rebel Syria; Iran Raises Efforts, Official Says. 16 March 2020. Available online: https://web.archive.org/web/20200316212446if_/https://www.reuters.com/article/us-health-coronavirus-mideast/who-to-start-coronavirus-testing-in-rebel-syria-iran-raises-efforts-official-says-idUSKBN2133PK (accessed on 16 March 2020).
- Johns Hopkins University. Global Health Security Index. Available online: https://www.ghsindex.org/ (accessed on 25 January 2022).
- CDC. SARS-CoV-2 Variant Classifications and Definitions. 1 December 2021. Available online: https://www.cdc.gov/coronavirus/2019-ncov/variants/variant-classifications.html (accessed on 28 January 2020).


| Researcher | Variables | Deadline | Number of Countries |
|---|---|---|---|
| Idrovo and Manrique-Hernández | Confirmed cases, suspected cases, and deaths cumulated confirmed cases and cumulated actual deaths | 21 January 2020–15 March 2020 | 1 |
| Koch and Okamura | Daily Cases, Deaths | 20 January 2020–28 April 2020 | 3 |
| Lee, Han and Jeong | Daily Deaths | 22 January 2020–6 April 2020 | 10 |
| Wei and Vellwock | Daily Cases, Deaths | 1 January 2020–1 September 2020 | 20 |
| Isea | Daily Cases, Deaths | 29 December 2019–30 April 2020 | 23 |
| Jackson and Sambridge | Cumulated confirmed cases and deaths | 16 January 2020–4 September 2020 | 51 |
| Farhadi | Daily Cases, Deaths, Tests | 31 December 2019–24 September 2020 | 182 |
| Farhadi and Lahooti | Daily Cases, Deaths, Tests, Vaccination | 31 December 2019–6 June 2021 | 176 |
| Farhadi and Lahooti | Periodic growth ratios, Daily Cases | 31 December 2019–6 June 2021 | 176 |
| Morillas-Jurado et al. | Daily death cases | 1 March 2020–30 June 2020 | 1 |
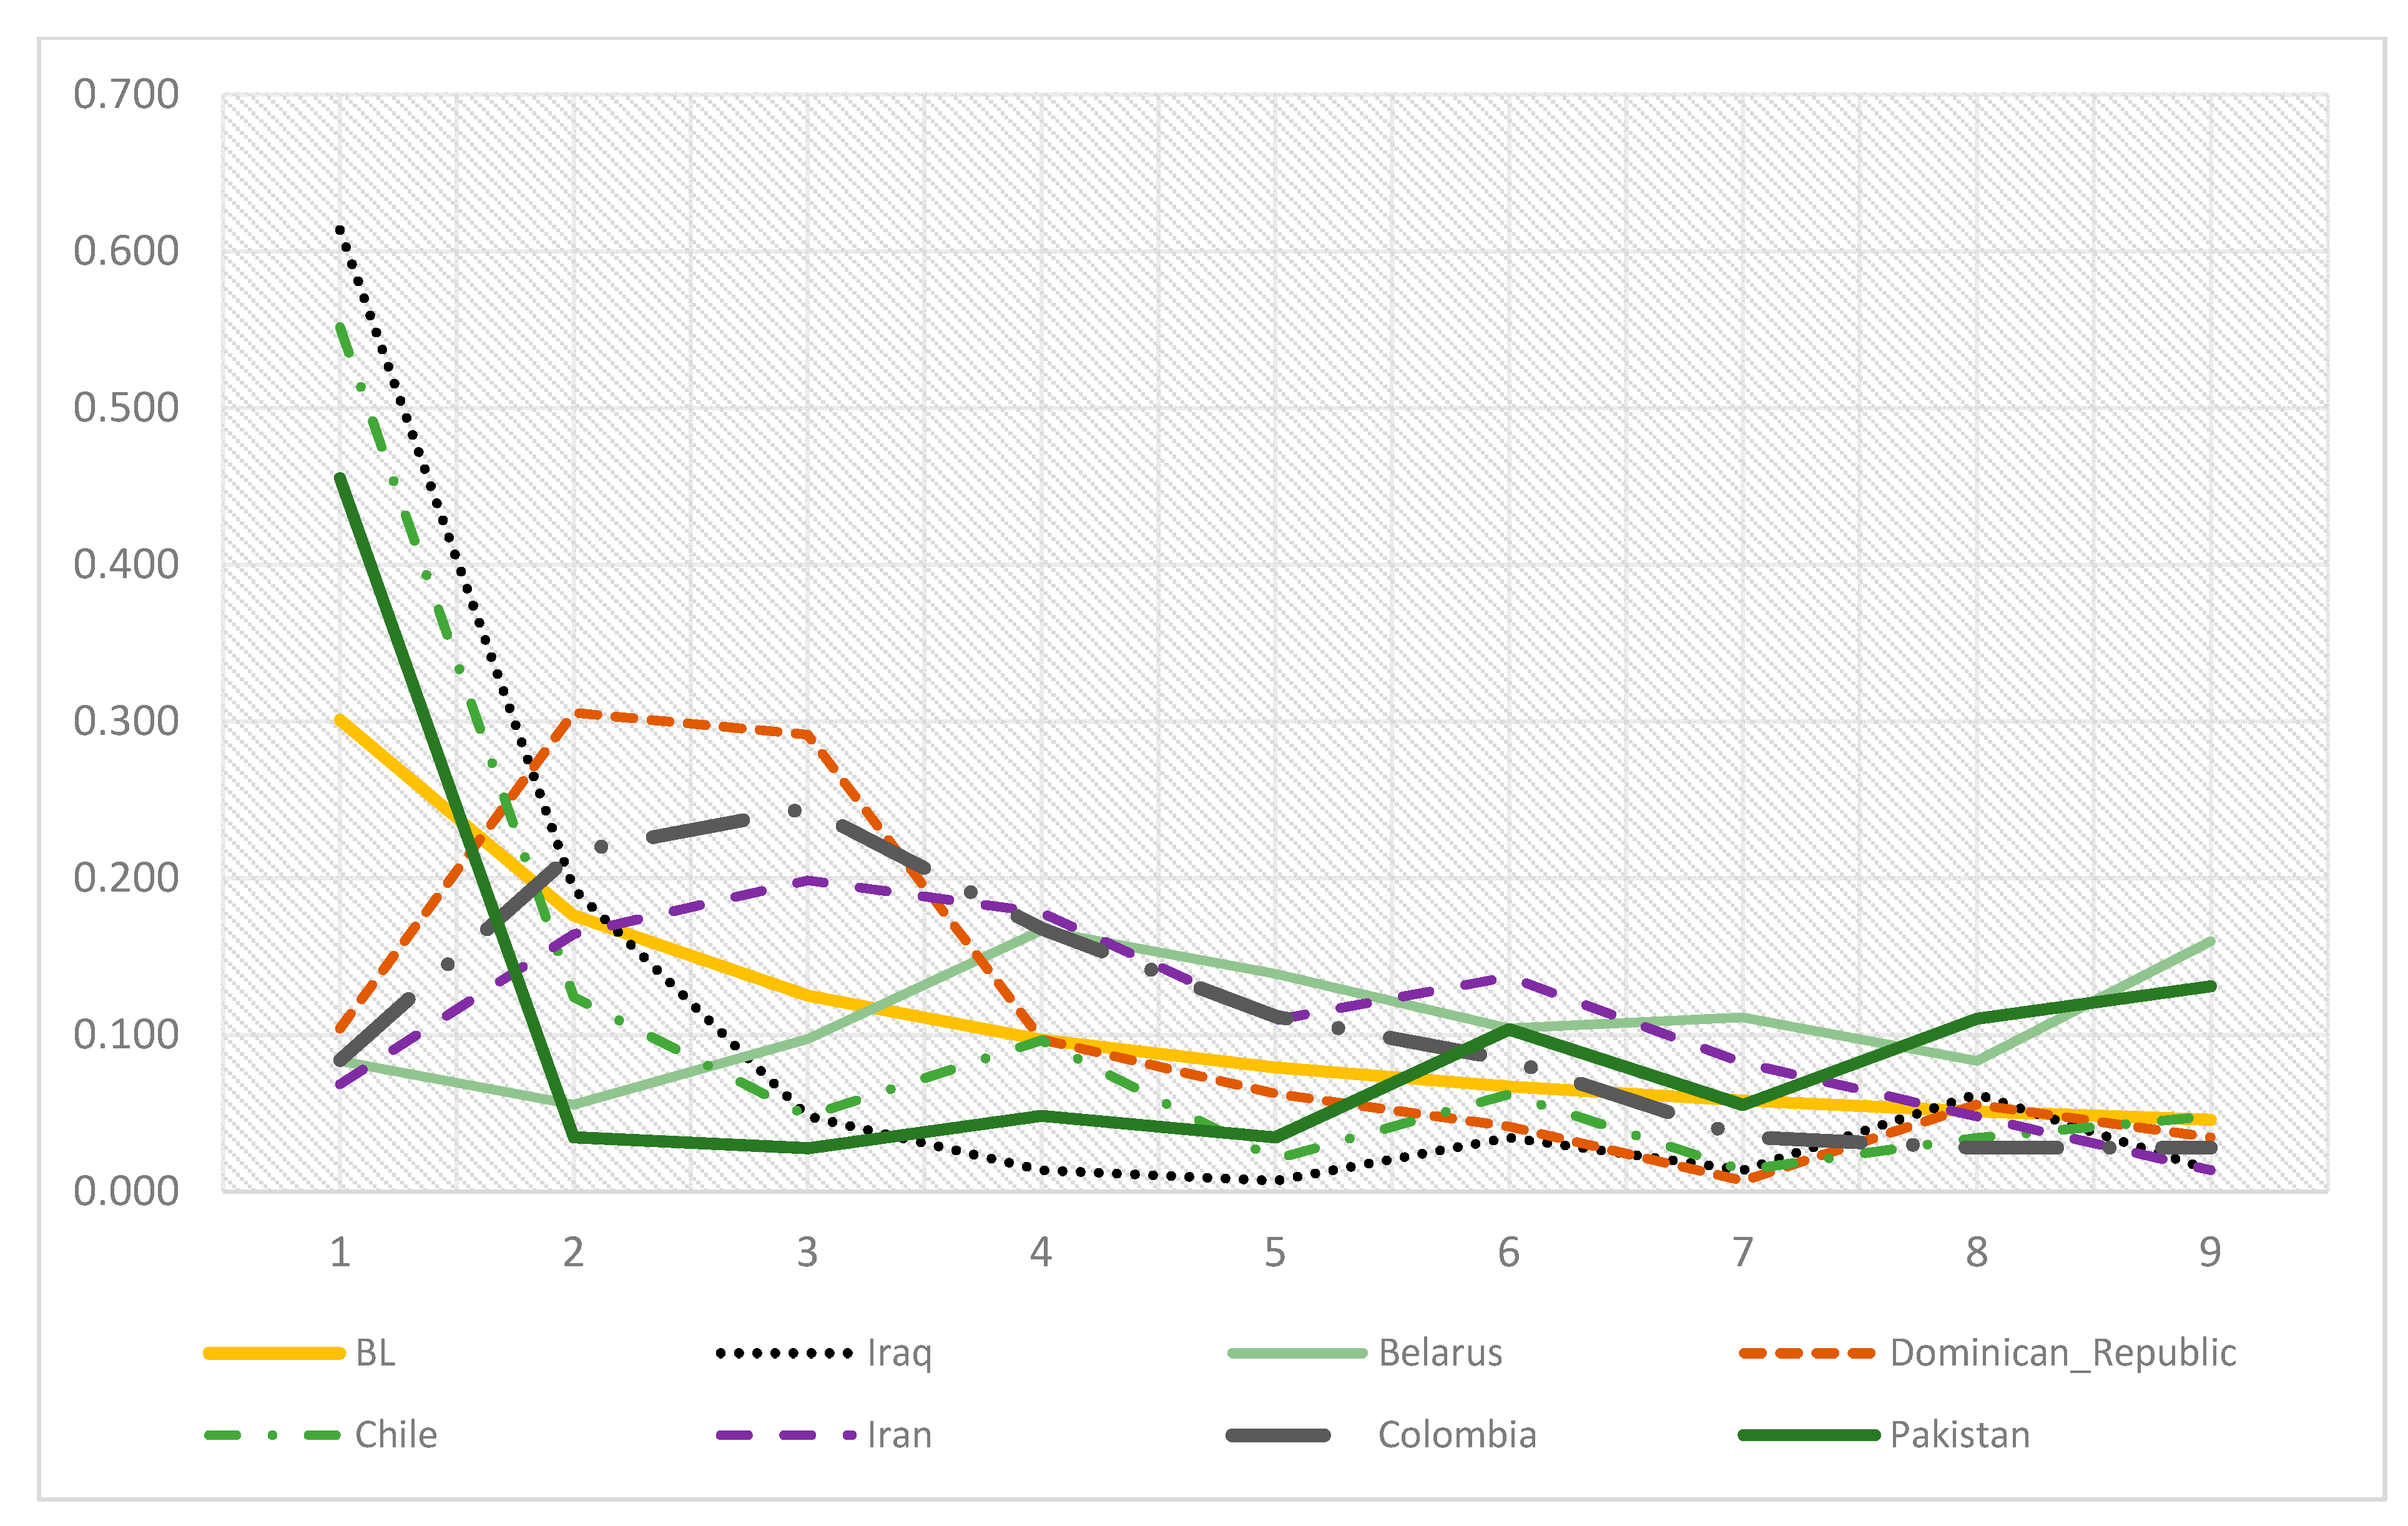
| First Digit | 1 | 2 | 3 | 4 | 5 | 6 | 7 | 8 | 9 |
|---|---|---|---|---|---|---|---|---|---|
| Benford’s frequency | 0.301 | 0.176 | 0.125 | 0.097 | 0.079 | 0.067 | 0.058 | 0.051 | 0.046 |
| Territory | OM | GHSI | n | d* | m | w | p-Value | χ2 |
|---|---|---|---|---|---|---|---|---|
| Albania | 4 | 53 | 143 | 0.10 | 0.840 | 4.696 | 0.879 | 3.750 |
| Algeria | 4 | 24 | 145 | 0.09 | 0.923 | 6.821 | 0.710 | 5.435 |
| Argentina | 5 | 59 | 144 | 0.15 | 1.030 | 6.736 | 0.706 | 5.473 |
| Armenia | 4 | 50 | 143 | 0.06 | 0.362 | 1.657 | 0.947 | 2.786 |
| Australia | 5 | 76 | 148 | 0.12 | 0.745 | 3.894 | 0.168 | 11.632 |
| Austria | 5 | 59 | 145 | 0.11 | 1.026 | 3.495 | 0.316 | 9.317 |
| Azerbaijan | 4 | 34 | 144 | 0.07 | 0.499 | 1.995 | 0.998 | 1.024 |
| Bahrain | 4 | 39 | 145 | 0.09 | 0.624 | 4.924 | 0.647 | 6.003 |
| Bangladesh | 4 | 35 | 142 | 0.13 | 1.112 | 4.109 | 0.141 | 12.232 |
| Belarus | 4 | 35 | 144 | 0.29 | 2.612 | 40.873 | 0.000 | 59.001 |
| Belgium | 5 | 61 | 145 | 0.09 | 0.591 | 6.106 | 0.322 | 9.250 |
| Bolivia | 4 | 36 | 142 | 0.13 | 1.070 | 4.933 | 0.609 | 6.346 |
| Bosnia & Herzegovina | 4 | 43 | 142 | 0.06 | 0.462 | 3.190 | 0.991 | 1.616 |
| Botswana | 4 | 31 | 130 | 0.07 | 0.479 | 3.956 | 0.959 | 2.559 |
| Brazil | 6 | 60 | 144 | 0.12 | 1.054 | 6.304 | 0.410 | 8.243 |
| Bulgaria | 4 | 46 | 142 | 0.07 | 0.483 | 3.088 | 0.989 | 1.691 |
| Cameroon | 4 | 34 | 109 | 0.10 | 0.748 | 3.175 | 1.000 | 0.643 |
| Canada | 4 | 75 | 151 | 0.19 | 1.997 | 13.253 | 0.009 | 20.402 |
| Chile | 4 | 58 | 145 | 0.27 | 3.019 | 30.272 | 0.000 | 43.576 |
| China | 4 | 48 | 151 | 0.12 | 0.929 | 4.896 | 0.879 | 3.751 |
| Colombia | 4 | 44 | 143 | 0.26 | 2.596 | 22.392 | 0.000 | 44.757 |
| Costa Rica | 4 | 45 | 143 | 0.12 | 1.091 | 5.205 | 0.663 | 5.860 |
| Croatia | 4 | 53 | 145 | 0.11 | 0.958 | 5.210 | 0.825 | 4.341 |
| Cuba | 4 | 35 | 141 | 0.16 | 1.478 | 8.831 | 0.038 | 16.344 |
| Cyprus | 4 | 43 | 142 | 0.09 | 0.776 | 7.599 | 0.954 | 2.658 |
| Czechia | 4 | 144 | 0.15 | 1.470 | 12.275 | 0.487 | 7.466 | |
| Denmark | 5 | 70 | 149 | 0.13 | 1.299 | 5.603 | 0.248 | 10.253 |
| Dominica | 4 | 282 | 0.13 | 1.733 | 9.982 | 0.071 | 14.420 | |
| Dominican Republic | 4 | 38 | 144 | 0.28 | 2.362 | 32.039 | 0.000 | 46.674 |
| Ecuador | 4 | 50 | 143 | 0.18 | 1.844 | 11.292 | 0.006 | 21.481 |
| El Salvador | 4 | 44 | 140 | 0.12 | 0.900 | 4.885 | 0.091 | 13.679 |
| Estonia | 4 | 57 | 149 | 0.09 | 0.718 | 2.926 | 0.959 | 2.554 |
| Finland | 4 | 69 | 150 | 0.13 | 1.049 | 8.662 | 0.133 | 12.421 |
| France | 5 | 68 | 151 | 0.18 | 1.502 | 10.589 | 0.204 | 10.964 |
| Georgia | 4 | 52 | 144 | 0.09 | 0.696 | 4.309 | 0.161 | 11.780 |
| Germany | 5 | 66 | 150 | 0.13 | 1.237 | 5.086 | 0.440 | 7.938 |
| Greece | 4 | 54 | 145 | 0.08 | 0.718 | 2.872 | 0.942 | 2.877 |
| Guatemala | 4 | 33 | 146 | 0.18 | 1.899 | 11.984 | 0.026 | 17.380 |
| Honduras | 4 | 28 | 141 | 0.19 | 1.867 | 19.798 | 0.001 | 27.624 |
| Hungary | 4 | 54 | 143 | 0.07 | 0.645 | 7.163 | 0.972 | 2.248 |
| India | 5 | 47 | 150 | 0.10 | 1.049 | 3.733 | 0.345 | 8.972 |
| Indonesia | 5 | 57 | 143 | 0.08 | 0.589 | 2.722 | 0.989 | 1.693 |
| Iran | 5 | 38 | 146 | 0.26 | 2.810 | 26.226 | 0.000 | 37.730 |
| Iraq | 4 | 26 | 145 | 0.33 | 3.766 | 47.118 | 0.000 | 67.430 |
| Ireland | 4 | 59 | 143 | 0.07 | 0.454 | 3.076 | 0.997 | 1.155 |
| Israel | 5 | 47 | 146 | 0.06 | 0.375 | 2.427 | 0.887 | 3.648 |
| Italy | 5 | 56 | 150 | 0.12 | 1.237 | 5.086 | 0.504 | 7.307 |
| Japan | 5 | 60 | 151 | 0.09 | 0.721 | 4.166 | 0.551 | 6.865 |
| Jordan | 4 | 42 | 143 | 0.10 | 0.909 | 6.609 | 0.089 | 13.720 |
| Kazakhstan | 4 | 41 | 140 | 0.12 | 0.816 | 6.530 | 0.135 | 12.389 |
| Kuwait | 4 | 46 | 145 | 0.22 | 1.964 | 17.655 | 0.000 | 29.546 |
| Kyrgyzstan | 4 | 49 | 140 | 0.23 | 2.270 | 17.113 | 0.000 | 37.253 |
| Latvia | 4 | 63 | 144 | 0.15 | 1.554 | 8.025 | 0.156 | 11.888 |
| Lebanon | 4 | 43 | 145 | 0.14 | 1.124 | 15.978 | 0.008 | 20.827 |
| Libya | 4 | 26 | 143 | 0.21 | 1.760 | 11.234 | 0.000 | 33.983 |
| Lithuania | 4 | 55 | 144 | 0.11 | 0.946 | 2.971 | 0.622 | 6.227 |
| Malaysia | 4 | 62 | 151 | 0.11 | 0.929 | 5.295 | 0.639 | 6.073 |
| Mexico | 5 | 58 | 156 | 0.12 | 1.031 | 10.977 | 0.030 | 17.024 |
| Mongolia | 4 | 50 | 142 | 0.05 | 0.481 | 4.530 | 0.954 | 2.658 |
| Morocco | 4 | 44 | 148 | 0.11 | 0.909 | 4.695 | 0.069 | 14.520 |
| Myanmar | 4 | 43 | 138 | 0.10 | 0.983 | 3.207 | 0.632 | 6.139 |
| Nepal | 4 | 35 | 151 | 0.07 | 0.607 | 1.368 | 0.987 | 1.801 |
| Netherlands | 5 | 76 | 144 | 0.05 | 0.304 | 1.595 | 1.000 | 0.057 |
| Norway | 4 | 65 | 145 | 0.16 | 1.275 | 8.692 | 0.436 | 7.972 |
| Pakistan | 4 | 36 | 145 | 0.25 | 1.856 | 23.045 | 0.000 | 65.686 |
| Palestine | 4 | 22 | 143 | 0.11 | 0.840 | 4.783 | 0.091 | 13.649 |
| Panama | 4 | 44 | 142 | 0.17 | 1.573 | 9.909 | 0.032 | 16.859 |
| Paraguay | 4 | 36 | 142 | 0.17 | 1.489 | 11.460 | 0.115 | 12.918 |
| Peru | 5 | 49 | 143 | 0.15 | 1.585 | 8.344 | 0.153 | 11.969 |
| Philippines | 4 | 48 | 150 | 0.14 | 1.001 | 8.142 | 0.007 | 21.077 |
| Poland | 5 | 55 | 143 | 0.12 | 1.007 | 4.669 | 0.619 | 6.253 |
| Portugal | 4 | 60 | 144 | 0.09 | 0.780 | 4.195 | 0.553 | 6.847 |
| Romania | 4 | 46 | 144 | 0.09 | 0.971 | 3.132 | 0.809 | 4.509 |
| Russia | 5 | 44 | 150 | 0.21 | 1.482 | 26.752 | 0.000 | 55.319 |
| Saudi Arabia | 4 | 49 | 143 | 0.14 | 1.426 | 7.163 | 0.079 | 14.125 |
| Serbia | 4 | 52 | 144 | 0.17 | 1.638 | 8.909 | 0.008 | 20.830 |
| Singapore | 4 | 59 | 151 | 0.06 | 0.455 | 1.612 | 1.000 | 0.026 |
| Slovakia | 4 | 48 | 143 | 0.10 | 0.832 | 3.001 | 0.839 | 4.195 |
| Slovenia | 4 | 67 | 149 | 0.11 | 0.889 | 5.792 | 0.372 | 8.661 |
| South Africa | 4 | 55 | 148 | 0.15 | 1.310 | 9.748 | 0.332 | 9.125 |
| South Korea | 5 | 70 | 151 | 0.13 | 1.014 | 7.805 | 0.565 | 6.740 |
| Spain | 5 | 66 | 149 | 0.03 | 0.234 | 0.485 | 0.995 | 1.359 |
| Sri Lanka | 4 | 34 | 150 | 0.09 | 0.593 | 2.874 | 0.453 | 7.806 |
| Sweden | 5 | 72 | 147 | 0.06 | 0.456 | 3.581 | 1.000 | 0.276 |
| Switzerland | 5 | 67 | 145 | 0.08 | 0.635 | 3.435 | 0.983 | 1.922 |
| Thailand | 4 | 73 | 155 | 0.13 | 1.181 | 7.923 | 0.184 | 11.328 |
| Tunisia | 4 | 34 | 143 | 0.08 | 0.673 | 1.932 | 0.962 | 2.486 |
| Turkey | 5 | 52 | 142 | 0.18 | 1.511 | 12.965 | 0.042 | 16.042 |
| Uganda | 4 | 44 | 138 | 0.06 | 0.347 | 1.531 | 1.000 | 0.477 |
| Ukraine | 5 | 38 | 142 | 0.10 | 0.650 | 4.651 | 0.924 | 3.160 |
| United Arab Emirates | 4 | 47 | 148 | 0.09 | 0.909 | 4.695 | 0.826 | 4.331 |
| United Kingdom | 5 | 78 | 150 | 0.09 | 0.804 | 2.538 | 0.721 | 5.338 |
| United States | 6 | 84 | 150 | 0.08 | 0.838 | 5.616 | 0.997 | 1.122 |
| Uruguay | 4 | 41 | 141 | 0.07 | 0.552 | 4.560 | 0.999 | 0.801 |
| Venezuela | 4 | 23 | 141 | 0.16 | 1.132 | 10.516 | 0.239 | 10.378 |
| Vietnam | 5 | 49 | 144 | 0.06 | 0.446 | 1.824 | 1.000 | 0.421 |
| Zambia | 4 | 29 | 139 | 0.06 | 0.437 | 3.385 | 0.999 | 0.940 |
| Zimbabwe | 4 | 38 | 139 | 0.09 | 0.804 | 3.669 | 0.858 | 3.994 |
Publisher’s Note: MDPI stays neutral with regard to jurisdictional claims in published maps and institutional affiliations. |
© 2022 by the authors. Licensee MDPI, Basel, Switzerland. This article is an open access article distributed under the terms and conditions of the Creative Commons Attribution (CC BY) license (https://creativecommons.org/licenses/by/4.0/).
Share and Cite
Farhadi, N.; Lahooti, H. Forensic Analysis of COVID-19 Data from 198 Countries Two Years after the Pandemic Outbreak. COVID 2022, 2, 472-484. https://doi.org/10.3390/covid2040034
Farhadi N, Lahooti H. Forensic Analysis of COVID-19 Data from 198 Countries Two Years after the Pandemic Outbreak. COVID. 2022; 2(4):472-484. https://doi.org/10.3390/covid2040034
Chicago/Turabian StyleFarhadi, Noah, and Hooshang Lahooti. 2022. "Forensic Analysis of COVID-19 Data from 198 Countries Two Years after the Pandemic Outbreak" COVID 2, no. 4: 472-484. https://doi.org/10.3390/covid2040034