
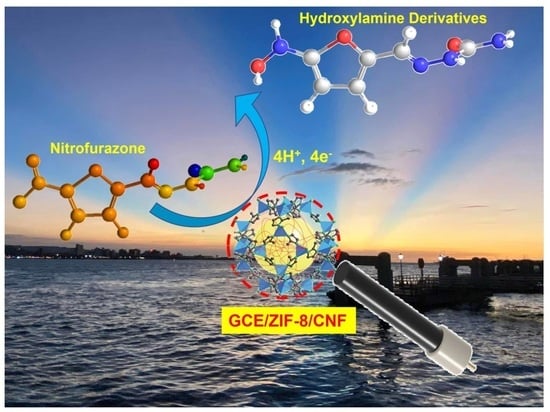
Preparation of Zeolitic Imidazolate Framework and Carbon Nanofiber Composites for Nitrofurazone Detection
 and
and
Abstract
:
1. Introduction
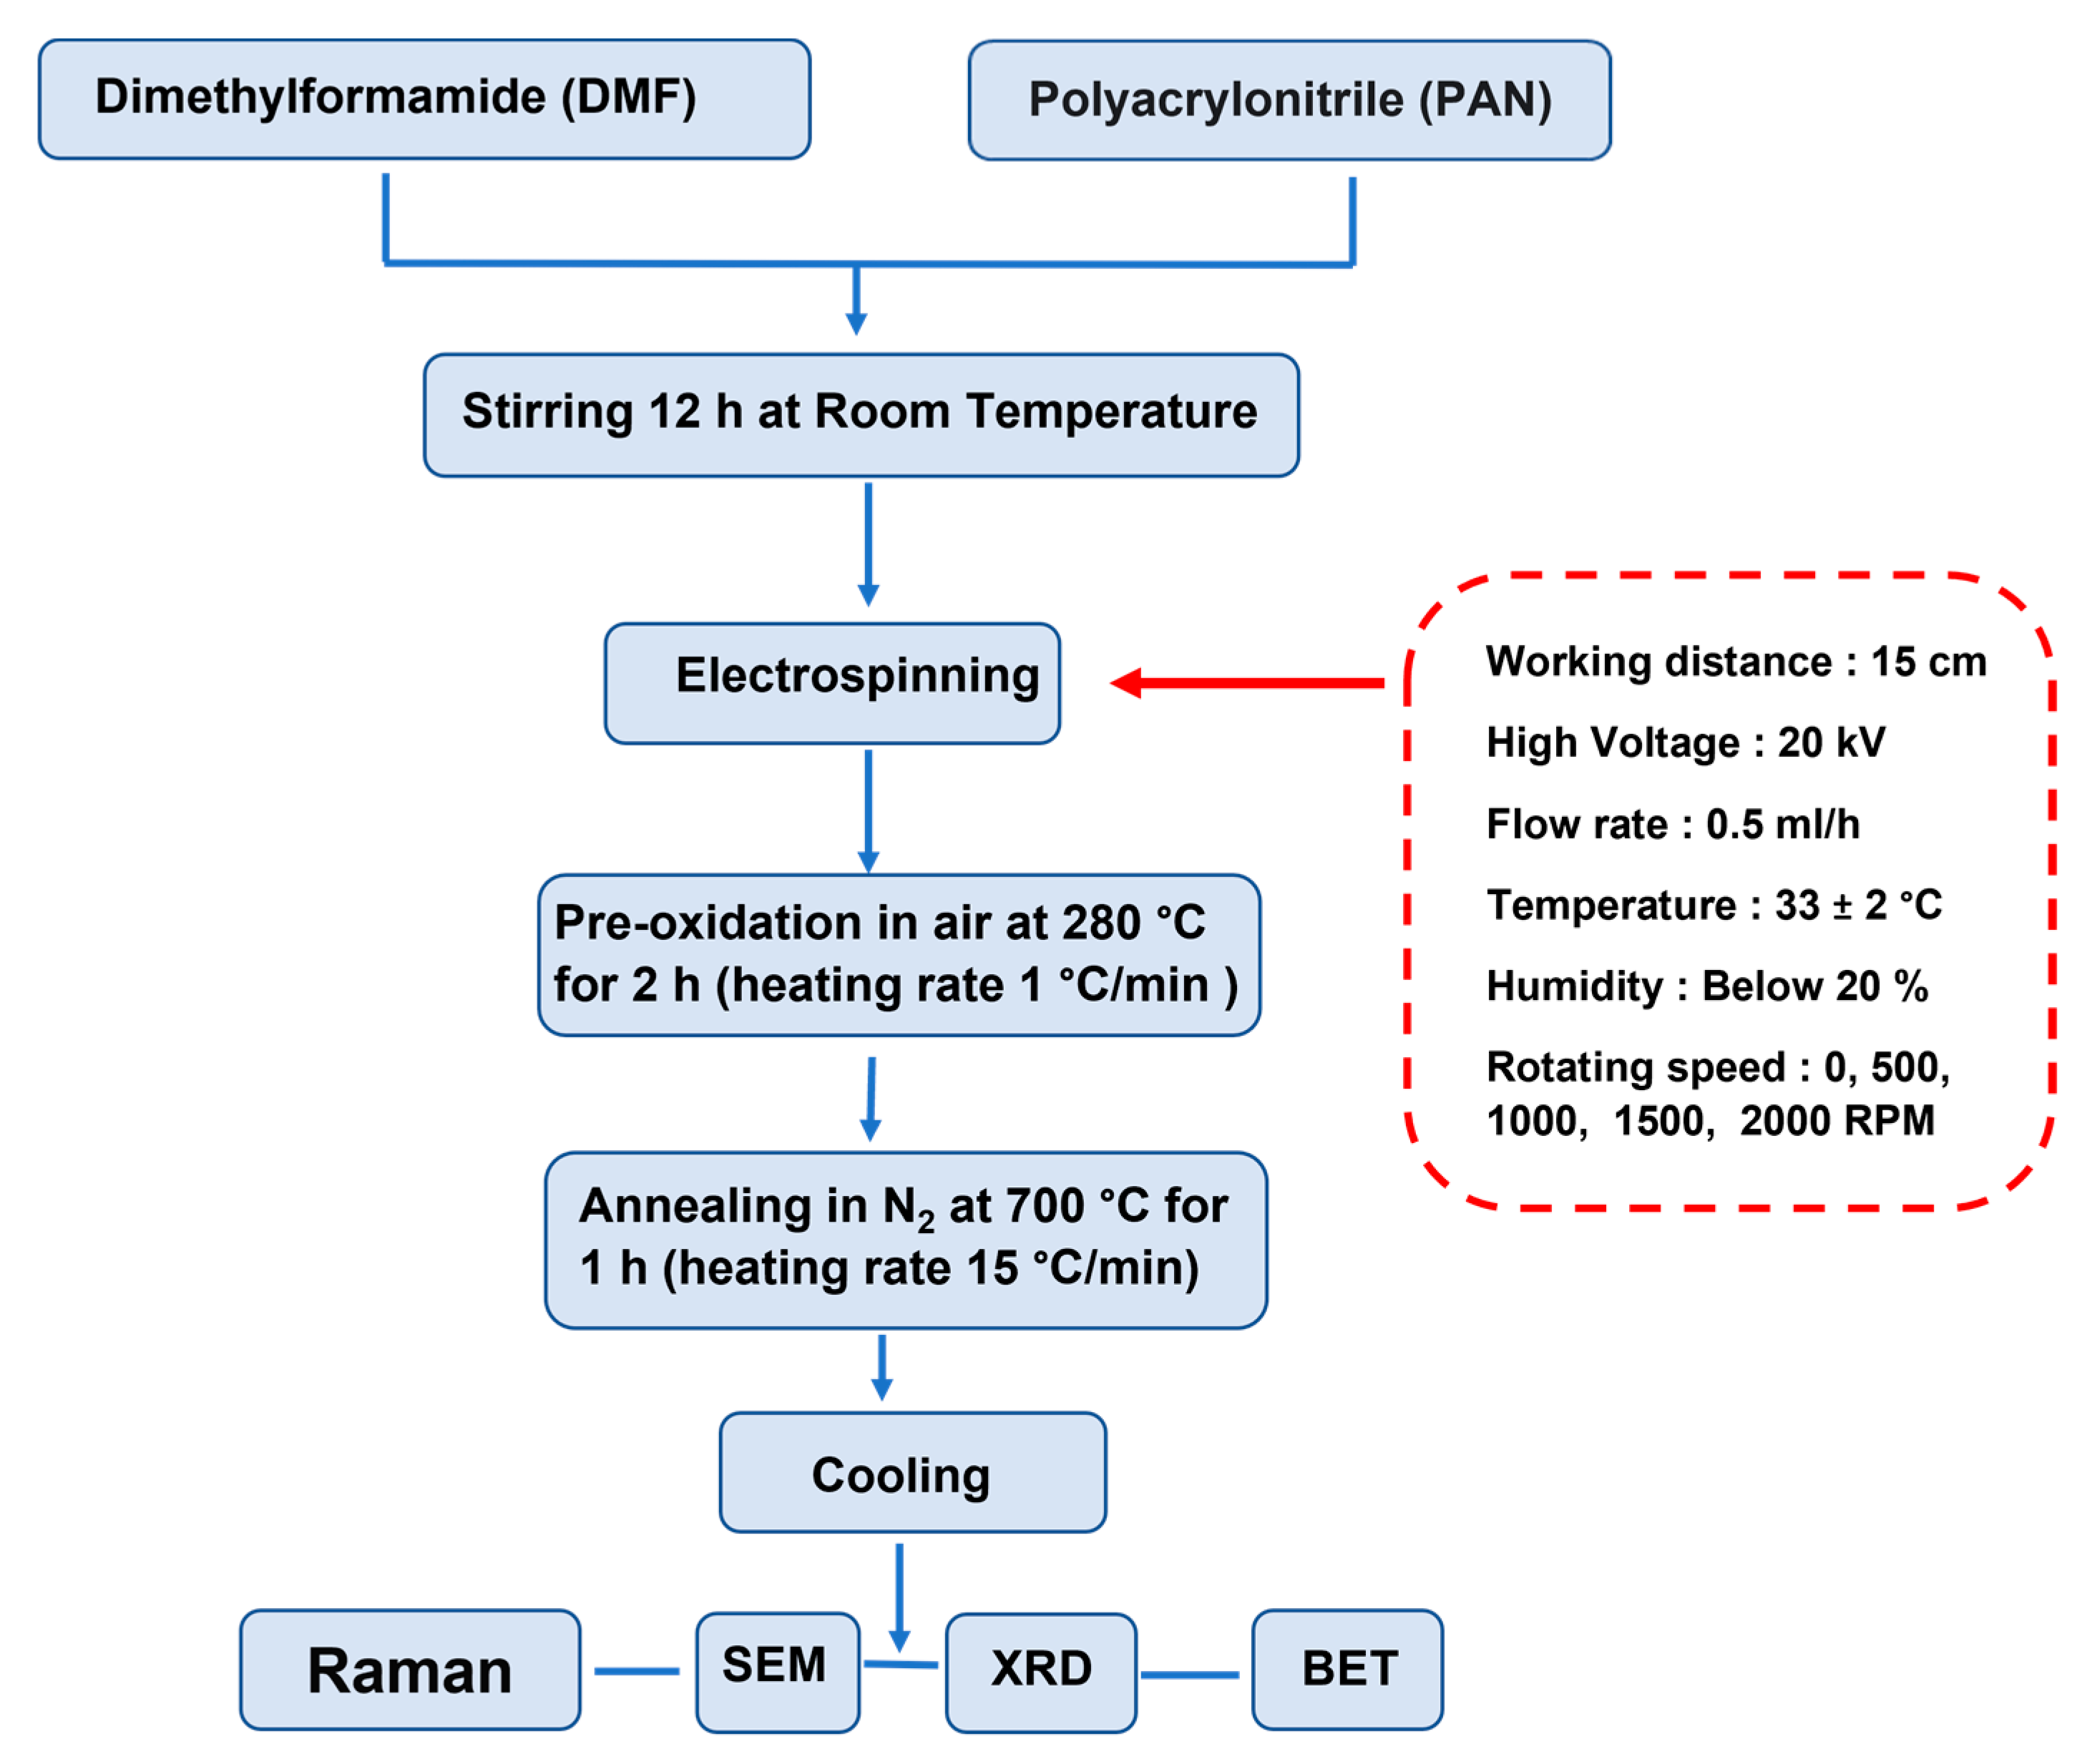
2. Materials and Methods
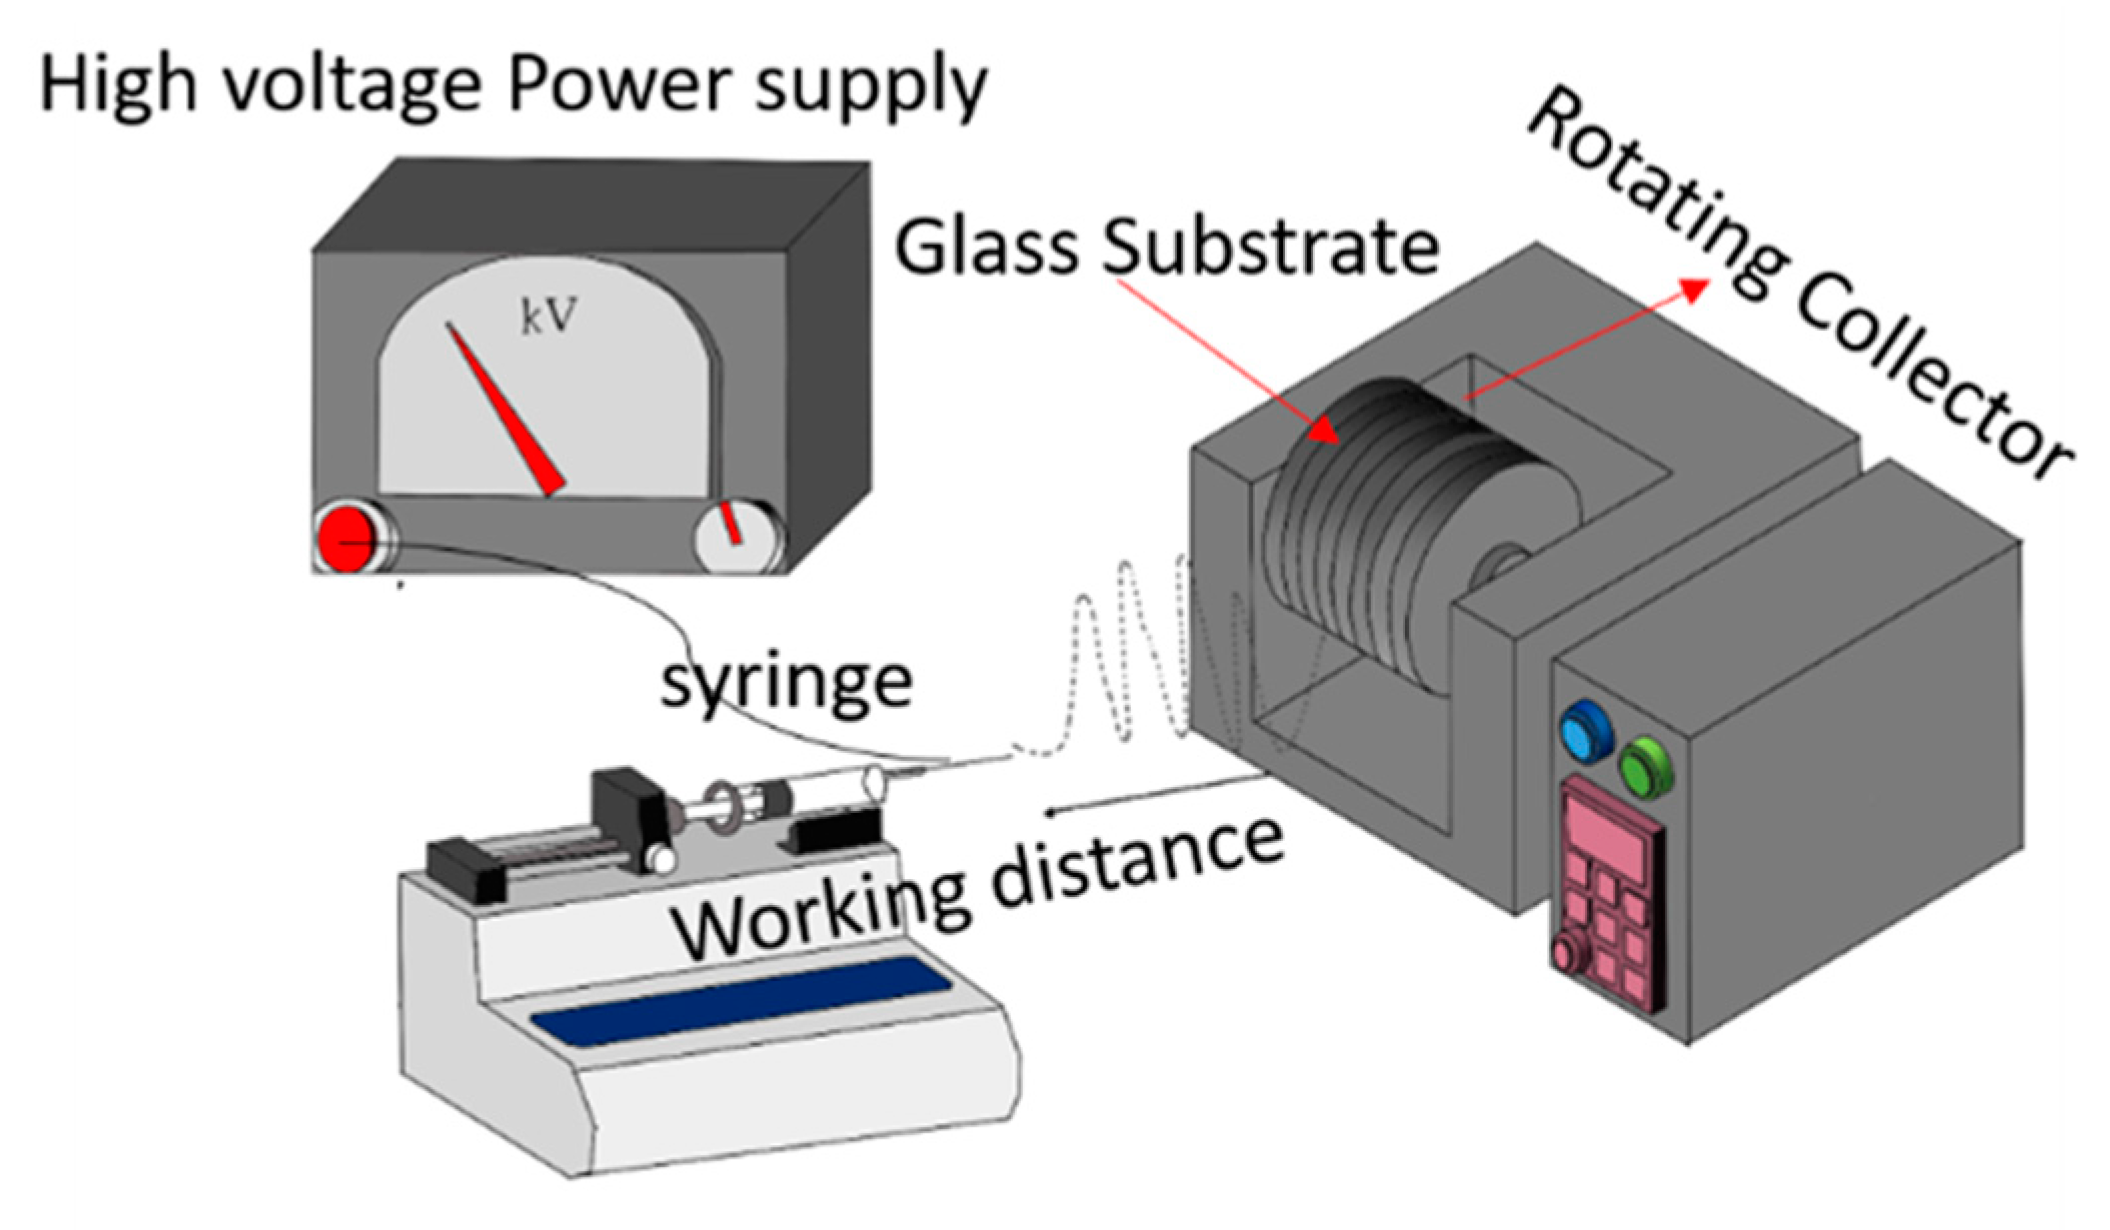
2.1. Instruments of Electrospinning
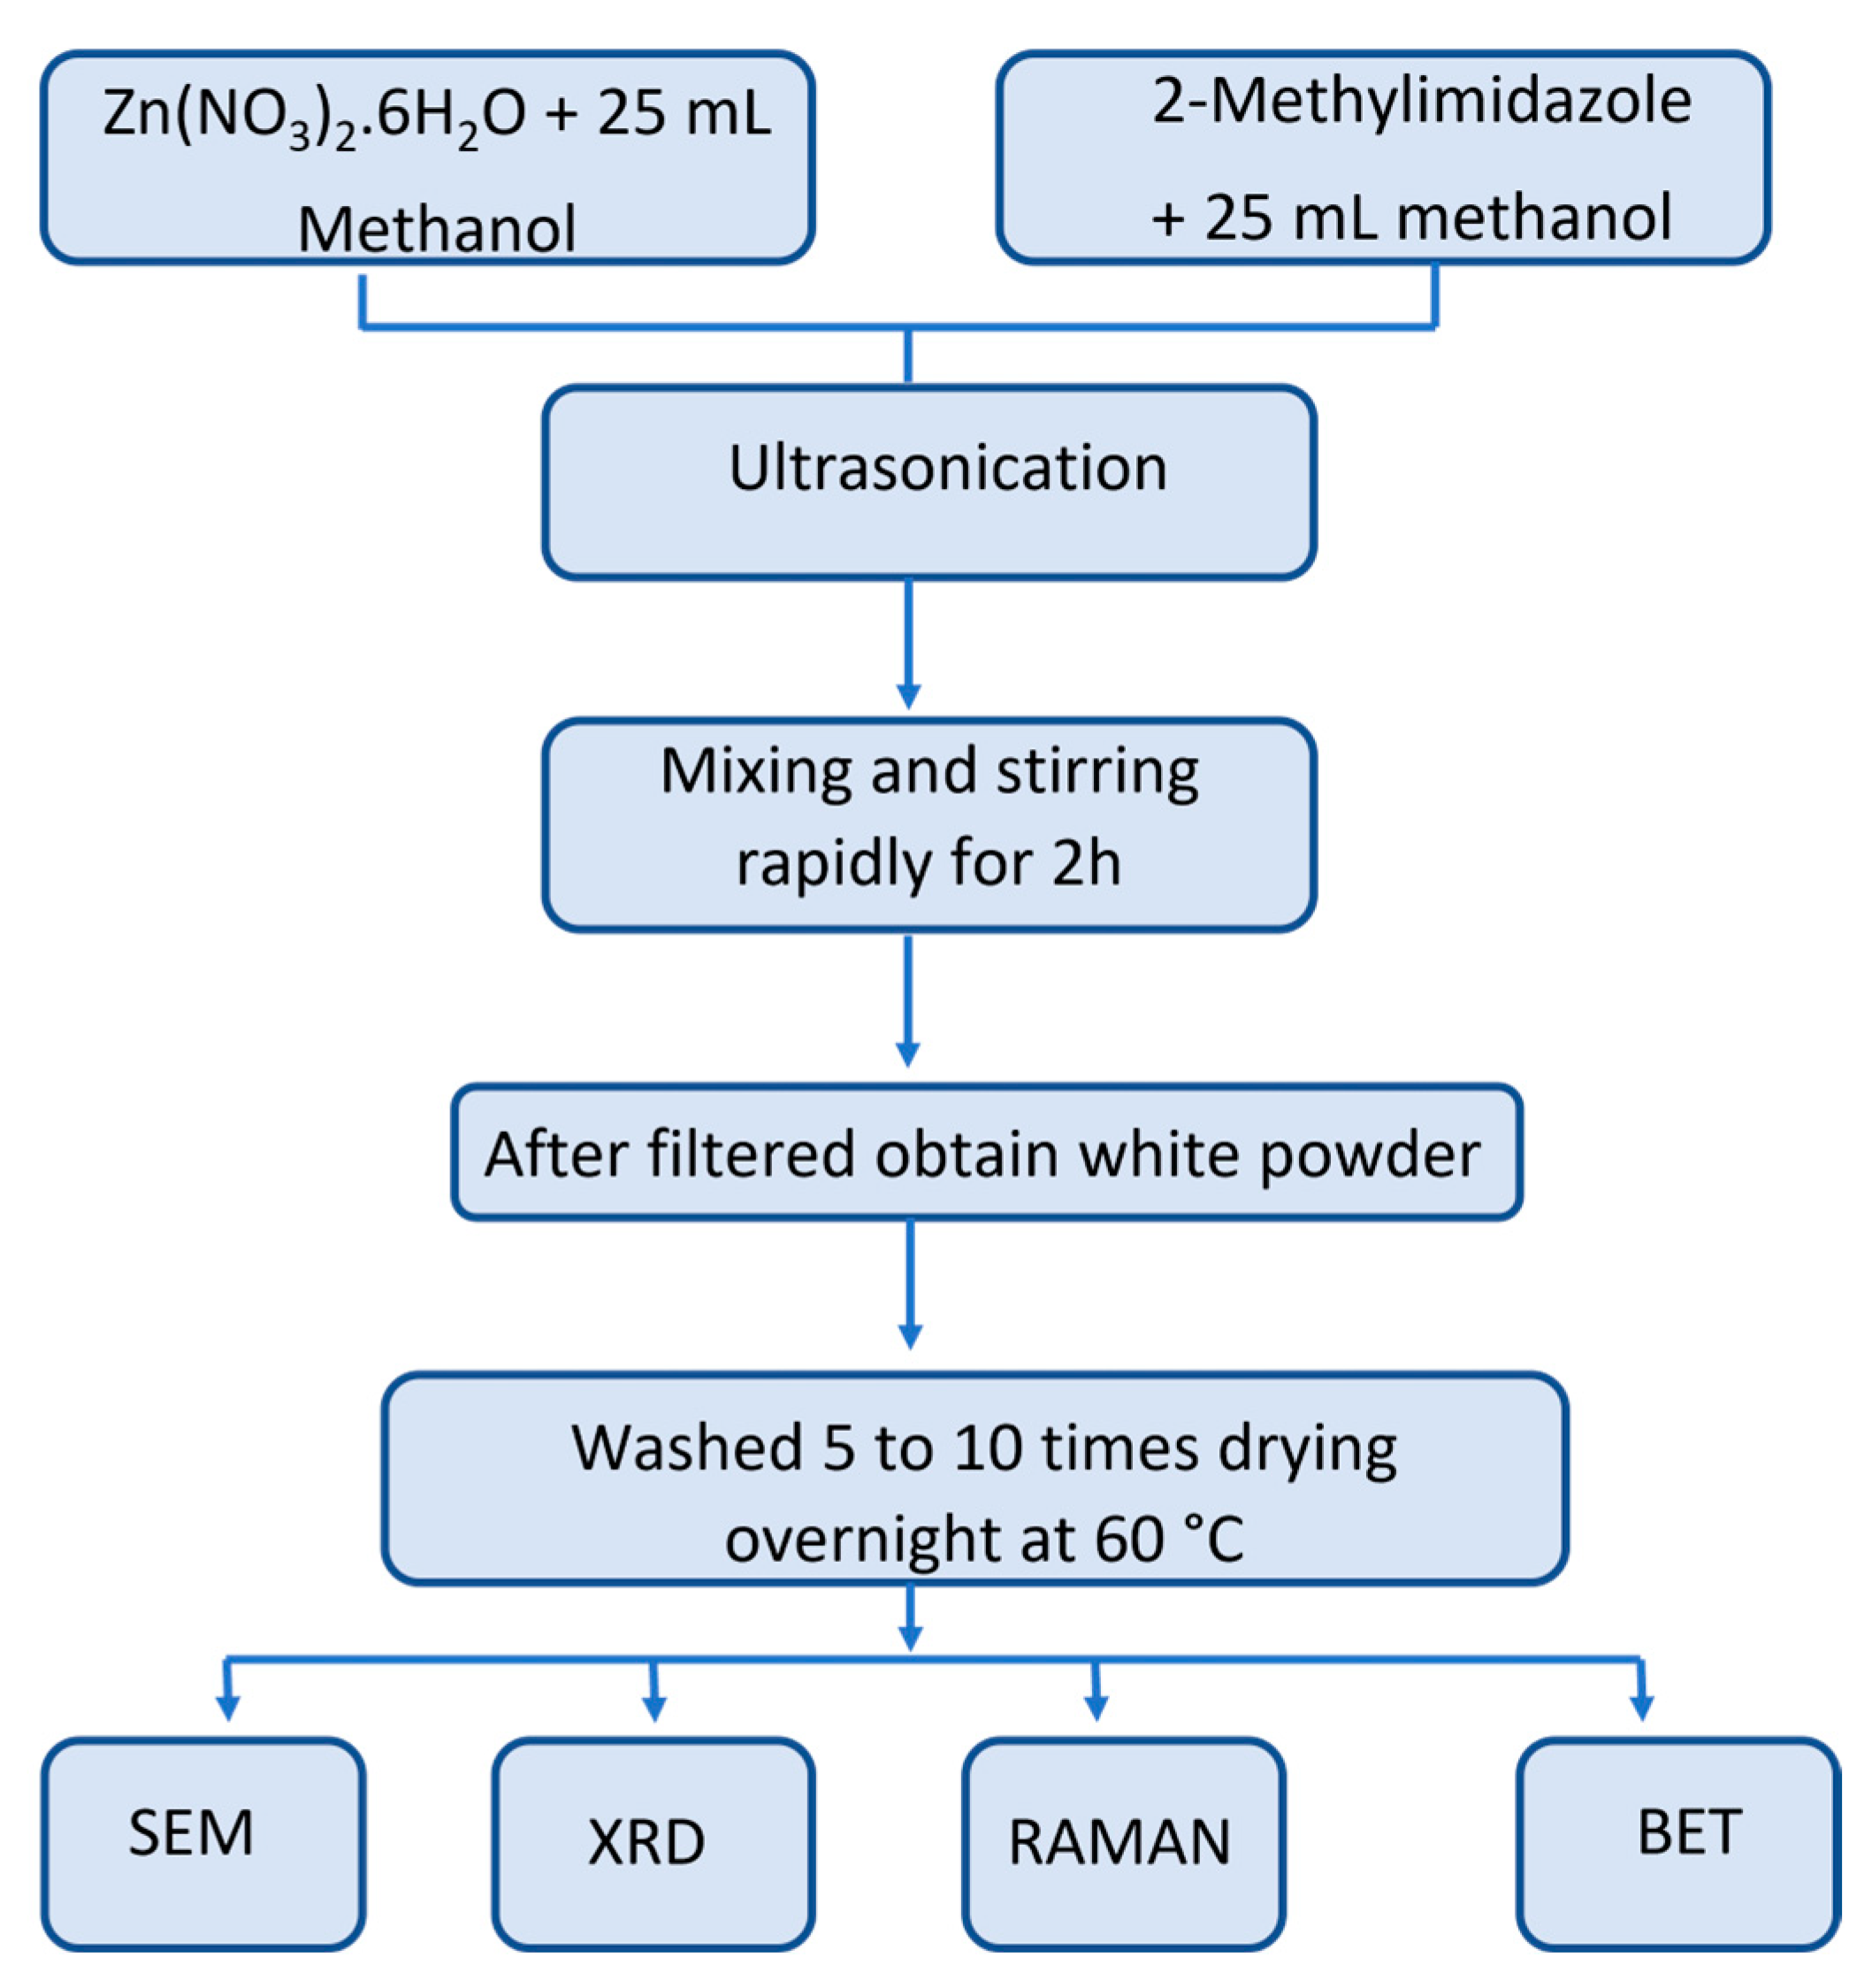
2.2. Preparation of ZIF-8
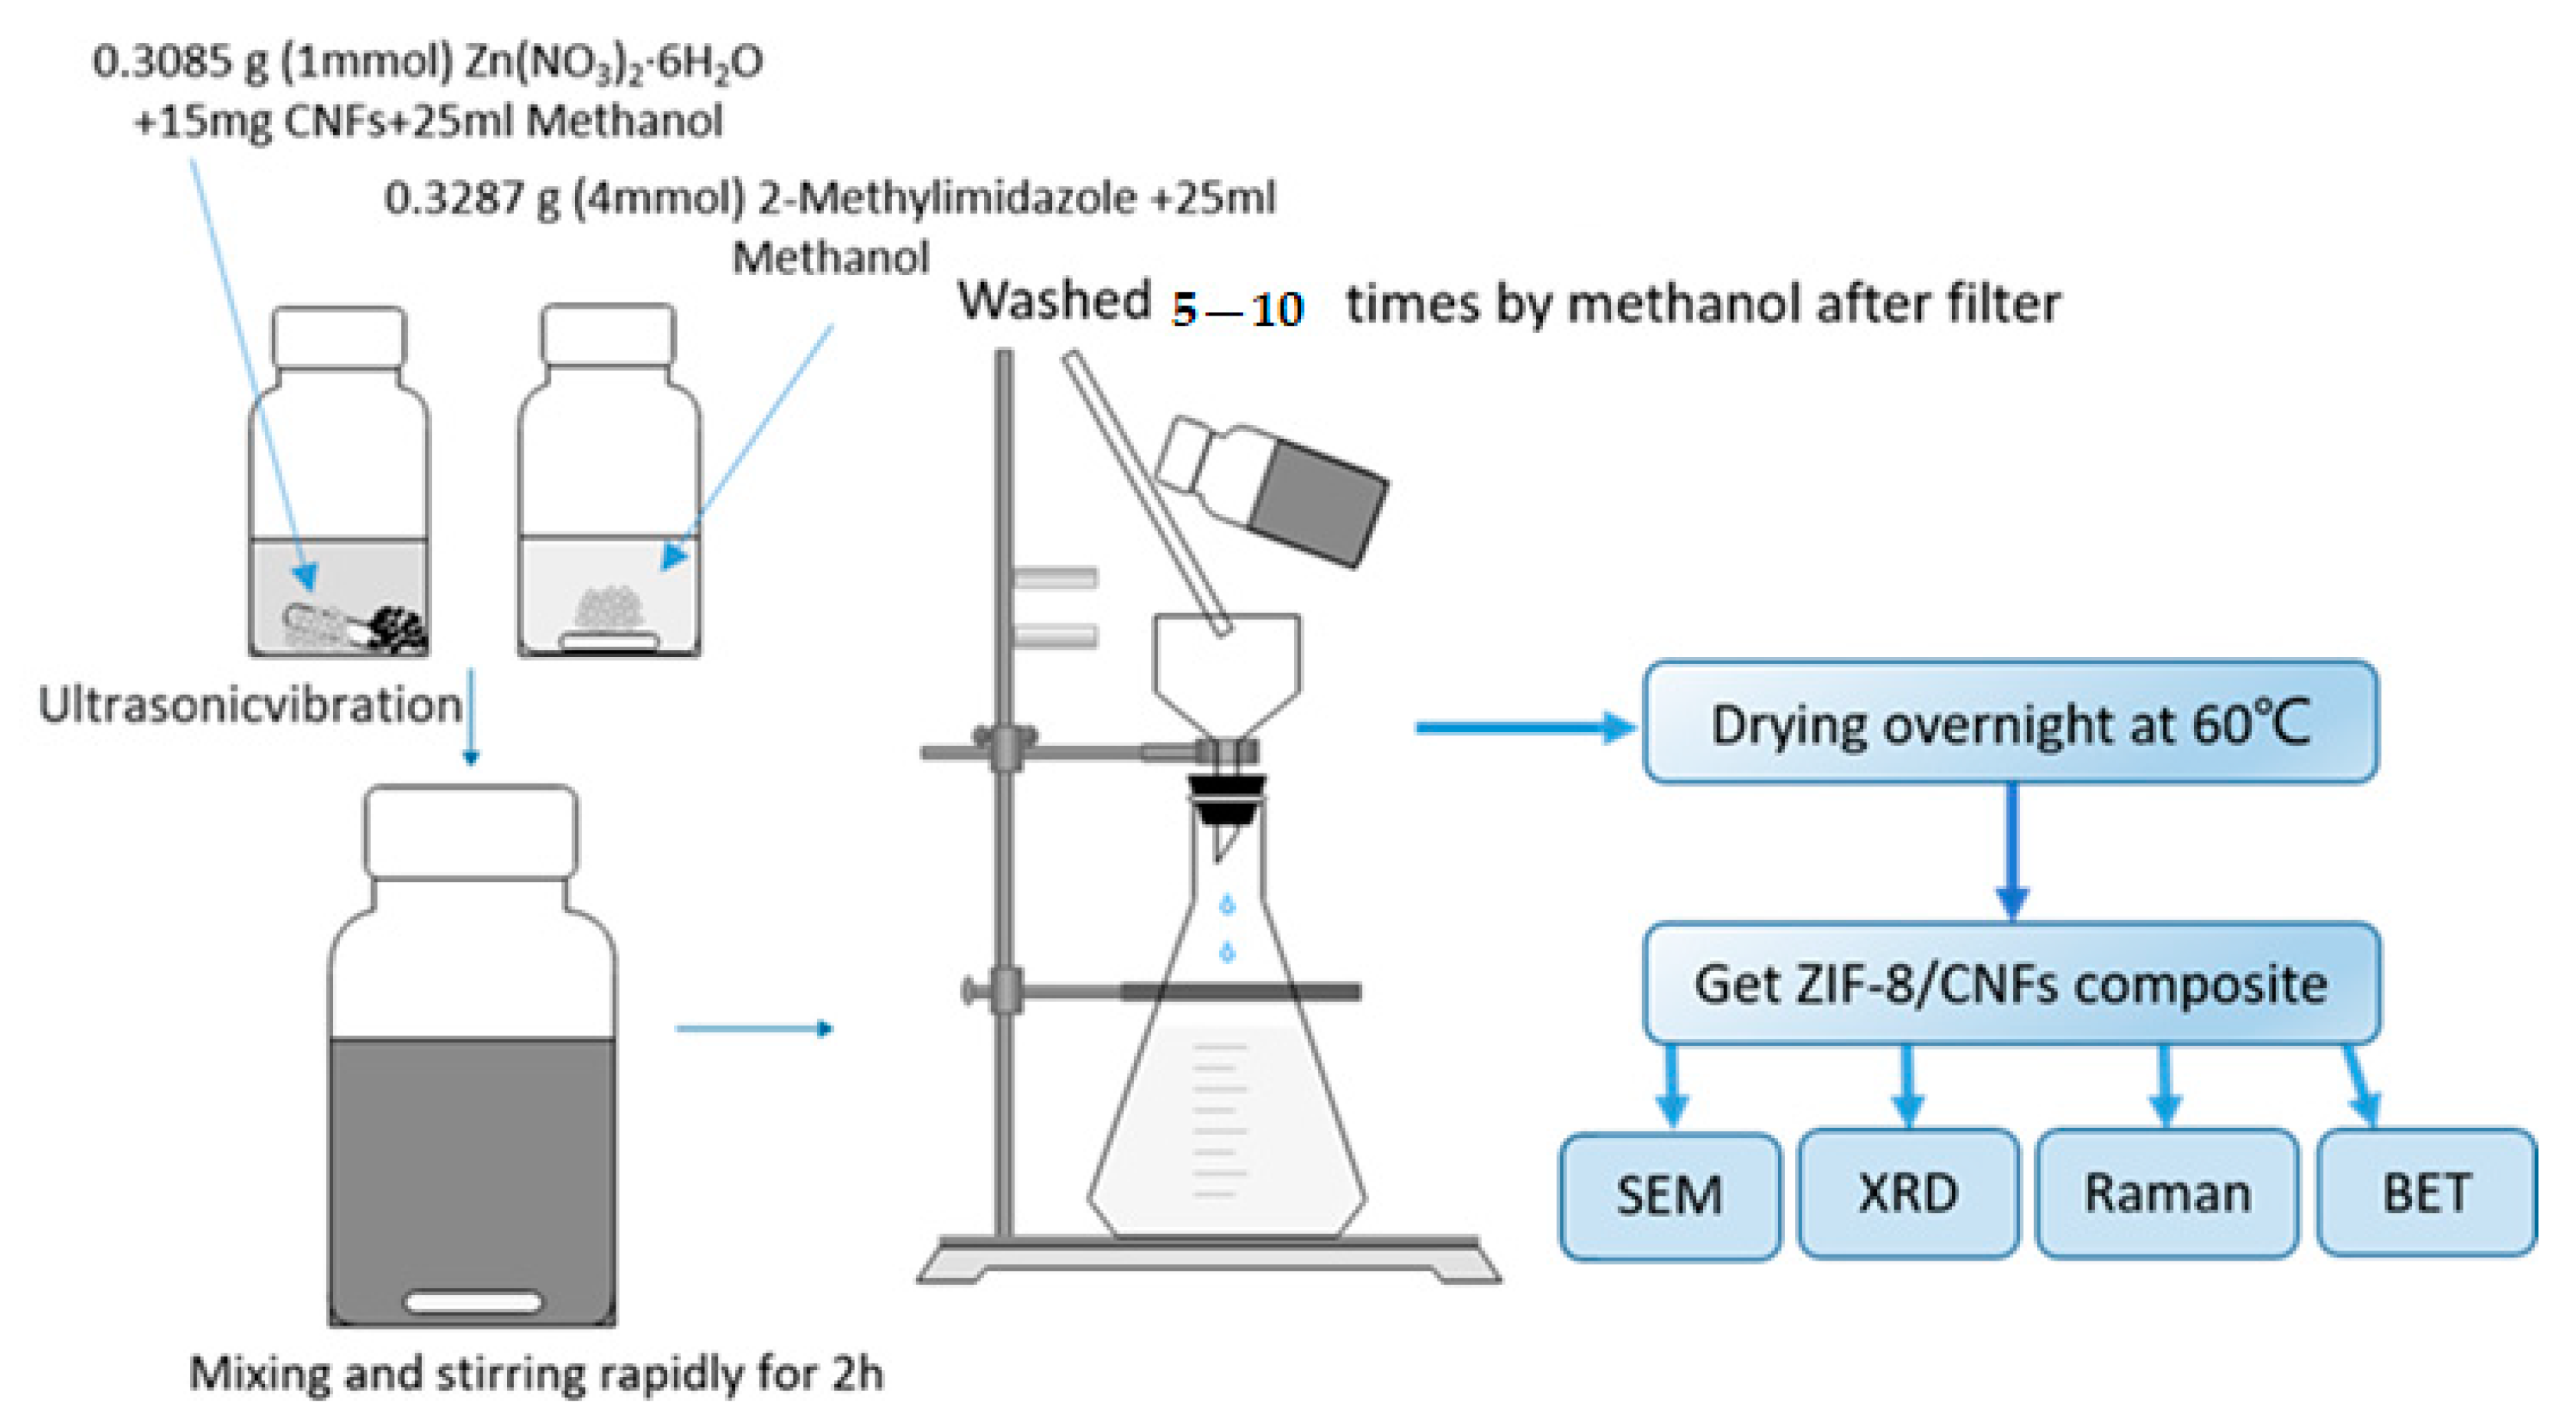
2.3. Preparation of ZIF-8/CNF Composite
2.4. Preparation of GCE/ZIF-8/CNF Electrode
3. Results and Discussion
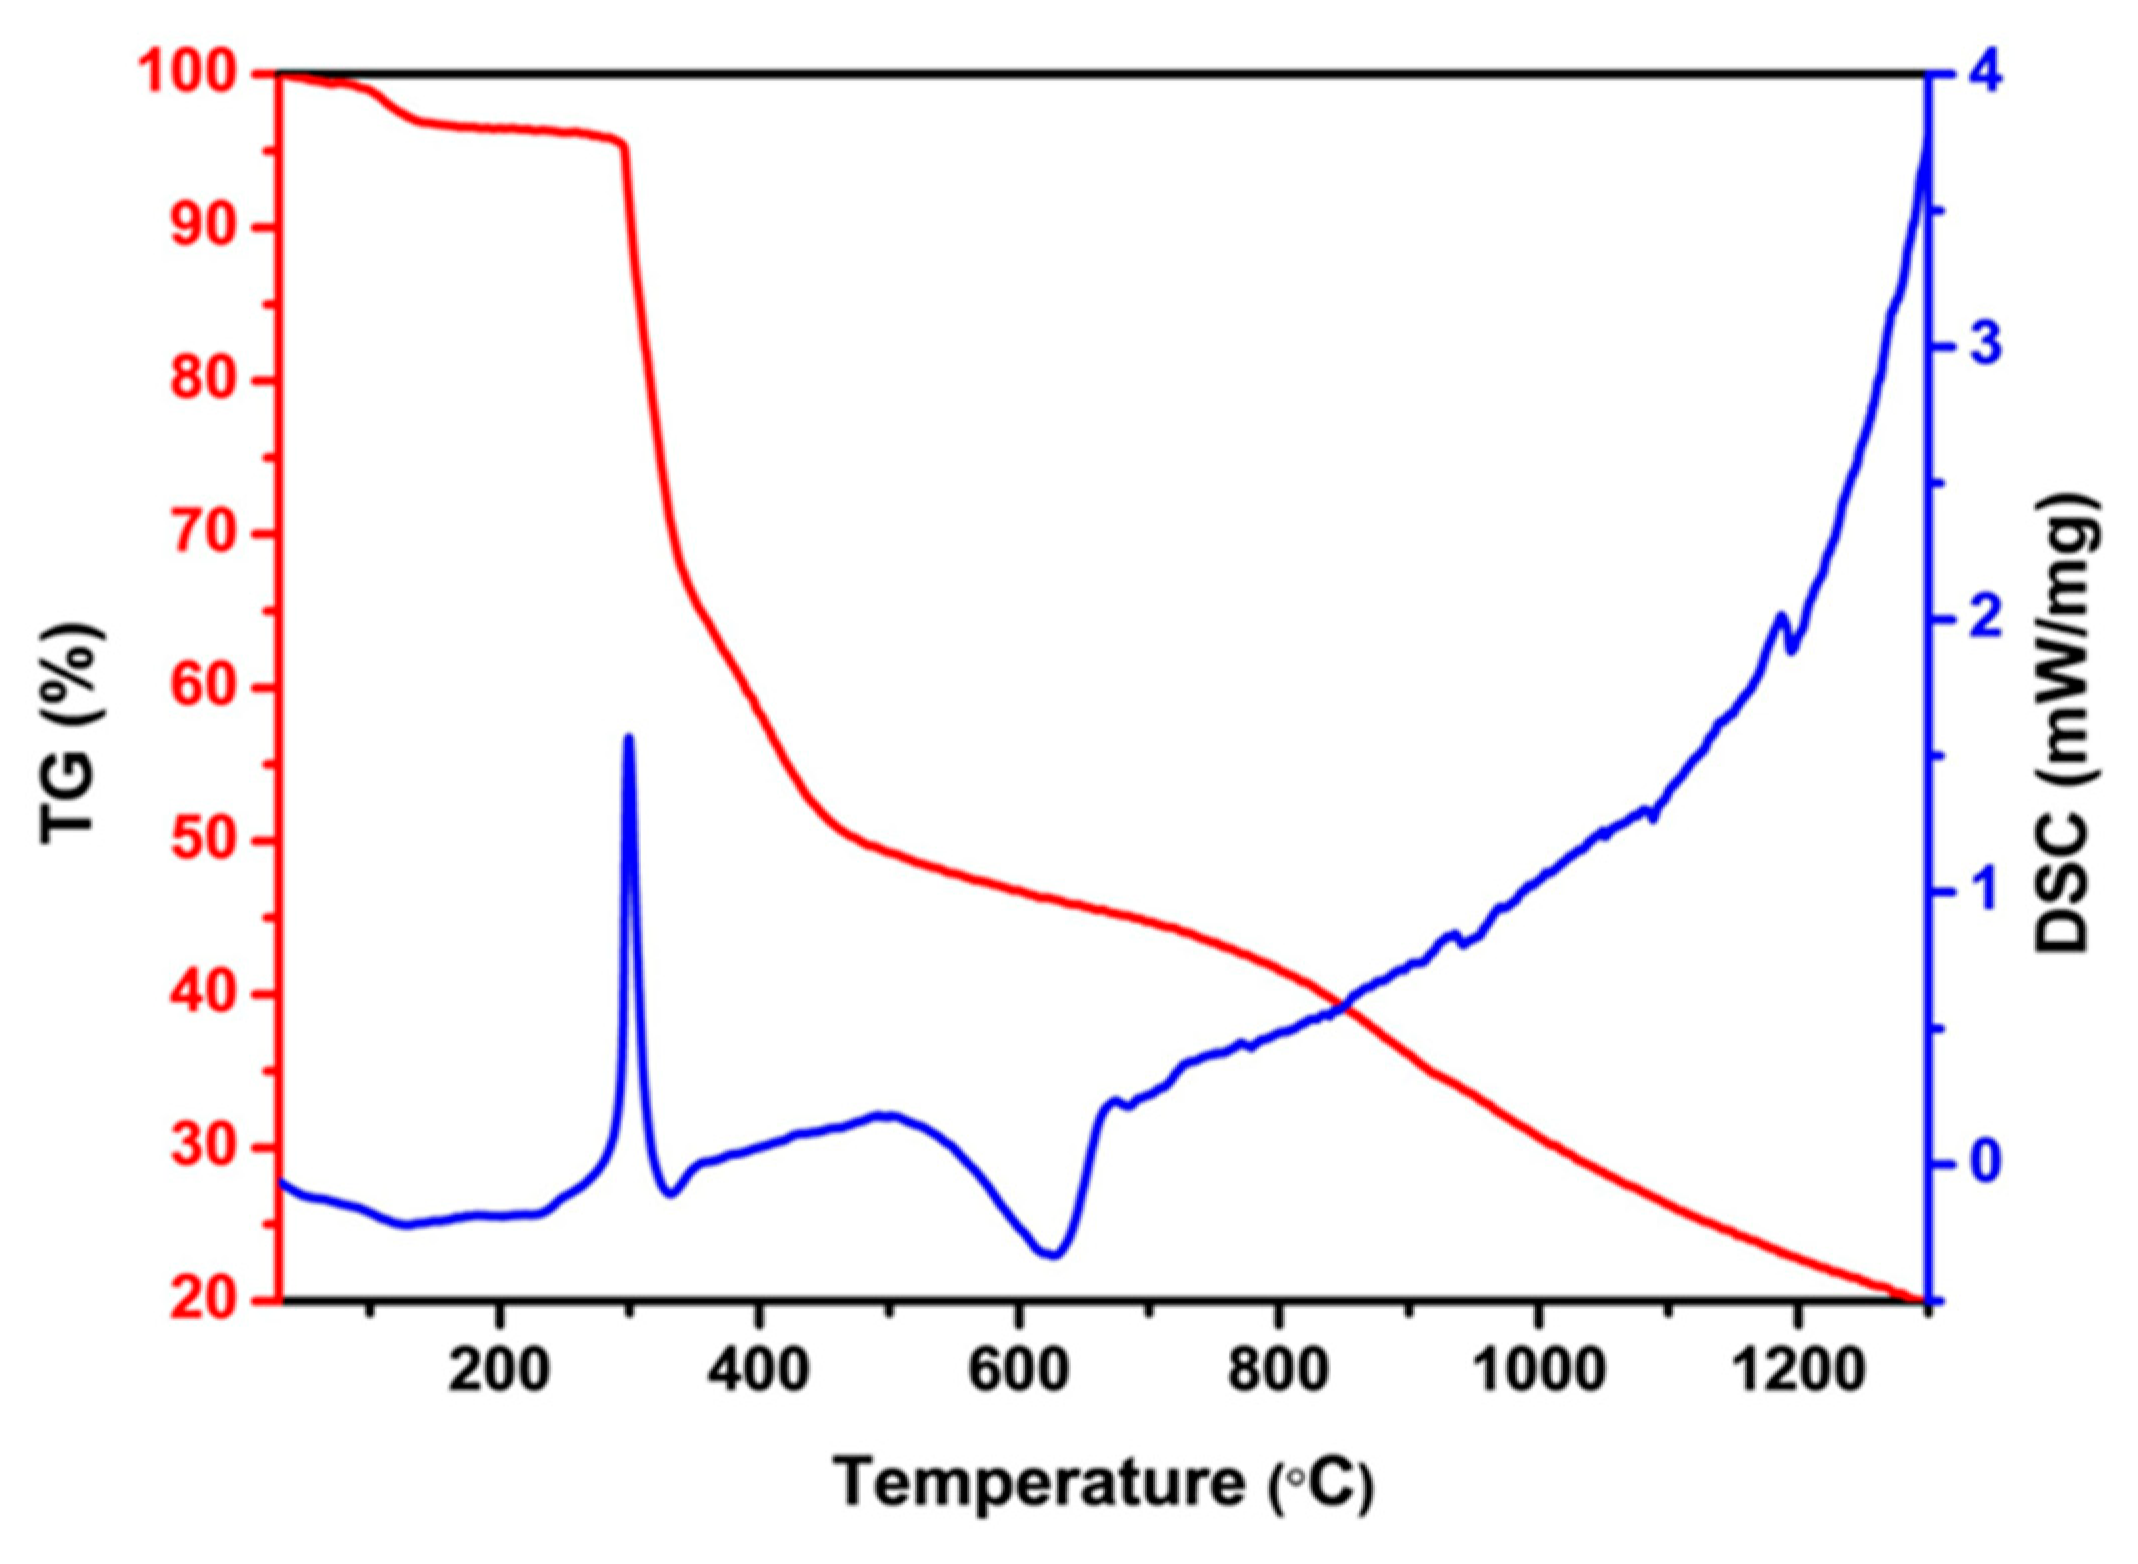
3.1. TGA Analysis of Carbon Nanofibers
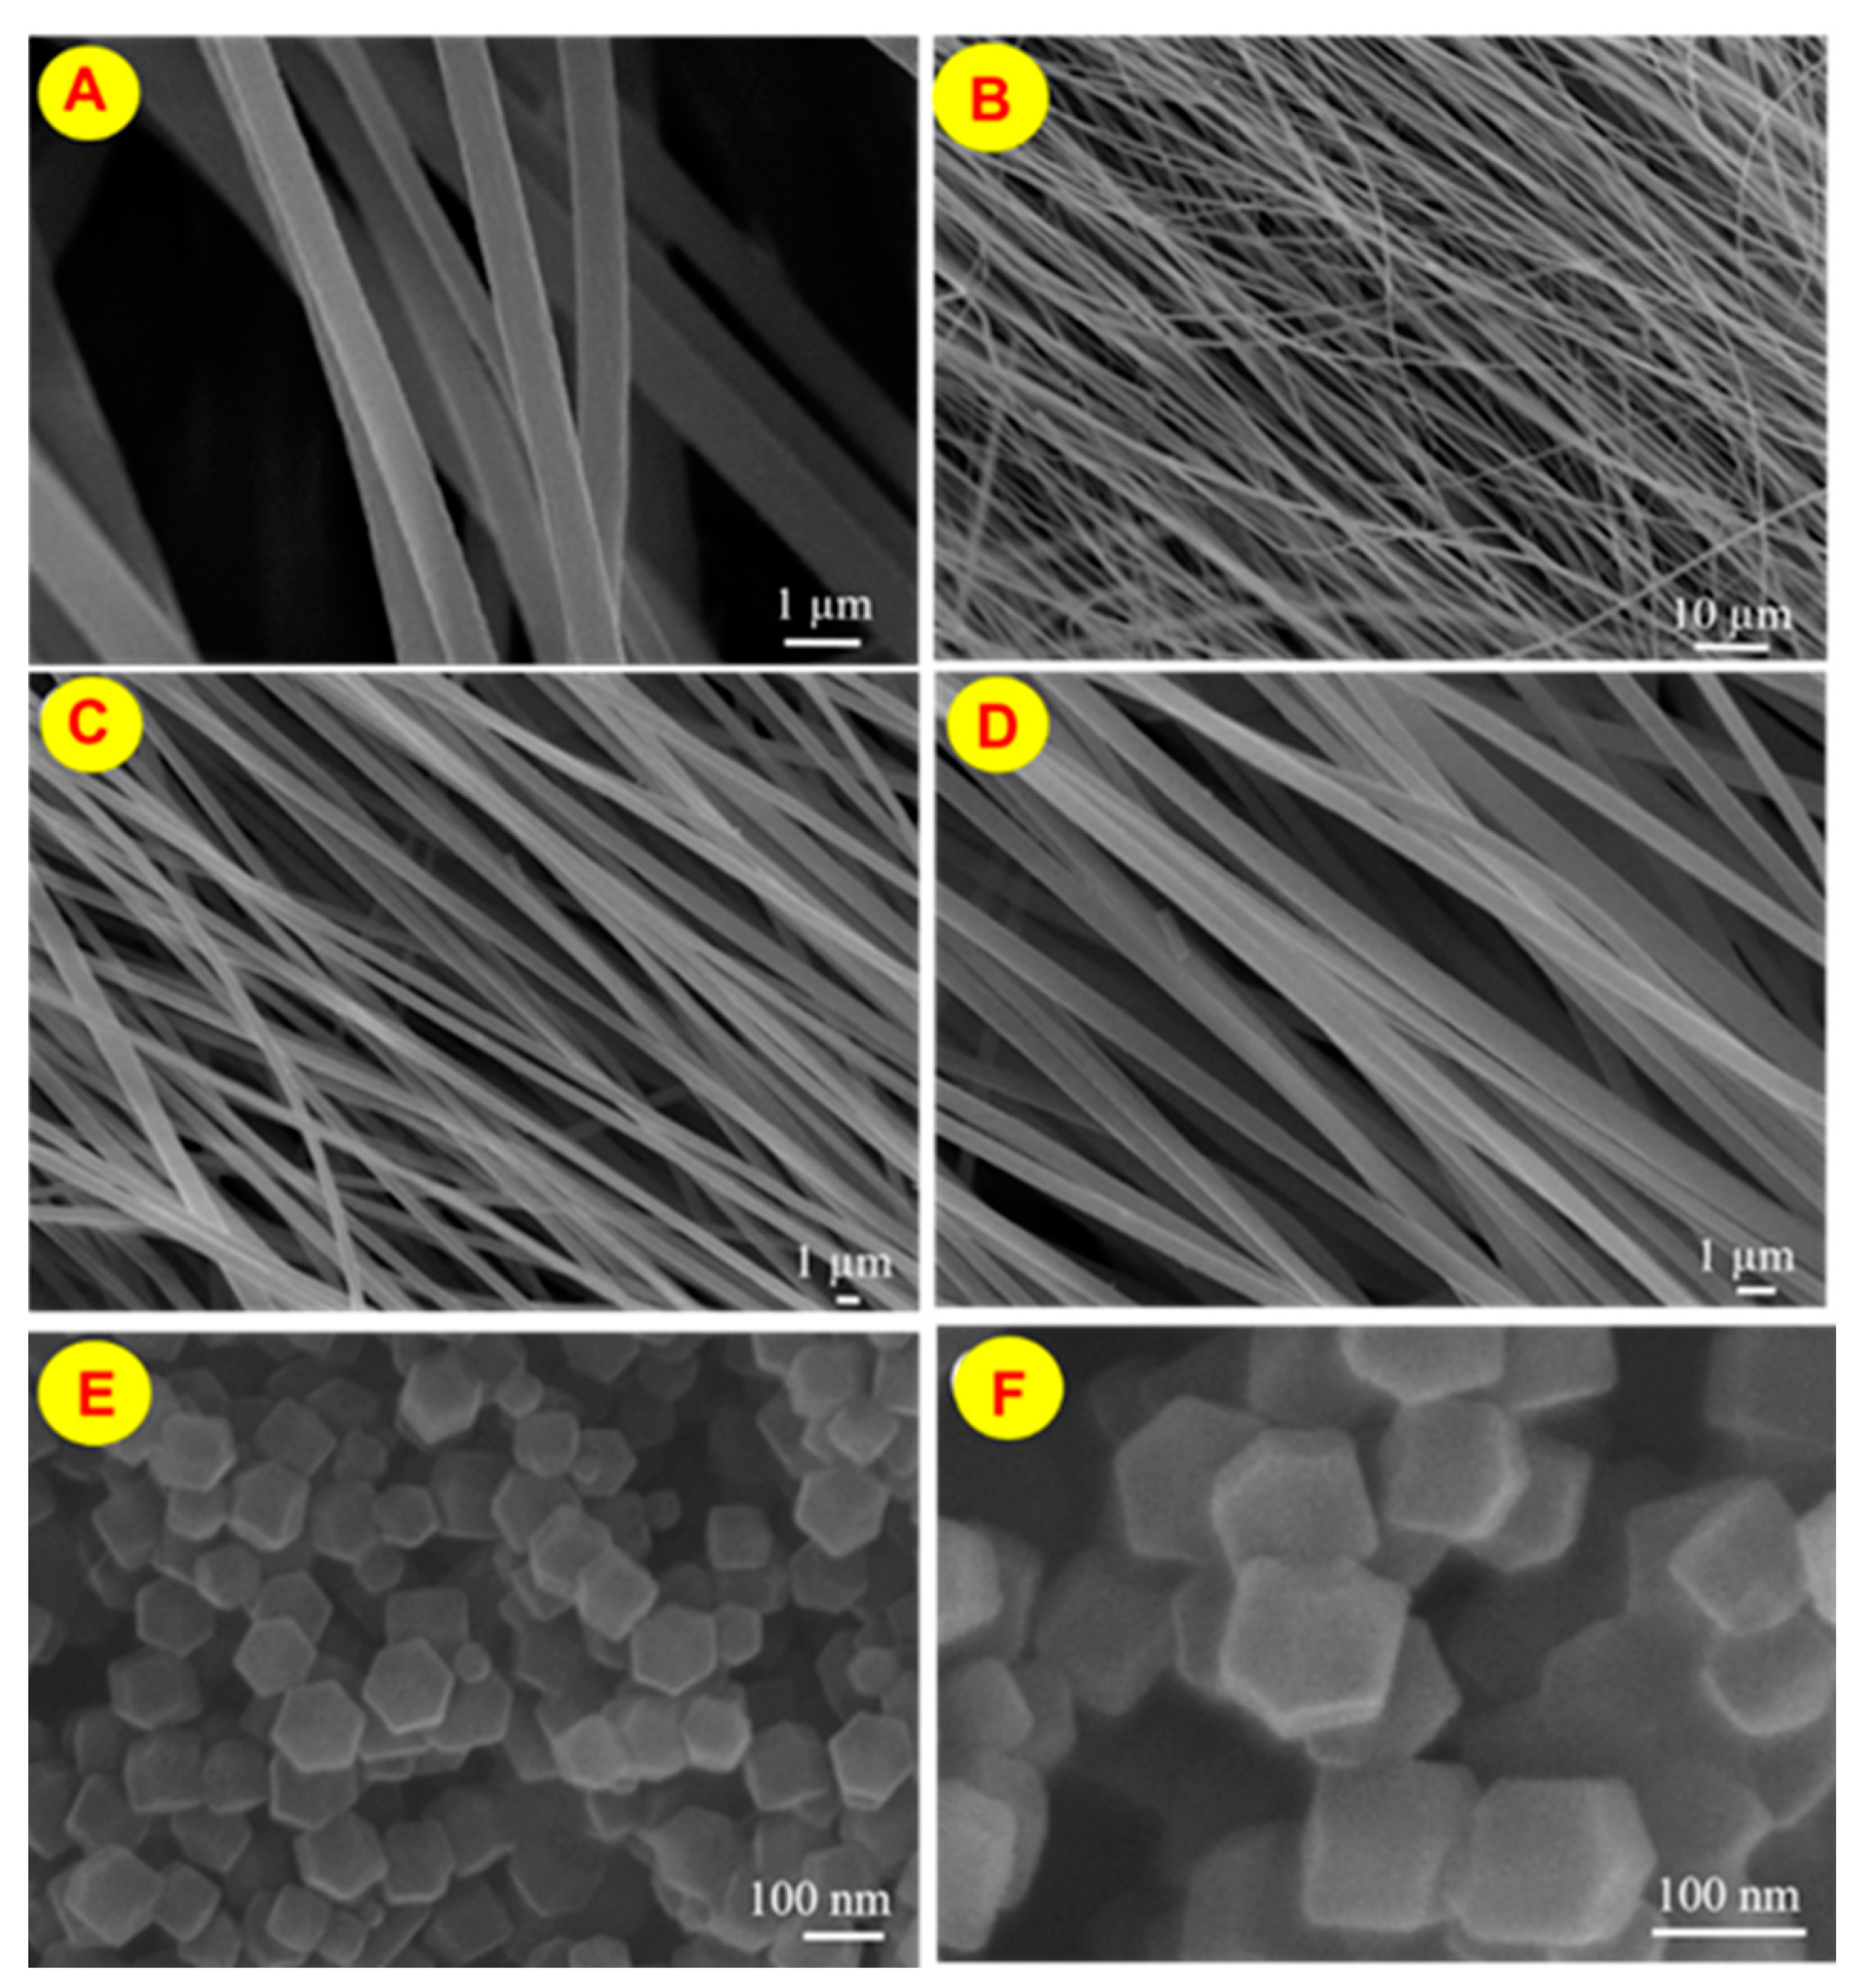
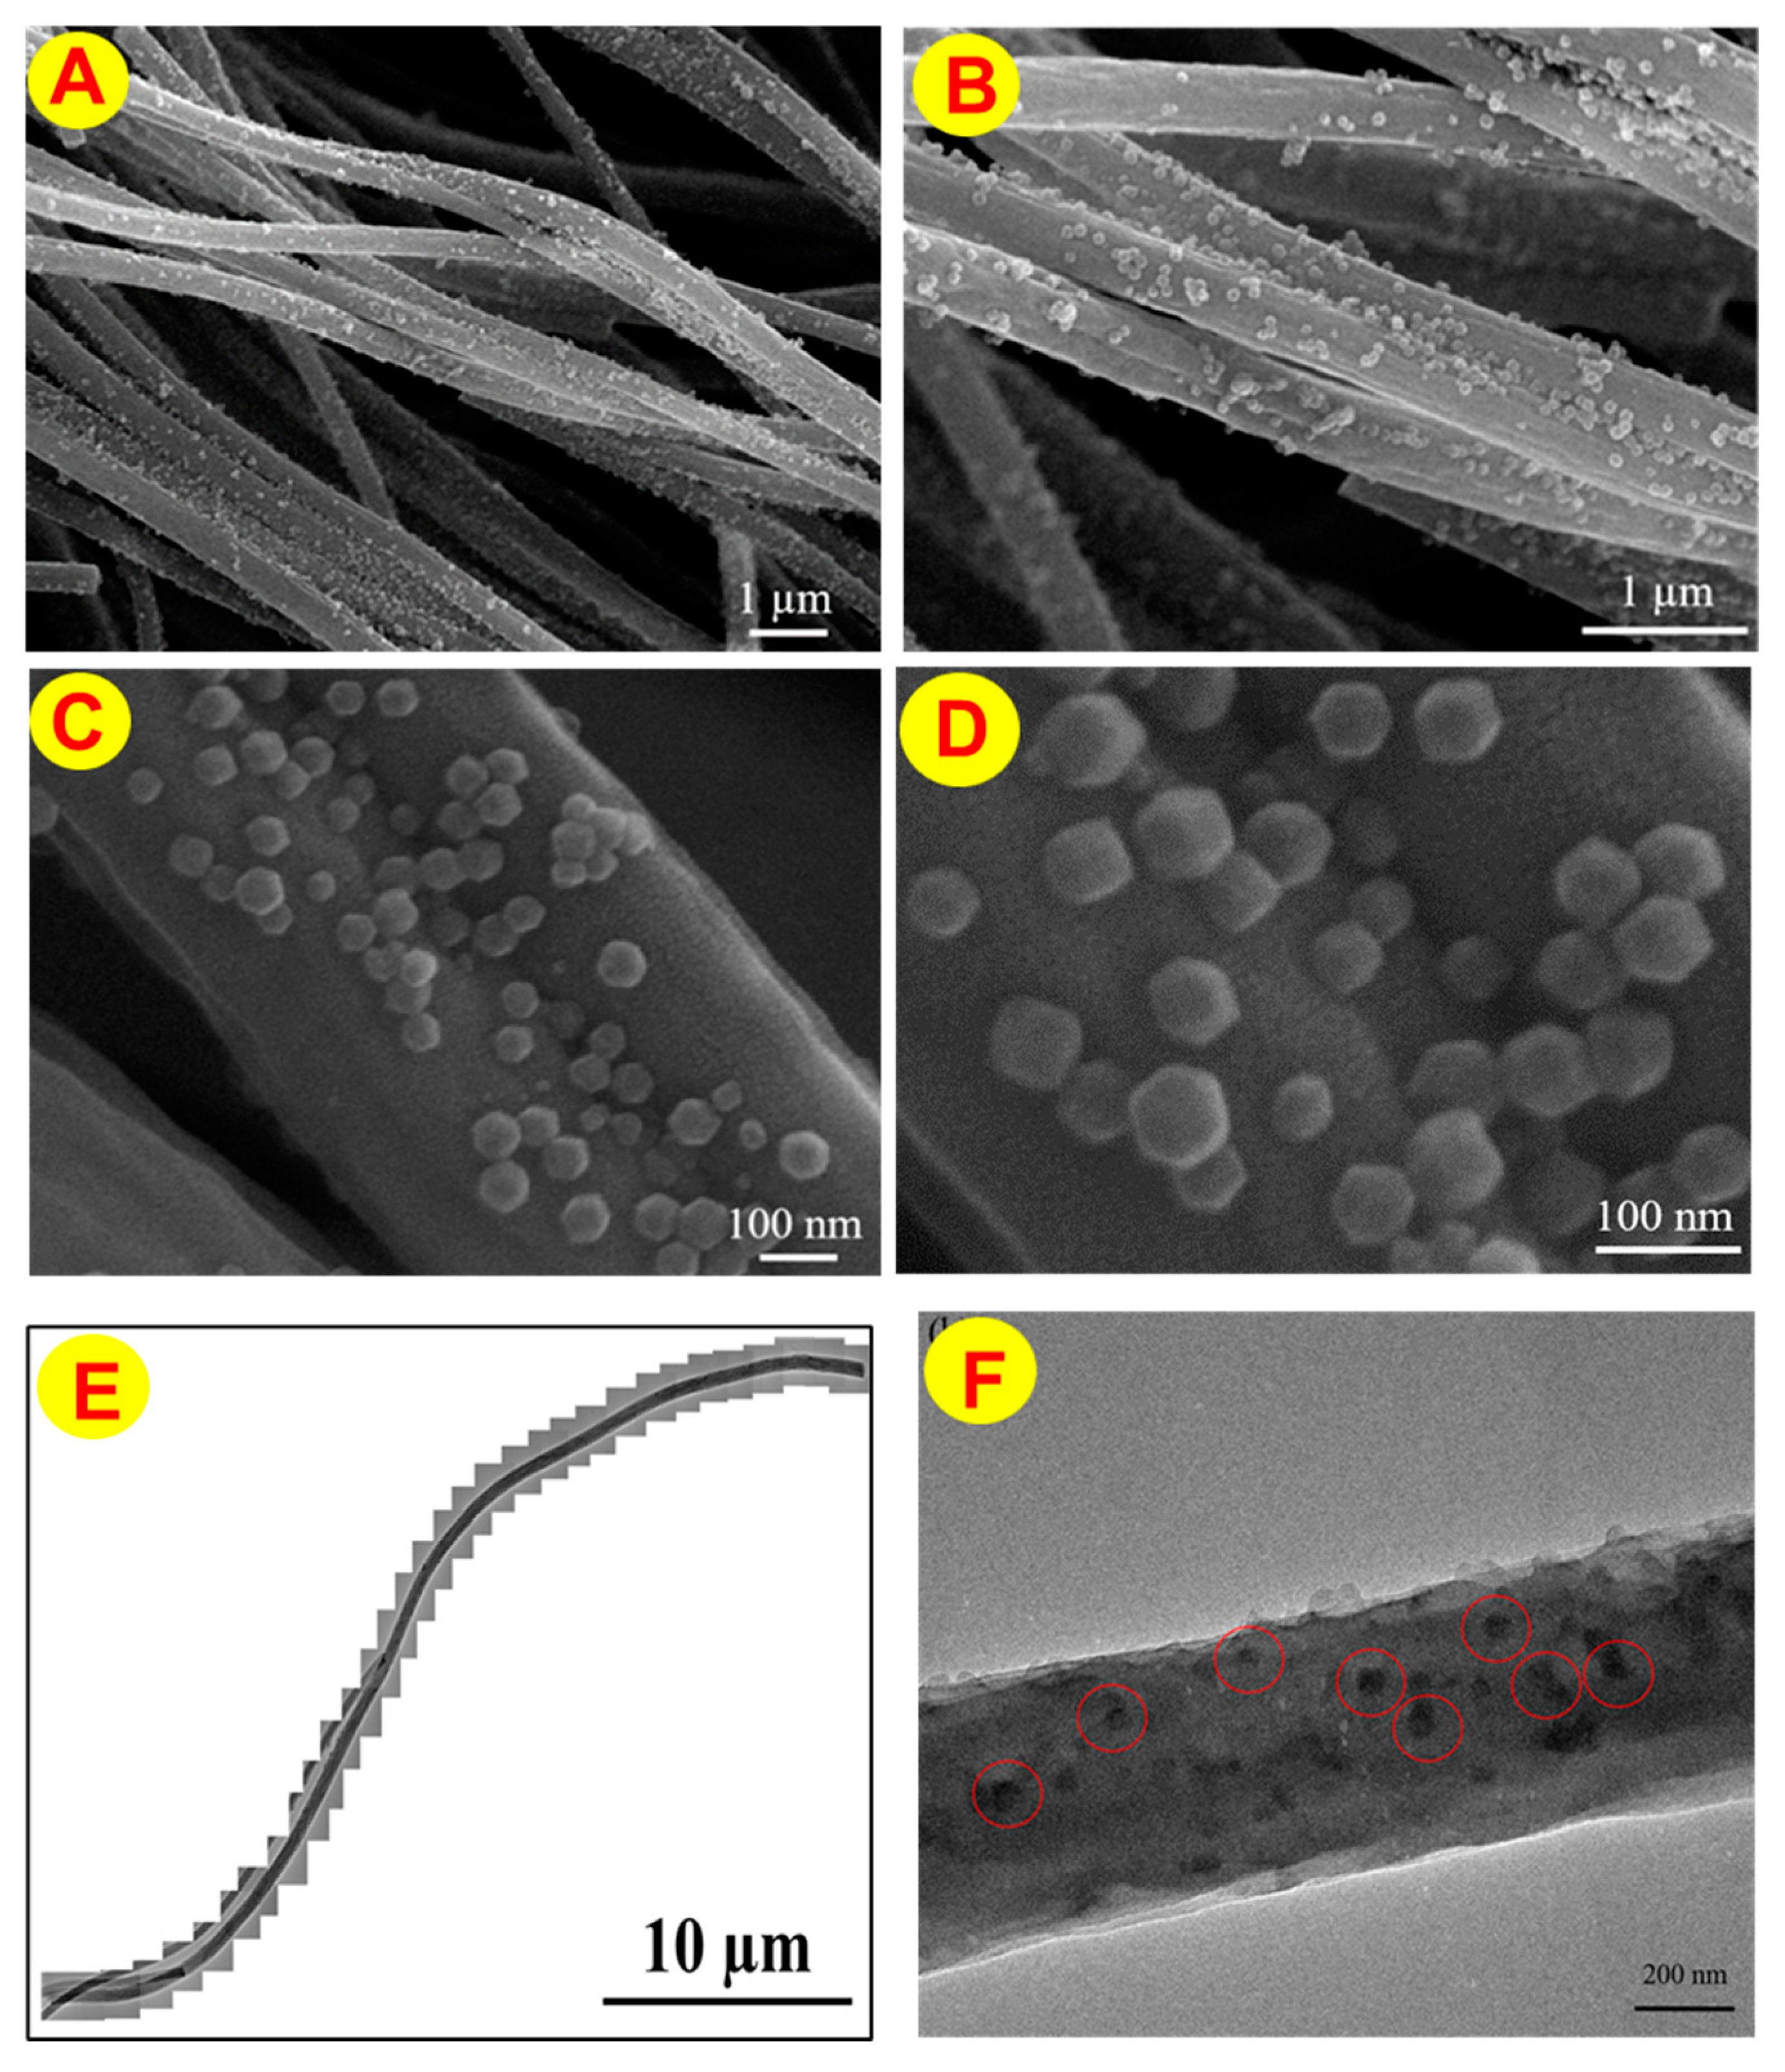
3.2. SEM and TEM Analysis
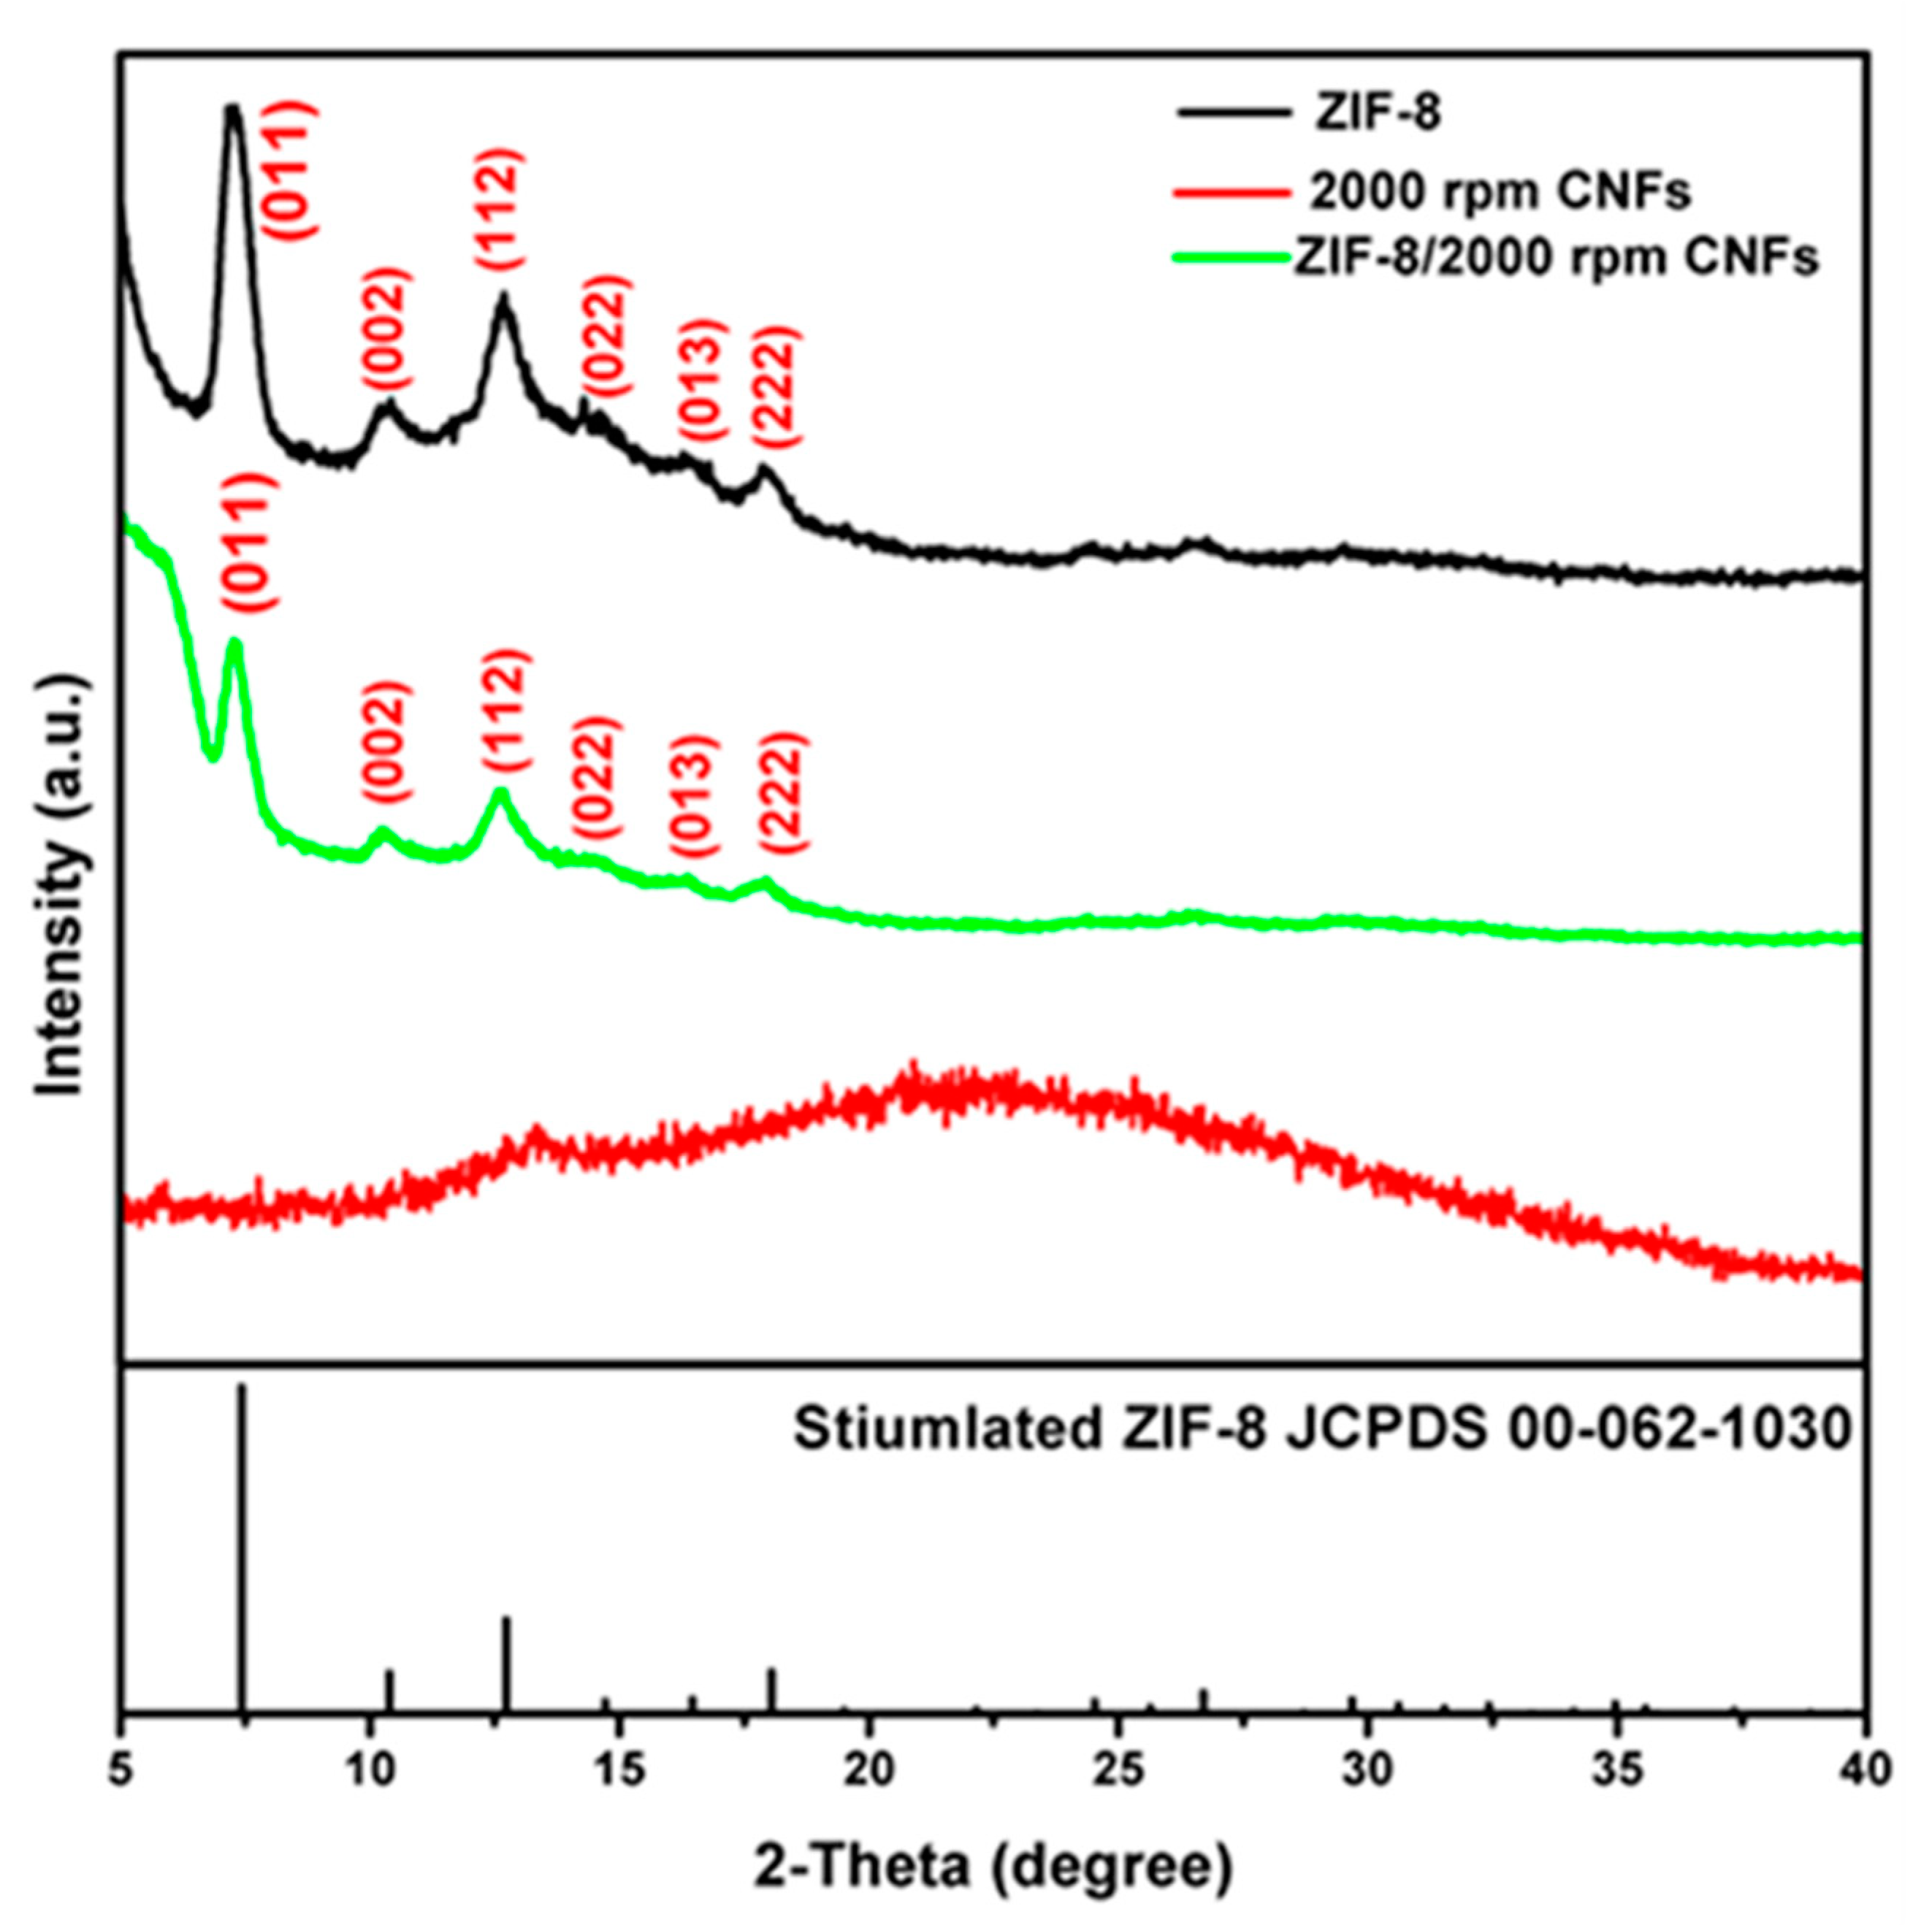
3.3. XRD Studies
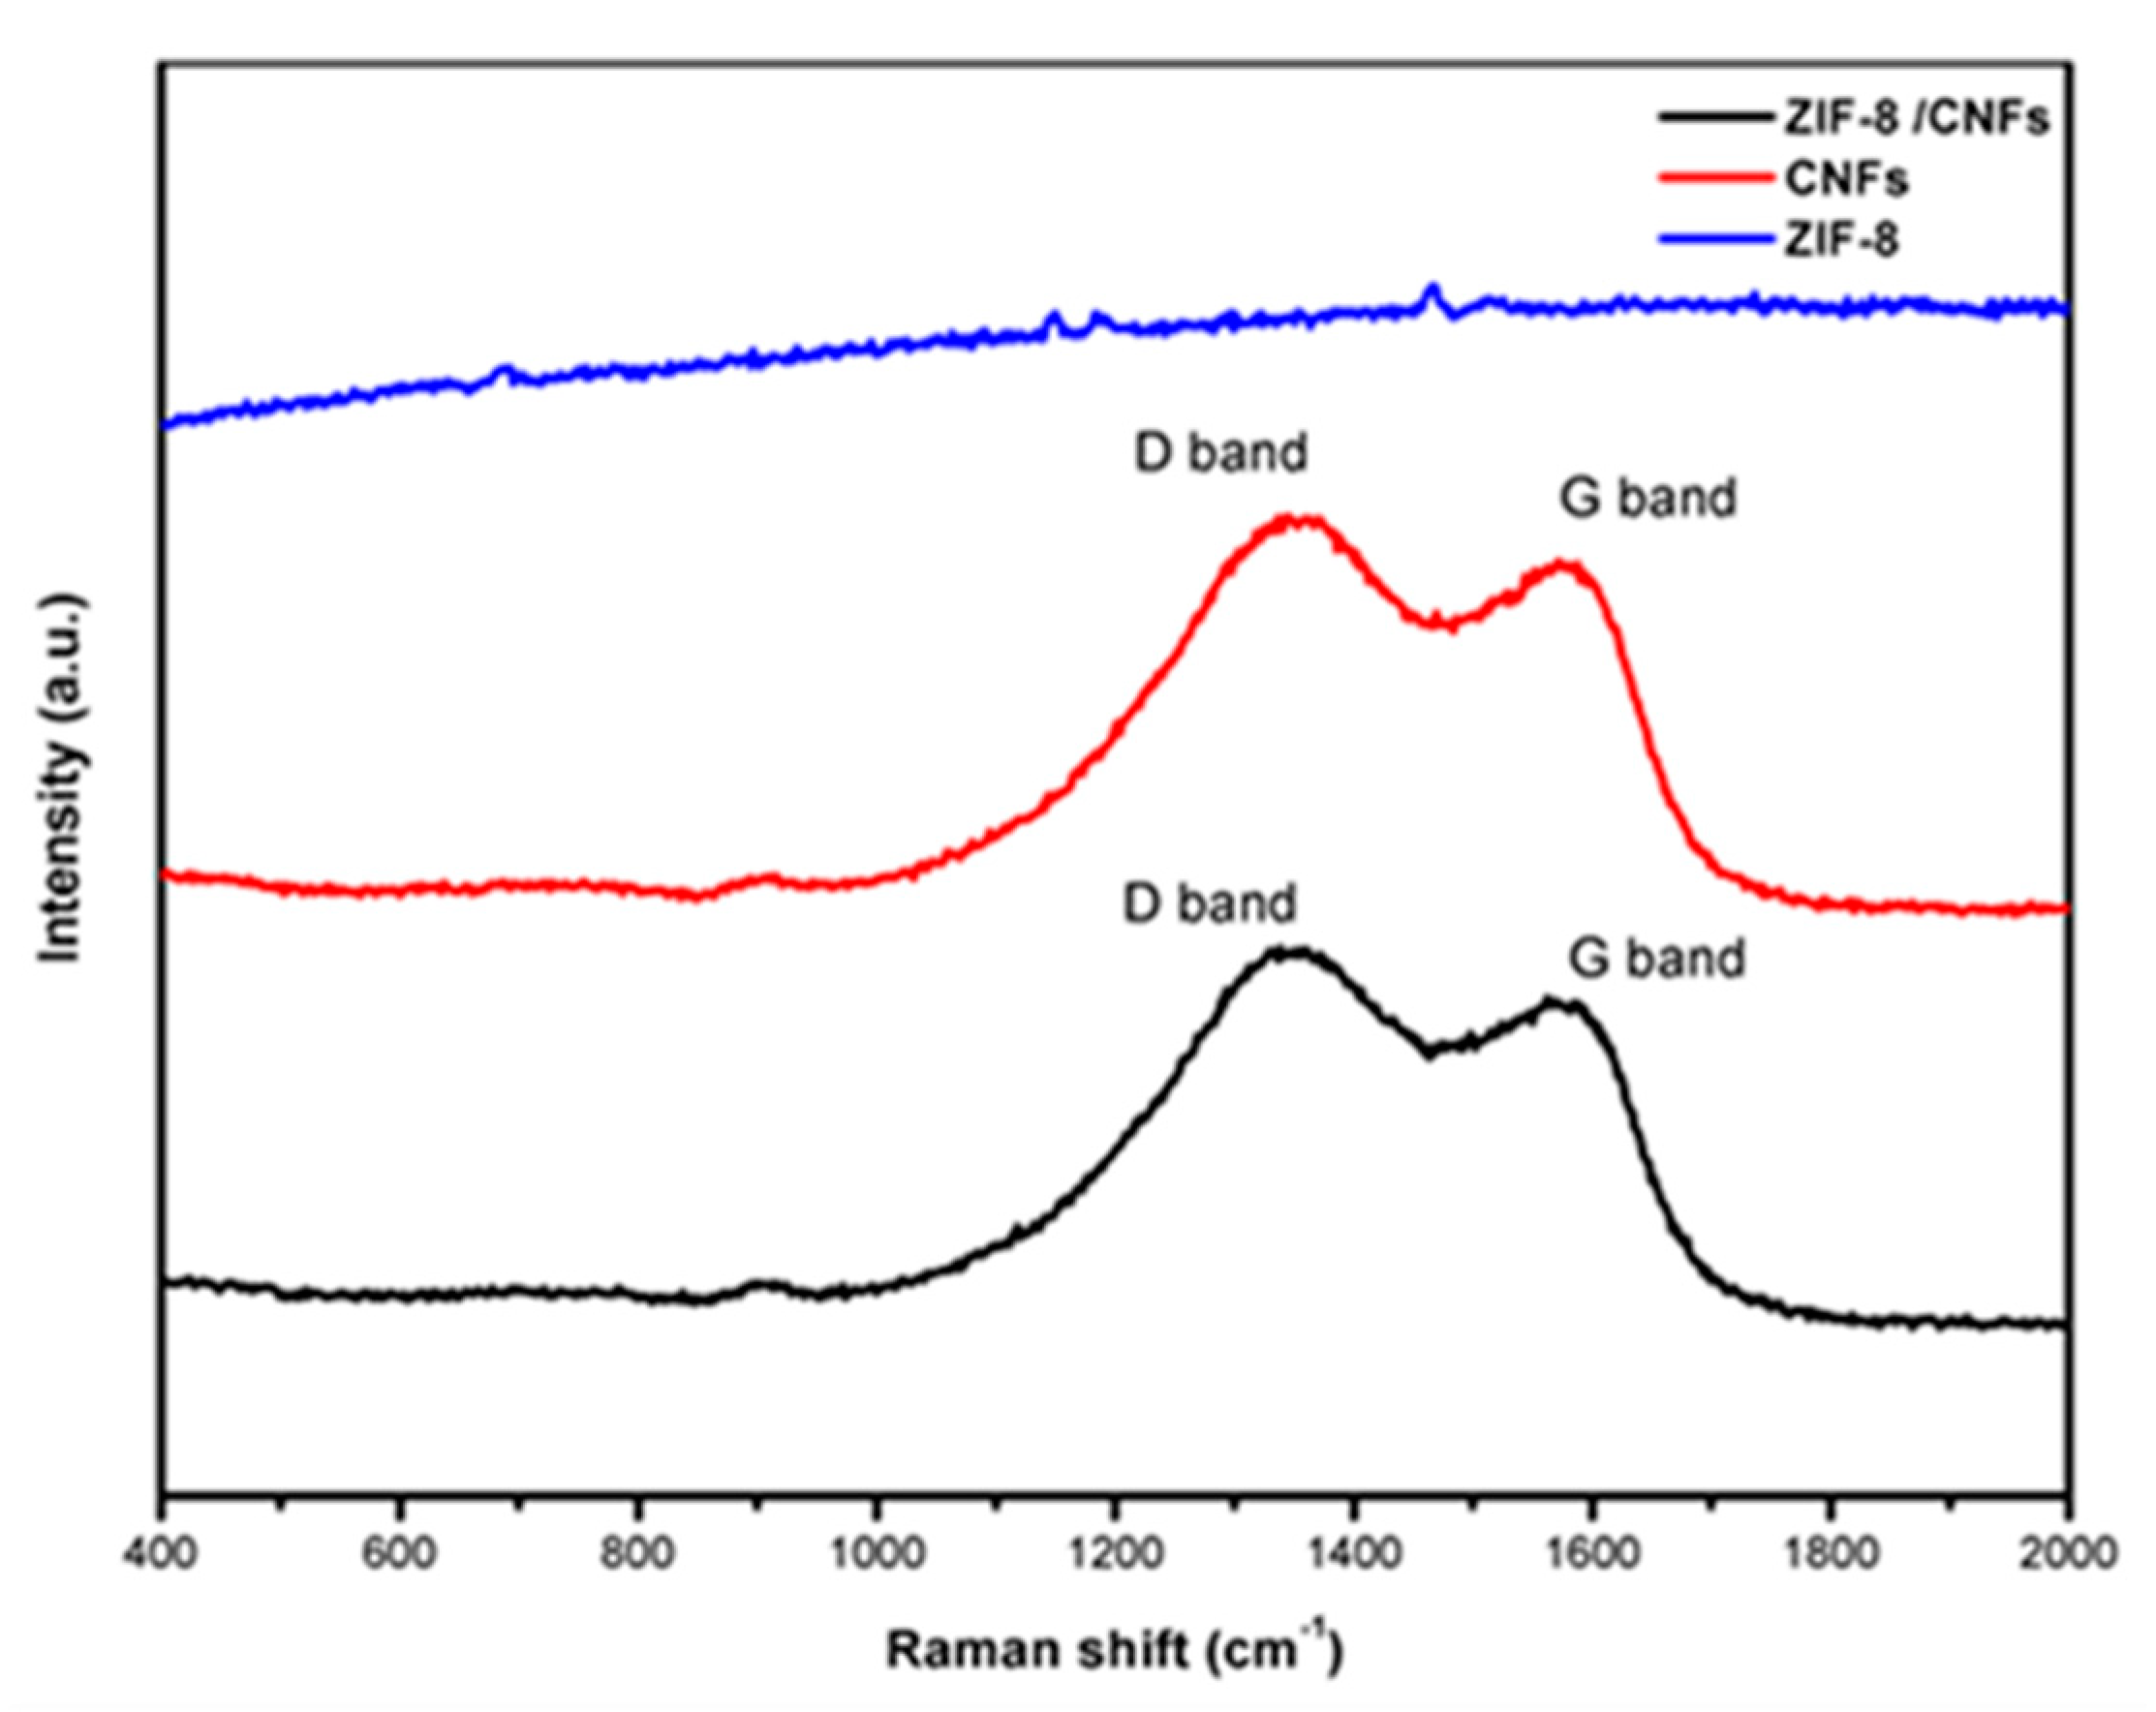
3.4. Raman Spectra
3.5. BET Analysis
4. Electrochemical Analysis of ZIF-8/CNFs Composite toward NFZ
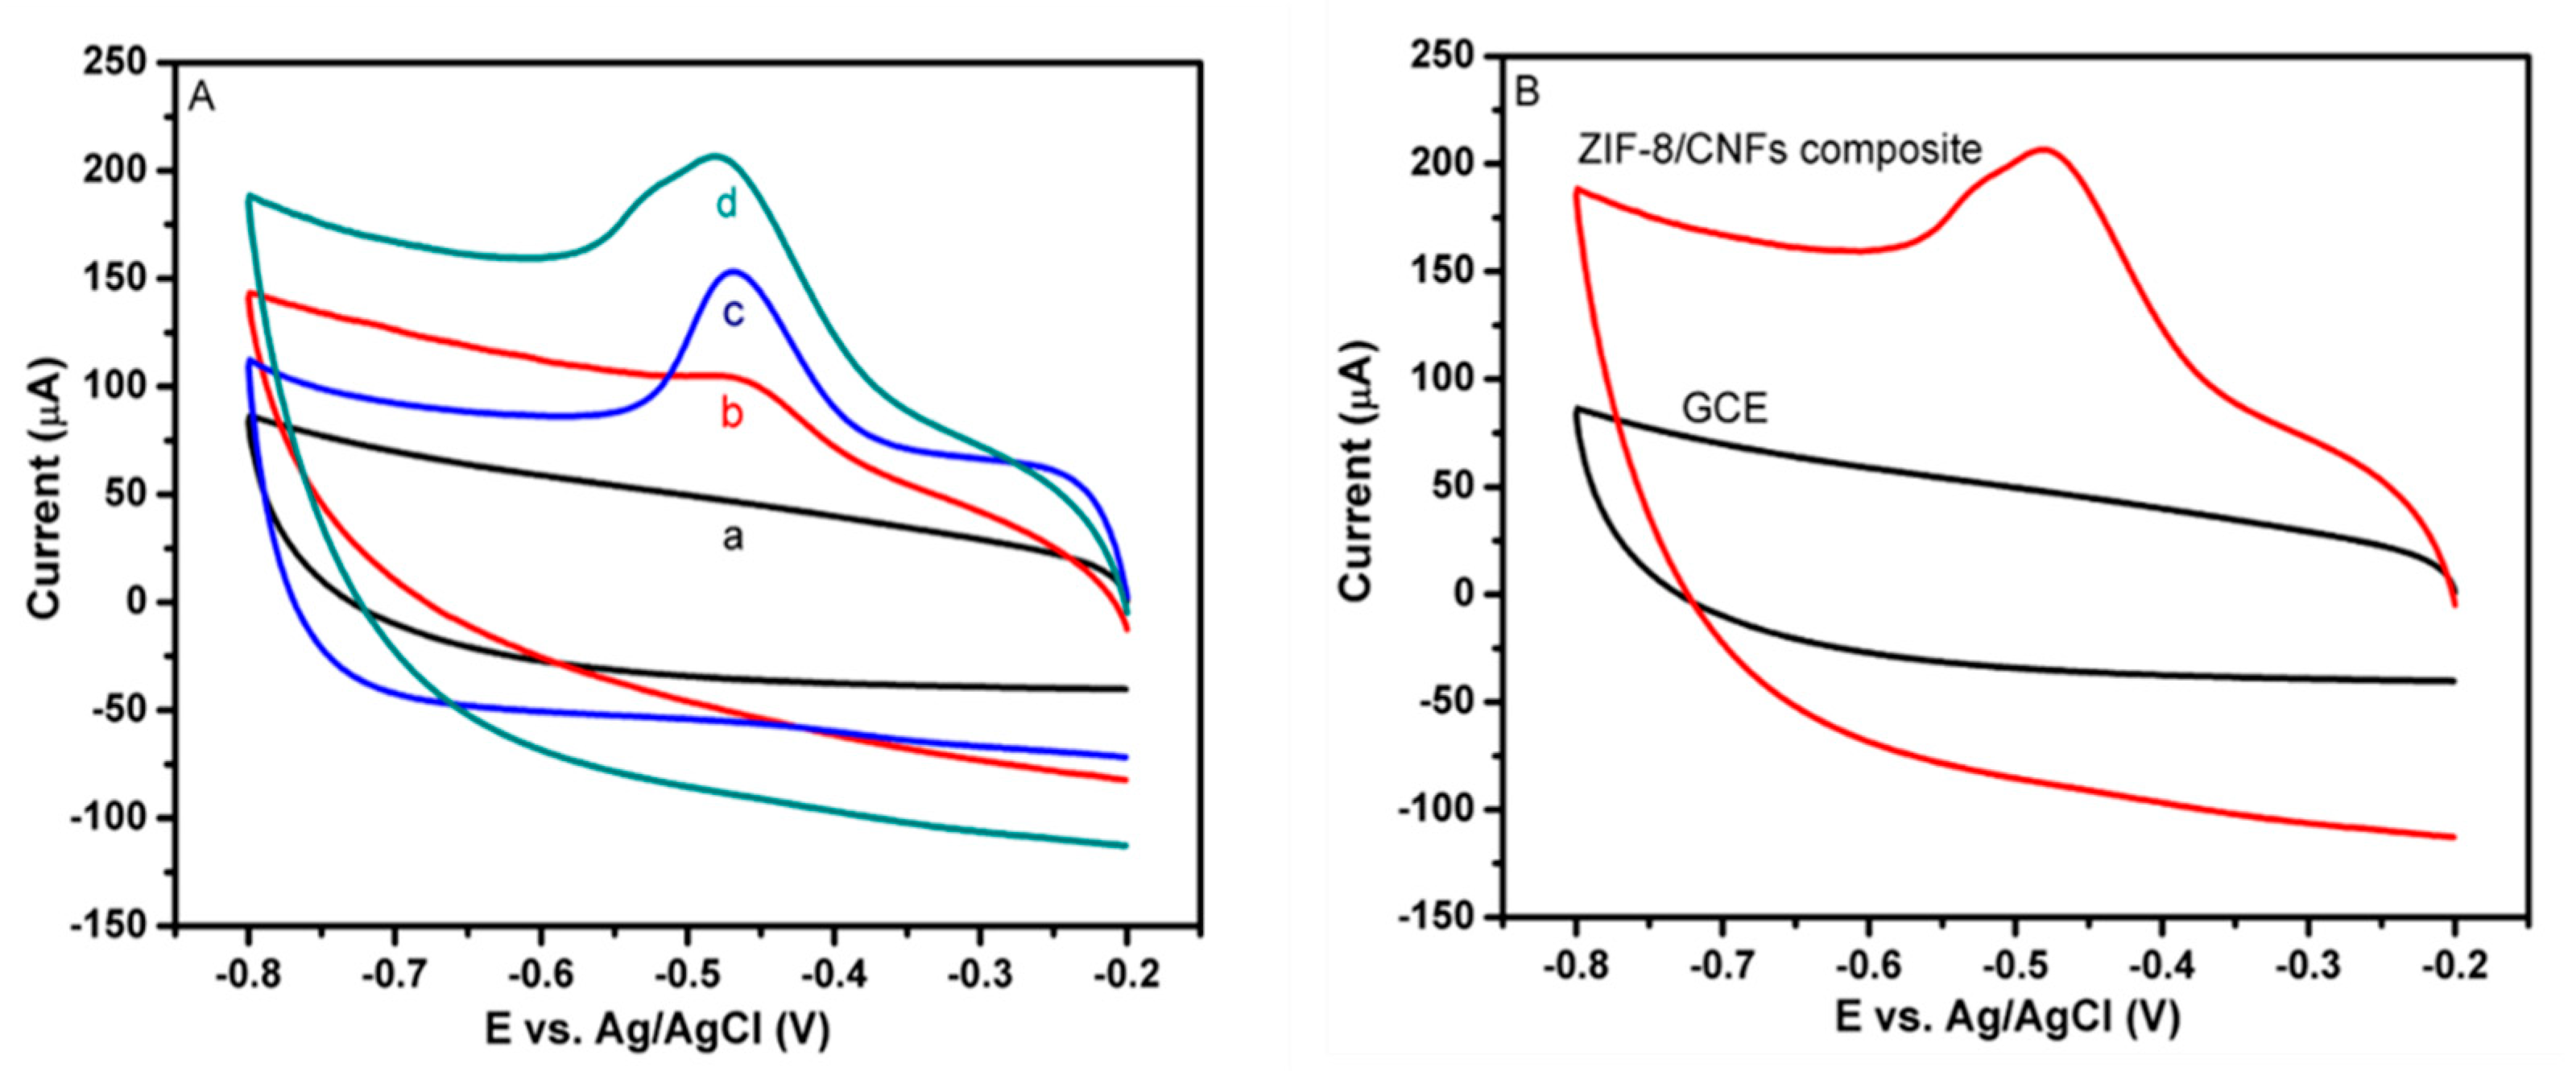
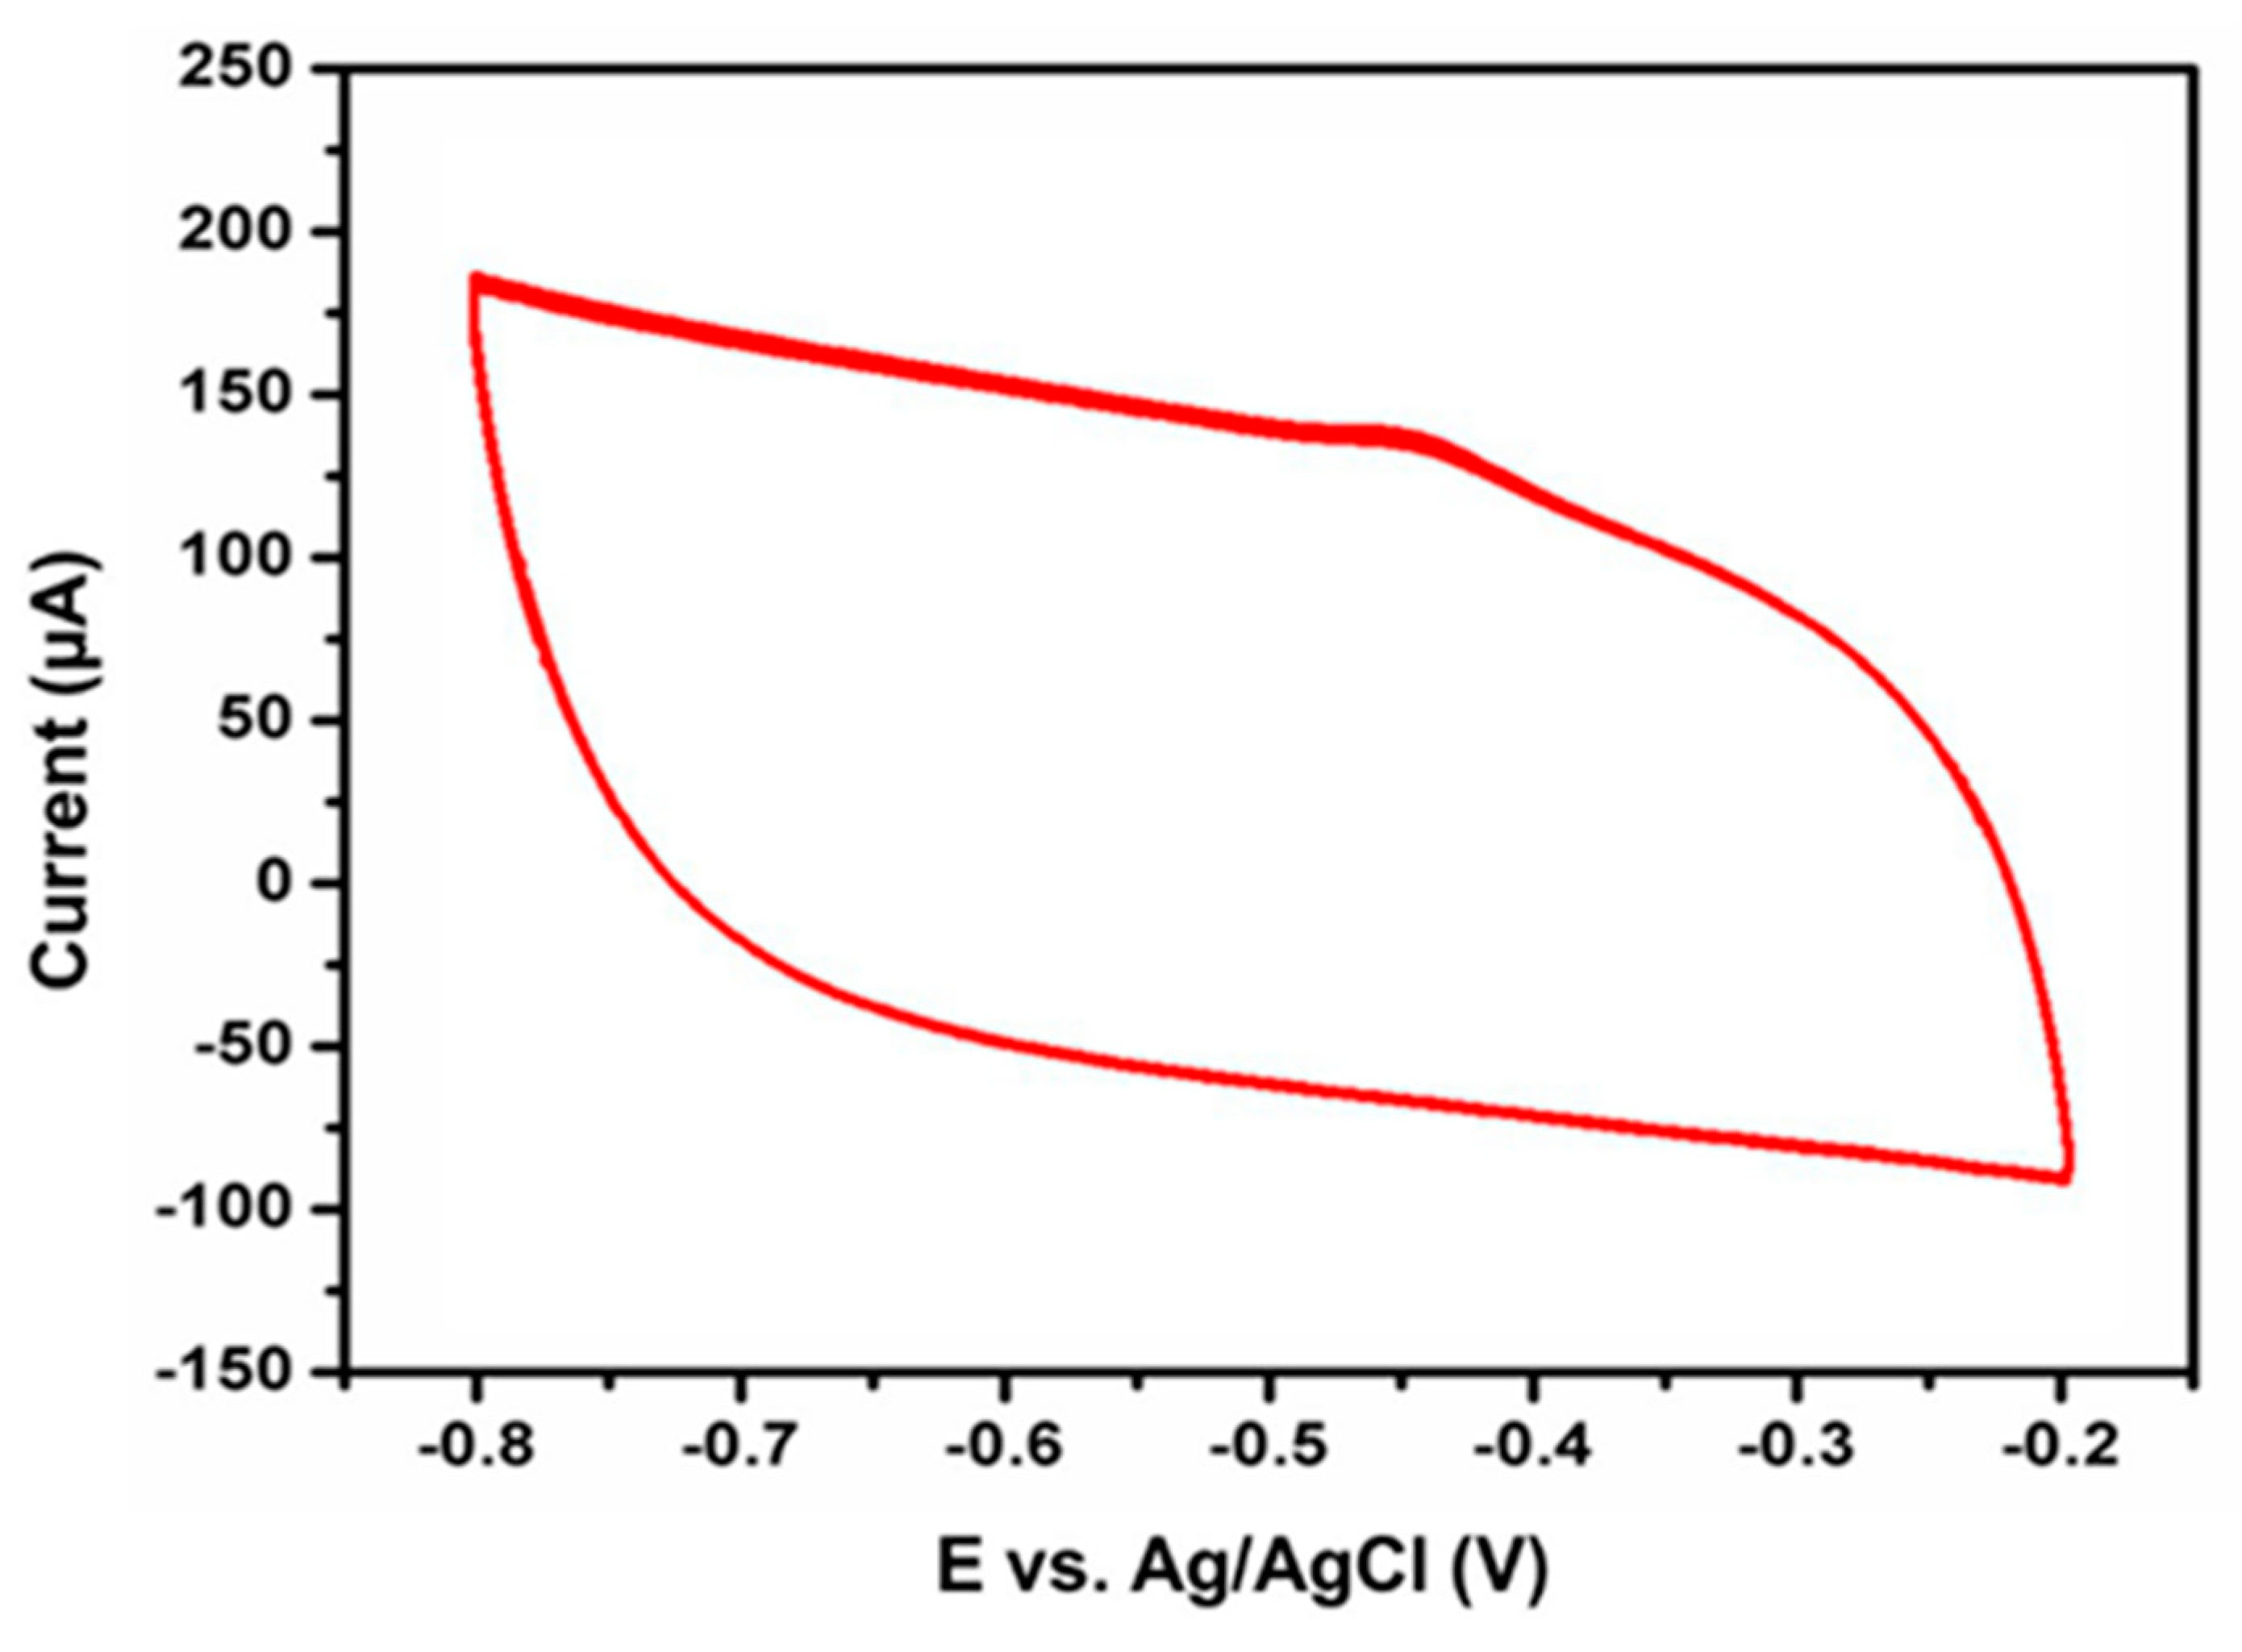
4.1. Electrochemical Performance of NFZ at Modified Electrodes
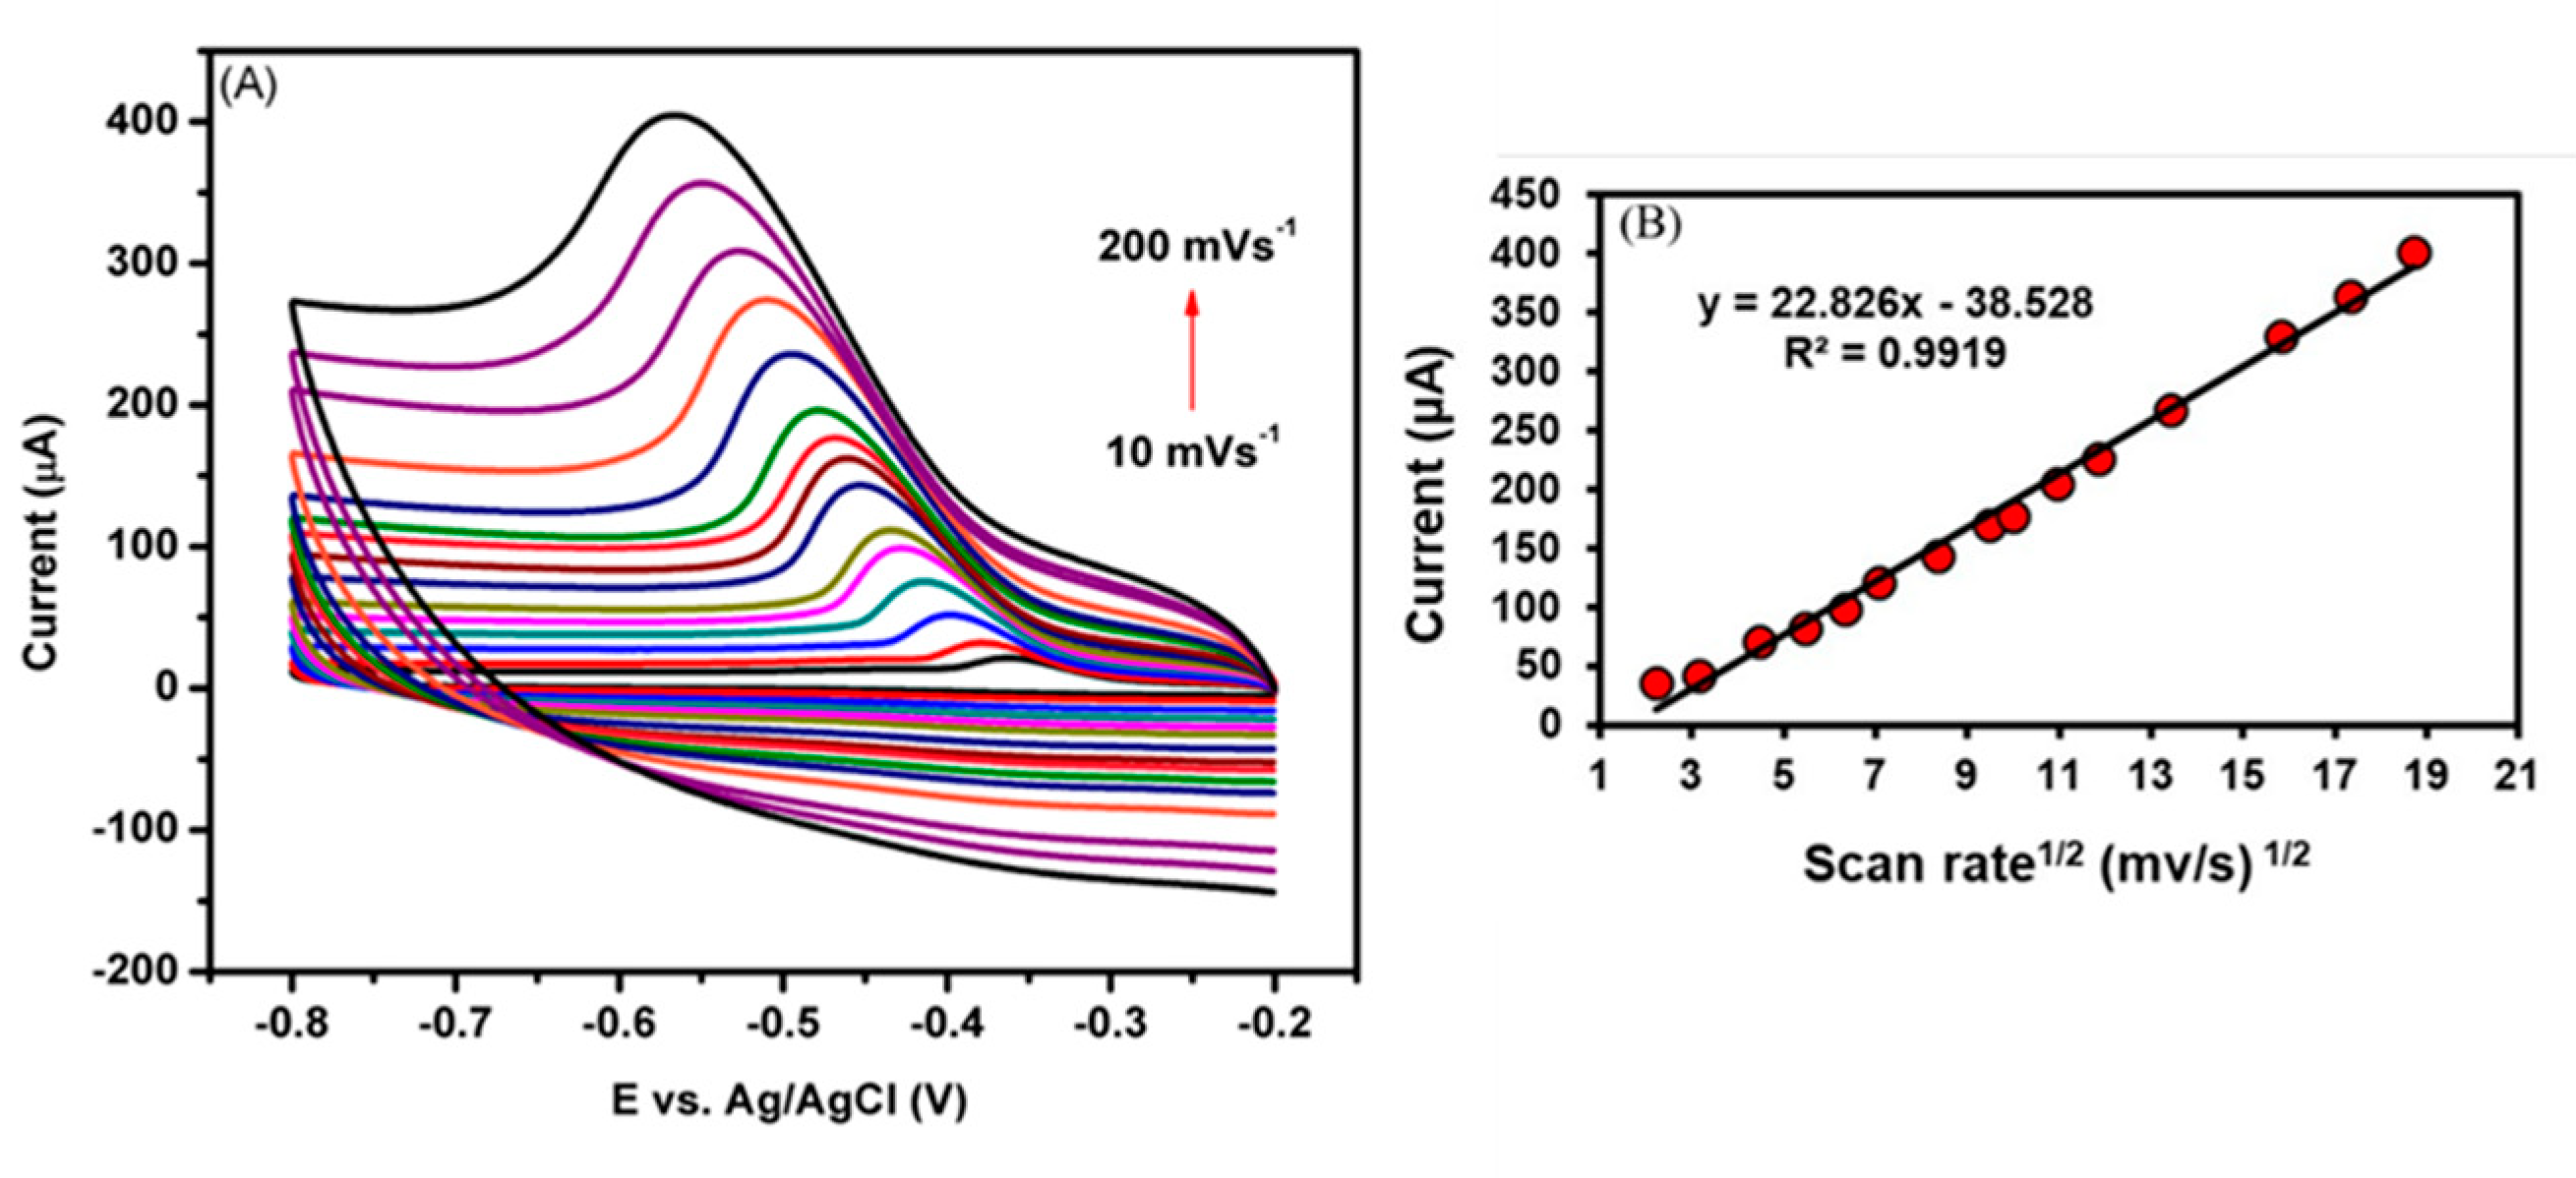
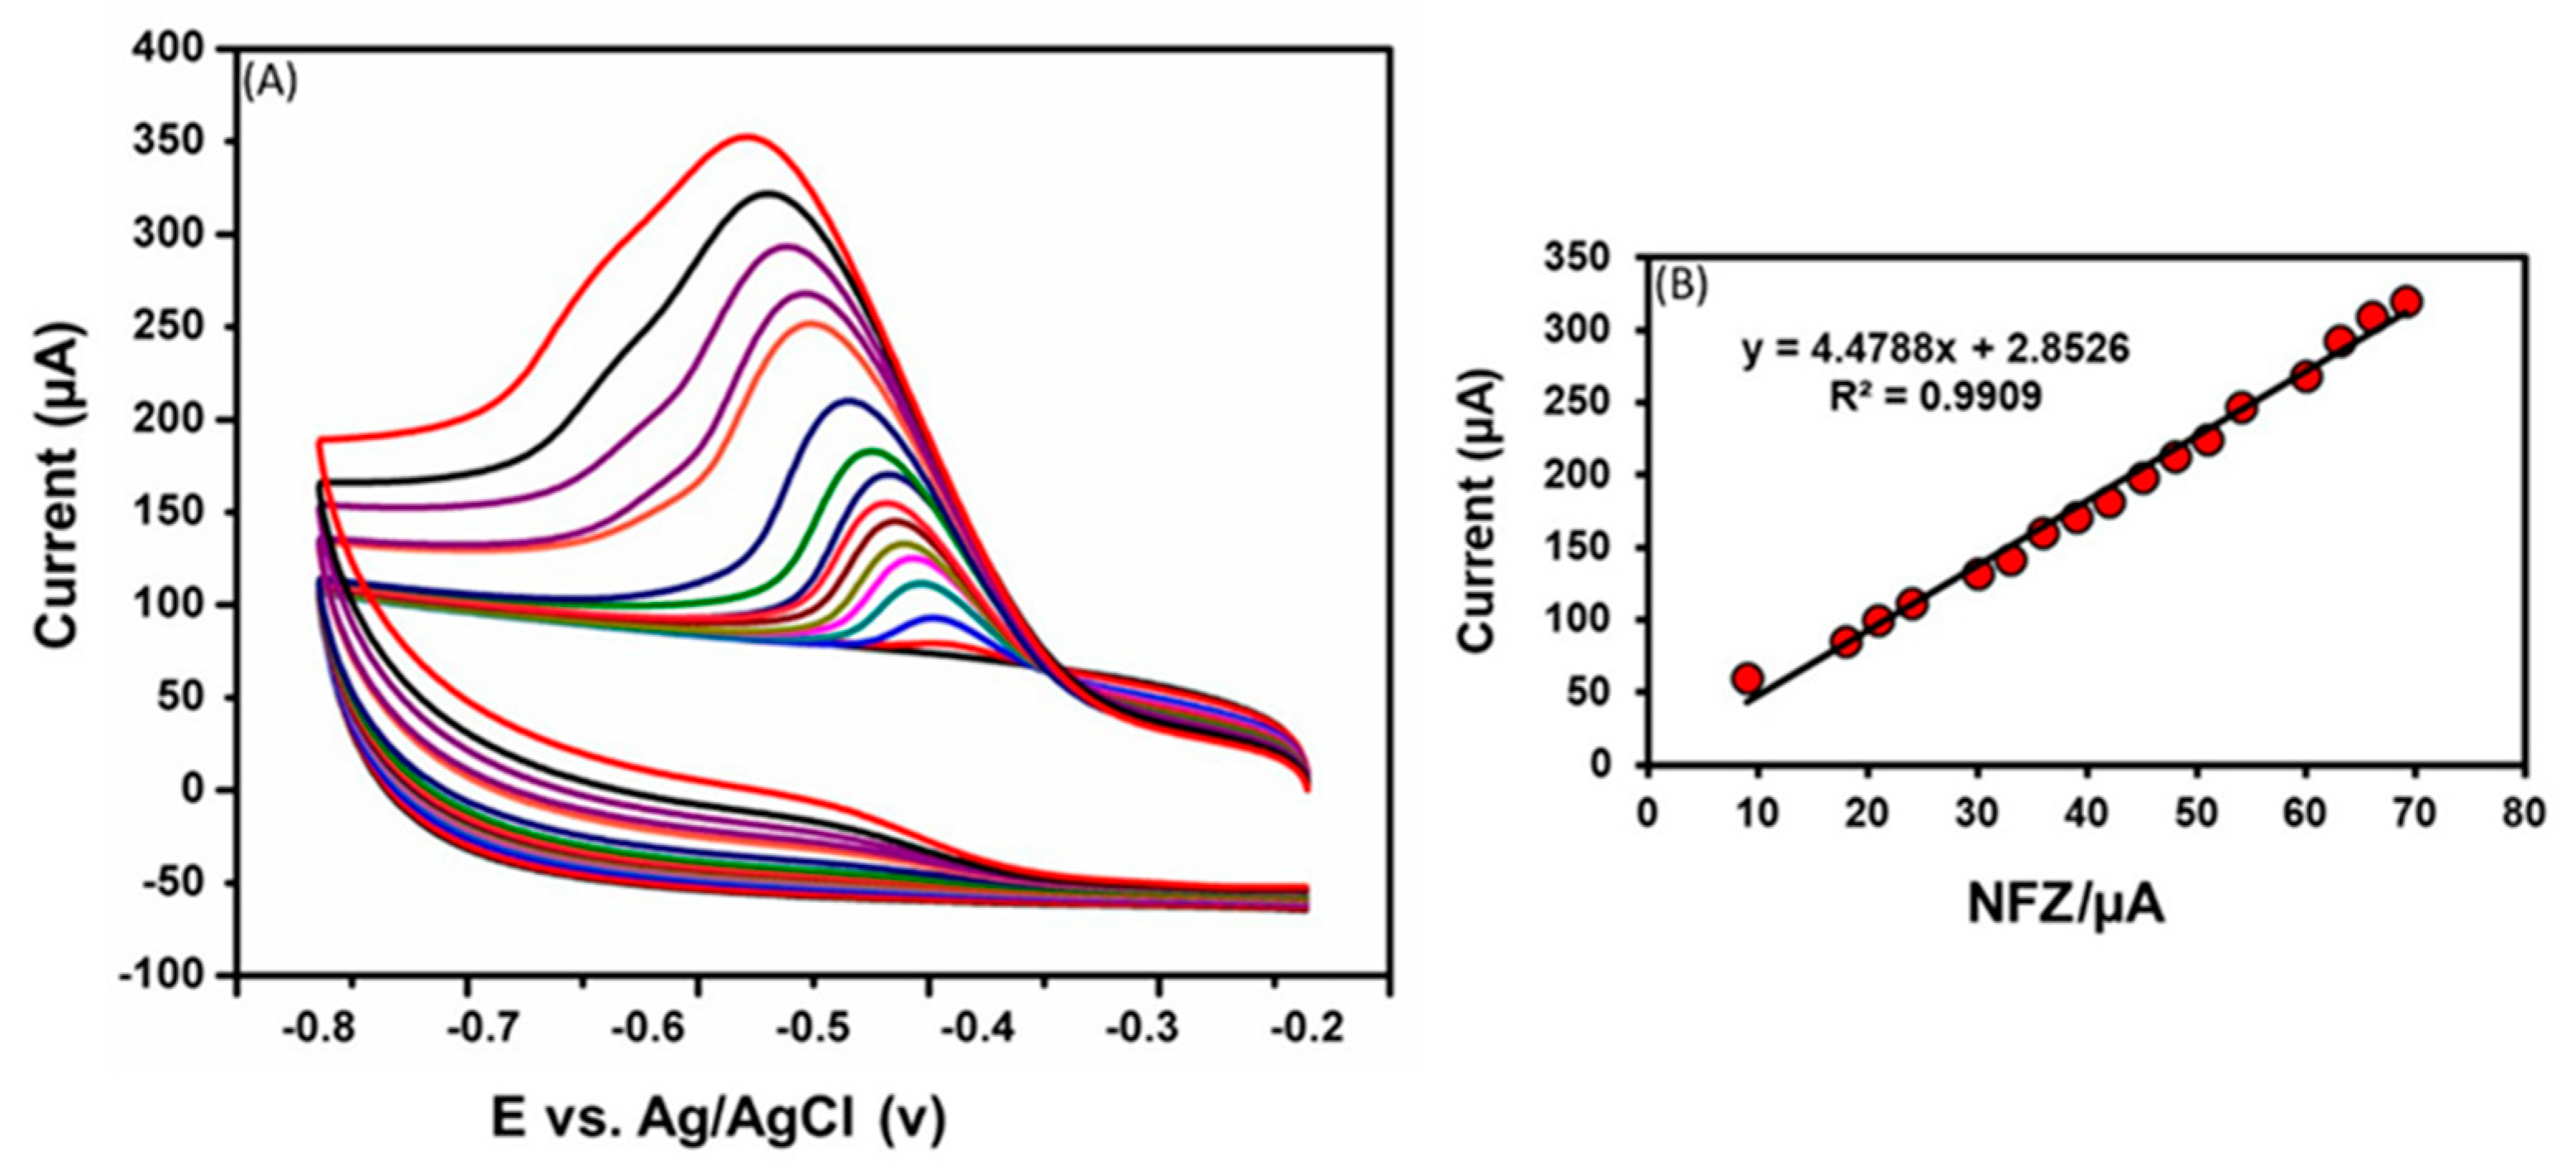
4.2. Effects of Different Scan Rates
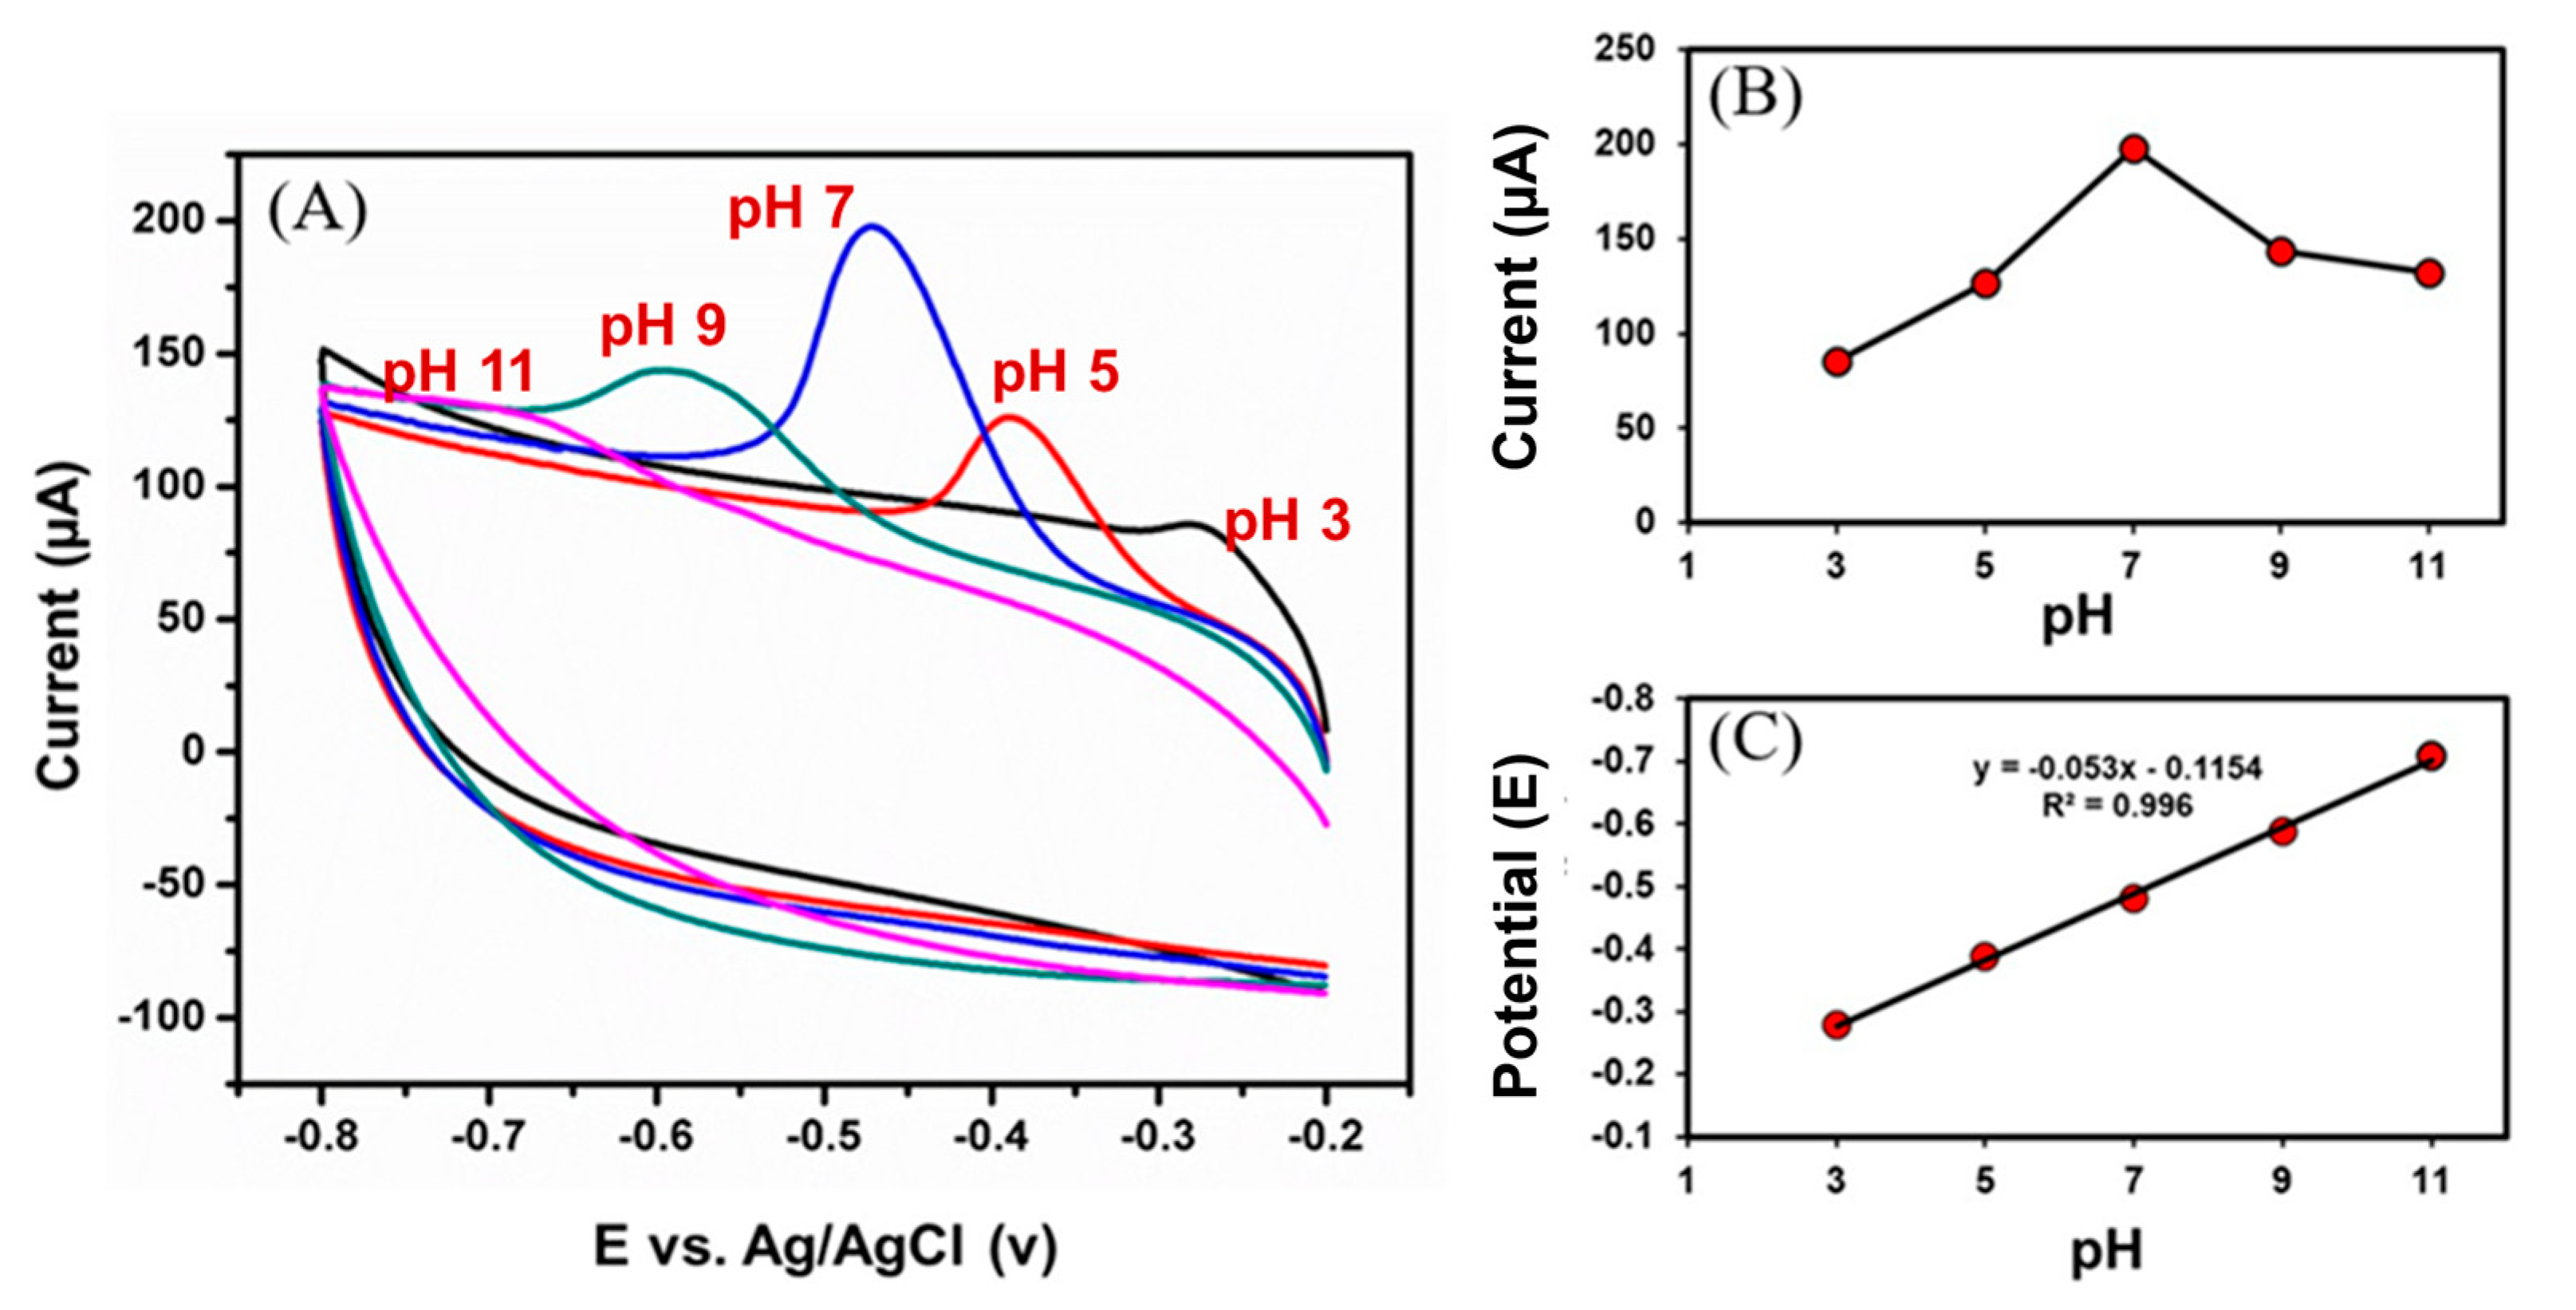
4.3. Electronic Analysis under Varied PH
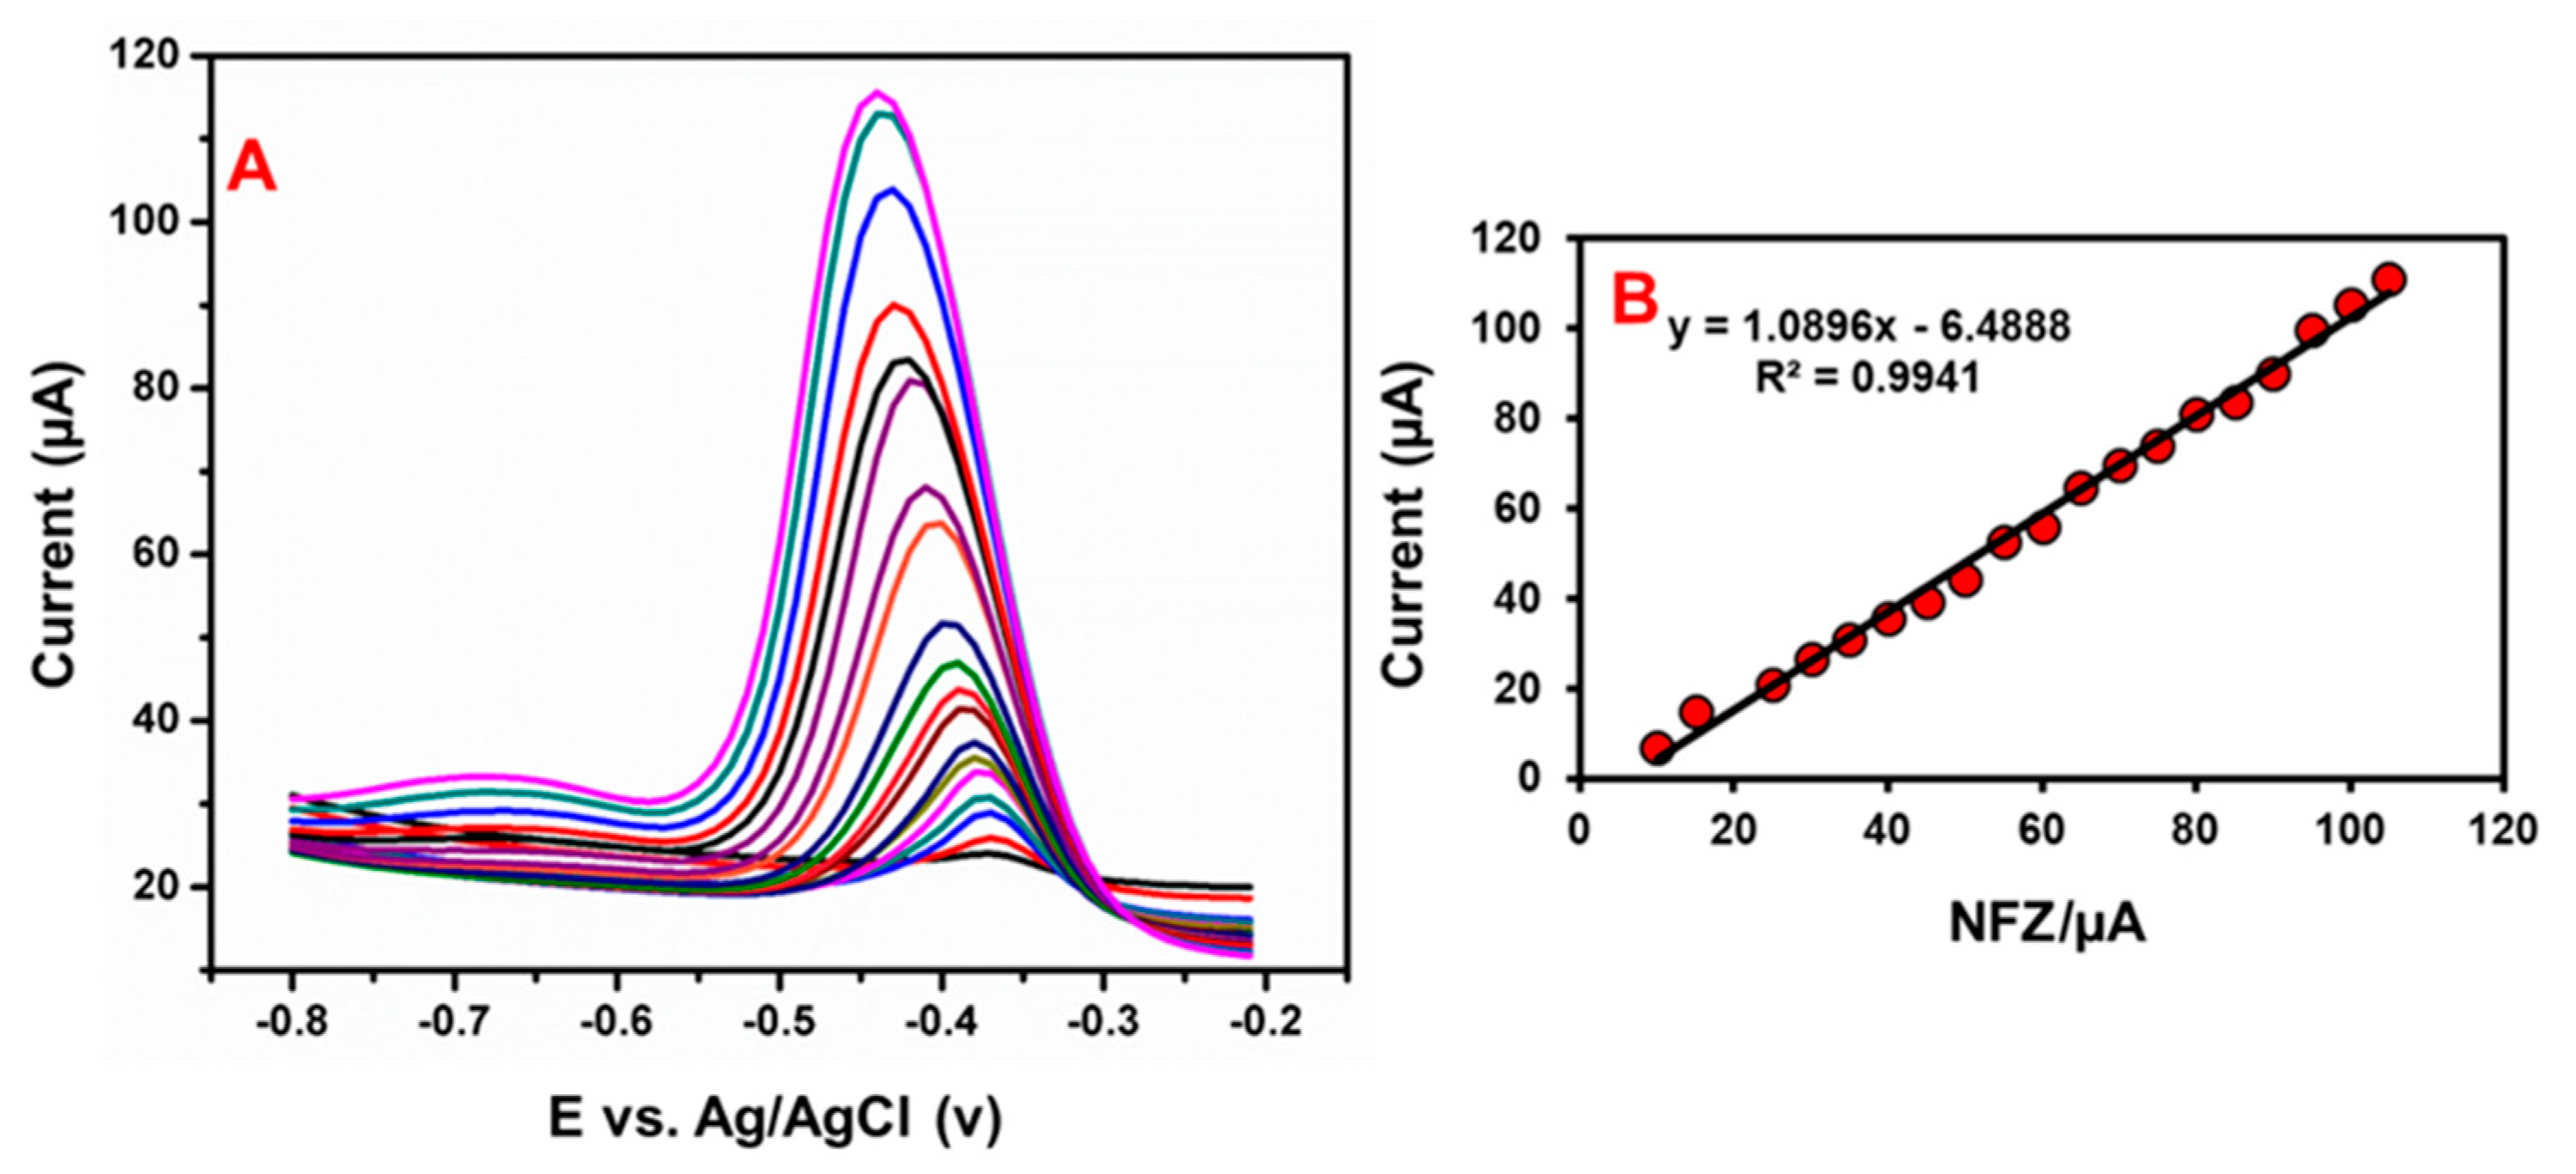
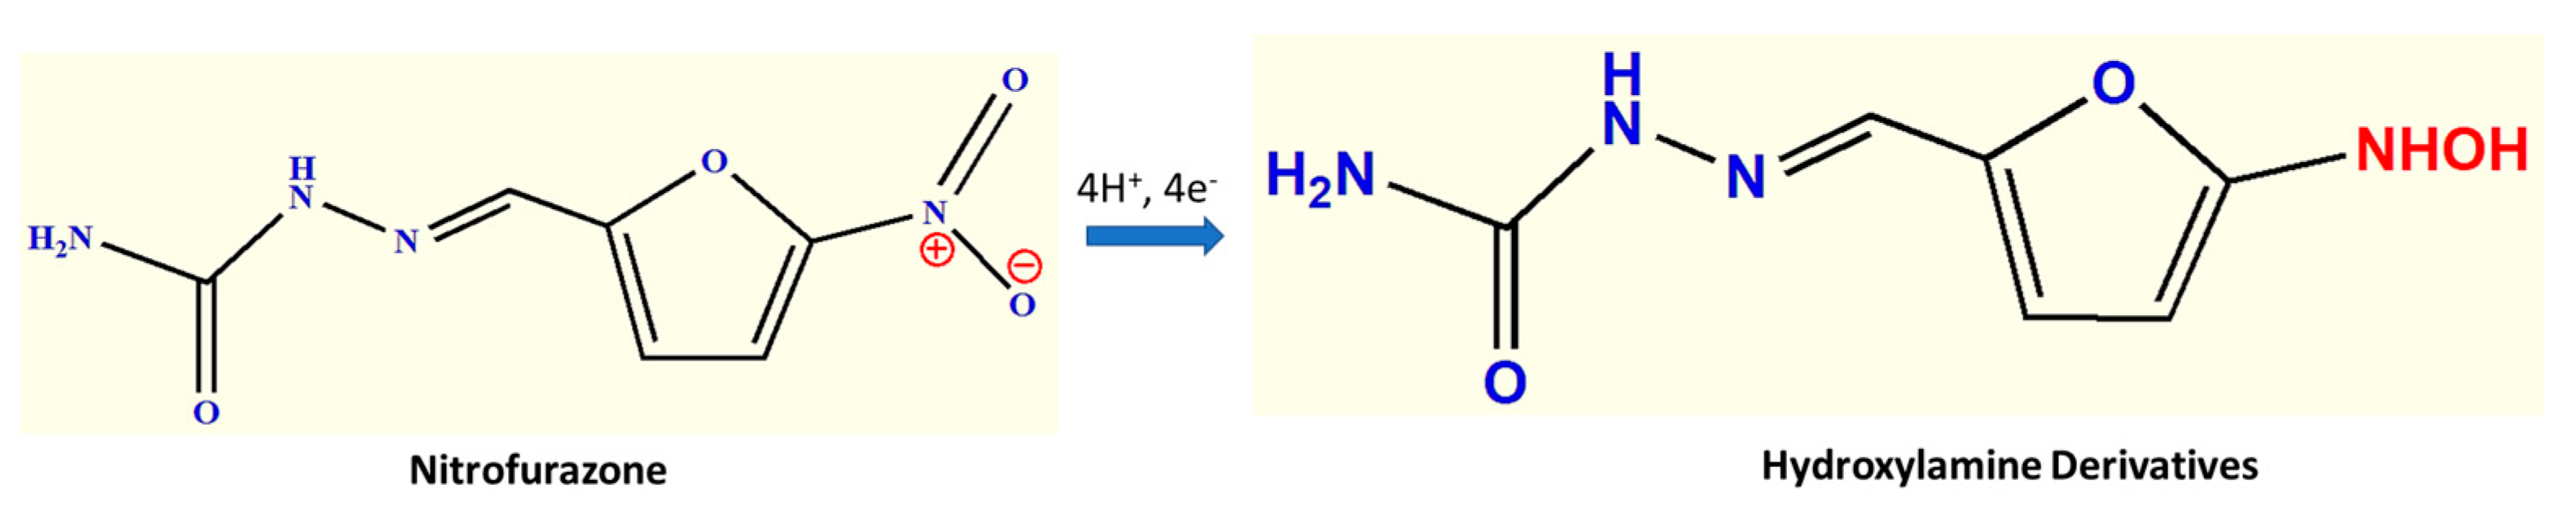
4.4. DPV Studies and Stability Studies
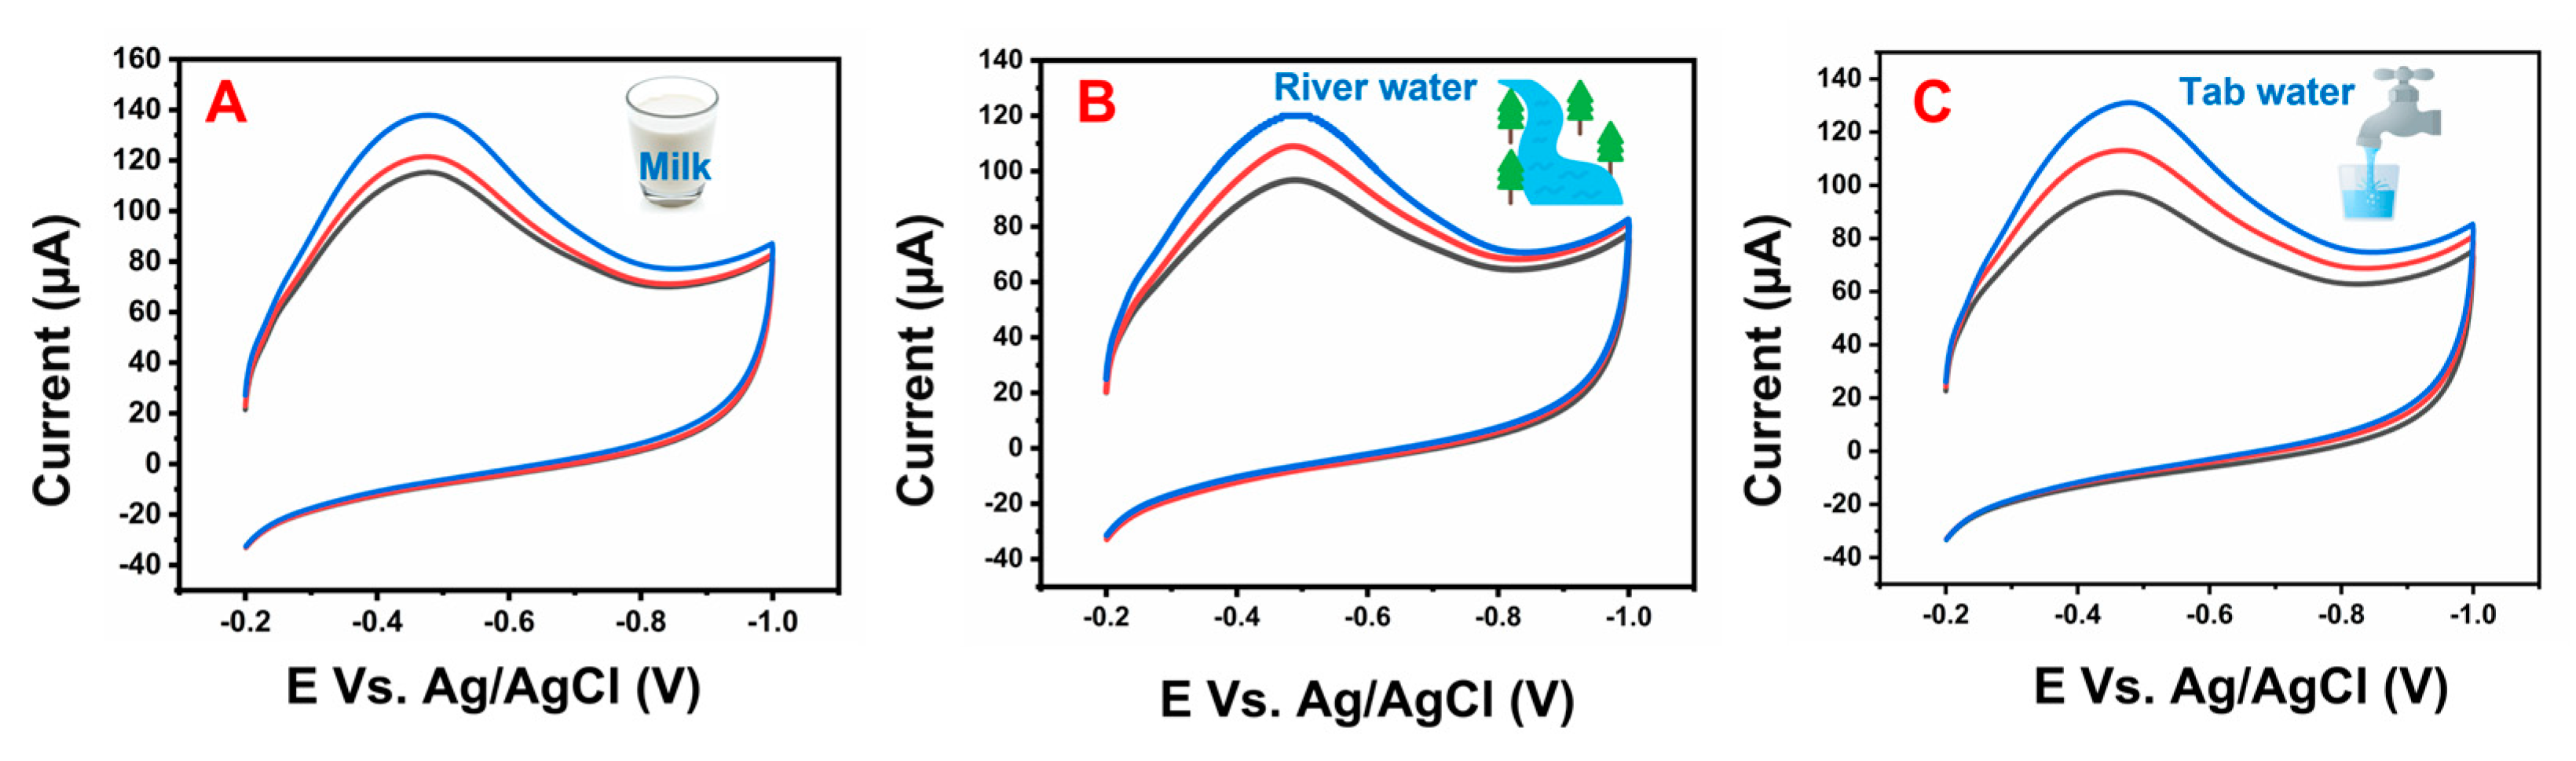
4.5. Real Sample Analysis, Repeatability and Reproducibility
5. Conclusions
Supplementary Materials
Author Contributions
Funding
Data Availability Statement
Acknowledgments
Conflicts of Interest
References
- Keyan, A.K.; Sakthinathan, S.; Vasu, D.; Yu, C.L.; Vinothini, S.; Chiu, T.W. Gadolinium molybdate decorated graphitic carbon nitride composite: Highly visualized detection of nitrofurazone in water samples. RSC Adv. 2022, 12, 34066–34079. [Google Scholar] [CrossRef] [PubMed]
- Zoubir, J.; Assabbane, A.; Bakas, I. Electroanalysis of nitrofurazone at silver particles and graphite powder composite electrode. Carbon Lett. 2022, 32, 767–780. [Google Scholar] [CrossRef]
- Lu, H.; Liu, M.; Cui, H.; Huang, Y.; Li, L.; Ding, Y. An advanced molecularly imprinted electrochemical sensor based bifunctional monomers for highly sensitive detection of nitrofurazone. Electrochim. Acta 2022, 42, 7140858. [Google Scholar] [CrossRef]
- Wang, Y.; Guo, Y.; Pan, K.; Lin, X.; Ni, Y. Electrochemical Reaction Mechanism of Nitrofurazone at Poly-ACBK/GCE and Its Analytic Application. Chem. Afr. 2020, 3, 727–734. [Google Scholar] [CrossRef]
- Wang, H.; Bo, X.; Zhou, M.; Guo, L. DUT-67 and tubular polypyrrole formed a cross-linked network for electrochemical detection of nitrofurazone and ornidazole. Anal. Chim. Acta 2020, 1109, 1–8. [Google Scholar] [CrossRef]
- Hartmann, M.; Machoke, A.G.; Schwieger, W. Catalytic test reactions for the evaluation of hierarchical zeolites. Chem. Soc. Rev. 2016, 45, 3313–3330. [Google Scholar] [CrossRef]
- Ruehle, B.; Clemens, D.L.; Lee, B.Y.; Horwitz, M.A.; Zink, J.I. A Pathogen-Specific Cargo Delivery Platform Based on Mesoporous Silica Nanoparticles. J. Am. Chem. Soc. 2017, 139, 6663–6668. [Google Scholar] [CrossRef]
- Sun, Y.; Ma, K.; Kao, T.; Spoth, K.A.; Sai, H.; Zhang, D.; Kourkoutis, L.F.; Elser, V. Formation pathways of mesoporous silica nanoparticles with dodecagonal tiling. Nat. Commun. 2017, 8, 252. [Google Scholar] [CrossRef]
- Li, B.; Wen, H.M.; Cui, Y.; Zhou, W.; Qian, G.; Chen, B. Emerging MultifunctionalMetal–Organic Framework Materials. Adv. Mater. 2016, 28, 8819–8860. [Google Scholar] [CrossRef]
- Allendorf, M.D.; Stavila, V. Crystal engineering, structure-function relationships, and the future of metal-organic frameworks. Cryst. Eng. Commun. 2015, 17, 229. [Google Scholar] [CrossRef]
- Furukawa, H.; Cordova, K.E.; Keeffe, M.O.; Yaghi, O.M. The chemistry and applications of metal-organic frameworks. Science 2013, 30, 1230444. [Google Scholar] [CrossRef] [PubMed]
- Venna, S.R.; Carreon, M.A. Metal organic framework membranes for carbon dioxide separation. Chem. Eng. Sci. 2015, 124, 3–19. [Google Scholar] [CrossRef]
- Liu, X.; Yang, H.; Diao, Y.; He, Q.; Lu, C.; Singh, A.; Kumar, A.; Liu, J.; Lan, Q. Recent advances in the electrochemical applications of Ni-based metal-organic frameworks (Ni-MOFs) and their derivatives. Chemosphere 2022, 307, 135729. [Google Scholar] [CrossRef] [PubMed]
- Zhong, Y.; Peng, Z.; Peng, Y.; Li, B.; Pan, Y.; Ouyang, Q.; Sakiyama, H.; Muddassirf, M.; Liu, J. Construction of Fe-doped ZIF-8/DOX nanocomposites for ferroptosis strategy in the treatment of breast cancer. J. Mater. Chem. B 2023, 11, 6335–6345. [Google Scholar] [CrossRef] [PubMed]
- Zheng, M.; Chen, J.; Zhang, L.; Cheng, Y.; Lu, C.; Liu, Y.; Singh, A.; Trivedi, M.; Kumar, A.; Liu, J. Metal-organic frameworks as efficient adsorbents for drugs from wastewater. Mater. Today Commun. 2022, 31, 103514. [Google Scholar] [CrossRef]
- Tan, J.C.; Cheetham, A.K. Mechanical properties of hybrid inorganic–organic framework materials: Establishing fundamental structure–property relationships. Chem. Soc. Rev. 2011, 40, 1059–1080. [Google Scholar] [CrossRef] [PubMed]
- Hu, X.; Zhu, Z.; Cheng, F.; Tao, Z.; Chen, J. Micro-nano structured Ni-MOFs as high-performance cathode catalyst for rechargeable Li-O2 batteries. Nanoscale 2015, 7, 11833–11840. [Google Scholar] [CrossRef]
- Hu, X.; Luo, G.; Zhao, Q.; Wu, D.; Yang, T.; Wen, J.; Wang, R.; Xu, C.; Hu, N. Ru single atoms on N-doped carbon by spatial confinement and ionic substitution strategies for high-performance Li–O2 batteries. J. Am. Chem. Soc. 2020, 142, 16776–16786. [Google Scholar] [CrossRef]
- Banerjee, R.; Phan, A.; Wang, B.; Knobler, C.; Furukawa, H.; O’Keeffe, M.; Yaghi, O.M. High-throughput synthesis of zeolitic imidazolate frameworks and application to CO2 capture. Science 2008, 319, 939–943. [Google Scholar] [CrossRef]
- Park, K.S.; Ni, Z.; Côté, A.P.; Choi, J.Y.; Huang, R.; Uribe-Romo, F.J.; Chae, H.K.; O’Keeffe, M.; Yaghi, O.M. Exceptional chemical and thermal stability of zeolitic imidazolate frameworks. Proc. Natl. Acad. Sci. USA 2006, 103, 10186–10191. [Google Scholar] [CrossRef]
- Li, Y.S.; Liang, F.Y.; Bux, H.; Feldhoff, A.; Yang, W.S.; Caro, J. Molecular sieve membrane: Supported metal-organic framework with high hydrogen selectivity. Angew. Chem. Int. Ed. 2010, 49, 548–551. [Google Scholar] [CrossRef] [PubMed]
- Morris, W.; Leung, B.; Furukawa, H.; He, N.; Hayashi, H.; Houndonougbo, Y.; Asta, M.; Laird, B.B.; Yaghi, O.M. A combined experimental-computational investigation of carbon dioxide captures in a series of isoreticular zeolitic imidazolate frameworks. J. Am. Chem. Soc. 2010, 132, 11006–11008. [Google Scholar] [CrossRef] [PubMed]
- Van Den Bergh, J.; Gücüyener, C.; Pidko, E.A.; Hensen EJ, M.; Gascon, J.; Kapteijn, F. Understanding the anomalous alkane selectivity of ZIF-7 in the separation of light alkane/alkene mixtures. Chem. Eur. J. 2011, 17, 8832–8840. [Google Scholar] [CrossRef] [PubMed]
- Zhou, X.; Zhang, H.P.; Wang, G.Y.; Yao, Z.G.; Tang, Y.R.; Zheng, S.S. Zeolitic imidazolate framework as efficient heterogeneous catalyst for the synthesis of ethyl methyl carbonate. J. Mol. Catal. A Chem. 2013, 366, 43–47. [Google Scholar] [CrossRef]
- Phan, A.; Doonan, C.J.; Uribe-Romo, F.J.; Knobler, C.B.; Okeeffe, M.; Yaghi, O.M. Synthesis, structure, and carbon dioxide capture properties of zeolitic imidazolate frameworks. Acc. Chem. Res. 2010, 43, 58–67. [Google Scholar] [CrossRef] [PubMed]
- Chen, Y.-Z.; Wang, C.; Wu, Z.-Y.; Xiong, Y.; Xu, Q.; Yu, S.-H.; Jiang, H.-L. From bimetallic metal-organic framework to porous carbon: High surface area and multicomponent active dopants for excellent electrocatalysis. Adv. Mater. 2015, 27, 5010–5016. [Google Scholar] [CrossRef] [PubMed]
- Wu, X.; Meng, G.; Liu, W.; Li, T.; Yang, Q.; Sun, X.; Liu, J. Metal-organic framework-derived, Zn-doped porous carbon polyhedra with enhanced activity as bifunctional catalysts for rechargeable zinc-air batterie. Nano Res. 2018, 11, 163–173. [Google Scholar] [CrossRef]
- Harris, P.J.F. Carbon Nanotube and Related Structures: New Materials for the 21st Century; Cambridge University Press: Cambridge, UK, 2001. [Google Scholar]
- Yeh, M.K.; Tai, N.H.; Liu, J.H. Mechanical behavior of phenolic-based composites reinforced with multi-walled carbon nanotubes. Carbon 2006, 44, 1–9. [Google Scholar] [CrossRef]
- Wang, Q.; Li, C.; Bai, J.; Wang, J. Synthesis of Ag porous carbon nanofiber by electrospinning and their use as catalyst for styrene epoxidation, Synth. React. Inorganic. Met. Nano-Metal Chem. 2016, 46, 1773–1778. [Google Scholar] [CrossRef]
- Zhao, J.; Dang, Z.; Muddassir, M.; Raza, S.; Zhong, A.; Wang, X.; Jin, J. A New Cd(II)-Based Coordination Polymer for Efficient Photocatalytic Removal of Organic Dyes. Molecules 2023, 28, 6848. [Google Scholar] [CrossRef]
- Inagaki, M.; Yang, Y.; Kang, F. Carbon nanofibers prepared via electrospinning. Adv. Mater. 2012, 24, 2547–2566. [Google Scholar] [CrossRef] [PubMed]
- Kim, C.; Yang, S.; Kojima, M.; Yoshida, K.; Kim, J.; Kim, A.; Endo, M. Fabrication of electrospinning-derived carbon nanofiber webs for the anode material of lithium-ion secondary batteries. Adv. Funct. Mater. 2006, 16, 2393–2397. [Google Scholar] [CrossRef]
- Zhang, C.L.; Yu, S.H. Nanoparticles meet electrospinning: Recent advances and future prospects. Chem. Soc. Rev. 2014, 43, 4423–4448. [Google Scholar] [CrossRef] [PubMed]
- Dalton, P.D.; Vaquette, C.; Farrugia, B.L.; Dargaville, T.R.; Brown, T.D.; Hutmacher, D.W. Electrospinning and additive manufacturing: Converging technologies. Biomater. Sci. 2013, 1, 171–185. [Google Scholar] [CrossRef] [PubMed]
- Manawi, Y.M.; Ihsanullah Samara, A.; Al-Ansari, T.; Atieh, M.A. A review of carbon nanomaterials synthesis via the chemical vapor deposition (CVD) method. Materials 2018, 11, 822. [Google Scholar] [CrossRef] [PubMed]
- Che, G.; Lakshmi, B.B.; Martin, C.R.; Fisher, E.R.; Ruoff, R.S. Chemical vapor deposition based synthesis of carbon nanotubes and nanofibers using a template method. Chem. Mater. 1998, 10, 260–267. [Google Scholar] [CrossRef]
- Zhang, X.; Fan, W.; Zhao, S.; Cao, R.; Li, C. An efficient, bifunctional catalyst for lithium-oxygen batteries obtained through tuning the exterior Co2+/Co3+ ratio of CoO:X on N-doped carbon nanofibers. Catal. Sci. Technol. 2019, 9, 1998–2007. [Google Scholar] [CrossRef]
- Tong, H.X.; Tian, X.; Wu, D.X.; Wang, C.F.; Zhang, Q.L.; Jiang, Z.H. WO3 nanofibers on ACF by electrospun for photo-degradation of phenol solution. J. Cent. South Univ. 2017, 24, 1275–1280. [Google Scholar] [CrossRef]
- Wang, M.X.; Guo, Z.Y.; Huang, Z.H.; Kang, F.Y. Preparation of porous carbon nanofibers with controllable pore structures for low-concentration NO removal at room temperature. New Carbon Mater. 2016, 31, 277–286. [Google Scholar] [CrossRef]
- Aytac, Z.; Uyar, T. Applications of core-shell nanofibers. In Drug and Biomolecules Release and Gene Therapy; Elsevier Ltd.: Amsterdam, The Netherlands, 2018; pp. 375–404. [Google Scholar]
- Teo, W.E.; Ramakrishna, S. A review on electrospinning design and nanofiber assemblies. Nanotechnology 2006, 17, R89–R106. [Google Scholar] [CrossRef]
- Wang, X.; Niu, H.; Wang, X.; Lin, T. Needleless electrospinning of uniform nanofibers using spiral coil spinnerets. J. Nanomater. 2012, 2012, 785920. [Google Scholar] [CrossRef]
- Sigmund, W.; Yuh, J.; Park, H.; Maneeratana, V.; Pyrgiotakis, G.; Daga, A.; Taylor, J.; Nino, J.C. Processing and structure relationships in electrospinning of ceramic fiber systems. J. Am. Ceram. Soc. 2006, 89, 395–407. [Google Scholar] [CrossRef]
- Cann, J.T.M.; Li, D.; Xia, Y. Electrospinning of nanofibers with core-sheath, hollow, or porous structures. J. Mater. Chem. 2005, 15, 735–738. [Google Scholar]
- Li, B.D.; Xia, Y. Electrospinning of nanofibers: Reinventing the Wheel? Adv. Mater. 2004, 14, 1151–1170. [Google Scholar] [CrossRef]
- Li, D.; Wang, Y.; Xia, Y. Electrospinning of polymeric and ceramic nanofibers as uniaxially aligned arrays. Nano Lett. 2003, 3, 1167–1171. [Google Scholar] [CrossRef]
- Li, D.; Cann, J.T.M.; Xia, Y.; Marquez, M. Electrospinning: A simple and versatile technique for producing ceramic nanofibers and nanotubes. J. Am. Ceram. Soc. 2006, 89, 1861–1869. [Google Scholar] [CrossRef]
- Thavasi, V.; Singh, G.; Ramakrishna, S. Electrospun nanofibers in energy and environmental applications. Energy Environ. Sci. 2008, 1, 205–221. [Google Scholar] [CrossRef]
- Xue, J.; Wu, T.; Dai, Y.; Xia, Y. Electrospinning and electrospun nanofibers: Methods, materials, and applications. Chem. Rev. 2019, 119, 5298–5415. [Google Scholar] [CrossRef]
- Sun, B.; Long, Y.Z.; Zhang, H.D.; Li, M.M.; Duvail, J.L.; Jiang, X.Y.; Yin, H.L. Progress in Polymer Science Advances in three-dimensional nanofibres macrostructures via electrospinning. Prog. Polym. Sci. 2014, 39, 862–890. [Google Scholar] [CrossRef]
- Tang, C.; Saquing, C.D.; Harding, J.R.; Khan, S.A.; Carolina, N. In situ cross-linking of electrospun Poly(vinyl alcohol) nanofibers. Macromolecules 2010, 43, 630–637. [Google Scholar] [CrossRef]
- Tahir, M.S.; Lee, J.W.; Rabani, I.; Afzal, F.; Han, Y.J.; Park, H.Y.; Lee, J.; Seo, Y.S. Analysis of the porosity of ZIF-8 and ZIF-8@CNF membranes using positron annihilation lifetime spectroscopy (PALS). J. Radioanal. Nucl. 2023, 332, 3967–3975. [Google Scholar] [CrossRef]
- Gong, X.; Luo, W.; Guo, N.; Zhang, S.; Wang, L.; Jia, D.; Ai, L.; Feng, S. Carbon nanofiber@ZIF-8 derived carbon nanosheet composites with a core–shell structure boosting capacitive deionization performance. J. Mater. Chem. A 2021, 9, 18604–18613. [Google Scholar] [CrossRef]
- Thunberg, J.; Zacharias, S.C.; Hasani, M.; Oyetunji, O.A.; Noa FM, A.; Westman, G.; Ohrström, L. Hybrid Metal-Organic Framework-Cellulose Materials Retaining High Porosity: ZIF-8@Cellulose Nanofibrils. Inorganics 2021, 9, 84. [Google Scholar] [CrossRef]
- Zoubir, J.; Radaa, C.; Bougdour, N.; Idlahcen, A.; Hayaoui, W.E.; Tajat, N.; Mouhri, W.E.; Nadif, I.; Qourzal, S.; Tamimi, M.; et al. A sensor based on silver nanoparticles synthesized on carbon graphite sheets for the electrochemical detection of nitrofurazone: Application: Tap water, commercial milk and human urine. J. Indian Chem. Soc. 2022, 99, 100590. [Google Scholar] [CrossRef]
- Liu, T.; He, J.; Lu, Z.; Sun, M.; Wu, M.; Wang, X.; Jiang, Y.; Zou, P.; Rao, H.; Wang, Y. A visual electrochemiluminescence molecularly imprinted sensor with Ag+@UiO-66-NH2 decorated CsPbBr3 perovskite based on smartphone for point-of-care detection of nitrofurazone. J. Chem. Eng. 2022, 429, 132462. [Google Scholar] [CrossRef]
- Liu, X.Y.; Huang, S.C.; Hsieh, Y.T.; Lu, S.I.; Wang, H.H.; Wang, C.C.; Chuang, Y.C. Detection of nitrofurazone with metal organic frameworks and reduced graphene oxide composites: Insights from molecular dynamics simulations. Microchim. Acta 2023, 190, 246. [Google Scholar] [CrossRef]
- Wang, H.; Pei, F.; Liu, C.; Ni, Y.; Xia, M.; Feng, S.; Hao, Q.; Yang, T.; Lei, W. Efficient detection for nitrofurazone based on novel Ag2S QDs/g-C3N4 fluorescent probe. Spectrochim. Acta A 2022, 269, 120727. [Google Scholar] [CrossRef]
- Yeh, M.Y.; Liu, Y.R.; Huang, T.H.; Chen, Y.H.; Hsiehz, Y.T. Electrochemical Sensing of nitrofurazone and semicarbazide on an Au-Ag film fabricating from a deep eutectic solvent. J. Electrochem. Soc. 2022, 169, 107502. [Google Scholar] [CrossRef]
- Lu, Y.S.; Pan, W.Y.; Hung, T.C.; Hsieh, Y.T. Electrodeposition of silver in a ternary deep eutectic solvent and the electrochemical sensing ability of the Ag-modified electrode for nitrofurazone. Langmuir 2020, 36, 11358–11365. [Google Scholar] [CrossRef]
- Baby, J.N.; Sriram, B.; Wang, S.F.; George, M. Versatile deep eutectic solvent assisted synthesis of ZnB2O4 (B = Al, Co, Cr spinels: The effect of B site variants for comparing the bifunctional electrochemical sensing application. J. Chem. Eng. 2022, 435, 134136. [Google Scholar] [CrossRef]


| Composition | Specific Surface Area (m2/g) |
|---|---|
| 2000 rpm CNFs | 42.28 |
| Simulated ZIF-8 | 1310.34 |
| ZIF-8/(10 mg) 2000 rpm CNFs | 333.53 |
| ZIF-8/(15 mg) 2000 rpm CNFs | 999.82 |
| ZIF-8/(20 mg) 2000 rpm CNFs | 216.74 |
| S. No | Electrode | LOD (µM) | Linear Range (µM) | Ref. |
|---|---|---|---|---|
| 1 | GCE/ZIF-8/CNFs | 0.027 | 0.1–150 | This Work |
| 2 | Ag-NPs@CPE | 0.012 | 0.2–100 | [56] |
| 3 | Ag+@UiO-66-NH2/CsPbBr3/GCE-ECL | 90 | 5 × 10⁻⁴–100 | [57] |
| 4 | MIP-c-MWCNTs-ZIF/GCE | 6.7 | - | [3] |
| 5 | Fe-MOF/rGO/SPCE | 0.77 | 0.6–499 | [58] |
| 6 | Ag2S QDs/g-C3N4 | 0.054 | 0–30 | [59] |
| 7 | Poly-ACBK/GCE | 0.25 | 0.75–192 | [4] |
| 8 | Au-Ag | 0.2 | 1.99–643 | [60] |
| 9 | Ag-SDS | 0.37 | 0.66–930 | [61] |
| 11 | ZnCr2O4/SPCE | 0.001 | 0.01–152 | [62] |
| 12 | DUT-67/T-PPY/GCE | 0.25 | 9.08–1004 | [5] |
| Sample | Added (µM) | Found (µM) | Recovery (%) |
|---|---|---|---|
| Milk | 40 | 39.8 | 99.5 |
| 80 | 79.3 | 99.2 | |
| 120 | 119.5 | 99.5 | |
| River water | 40 | 39.0 | 97.5 |
| 80 | 78.9 | 98.6 | |
| 120 | 119.2 | 99.3 | |
| Tap Water | 40 | 39.5 | 98.7 |
| 80 | 79.6 | 99.5 | |
| 120 | 119.8 | 99.8 |
Disclaimer/Publisher’s Note: The statements, opinions and data contained in all publications are solely those of the individual author(s) and contributor(s) and not of MDPI and/or the editor(s). MDPI and/or the editor(s) disclaim responsibility for any injury to people or property resulting from any ideas, methods, instructions or products referred to in the content. |
© 2024 by the authors. Licensee MDPI, Basel, Switzerland. This article is an open access article distributed under the terms and conditions of the Creative Commons Attribution (CC BY) license (https://creativecommons.org/licenses/by/4.0/).
Share and Cite
Wang, H.; Sakthinathan, S.; Keyan, A.K.; Yu, C.-L.; Kameoka, S.; Chiu, T.-W.; Nagaraj, K. Preparation of Zeolitic Imidazolate Framework and Carbon Nanofiber Composites for Nitrofurazone Detection. Micro 2024, 4, 14-32. https://doi.org/10.3390/micro4010002
Wang H, Sakthinathan S, Keyan AK, Yu C-L, Kameoka S, Chiu T-W, Nagaraj K. Preparation of Zeolitic Imidazolate Framework and Carbon Nanofiber Composites for Nitrofurazone Detection. Micro. 2024; 4(1):14-32. https://doi.org/10.3390/micro4010002
Chicago/Turabian StyleWang, Haobo, Subramanian Sakthinathan, Arjunan Karthi Keyan, Chung-Lun Yu, Satoshi Kameoka, Te-Wei Chiu, and Karuppiah Nagaraj. 2024. "Preparation of Zeolitic Imidazolate Framework and Carbon Nanofiber Composites for Nitrofurazone Detection" Micro 4, no. 1: 14-32. https://doi.org/10.3390/micro4010002