Article

Highly Sensitive Sensor for the Determination of Riboflavin Using Thionine Coated Cadmium Selenide Quantum Dots Modified Graphite Electrode

by
Arumugam Kalaivani
1,
Rajendran Suresh Babu
2,* and
Sangilimuthu Sriman Narayanan
3,*
1
Department of Chemistry, Saveetha Engineering College, Chennai 602 105, Tamil Nadu, India
2
Laboratory of Experimental and Applied Physics, Centro Federal de Educação Tecnológica Celso Suckow da Fonseca, Av. Maracanã Campus 229, Rio de Janeiro 20271-110, Brazil
3
Department of Analytical Chemistry, School of Chemical Sciences, University of Madras, Guindy Campus, Chennai 600 025, Tamil Nadu, India
*
Authors to whom correspondence should be addressed.
Micro 2023, 3(3), 686-698; https://doi.org/10.3390/micro3030048
Submission received: 6 June 2023 / Revised: 1 August 2023 / Accepted: 10 August 2023 / Published: 13 August 2023
(This article belongs to the Special Issue Innovative Methods for Semiconductor Doping)

Abstract

:
In this paper, the electrochemical non-enzymatic detection of Riboflavin (RF) was proposed based on its catalytic reduction in a Thionine-coated Cadmium Selenide Quantum dots (TH@CdSe QDs)-modified paraffin wax-impregnated graphite electrode (PIGE) that was prepared using a novel approach. The synthesized TH@CdSe QDs were confirmed by UV-Vis spectroscopy, Confocal Raman Microscopy and High Resolution Transmission Electron Microscopy (HRTEM) studies. The electrochemical response of the TH@CdSe QDs-modified PIGE was studied by cyclic voltammetry. The voltammetric response of RF at the TH@CdSe QDs-modified PIGE showed higher current than the bare PIGE. Under optimum conditions, the electrocatalytic reduction currents of RF was found to be linearly related to its concentration over the range of 1.6 × 10⁻⁷ M to 1.4 × 10⁻⁴ M with a detection limit of 53 × 10−9 M (S/N = 3). The TH@CdSe QDs-modified PIGE was utilized as an amperometric sensor for the detection of RF in flow systems was performed by carrying out hydrodynamic and chronoamperometric experiments. The TH@CdSe QDs-modified PIGE showed very good stability and a longer shelf life. The applicability of the fabricated electrode was justified by the quantification of RF in commercial tablets.

Graphical Abstract

1. Introduction

Vitamins play a vital role in biochemistry and metabolism as they are biologically active molecules. Among all vitamins, Riboflavin (RF), also called vitamin B2 (7,8-dimethyl-10-ribityl-isoalloxazine), is water soluble and it is important for the growth, development and function of the cells in the body by converting carbohydrates, fats and proteins into energy [1,2,3]. It participates in redox reactions in animal species as a hydrogen transporter in glucose, protein and fat metabolism, hemoglobin synthesis and ocular visual function maintenance. As RF is not formed in the body, it is necessary to take it through diet such as milk, dairy products, meat, eggs and green vegetables. A deficiency in RF causes anemia, digestive problems, skin disorders, catarrh and cellular growth [4,5]. Thus, a determination of RF is needed to monitor human health. In the literature, various methods were utilized to detect RF, which includes fluorescence [6], MSPE/UPLC [7], electrochemiluminescence [8], Raman spectroscopy [9] and voltammetry [10,11]. The use of miniaturized and portable sensors is only possible because electrochemical instrumentation is also miniaturized and portable [12]. Among these techniques, voltammetric detection is a promising and suitable alternative method due to its low cost of operation, fastness, high sensibility and flexibility [13].
Quantum dots (QDs) are very small particles of semiconductors generally with few nanometer dimensions, which are often known as zero-dimensional nanomaterials [14,15]. A main advantage of QDs is the capability to decorate the surface of QDs with functional ligands through one- or two-step ligand-exchange procedures to tune the interaction of the QDs with the environment, as well as adjusting the solubility of QDs in various solvents with different polarities, modulating the electronic interaction between the QDs and the reactive molecules and varying the permeability of the ligand shell to tune the accessibility of substrates to the QD core. II–VI semiconducting quantum dots (QDs) have attracted much attention for their good properties. Owing to the quantum confinement effect, when the size of QDs is smaller than the exciton Bohr radius, the electronic states of QDs will change. Up to now, QDs have been widely investigated in the fields of optoelectronics [16], solar cells [17], lasers [18], medical and biological labels [19,20], catalysis [21] and electrochemical sensors [22].
Chemically modified electrodes fabricated with nanomaterial-integrated redox mediators show potential application for the investigation of many biomolecules [23,24]. In recent years, QDs have been extensively utilized for the construction of nano-sensors due to their optical, electronic and size-dependent properties, which are not present in other materials [25]. Cadmium Selenide (CdSe) is a significant one which possesses a direct bandgap. Redox dyes are the best candidates since they exhibit both electrochromic and electrochemical properties. Dyes have been widely applied in the field of catalysis, electrochromic devices, sensors and biosensors. The immobilization of dyes on nanomaterials such as carbon nanotubes, graphene and metal nanoparticles to fabricate modified electrodes show good electrocatalytic activity towards a variety of biologically, environmentally and industrially important compounds. Further, organic dye molecules such as Thionine [26], Azure A [23], neutral red [27] and methylene blue [28] have been used as redox mediators. Among these, Thionine, a phenothiazine dye, was one of the best redox mediators for electrochemical sensors due to their electro-active and photo-active properties. In order to improve the electron transfer kinetics, electrochemical activity, sensitivity and selectivity, organic dyes were immobilized on different nanomaterials such as carbon nanotubes, gold nanoparticles and metal oxides. The integration of redox mediators and nanomaterials in electrochemical investigations has proved to be an excellent candidate in the fabrication of electrochemical sensors [29,30,31]. The integration of redox mediators such as dyes, metal oxides, metal hexacyanoferrates or polymers on the surface of QDs have been used to improve the performance of the modified electrode ability by means of lowering the over-potential and enhancing the sensitivity because they provide a large surface area for them to adsorb on the surface of electrodes [24].
This paper describes the innovative and simple preparation of TH-immobilized CdSe QDs for first time. The formation of Thionine-coated CdSe QDs was investigated and it is applied as mediator for the non-enzymatic electrochemical determination of RF. The electrocatalytic reduction currents of RF were found to be linearly related to its concentration over the range of 1.6 × 10⁻⁷ M to 1.4 × 10⁻⁴ M with a detection limit of 53 × 10−9 M (S/N = 3). The amperometric determination of RF by the modified electrode was studied and its analytical efficacy towards the determination of RF in real samples was also studied.

2. Experimental

2.1. Materials and Methods

A spectroscopic-grade graphite rod (3 mm) was purchased from Sigma-Aldrich, St. Louis, MO, USA. Analytical grades of cadmium chloride, sodium borohydride, selenium, L-cysteine, thionine, riboflavin and all other chemicals were procured from Sigma-Aldrich, USA. Riboflavin tablets were purchased from a local pharmaceutical shop, Chennai, Tamil Nadu, India. All aqueous solutions were prepared using double-distilled water.

2.2. Characterization Techniques

The absorption spectra of the QDs were obtained using a UV-visible spectrophotometer model Agilent Diode Array spectrophotometer (Santa Clara, CA, USA). A quartz cuvette was used for the UV-visible spectrophotometer and the path length of the quartz cuvette is 10 mm. Raman spectra were recorded with a RAMAN-11i system (Nanophoton Corp., Osaka, Japan) for measuring the vibrational modes of the molecules. Surface topography, size and shape of the QDs were studied using HRTEM (Technai G2—model T-30 S-twin, FEI, Hillsboro, OR, USA).

2.3. Electrochemical Measurements

The electrochemical experiments were carried out using a CHI 660B electrochemical workstation (CH Instruments, Austin, TX, USA) coupled with an IBM personal computer using a conventional three-electrode cell at room temperature. A platinum electrode was used as an auxiliary electrode and a saturated calomel electrode as a reference electrode. TH@CdSe QDs-modified PIGE was used as a working electrode.

2.4. Fabrication of TH@CdSe QDs Modified PIGE

L-Cysteine-capped CdSe QDs were synthesized using the reported procedure [32]. Briefly, CdCl2 (320 μM) and L-Cysteine ethyl ester hydrochloride (3.2 mM) was mixed with 20 mL aqueous solution in the three-necked round bottom flask, and the pH of solution was adjusted to 11 using NaOH (1.0 M). Subsequently, the addition of NaHSe (20.0 mL) was prepared by adding 0.32 mmol of selenium metal and 0.81 mmol of NaBH4 in an N2 atmosphere. The mixture was stirred for 30 min and then refluxed for four hours under N2 atmosphere. After four hours an orange-red colloidal CdSe QDs was formed and stored in an air-tight glass container. In the next step, an optimized volume of 30.0 mL of prepared CdSe QDs was mixed with 5.0 mL of saturated solution of TH and was stirred continuously for four hours. The solution was then centrifuged, and the residue was washed many times with distilled water. The weakly absorbed dye molecules were removed during washing and the resulting precipitate was dried and it is used for further studies. The TH@CdSe QDs were dispersed in propanol by ultrasonication. About 5.0 µL of TH@CdSe QDs was drop casted at the PIGE and allowed to dry under room temperature. After it dried, the TH@CdSe QDs-modified PIGE was utilized for sensing applications. For comparing the electrochemical performance, bare PIGE, TH-modified PIGE and CdSe QDs modified-PIGE were fabricated.

3. Results

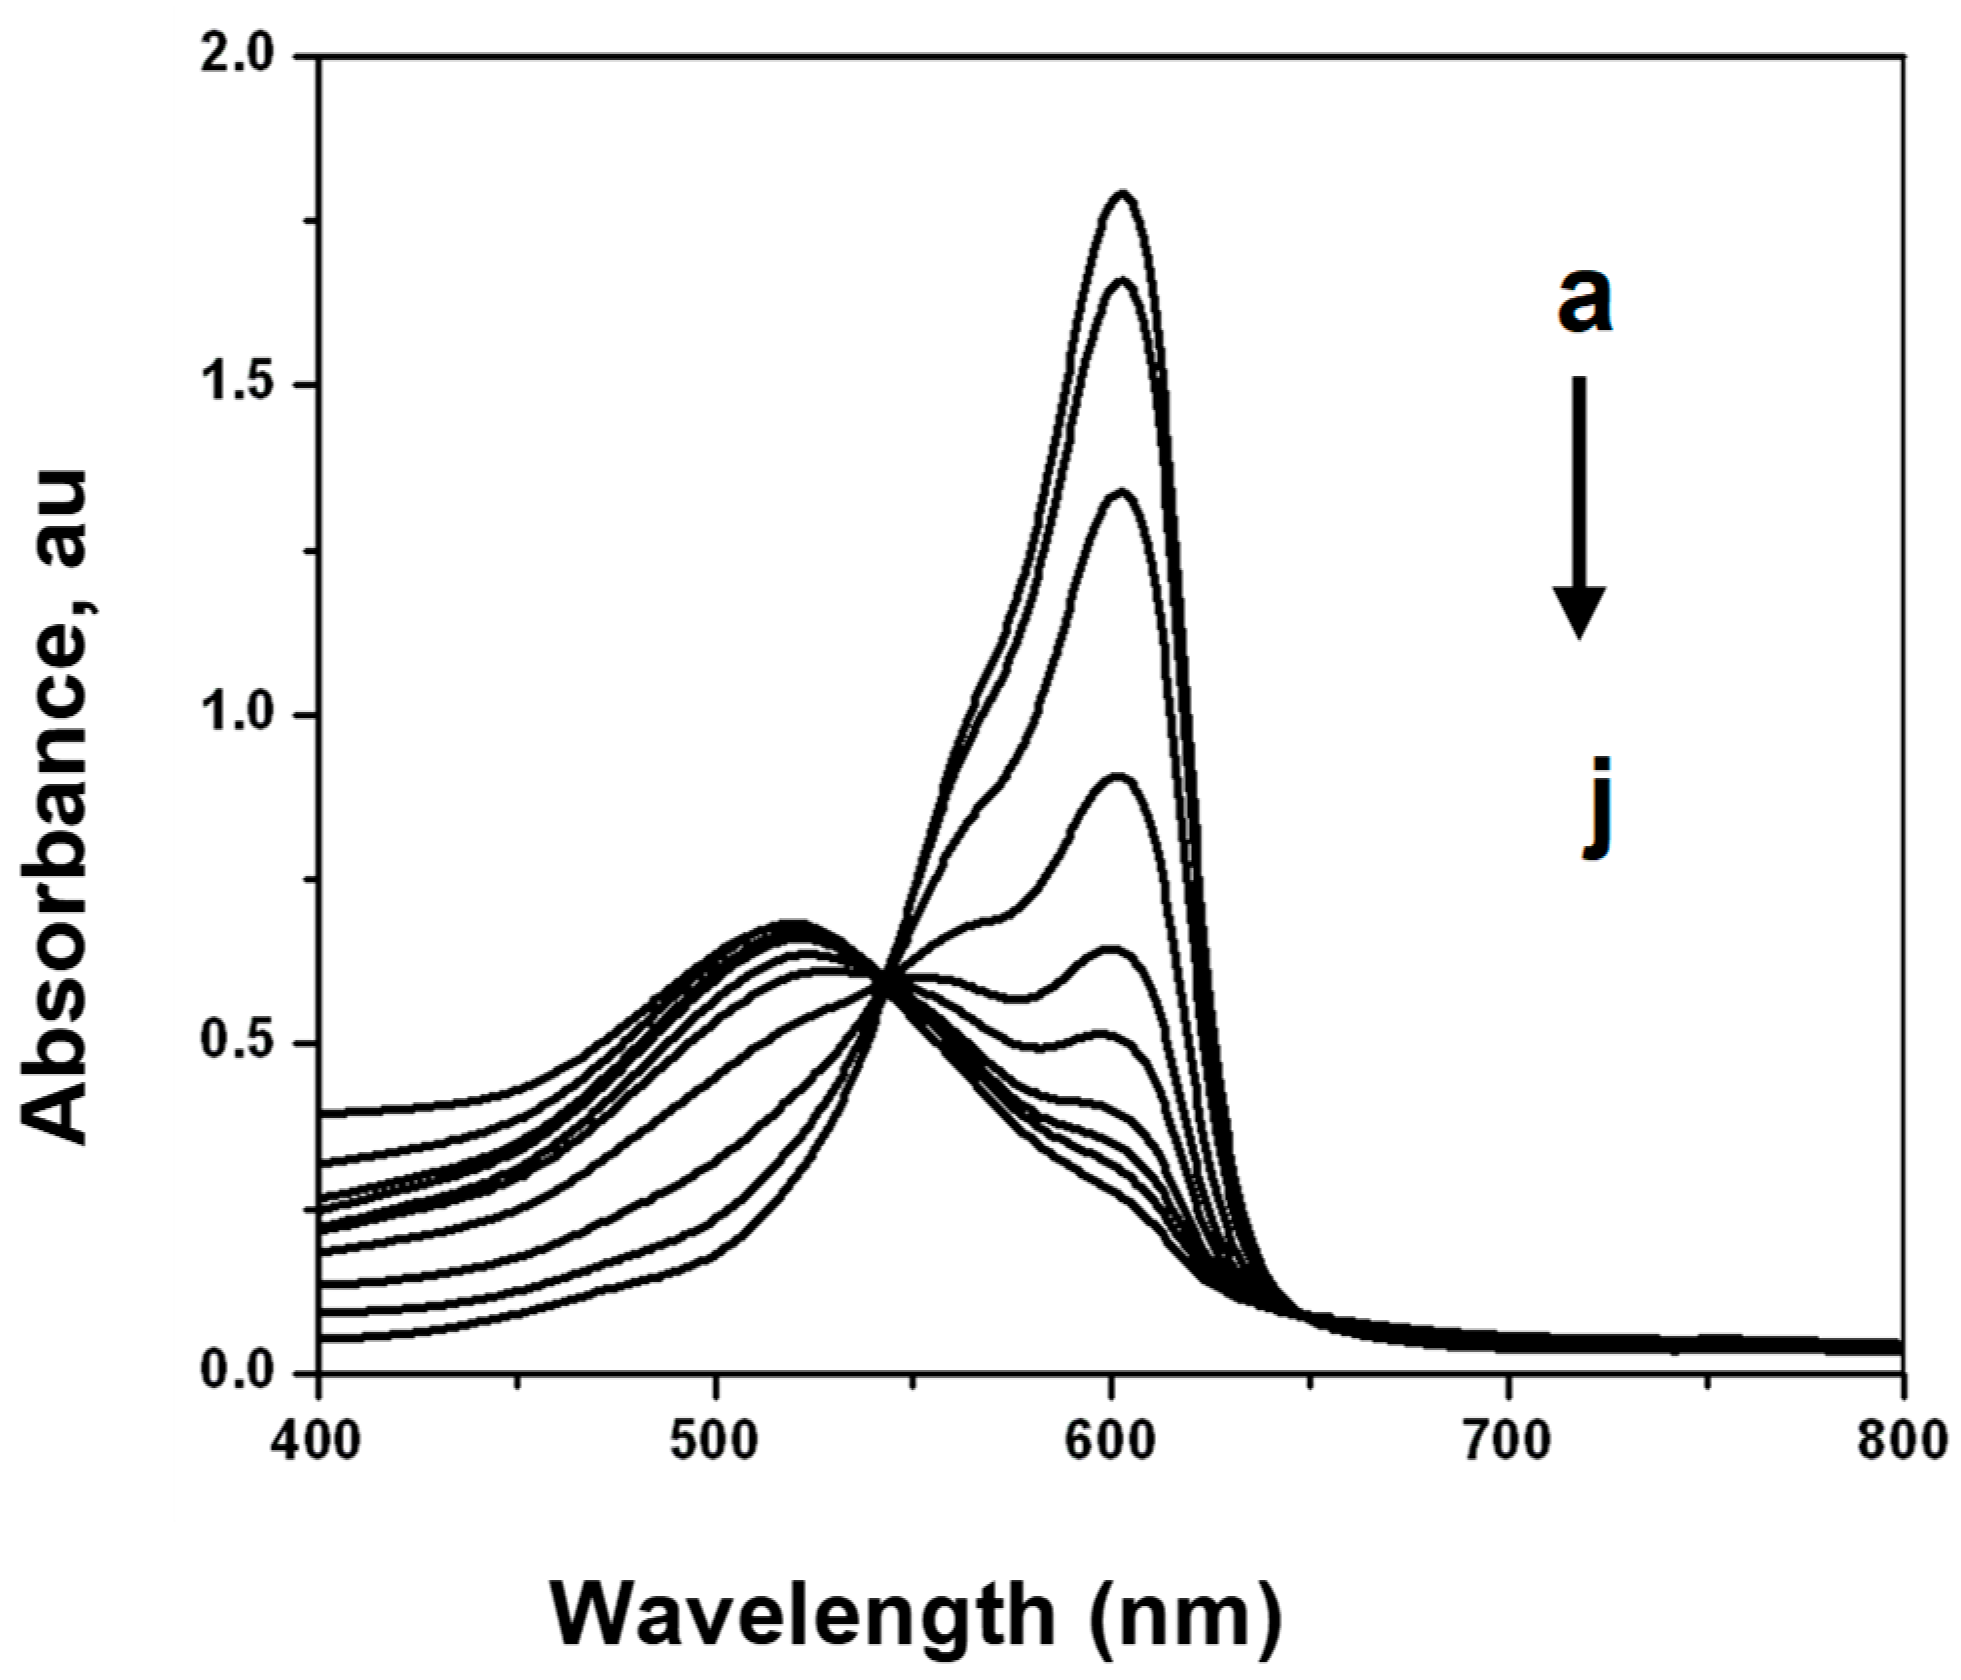
3.1. UV-Visible Spectroscopy

UV–vis absorption spectroscopy is a very simple method and applicable to explore the interaction between CdSe QDs and TH. Figure 1 exhibits the absorption changes observed upon the addition of various concentrations of CdSe QDs on 150 µM cationic dye TH. With increasing CdSe QDs concentration, the absorption band of TH decreases and a new absorption band appears at shorter wavelengths. TH has a characteristic absorption maximum at 600 nm with a shoulder at 565 nm in aqueous solution [33]. Upon increasing the concentration of CdSe QDs, a new absorption peak has seen with a maximum at 520 nm. The decrease in the absorption band of the TH monomer confirms the formation of H-type aggregates with CdSe QDs. The presence of an isobestic point also authenticates the existence of two species that are responsible for the observed absorption changes [34]. Thus, with the addition of CdSe QDs, TH molecules are adsorbed on the surface of CdSe QDs due to the electrostatic attractive force between the cationic dye molecules and the negatively charged L-cysteine capped CdSe QDs surfaces aggregates, which causes a blue shift (H-type) in the absorption band [35,36]. This causes the formation of a close-packing arrangement of the dye molecules on the negatively charged particle surface [37], and thus increases the concentration of TH on particle surfaces.

3.2. Confocal Raman Microscopy

The formation of TH@CdSe QDs was also confirmed with confocal Raman studies. Figure 2 displays the confocal Raman spectra of (a) TH and (b) TH-coated CdSe QDs. The Raman bands obtained for TH (a) are in good agreement with the early reports [38,39]. The Raman spectrum of Thionine displays characteristics peaks at 480 cm−1, 531 cm−1, 1484 cm−1 and 1626 cm−1, corresponding to C-S-C stretching, asymmetric ring stretching, C-N-C bending and H–plane bending vibrations. In addition, The Raman spectrum of TH@CdSe QDs (b) are considerably similar to the vibrational bands obtained for TH, indicating no significant change in the structural features of TH upon interaction with CdSe QDs. The increase in the intensity of Raman bands of TH-coated CdSe QDs was attributed to the presence of CdSe QDs. From the spectrum, it is inferred that there exists strong electrostatic interactions between the positively charged dye molecules and negatively charged CdSe QDs.

3.3. Surface Morphology

The HRTEM images of CdSe QDs before and after the addition of TH are shown in Figure 3. The HRTEM image of CdSe QDs (a) shows the spherical shape with the size ranges between 2–8 nm. After the addition of TH, (b) it was found that the CdSe QDs exhibits similar particle shape and size, with some aggregation. The formation of TH@CdSe QDs further supports the above absorption spectra changes.

3.4. Electrochemical Characterization of TH@CdSe QDs Modified PIGE

The electrochemical characterization of TH@CdSe QDs-modified PIGE was carried out using cyclic voltammetry in 0.1 M NH4NO3 and purged nitrogen. The CVs of bare PIGE (a), CdSe QDs-modified PIGE (b) TH-modified PIGE (c) and TH@CdSe QDs-modified PIGE (d) in 0.1 M NH4NO3 at a scan rate of 50 mV/s is shown in Figure 4. No peak was observed for the bare PIGE and CdSe QDs-modified PIGE in the potential range studied. Compared with bare PIGE, the background current for CdSe QDs-modified PIGE is apparently larger, which indicates that the electrode surface area is significantly enhanced after being modified with CdSe QDs. The TH-modified PIGE shows the cathodic and anodic peaks at potentials of −0.32 V and −0.21 V, respectively, and the peak-to-peak separation (∆Ep) is found to be 0.11 V. On the other hand, TH@CdSe QDs-modified PIGE exhibited a pair of well-defined redox peaks with cathodic and anodic peak potentials of −0.2260 V and −0.1547 V, respectively. The redox peaks correspond to the two-electron process of immobilized TH [40] and the ∆Ep was found to be 0.0713 V. The decrease in the ∆Ep values together with the increase in the peak current indicate the reversibility of the electrode process, and this is attributed to the synergistic effect of CdSe QDs [41,42].

3.5. Effect of Supporting Electrolyte

The effect of varying the supporting electrolytes on the electrochemical performance of the modified electrode was evaluated. Figure 5 compares the CV response of TH@CdSe QDs-modified PIGE in 0.1 M solutions of Ba(NO3)2, BaCl2, NH4NO3, NH4Cl, KNO3, KCl, NaCl, NaNO3 and PBS. It was observed that the modified electrode exhibits a relatively better CV response in NH4NO3. The ammonium ions are favorable for the proton transfer (redox reaction) of Thionine molecules in the electrode surface compared to other K+, Na+ or Ba2+. Hence, 0.1 M NH4NO3 was chosen as the background electrolyte for further electrochemical studies.

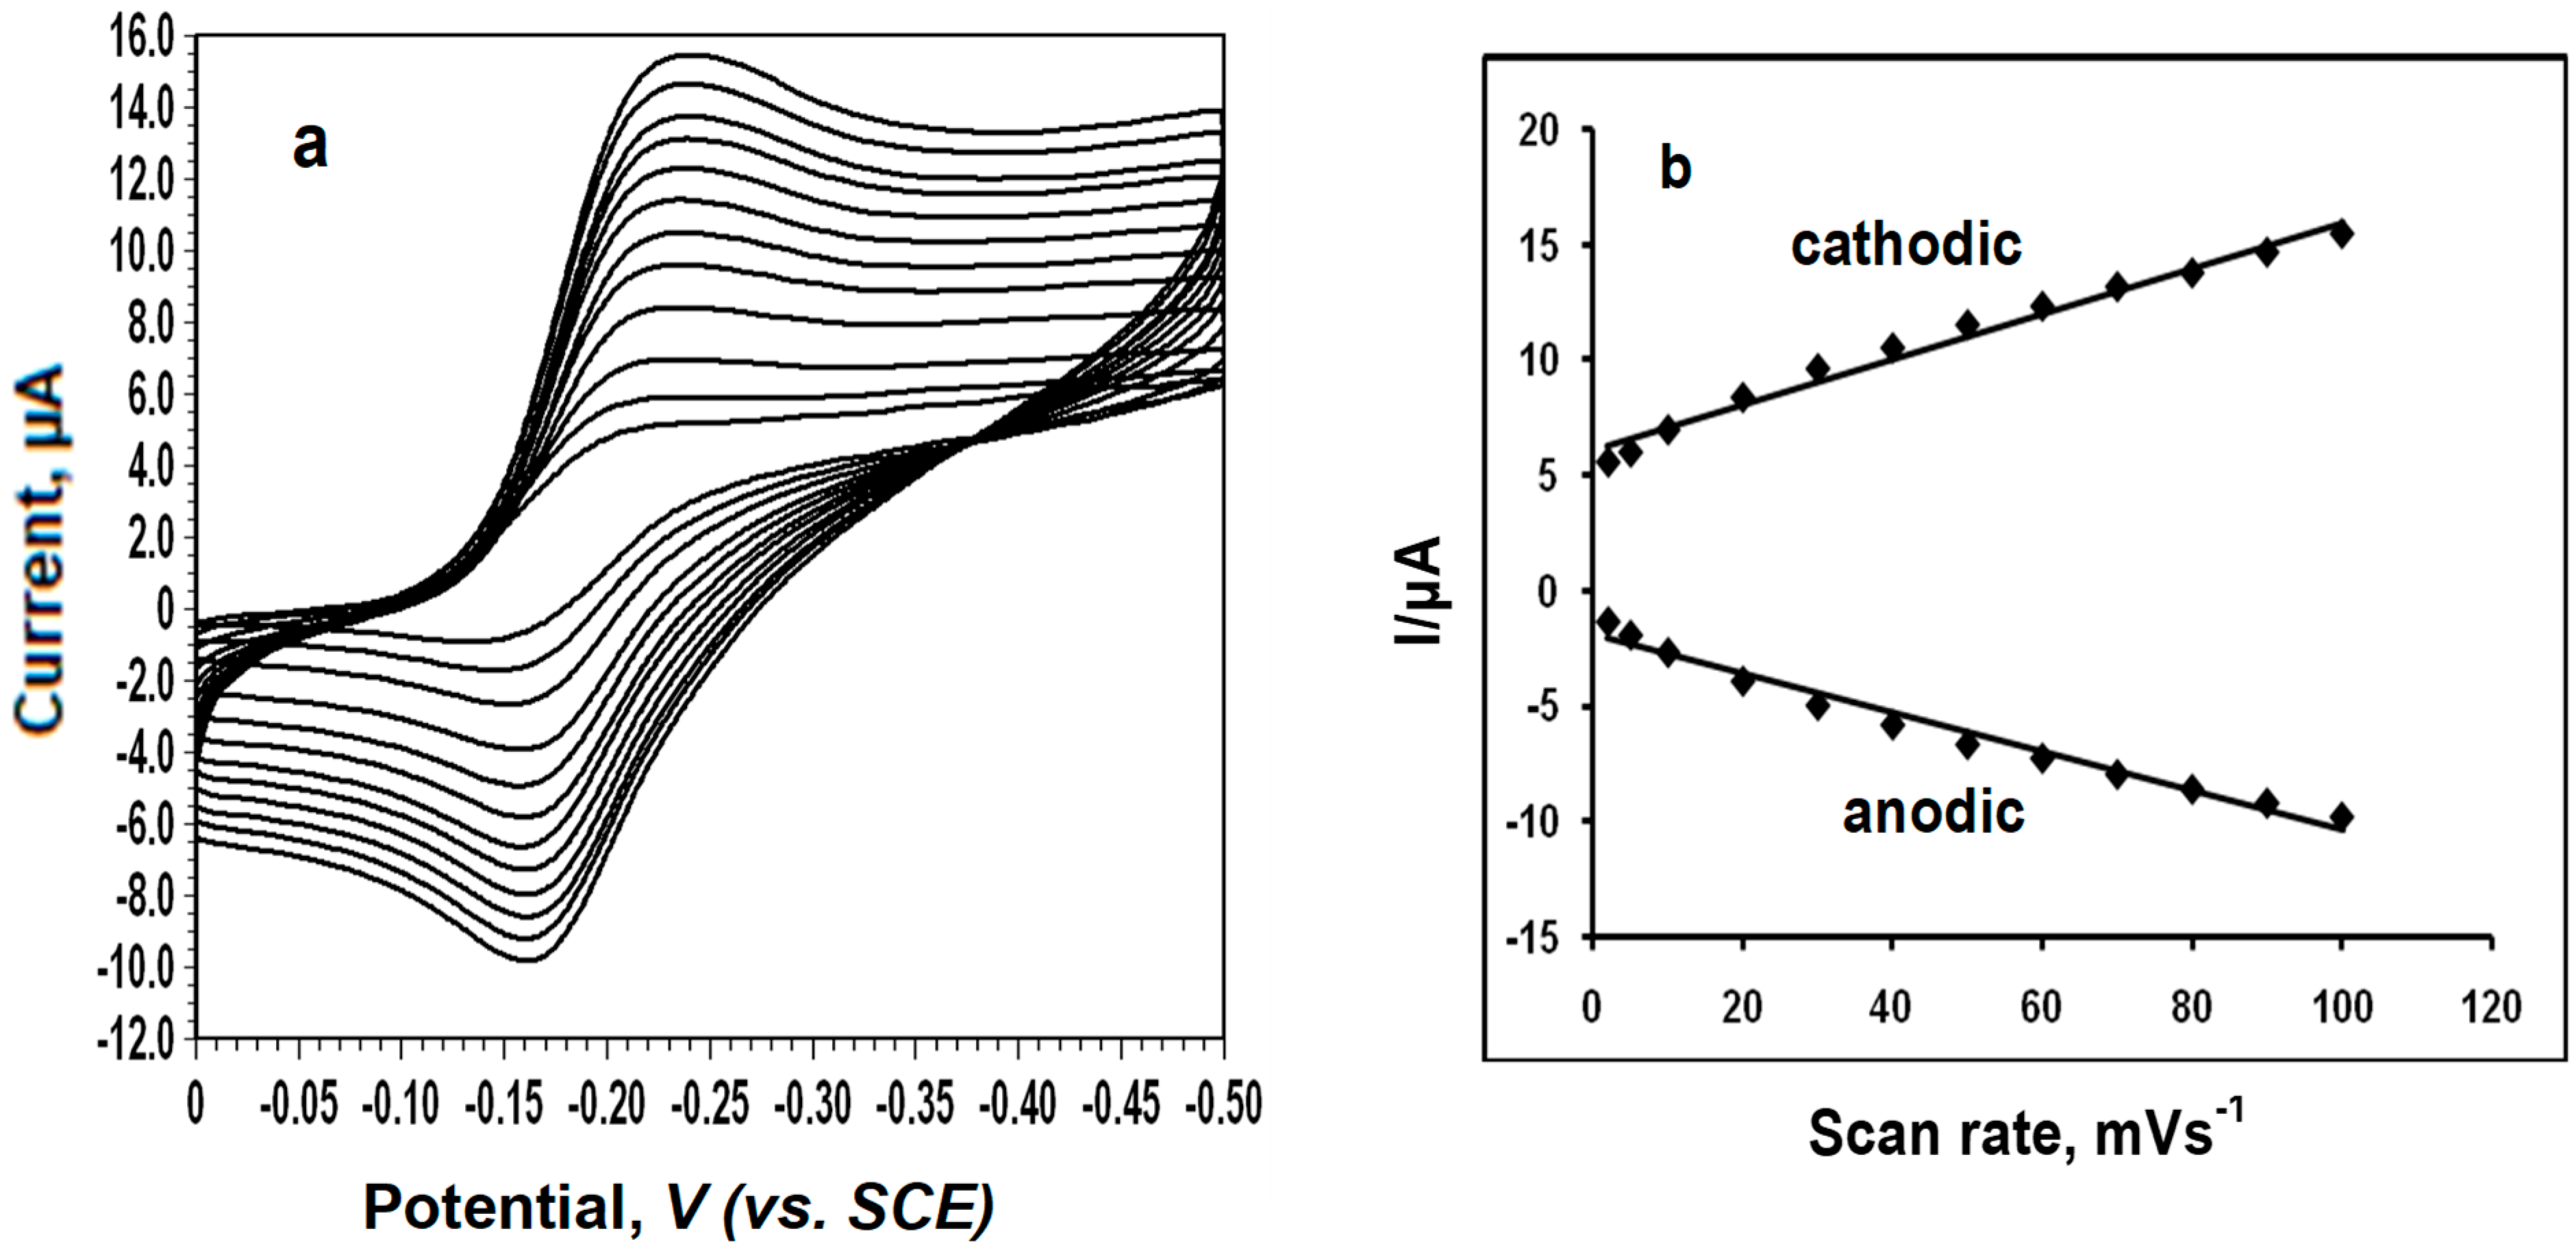
3.6. Effect of Scan Rate and pH

The electrochemical behaviour of the modified electrode at different scan rates from 10–100 mV/s was studied using cyclic voltammetry and the results are shown in Figure 6a. It was observed that on increasing the scan rate from 2–100 mV/s in 0.1 M NH4NO3, the peak currents also increased. When the peak currents were plotted against the scan rate, there was a linear increase, which suggests that the redox process is surface-confined (Figure 6b) [43].
The electrochemical rugosity (Γ) or surface concentration of TH was estimated [44] according to the Equation (1):
Γ = Q/nFA
where Q is the integrated charge passed through the modified electrode, A is the area of the electrode, and n, F have their usual meaning. The Γ of the modified electrode was calculated to be 2.77 × 10⁻¹⁰ mol/cm2 at a scan rate of 50 mV/s. The increase in the surface concentration could be attributed to the large surface area provided by the CdSe QDs, where more TH molecules were adsorbed effectively.
The electrochemical behaviour of the modified electrode was also investigated by CV in 0.1 M NH4NO3 in the pH range of 4–9. It was found that the current response of the TH@CdSe QDs-modified PIGE increases from 4.0 to 7.0 and reaches a maximum response at a pH of 7.0. Then, the peak current starts to decrease. Thus, a working pH of 7.0 was chosen for further measurements.

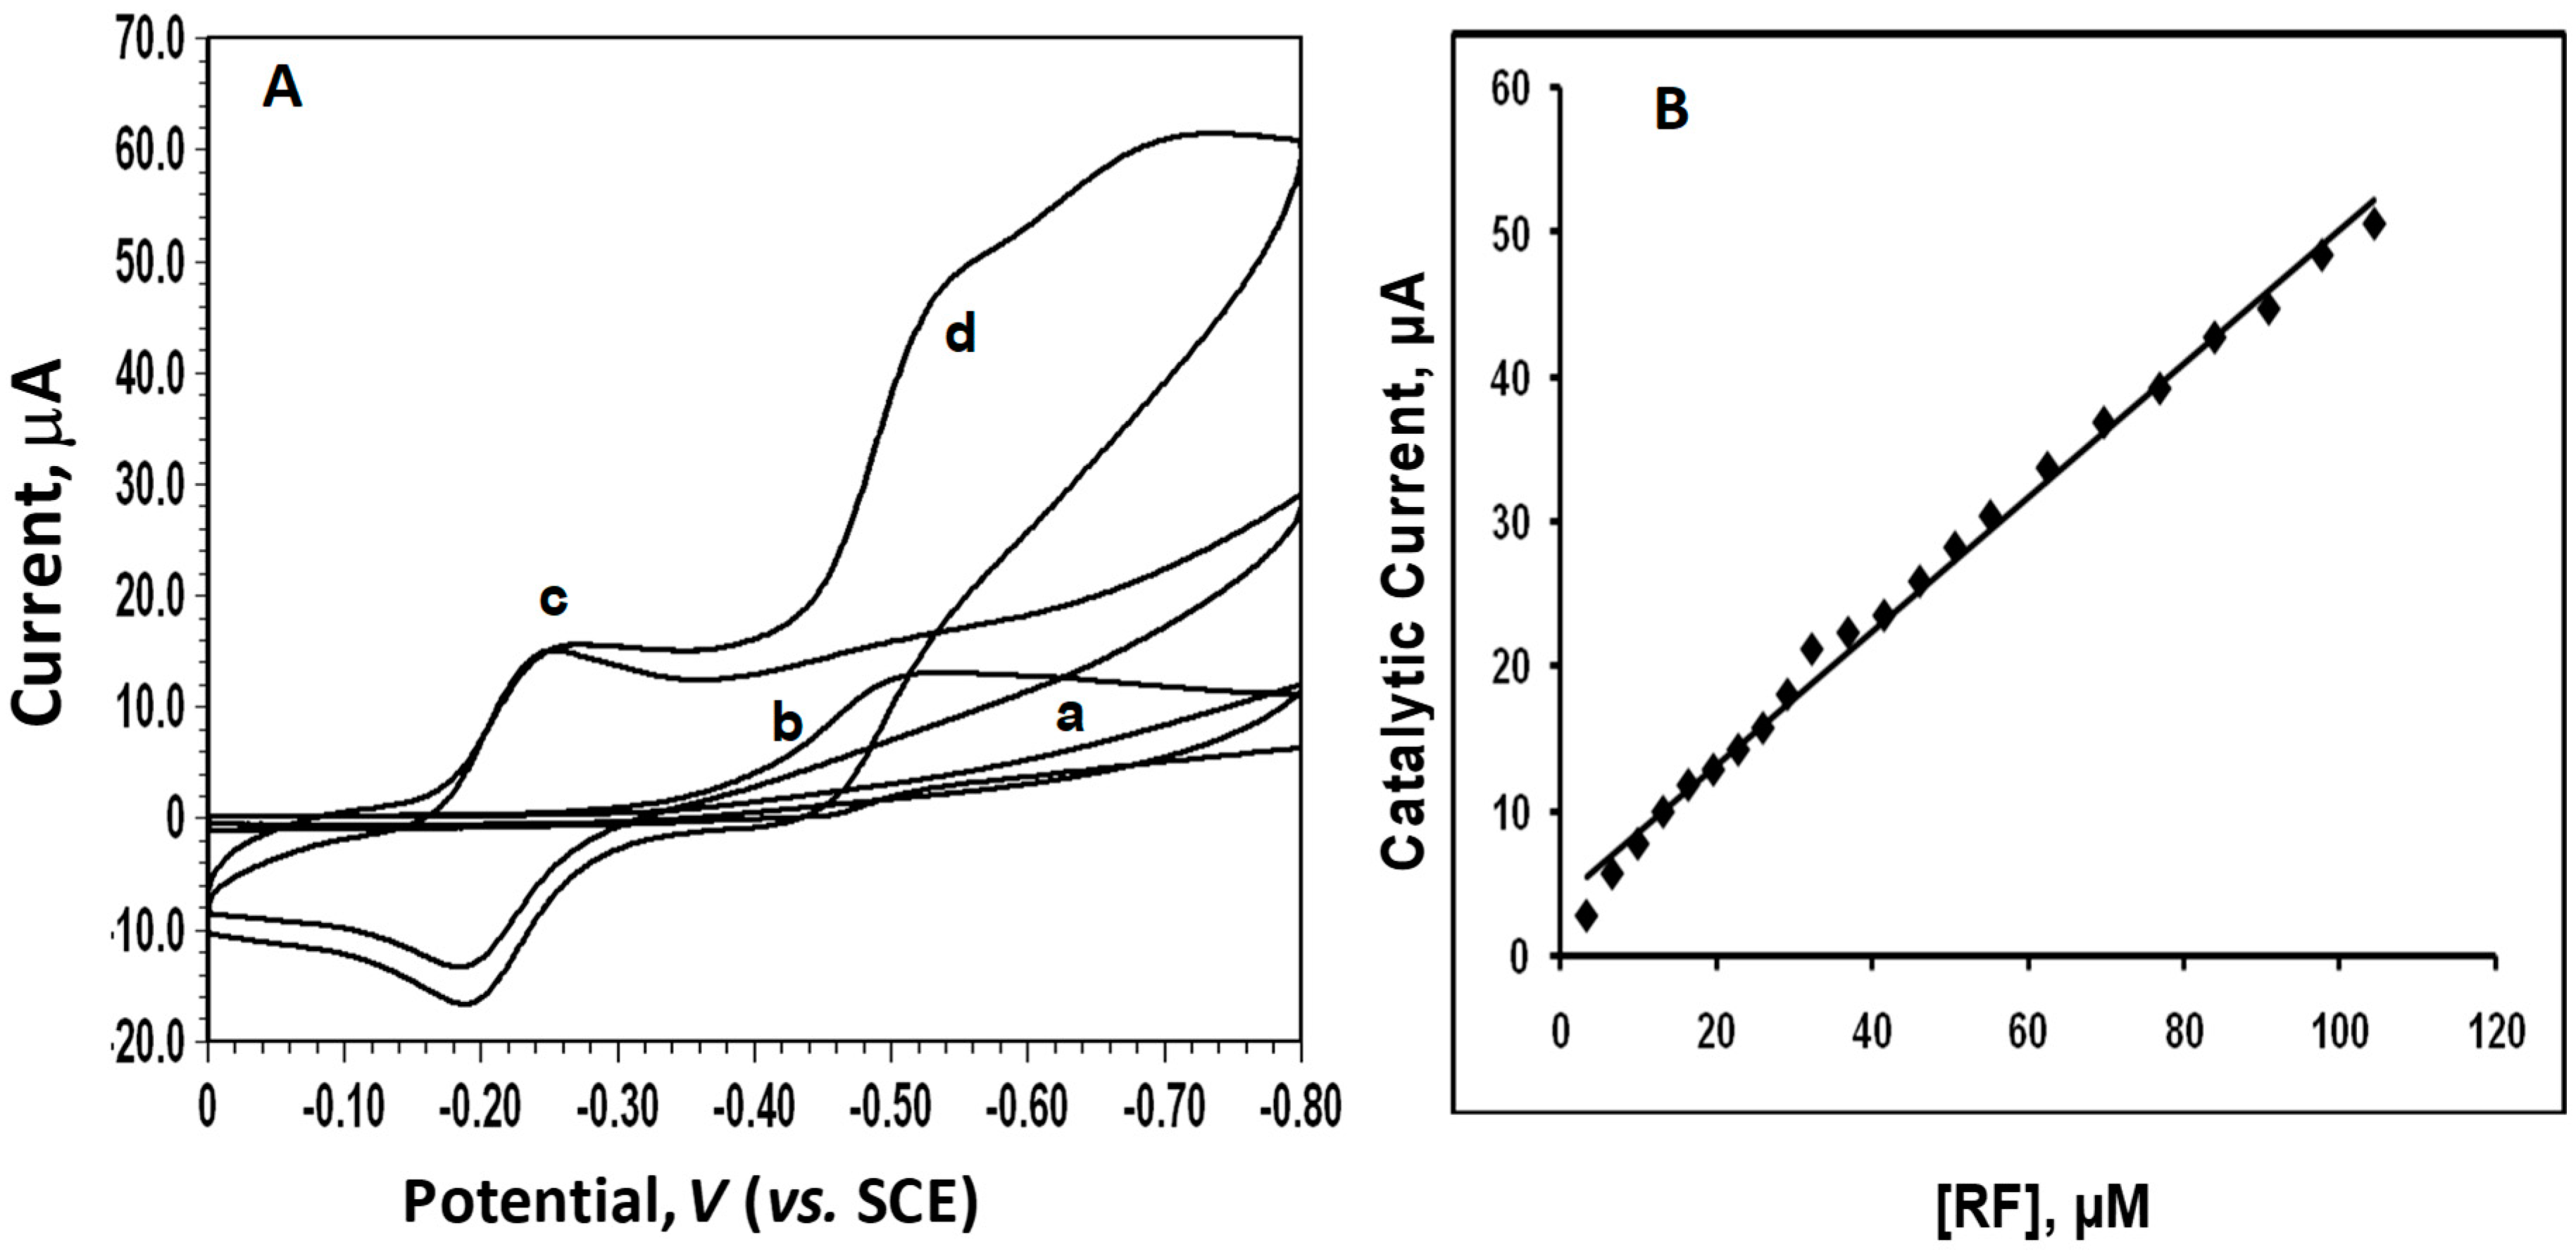
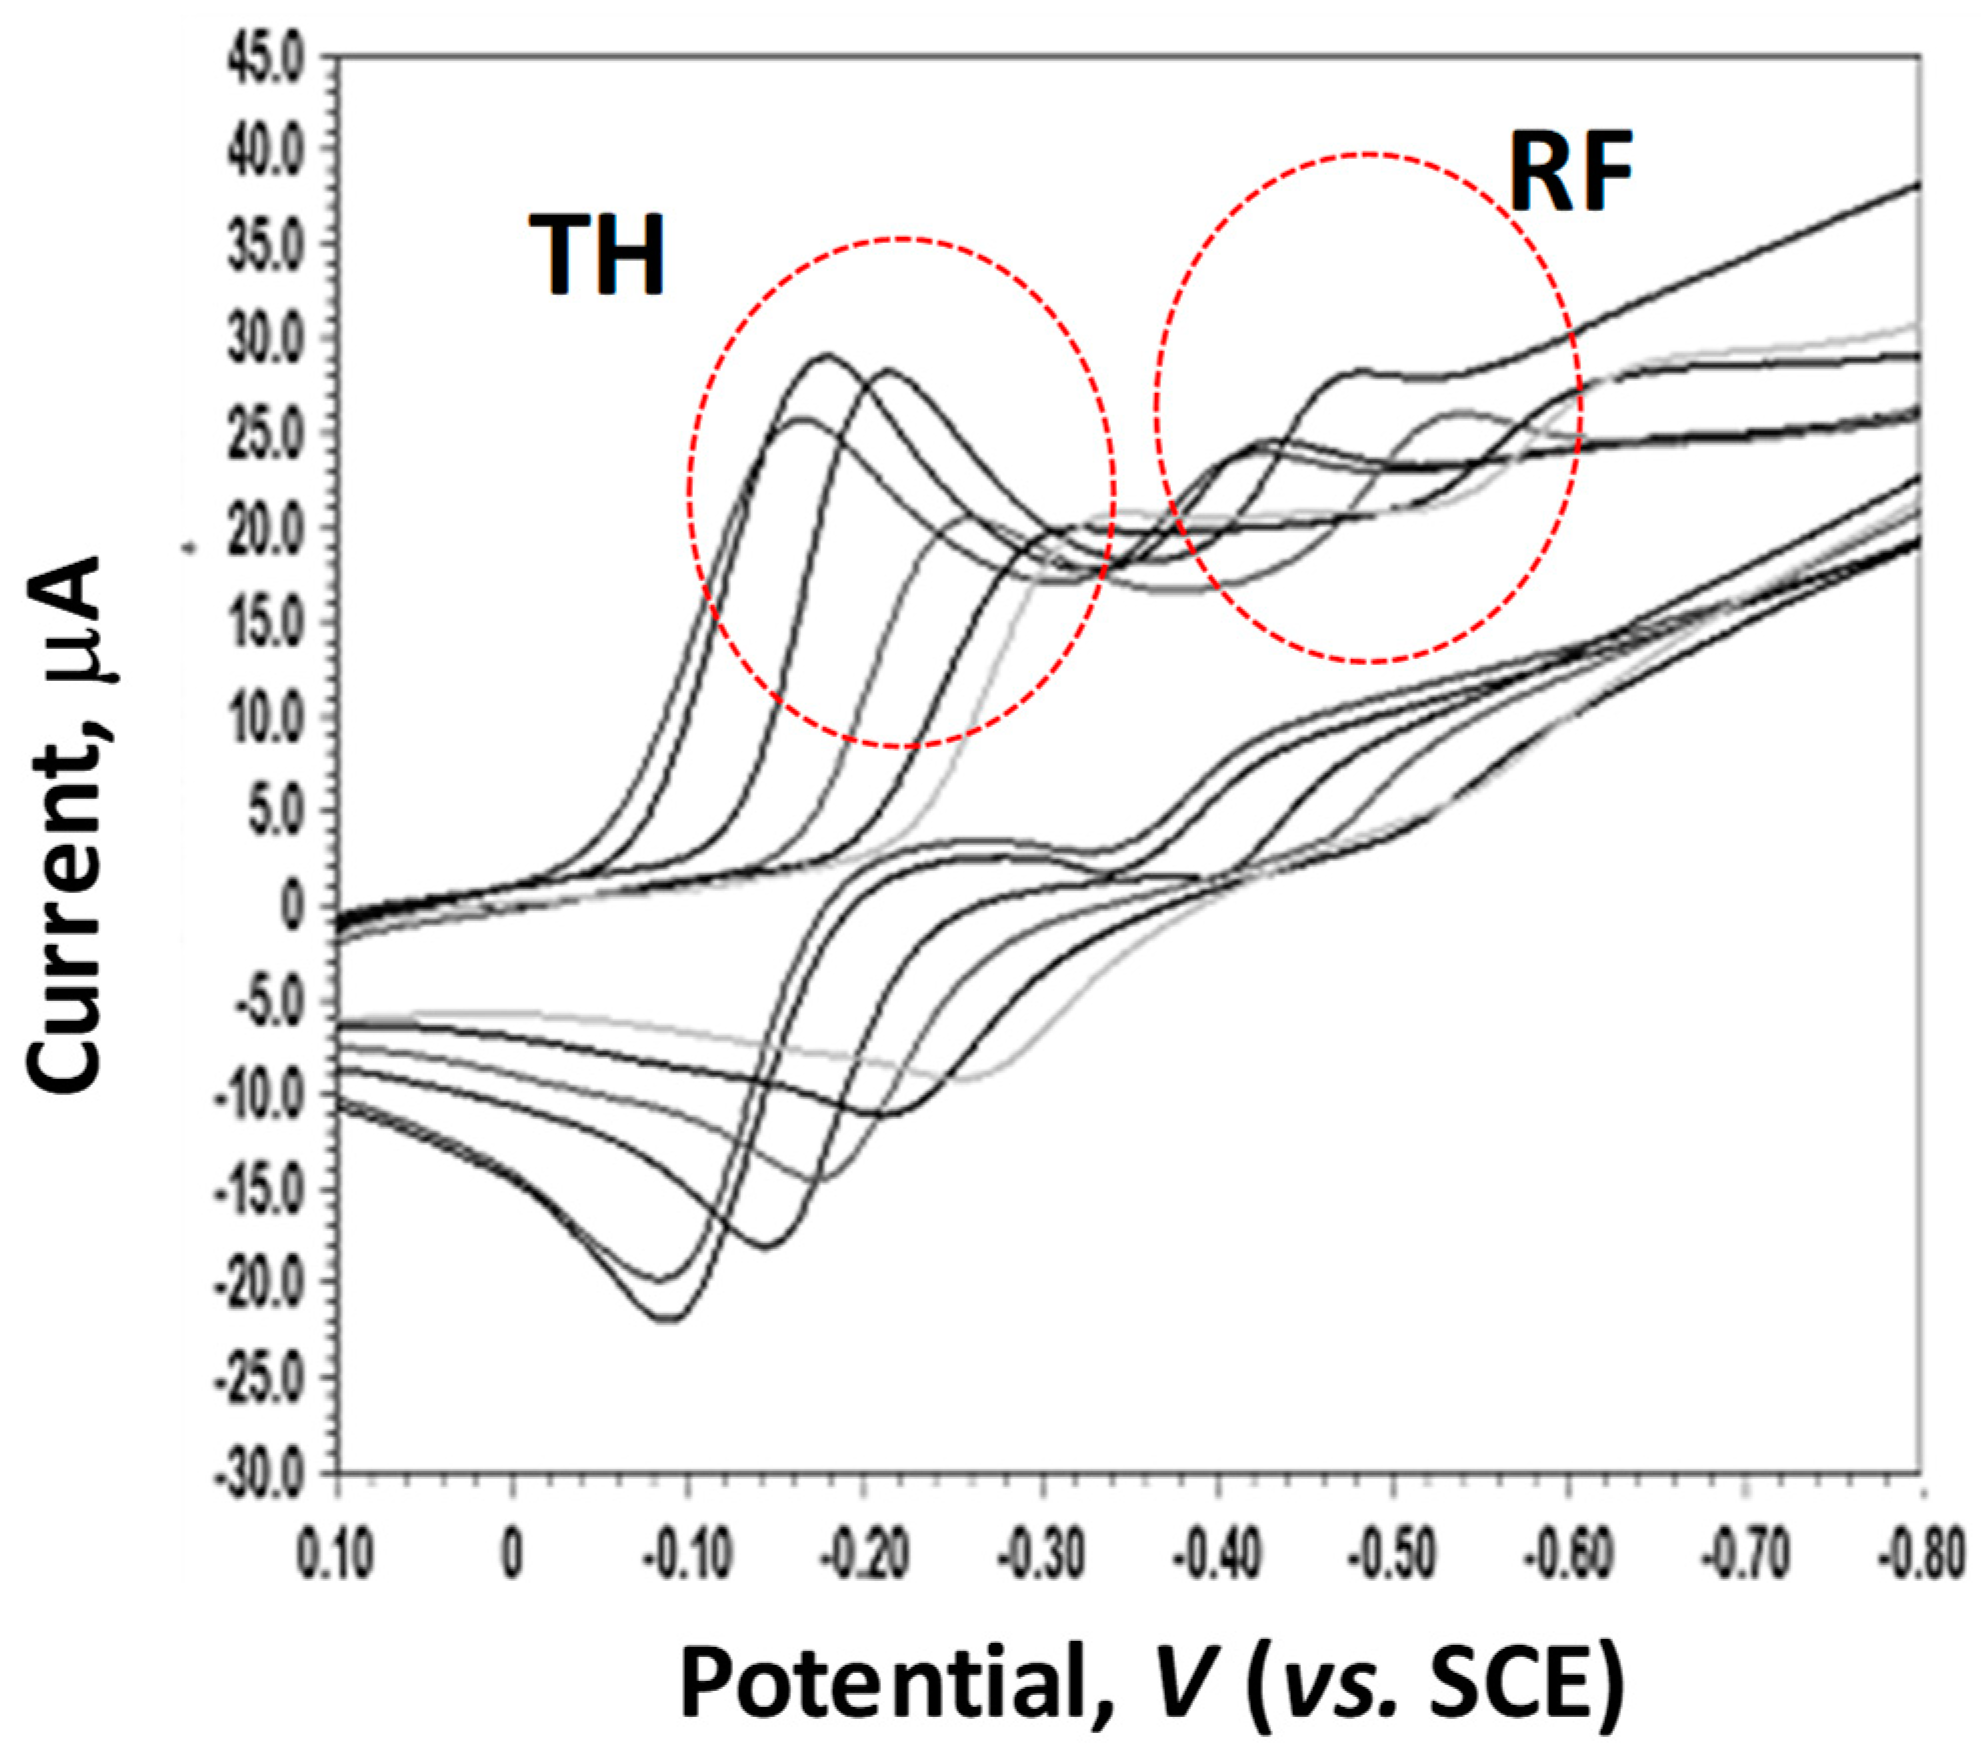
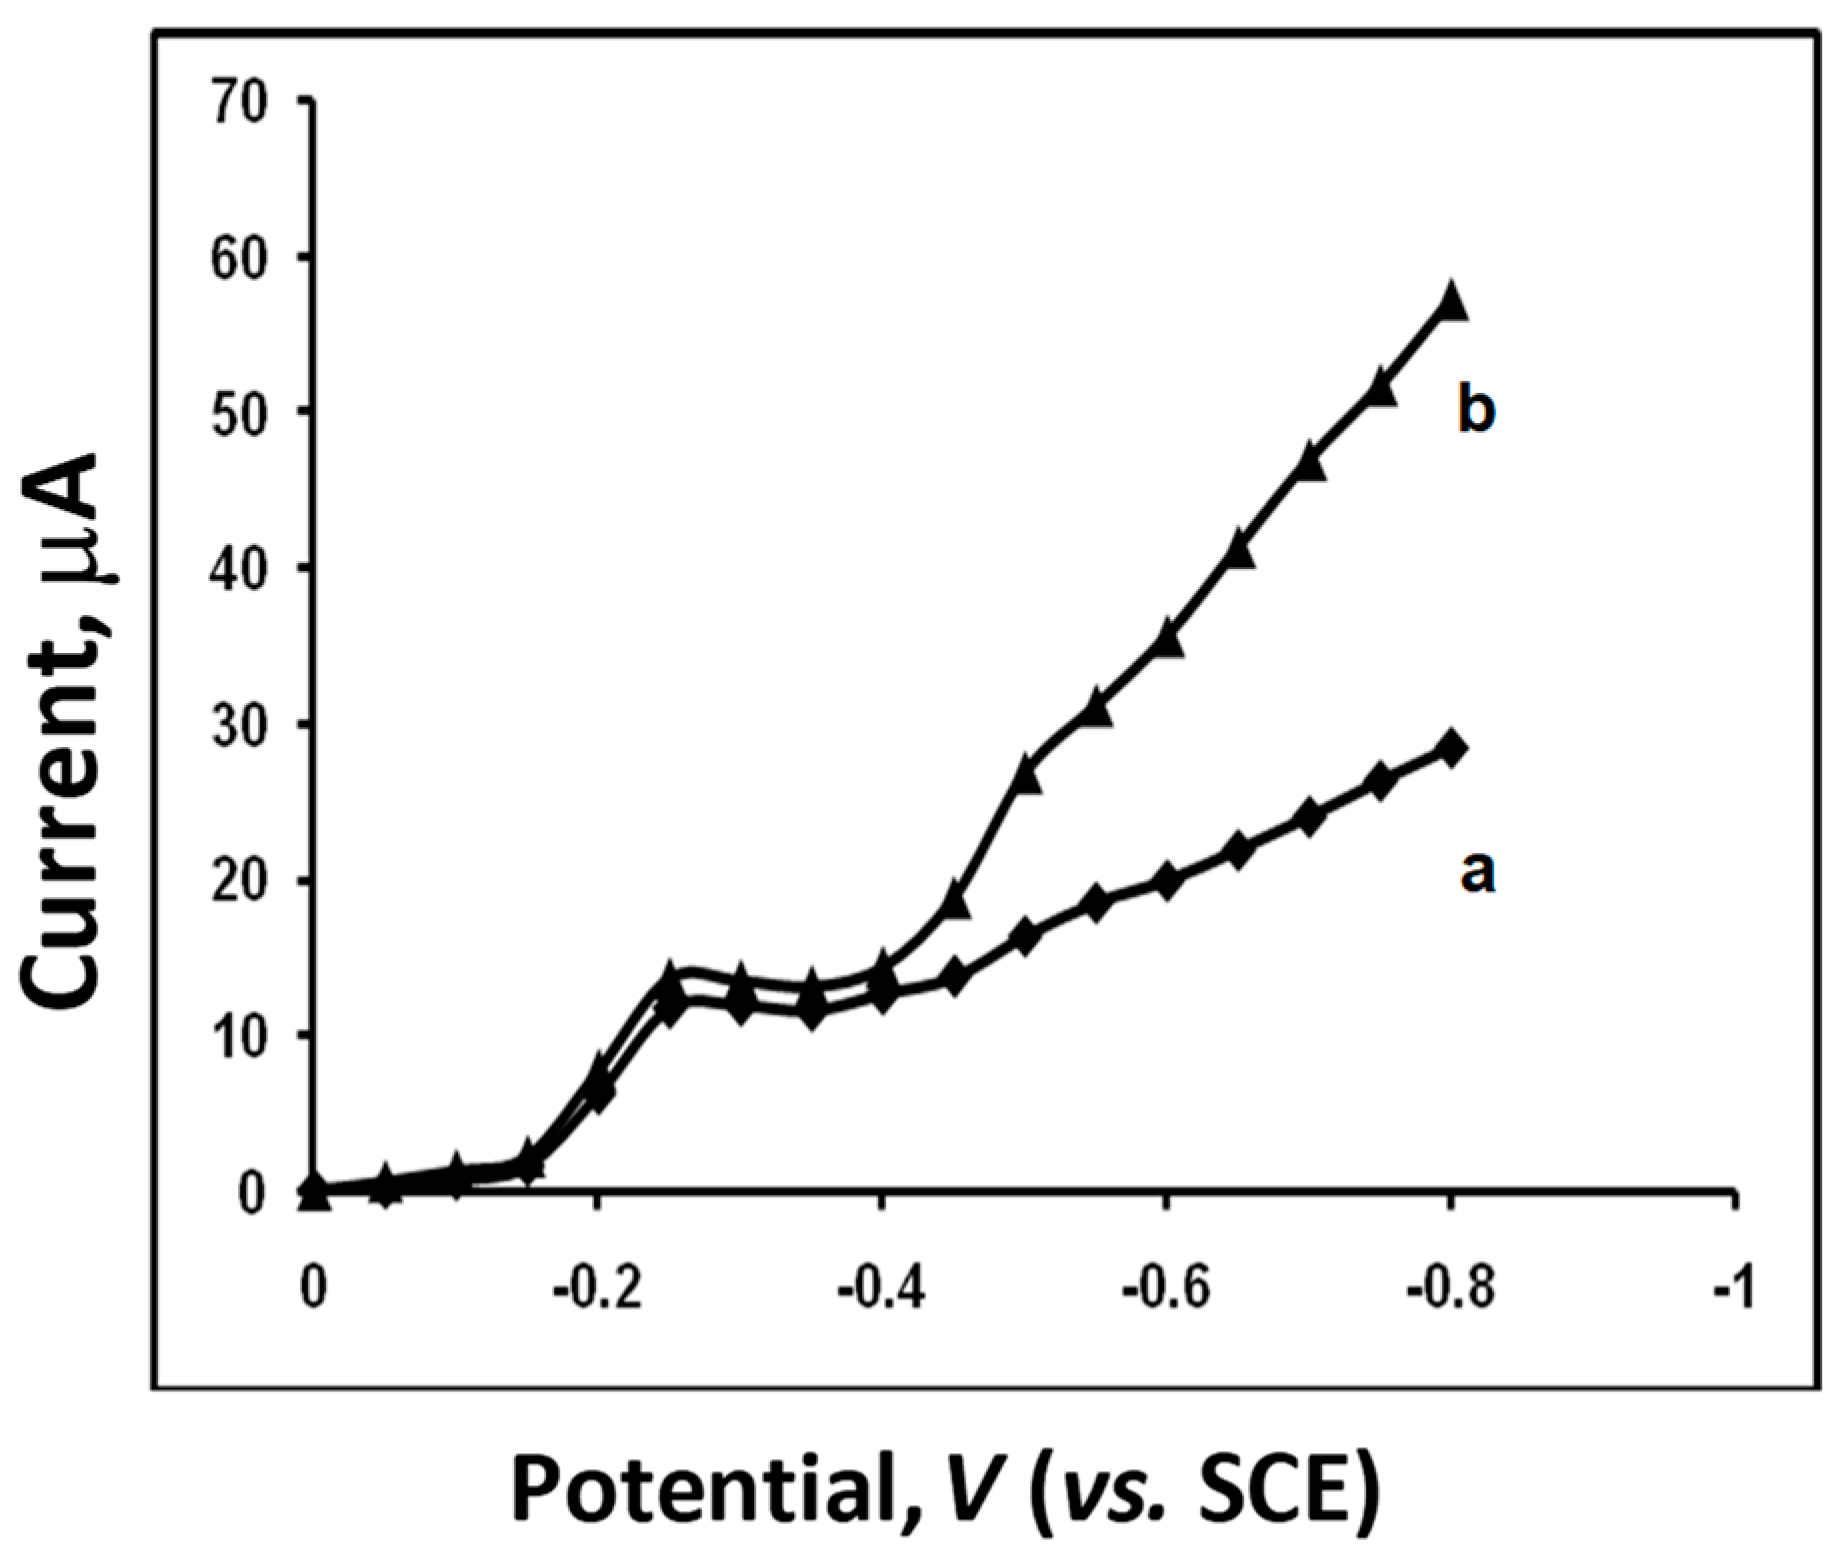
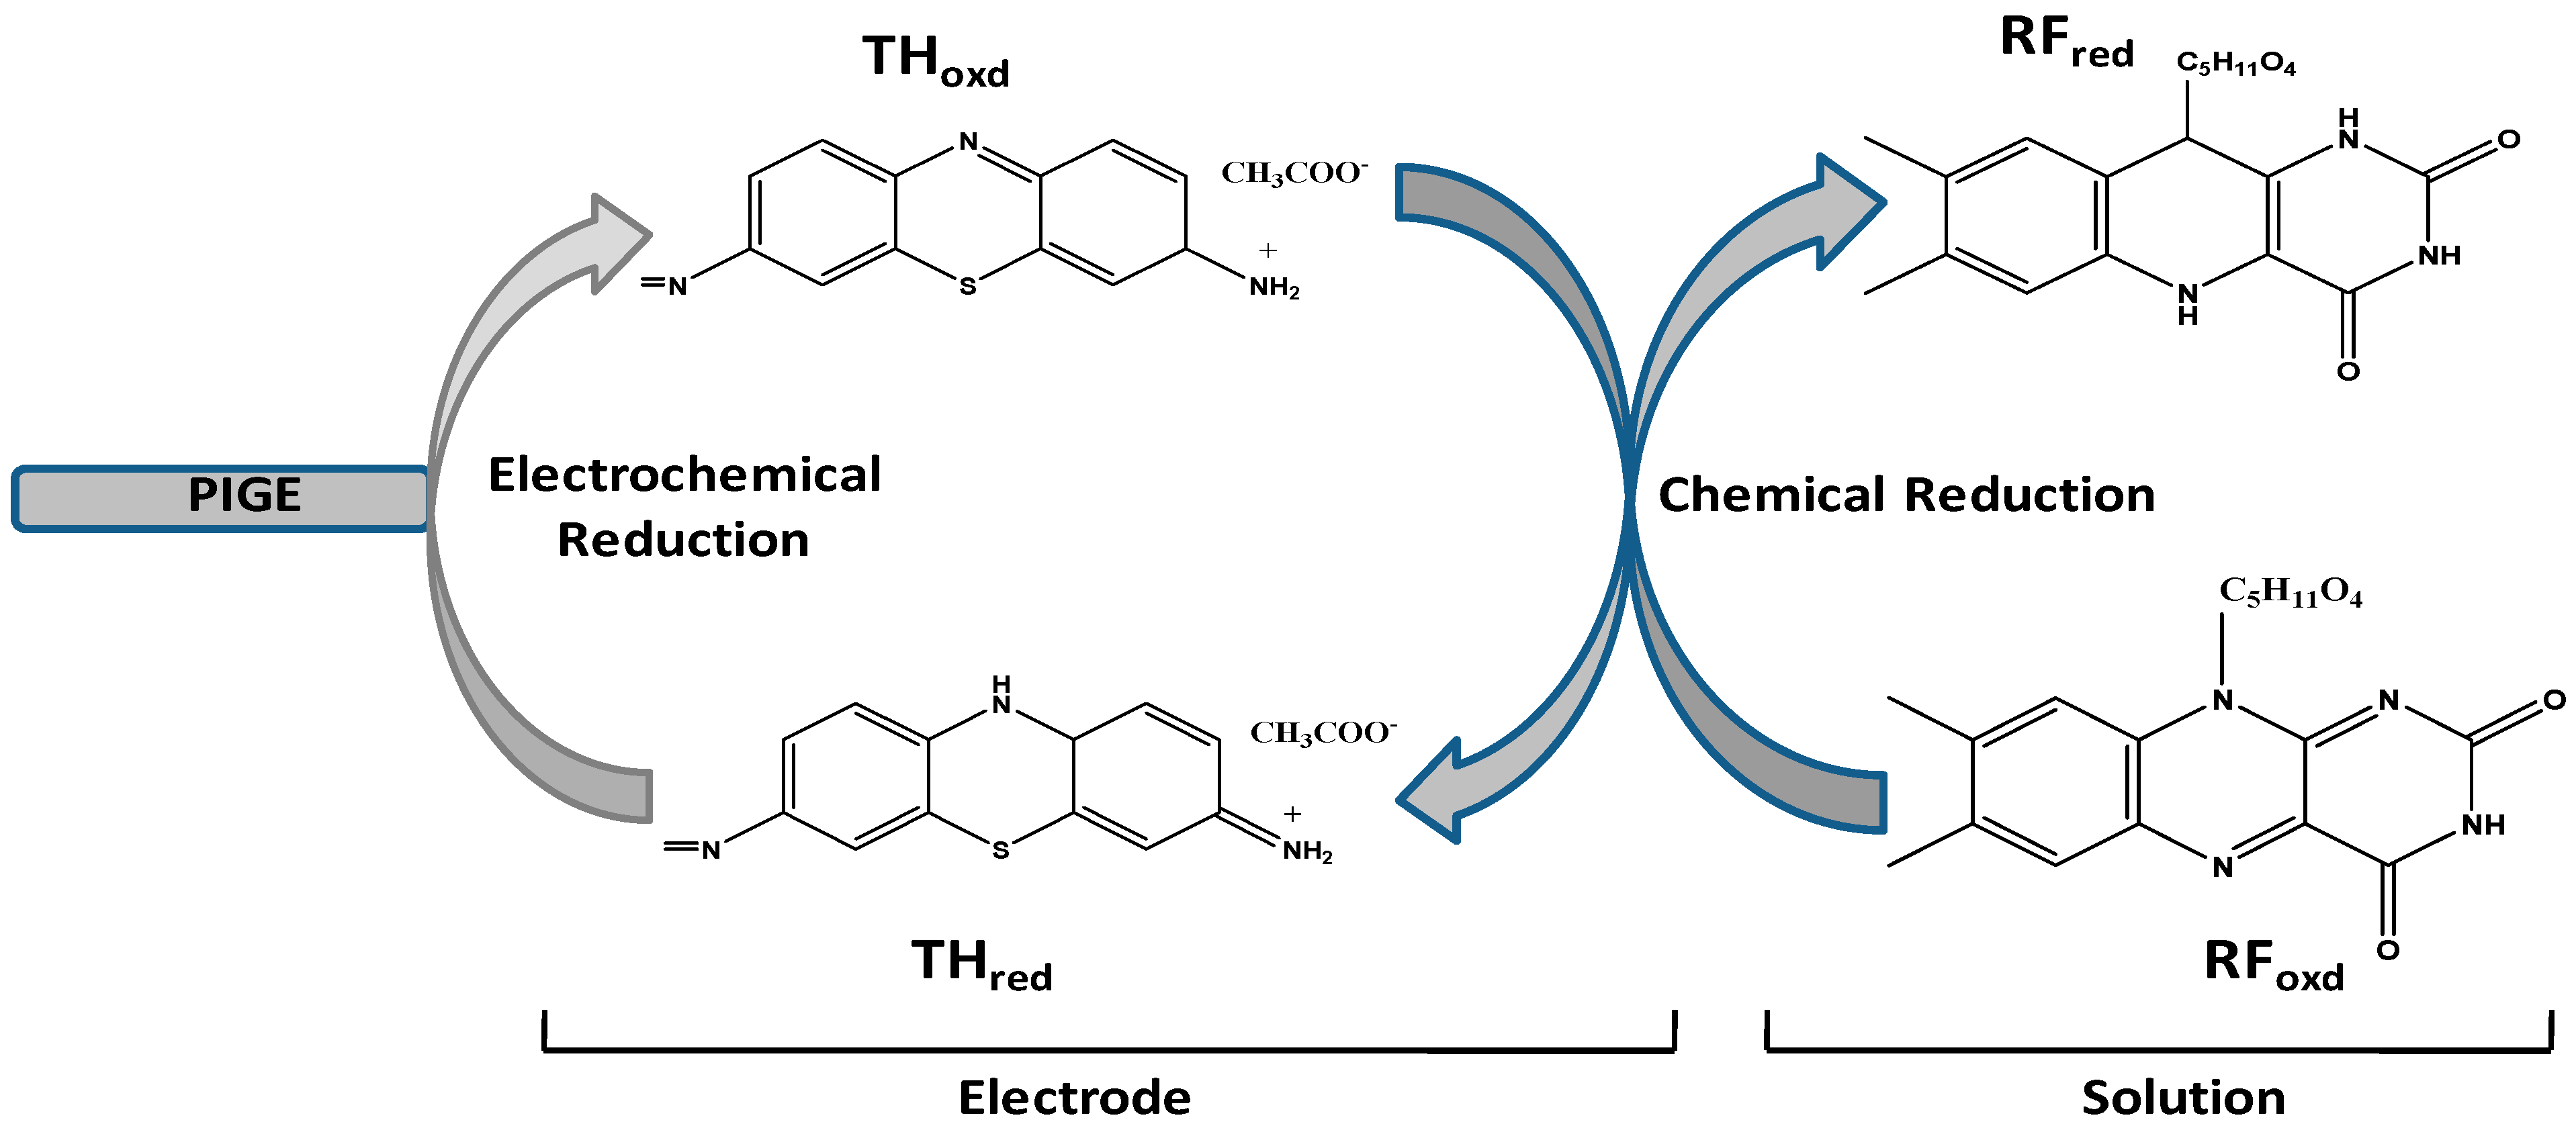
3.7. Electrocatalytic Behavior of TH@CdSe QDs Modified PIGE for the Reduction in RF

The electrocatalytic activity of the TH@CdSe QDs-modified PIGE for the reduction in RF was examined by cyclic voltammetric experiments in 0.1M NH4NO3 in the absence and presence of RF. The reduction in RF under similar conditions with the bare electrode was also tested. Figure 7A shows the CV response of the bare electrode (curve a and b) and TH@CdSe QDs-modified PIGE (curve c and d) in the absence and in the presence of 6.25 × 10⁻⁵ M RF, respectively. As can be seen from the figure, the current response for the reduction in RF at the bare electrode was poor, but the modified electrode showed a better and considerable increase in the current response at −0.52 V. The oxidation and reduction potentials of RF are −0.44 V and −0.52 V, respectively, and show a quasi-reversible system. The presence of CdSe QDs in the modified electrode influenced the electrocatalytic activity in terms of peak potential and increased current response. Under optimal conditions, the cyclic voltammograms of the modified electrode were studied in the presence of an increasing concentration of RF. The TH@CdSe QDs-modified PIGE showed increased cathodic peak currents in the range of 1.6 × 10⁻⁷ M to 1.4 × 10⁻⁴ M (R2 = 0.9940) with a detection limit of 53 × 10−9 M (S/N = 3) with various additions of RF using the cyclic voltammetry technique (Figure 7B). The above result indicates that the TH@CdSe QDs-modified PIGE exhibits an improved analytical performance for the determination of RF. The mechanism for electrocatalytic reduction in RF can be represented as shown in Scheme 1. The linear working range and detection limit obtained with the present sensor are better or comparable with earlier reports, as shown in Table 1.
The effect of solution pH on the electrochemical behavior of TH@CdSe QDs-modified PIGE in the presence of 1.6 × 10⁻⁵ M RF was investigated by CV at various pHs (4–9) in 0.1 M NH4NO3 and the current response was plotted against pH, as shown in Figure 8. It was observed that the modified electrode exhibits maximum and a stable peak current response at pH 7.0. Hence, the determination of RF is well favored at the modified electrode at a physiological pH, and it is suitable for real time applications.

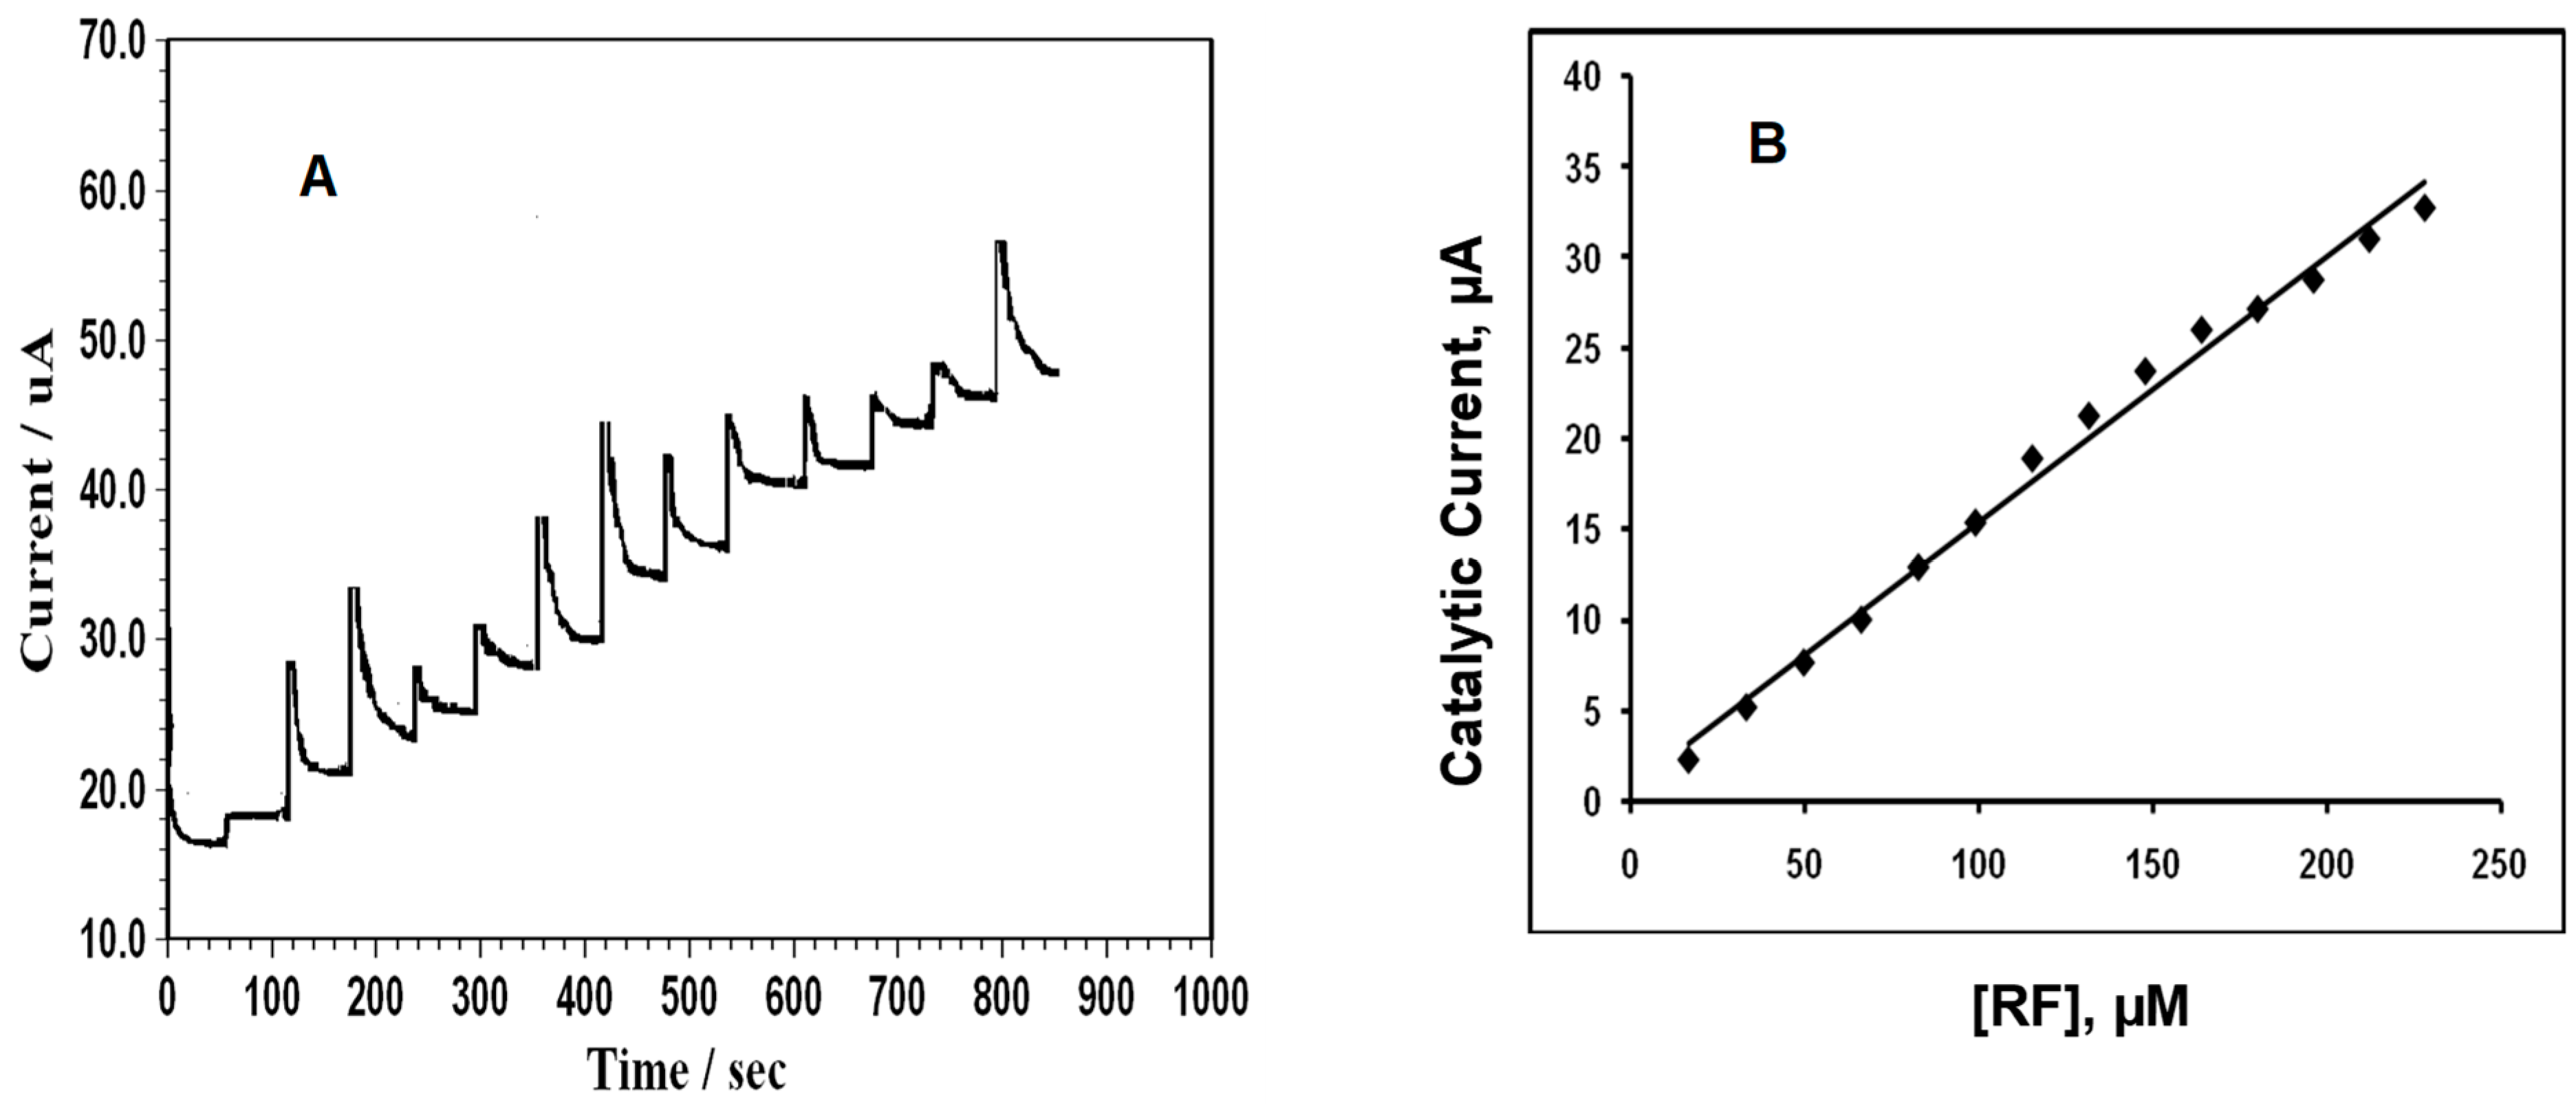
3.8. Hydrodynamic and Chronoamperometric Studies

Hydrodynamic voltammetric studies were performed to optimize the working potential of RF determination in flow systems. The cathodic current was measured at constant intervals of applied potential, for 3.2 × 10⁻⁵ M RF in the potential range of 0 to −0.8 V. The curves a and b of Figure 9 show the HDVs of the TH@CdSe QDs-modified electrode in the presence and absence of RF, respectively. As can be seen from the figure, the current response for the reduction in RF starts at a potential of −0.4 V and exhibits a maximum response at −0.55 V. Hence, a potential of −0.6 V was chosen as the working potential for the amperometric determination of RF. Figure 10A shows the amperogram obtained for the addition of 1.6 × 10⁻⁵ M RF in a stirred solution of 0.1 M NH4NO3. A step-wise increase in the cathodic current was observed for every addition of RF at an applied potential of −0.6 V. For repeated additions of RF, the electrode gave a sharp increase in current and attained a steady state condition within 6 s. The corresponding calibration plot of catalytic current versus the concentration of RF is shown in Figure 10B, and it is observed that the modified electrode exhibits a linear current response with correlation coefficient of 0.9910. The result indicates that the modified electrode exhibited good sensitivity and has a stable amperometric response under dynamic conditions.

3.9. Interference Studies

The anti-interference ability of the TH@CdSe QDs-modified PIGE towards the determination of RF was tested by DPV in the presence of various common ions such as Fe3+, Mg2+, Na+, K+, Ca2+, NO3− and SO42− and some physiological interferents such as AA and UA. No change in the DPV current response was observed for 10 mM RF in the presence of a 100-fold excess of these metal ions and 50-fold excess of AA and UA. The results showed that the present modified electrode is highly selective towards the determination of RF.

3.10. Stability of TH@CdSe QDs Modified PIGE towards RF

The working stability of the TH@CdSe QDs-PIGE-modified PIGE towards the determination of RF was investigated by cycling the modified electrode in the presence of 3.2 × 10⁻⁵ M RF in 0.1 M NH4NO3 at a scan rate of 50 mV/s for 50 continuous cycles. The results showed only a 1.5% loss from the initial peak current value after 50 cycles. This indicates that the modified electrode has good stability and does not undergo surface fouling. The long-term stability of the modified electrode was also studied for a period of 45 days. The modified electrode was stored in an airtight container when not in use. The modified electrode was used to determine the same concentrations of RF, which showed 97% of initial current, indicating that the electrode had excellent long-term stability.

3.11. Determination of RF in Commercial Tablets

The practical application of the modified electrode was studied by the determination of RF in two different commercially available tablets. The tablets were finely ground, and they were dissolved with distilled water and made into a known volume. Then a known volume of the prepared samples was spiked, and the results obtained are shown in Table 2. The recovery results allowed us to use the proposed sensor in the determination of RF in pharmaceutical tablets.

4. Conclusions

In summary, we have achieved a non-enzymatic TH-coated CdSe QDs-modified electrode for the determination of RF in nM levels. The prepared TH-coated CdSe QDs were characterized and confirmed by UV-Vis spectroscopy, Raman spectroscopy and HRTEM studies. Cyclic voltammetry and chronoamperometry studies confirm the excellent electrochemical behaviour of the modified electrode. The incorporation of CdSe QDs in TH reveals the better electrocatalytic performance of the modified electrode with very high sensitivity and with a very low detection limit. The proposed sensor is a promising candidate for the determination of RF in pharmaceutical tablets with good recovery.

Author Contributions

Conceptualization, methodology, software, validation, and writing—original draft preparation, A.K., formal analysis, and writing—review and editing, R.S.B.; visualization and supervision, S.S.N. All authors have read and agreed to the published version of the manuscript.

Funding

This research received no external funding.

Acknowledgments

Arumugam Kalaivani would like to acknowledge the financial assistance from University of Madras through National Centre for Nanoscience and Nanotechnology.

Conflicts of Interest

The authors declare no conflict of interest.

References

  1. Girish, T.; Manjunatha, J.G. A surfactant enhanced novel pencil graphite and carbon nanotube composite paste material as an effective electrochemical sensor for determination of riboflavin. J. Sci. Adv. Mater. Dev. 2020, 5, 56–64. [Google Scholar] [CrossRef]
  2. Severino, S.M.-F.; Stefani, I.E.A.; Marcelo, B.L.; Mario, C.U.A. Synthesis of highly fluorescent carbon dots from lemon and onion juices for determination of riboflavin in multivitamin/mineral supplements. J. Pharm. Anal. 2019, 9, 209–216. [Google Scholar] [CrossRef]
  3. Anisimova, L.S.; Mikheeva, E.V.; Slipchenko, V.F. Voltammetric determination of riboflavin in vitaminized supplements and feeds. J. Anal. Chem 2001, 56, 658–662. [Google Scholar] [CrossRef]
  4. Privitera, M.L.; Lozano, V.A. Development of a second-order standard addition fluorescence method for the direct determination of riboflavin in human urine samples without previous clean up and separation steps. Microchem. J. 2017, 133, 60–63. [Google Scholar] [CrossRef]
  5. Zhang, Z.; Xu, J.; Wen, Y.; Wang, T. A highly-sensitive VB2 electrochemical sensor based on one-step co-electrodeposited molecularly imprinted WS2-PEDOT film supported on graphene oxide-SWCNTs nanocomposite. Mater. Sci. Eng. C 2018, 92, 77–87. [Google Scholar] [CrossRef] [PubMed]
  6. Wang, Z.; Zhang, L.; Hao, Y.; Dong, W.; Liu, Y.; Song, S.; Shuang, S.; Dong, C.; Gong, X. Ratiometric fluorescent sensors for sequential on-off-on determination of riboflavin, Ag+ and L-cysteine based on NPCl-doped carbon quantum dots. Anal. Chim. Acta 2021, 1144, 1–13. [Google Scholar] [CrossRef] [PubMed]
  7. Kang, L.; Lin, C.; Ning, F.; Sun, X.; Zhang, M.; Zhang, H.; Wang, Y.; Hu, P. Rapid determination of folic acid and riboflavin in urine by polypyrrole magnetic solid-phase extractant combined ultra-performance liquid chromatography. J. Chromatogr. A 2021, 1648, 462192. [Google Scholar] [CrossRef]
  8. Wang, H.; Ma, Q.; Wang, Y.; Wang, C.; Qin, D.; Shan, D.; Chen, J.; Lu, X. Resonance energy transfer based electrochemiluminescence and fluorescence sensing of riboflavin using graphitic carbon nitride quantum dots. Anal. Chim. Acta 2017, 973, 34–42. [Google Scholar] [CrossRef]
  9. Alvarenga, B.R., Jr.; Soares, F.L.F.; Ardila, J.A.; Durango, L.G.C.; Forim, M.R.; Carneiro, R.L. Determination of B-complex vitamins in pharmaceutical formulations by surface-enhanced Raman spectroscopy. Spectrochim. Acta Part A Mol. Biomol. Spectrosc. 2018, 188, 589–595. [Google Scholar] [CrossRef]
  10. Stefanov, C.; Negut, C.C.; Gugoasa, L.A.D.; Staden, J.F. Sensitive voltammetric determination of riboflavin in pharmaceutical and biological samples using FSN-Zonyl-Nafion modified carbon paste electrode. Microchem. J. 2020, 155, 104729. [Google Scholar] [CrossRef]
  11. Kamath, K.A.; Manjunatha, J.; Girish, T.; Sillanpää, M.; Tighezza, A.M.; Albaqami, M.D. Sensitive electrochemical determination of riboflavin at simple and low-cost poly (valine) modified graphite paste electrode. Inorg. Chem. Commun. 2022, 143, 109811. [Google Scholar] [CrossRef]
  12. Monteiro, M.C.; Winiarski, J.P.; Santana, E.R.; Szpoganicz, B.; Vieira, I.C. Ratiometric electrochemical sensor for butralin determination using a quinazoline-engineered Prussian Blue analogue. Molecules 2023, 16, 1024. [Google Scholar] [CrossRef] [PubMed]
  13. Zhang, L.; Liu, X.; Luo, L.; Hu, C.; Fu, J.; Chang, X.; Gan, T. A high-performance voltammetric methodology for the ultra-sensitive detection of riboflavin in food matrices based on graphene oxide-covered hollow MnO2 spheres. Food Chem. 2021, 352, 129368–129376. [Google Scholar] [CrossRef] [PubMed]
  14. Yingming, S.; Pan, H.; Chu, H.; Mamat, M.; Abudurexiti, A.; Li, D. Core-shell CdSe/ZnS quantum dots polymer composite as the saturable absorber at 1.3 μm: Influence of the doping concentration. Phys. Lett. A 2021, 400, 127307. [Google Scholar] [CrossRef]
  15. Zhu, Y.; Jin, T.; Lian, T.; Egap, E. Enhancing the efficiency of semiconducting quantum dot photocatalyzed atom transfer radical polymerization by ligand shell engineering. J. Chem. Phys. 2021, 154, 204903. [Google Scholar] [CrossRef]
  16. Litvin, A.; Martynenko, I.; Purcell-Milton, F.; Baranov, A.; Fedorov, A.; Gunko, Y. Colloidal quantum dots for optoelectronics. J. Mater. Chem. A 2017, 5, 13252–13275. [Google Scholar] [CrossRef]
  17. Selopal, G.S.; Zhao, H.; Wang, Z.; Rosei, F. Core/shell quantum dots solar cells. Adv. Funct. Mater. 2020, 30, 1908762. [Google Scholar] [CrossRef]
  18. Samuel, I. Colloidal nanocrystals: Electrifying quantum dots for lasers. Nat. Mater. 2018, 17, 9–10. [Google Scholar] [CrossRef]
  19. Chinnathambi, S.; Chen, S.; Ganesan, S.; Hanagata, N. Silicon quantum dots for biological applications. Adv. Healthc. Mater. 2014, 3, 10–29. [Google Scholar] [CrossRef]
  20. Shao, L.; Gao, Y.; Yan, F. Semiconductor quantum dots for biomedical applications. Sensors 2011, 11, 11736–11751. [Google Scholar] [CrossRef]
  21. Jouyandeh, M.; Khadem, S.S.M.; Habibzadeh, S.; Esmaeili, A.; Abida, O.; Vatanpour, V.; Rabiee, N.; Bagherzadeh, M.; Iravani, S.; Saeb, M.R.; et al. Quantum dots for photocatalysis: Synthesis and environmental applications. Green Chem. 2021, 23, 4931–4954. [Google Scholar] [CrossRef]
  22. Garg, M.; Rani, R.; Sharma, A.L.; Singh, S. White graphene quantum dots as electrochemical sensing platform for ferritin. Faraday Discuss. 2021, 227, 204–212. [Google Scholar] [CrossRef] [PubMed]
  23. Priya, C.; Sivasankari, G.; Narayanan, S.S. Electrochemical behavior of Azure A/gold nanoclusters modified electrode and its application as non-enzymatic hydrogen peroxide sensor. Colloids Surf. B Biointerfaces 2012, 97, 90–96. [Google Scholar] [CrossRef]
  24. Kalaivani, A.; Narayanan, S.S. Fabrication of CdSe quantum dots @ nickel hexacyanoferrate core-shell nanoparticles modified electrode for the electrocatalytic oxidation of hydrazine. J. Mater. Sci. Mater. Electron. 2018, 29, 20146–20155. [Google Scholar] [CrossRef]
  25. Sun, W.; Wang, D.; Li, G.; Zhai, Z.; Zhao, R.; Jiao, K. Direct electron transfer of hemoglobin in a CdS nanorods and Nafion composite film on carbon ionic liquid electrode. Electrochim. Acta 2008, 53, 8217–8221. [Google Scholar] [CrossRef]
  26. Sangeetha, N.S.; Narayanan, S.S. A novel bimediator amperometric sensor for electrocatalytic oxidation of gallic acid and reduction of hydrogen peroxide. Anal. Chim. Acta 2014, 828, 34–45. [Google Scholar] [CrossRef] [PubMed]
  27. Jeykumari, D.R.S.; Narayanan, S.S. A novel nanobiocomposite based glucose biosensor using neutral red functionalized carbon nanotubes. Biosens. Bioelectron. 2008, 23, 1404–1411. [Google Scholar] [CrossRef]
  28. Yao, H.; Li, N.; Xu, S.; Xu, J.Z.; Zhu, J.J.; Chen, H.Y. Electrochemical study of a new methylene blue/silicon oxide nanocomposition mediator and its application for stable biosensor of hydrogen peroxide. Biosens. Bioelectron. 2005, 2, 1372–1377. [Google Scholar] [CrossRef]
  29. Noorbakhsha, A.; Salimi, A. Amperometric detection of hydrogen peroxide at nano-nickel oxide/thionine and celestine blue nanocomposite-modified glassy carbon electrodes. Electrochim. Acta 2009, 54, 6312–6321. [Google Scholar] [CrossRef]
  30. Liu, X.; Zhang, H.; Ma, J.; Zheng, J. High performance of nitrite electrochemical sensing based on Au-poly(thionine)-tin oxide/graphene nanosheets nanocomposites. Colloids Surf. A Physicochem. Eng. Asp. 2022, 642, 128582. [Google Scholar] [CrossRef]
  31. Shahrokhian, S.; Asadian, E. Simultaneous voltammetric determination of ascorbic acid, acetaminophen and isoniazid using thionine immobilized multi-walled carbon nanotube modified carbon paste electrode. Electrochim. Acta 2010, 55, 666–672. [Google Scholar] [CrossRef]
  32. Kalaivani, A.; Narayanan, S.S. Simultaneous determination of adenine and guanine using cadmium selenide quantum dots-graphene oxide nanocomposite modified electrode. J. Nanosci. Nanotechnol. 2015, 15, 4697–4705. [Google Scholar] [CrossRef] [PubMed]
  33. Liu, S.; Wei, M.; Zheng, X.; Xu, S.; Zhou, C. Highly sensitive and selective sensing platform based on π–π interaction between tricyclic aromatic hydrocarbons with thionine-graphene composite. Anal. Chim. Acta 2014, 826, 21–27. [Google Scholar] [CrossRef] [PubMed]
  34. Liu, D.; Kamat, P.V. Dye-Capped Semiconductor Nanoclusters. One-Electron Reduction and Oxidation of Thionine and Cresyl Violet H-Aggregates Electrostatically Bound to SnO2 Colloids. Langmuir 1996, 12, 2190–2195. [Google Scholar] [CrossRef]
  35. Peng, J.J.; Liu, S.P.; Wang, L.; He, Y.Q. Studying the interaction between CdTe quantum dots and Nile blue by absorption, fluorescence and resonance Rayleigh scattering spectra Spectrochim. Acta Part A Mol. Biomol. Spectrosc. 2010, 75, 1571–1576. [Google Scholar] [CrossRef] [PubMed]
  36. Ding, Y.; Zhang, X.; Liu, X.; Guo, R. Adsorption Characteristics of Thionine on Gold Nanoparticles. Langmuir 2006, 22, 2292–2298. [Google Scholar] [CrossRef]
  37. Thomas, K.G.; Kamat, P.V. Chromophore-functionalized gold nanoparticles. Acc. Chem. Res. 2003, 36, 888–898. [Google Scholar] [CrossRef]
  38. Wang, Z.; Li, M.; Zhang, Y.; Yuan, J.; Shen, Y.; Niu, L.; Ivaska, A. Thionine-interlinked multi-walled carbon nanotube/gold nanoparticle composites. Carbon 2007, 45, 2111–2115. [Google Scholar] [CrossRef]
  39. Ruan, C.; Wang, W.; Gu, B. Single-molecule detection of thionine on aggregated gold nanoparticles by surface enhanced Raman scattering. J. Raman Spectrosc. 2007, 38, 568–573. [Google Scholar] [CrossRef]
  40. Thenmozhi, K.; Narayanan, S.S. Electrochemical sensor for H2O2 based on thionin immobilized 3-aminopropyltrimethoxy silane derived sol–gel thin film electrode. Sens. Actuators B Chem. 2007, 125, 195–201. [Google Scholar] [CrossRef]
  41. Yin, H.; Meng, X.; Xu, Z.; Chen, L.; Ai, S. Electrochemical behavior of phenacetin on CdSe microspheres modified glassy carbon electrode and its simultaneous determination with paracetamol and 4-aminophenol. Anal. Methods 2012, 4, 1445–1451. [Google Scholar] [CrossRef]
  42. Yin, H.; Zhou, Y.; Ai, S.; Chen, Q.; Zhu, X.; Liu, X.; Zhu, L. Sensitivity and selectivity determination of BPA in real water samples using PAMAM dendrimer and CoTe quantum dots modified glassy carbon electrode. J. Hazard. Mater. 2010, 174, 236–243. [Google Scholar] [CrossRef] [PubMed]
  43. Jeykumari, D.R.S.; Narayanan, S.S. Fabrication of bienzyme nanobiocomposite electrode using functionalized carbon nanotubes for biosensing applications. Biosens. Bioelectron. 2008, 23, 1686–1693. [Google Scholar] [CrossRef] [PubMed]
  44. Laviron, E. The use of linear potential sweep voltammetry and of a.c. voltammetry for the study of the surface electrochemical reaction of strongly adsorbed systems and of redox modified electrodes. J. Electroanal. Chem. Interf. Electrochem. 1979, 100, 263–270. [Google Scholar] [CrossRef]
  45. Papavasileiou, A.V.; Hoder, T.; Medek, T.; Prodromidis, M.I.; Hrbac, J. Sensitive riboflavin sensing using silver nanoparticles deposited onto screen-printed electrodes via controlled-energy spark discharges. Talanta 2023, 258, 124409. [Google Scholar] [CrossRef] [PubMed]
  46. Zribi, R.; Foti, A.; Donato, M.G.; Gucciardi, P.G.; Neri, G. Fabrication of a novel electrochemical sensor based on carbon cloth matrix functionalized with MoO3 and 2D-MoS2 layers for Riboflavin determination. Sensors 2021, 21, 1371. [Google Scholar] [CrossRef]
  47. Pereira, D.F.; Santana, E.R.; Spinelli, A. Electrochemical paper-based analytical devices containing magnetite nanoparticles for the determination of vitamins B2 and B6. Microchem. J. 2022, 179, 107588. [Google Scholar] [CrossRef]
  48. Martins, E.C.; Santana, E.R.; Spinelli, A. Nitrogen and sulfur co-doped graphene quantum dot-modified electrode for monitoring of multivitamins in energy drinks. Talanta 2023, 252, 123836. [Google Scholar] [CrossRef]
  49. Sedhu, N.; Kumar, J.J.; Sivaguru, P.; Raj, V. Electrochemical detection of riboflavin in pharmaceutical and food samples using in situ electropolymerized glycine coated pencil graphite electrode. J. Electroanal. Chem. 2023, 928, 117037. [Google Scholar] [CrossRef]
Figure 1. Absorption spectra of 150 µM TH in aqueous solution at different concentration CdSe QDs (µM): (a) 0, (b) 5.3, (c) 10.6, (d) 16, (e) 21.3, (f) 26.6, (g) 37.3, (h) 48, (i) 69.3, (j) 106.6.
Micro 03 00048 g001
Figure 2. Confocal Raman spectra of (a) TH (b) TH@CdSe QDs.
Micro 03 00048 g002
Figure 3. This HRTEM image of (a) CdSe QDs (b) TH@CdSe QDs.
Micro 03 00048 g003
Figure 4. Cyclic voltammograms of bare PIGE (a), CdSe QDs (b), TH (c) and TH@CdSe QDs-modified PIGEs (d) in 0.1 M NH4NO3; scan rate of 50 mV/s.
Micro 03 00048 g004
Figure 5. Cyclic voltammograms of the TH@CdSe QDs-modified PIGE in the presence of different supporting electrolytes (0.1 M) of (a) NH4NO3, (b) PBS, (c) KNO3, (d) NH4Cl, (e) NaCl, (f) KCl, (g) NaNO3, (h) Ba(NO3)2 and (i) BaCl2 at a scan rate of 50 mV/s.
Micro 03 00048 g005
Figure 6. (a) Cyclic voltammograms of TH@CdSe QDs modified PIGE at different scan rates in 0.1 M NH4NO3 from 2–100 mV/s (inner to outer). (b) Calibration plot of peak current vs scan rate.
Micro 03 00048 g006
Figure 7. (A) Cyclic voltammograms of (a) bare PIGE, (b) bare PIGE with 6.25 × 10⁻⁵ M RF, (c) TH@CdSe QDs-modified PIGE and (d) TH@CdSe QDs modified PIGE with 6.25 × 10⁻⁵ M RF in 0.1 M NH4NO3. [Scan rate: 50 mV/s]. (B) Calibration plot.
Micro 03 00048 g007
Scheme 1. Electrocatalytic reduction mechanism of RF at TH@CdSe QDs-modified PIGE.
Micro 03 00048 sch001
Figure 8. Effect of pH on the reduction of 1.6 × 10⁻⁵ M RF at TH@CdSe QDs-modified PIGE.
Micro 03 00048 g008
Figure 9. Hydrodynamic voltammograms for the TH@CdSe QDs-modified PIGE in the (a) absence and (b) presence of 3.2 × 10⁻⁵ M RF. [Stirring rate: 300 rpm].
Micro 03 00048 g009
Figure 10. (A) Amperometric response of the TH@CdSe QDs-modified PIGE for the successive additions of 1.6 × 10⁻⁵ M RF. [Stirring rate: 300 rpm; Operating potential: −0.6 V] (B) Calibration plot.
Micro 03 00048 g010
Table 1. Comparison of the performance of the proposed TH@CdSe QDs-modified PIGE with the reported methods.
ElectrodeElectrolyteLinear Range (μM)Detection Limit Ref.
Ag-sparked/SPEPBS0.0019–0.10.56 nM[45]
D-MoS2-MoO3-CC/SPCEPBS2.0–40.01.5 μM[46]
Fe3O4 NPs-ePADsBR buffer2.0–20.00.25 μM[47]
N,S-GQD-CS/GCEBR buffer0.001–8.00.30 μM[48]
PGI/PGEPBS0.002–0.451.24 nm[49]
TH coated CdSe QDsNH4NO30.16–14053 nMthis work
Table 2. Determination of RF in pharmaceutical tablets.
Sample No.Labeled Content
(Mg/Tablet)
Observed Content
(Mg/Tablet)
Recovery (%)
12524.999.6
2524.798.8
25049.899.6
5050.1100.2
Disclaimer/Publisher’s Note: The statements, opinions and data contained in all publications are solely those of the individual author(s) and contributor(s) and not of MDPI and/or the editor(s). MDPI and/or the editor(s) disclaim responsibility for any injury to people or property resulting from any ideas, methods, instructions or products referred to in the content.

