
The Influence of Fibre Cross Section Shape and Fibre Surface Roughness on Composite Micromechanics


Department of Mechanical and Aerospace Engineering, University of Strathclyde, 75 Montrose Street, Glasgow G1 1XJ, UK
Micro 2023, 3(1), 353-368; https://doi.org/10.3390/micro3010024
Submission received: 5 February 2023
/
Revised: 9 March 2023
/
Accepted: 13 March 2023
/
Published: 20 March 2023
(This article belongs to the Section Microscale Materials Science)
Abstract
:Many of the carbon and natural fibres used in composite reinforcement have a non-circular cross section. Recently non-circular, or flat, cross section glass fibre products have become commercially available. This paper explores the potential effects that such non-circular fibre cross section shapes may have on the micromechanics of stress transfer at the composite fibre–matrix interface and the resulting changes in composite strength performance. Analytical modelling is used to show how the critical fibre length in composites with non-circular fibres is always less when compared to circular fibres with an equal cross-sectional area. This can result in significant changes to the strength performance of discontinuous fibre reinforced composites. Additionally, it is shown that the surface roughness found on natural and carbon fibres, many of which are also non-circular in cross section, can decrease the critical fibre length still further. These effects have important consequences for the use of single fibre micromechanical tests used for the characterisation of interfacial strength.
1. Introduction
The development of the micromechanics of composite materials has played an important role in studying and understanding the performance of fibre-reinforced composites. Many of the concepts and equations developed to predict composite micromechanical performance have been developed early in the history of the development of fibre-reinforced composites and are unquestioningly embedded in the collective psyche of the composite community. One such concept is that of the role of length-to-diameter ratio (L/D), which is often found in micromechanical discussions of many composite performance parameters such as modulus, strength, and impact resistance [1,2,3]. This also leads on to the concept of critical fibre length (Lc), which is of particular use when considering the strength of composite materials. From a micromechanics viewpoint, the concept of critical fibre length plays an important role in many of the single fibre experimental techniques used for characterising the stress transfer capability of the fibre–matrix interface [4]. In particular, the values of interfacial shear strength (IFSS) obtained from the single fragmentation test are related directly to the value of Lc calculated from the experimental data [4,5,6].
Interestingly, many of the considerations of composite micromechanics make use of the assumption, or approximation, that the fibres under consideration have a circular cross section. This is understandable, since, at the time of the development of these concepts, most reinforcement fibres, such as glass fibres, often did have a predominantly circular cross section. However, recently there have been a number of developments from glass fibre manufacturers in the production of non-circular cross section glass fibres [7,8]. Furthermore, it is well known that many of the currently available carbon fibres do not have circular cross sections. Pioneering work on the manufacturing of noncircular carbon fibres was conducted by Edie et al. [9,10]. They discussed the development of trilobal and octolobal carbon fibres. Such fibres exhibited a higher tensile modulus and strength than those of circular ones; however, the mechanical properties of a composite made of these fibres were not investigated in their studies. Currently, carbon fibre cross section shape effects on composite performance continues to be a subject of active research [11,12,13,14,15]. Nevertheless, the majority of these papers focus on effects of unidirectional reinforced carbon fibre composites with high fibre volume fractions, since this continues to be the main type of polymer composite produced with carbon fibres. More recently, there has also been an upsurge in interest in the use of natural fibres as a composite reinforcement with a better sustainability profile than many man-made fibres such as carbon, glass, or basalt fibres [16,17,18,19,20]. These natural fibres bring many different fibre cross section shapes into the equation for consideration [21,22,23,24,25,26,27,28]. Consequently, non-circular cross section fibres are now widely available and used in many composite applications. This prompts the question as to whether all of the micromechanical analysis that we know and love is fully compatible with the reinforcement potential of these non-circular fibres. In a recent series of papers, we noted how the commonly used assumption of circularity in determining the cross-sectional area of natural fibres could lead to large errors in the values obtained for fibre strength [27,28].
In this paper, we consider the effect of non-circularity on the micromechanical stress transfer capability at the fibre–matrix interface and its potential effects on composite performance and the determination of interface strength. The work starts with flat glass fibres, where models and hypothesis are developed which offer an explanation to the limited data in the literature, which shows that flat glass fibres deliver higher tensile strength in injection moulded thermoplastic composites. The explanation hinges around the stress transfer capability of the fibre–matrix interface in polymer composites. Carbon fibres and natural fibres are another two fibre reinforcement forms, which are extremely important in polymer composite applications. Extended consideration of the non-circular fibre cross section shape of these two fibre types shows that there are also important implications for the interface in natural fibre and carbon fibre composites. These implication have, for the most part, been seriously overlooked in the literature, and, unfortunately, mean that some of the existing literature on interface phenomena in such composites may contain questionable conclusions.
2. Non-Circular Cross Section Glass Fibres
Glass fibre has been particularly successful as the reinforcement of choice in the rapidly expanding fibre reinforced polymer composites market. Today, glass fibre products account for more than 95% of fibre reinforcements used in the composites industry, primarily due to their highly attractive performance-to-price ratio. Since the development of the mass production of glass fibres at Owens Corning in the 1930s, glass fibre cross-sectional geometry has remained almost exclusively circular. Gallucci et al. briefly reported on the effect of experimental bilobal and trilobal fibres from Owens Corning on the properties of fibre-reinforced PBT [29]. They reported a reduction in the composite warpage of 20% to 50% when using non-circular glass fibres with equivalent cross section area as circular fibres. Further analysis showed only small variations in other mechanical properties, no significant differences in residual fibre length, and no major differences in fibre orientation. This short report was probably related to a patent that describes a design of bushing plate for the production of such non-circular fibres [30].
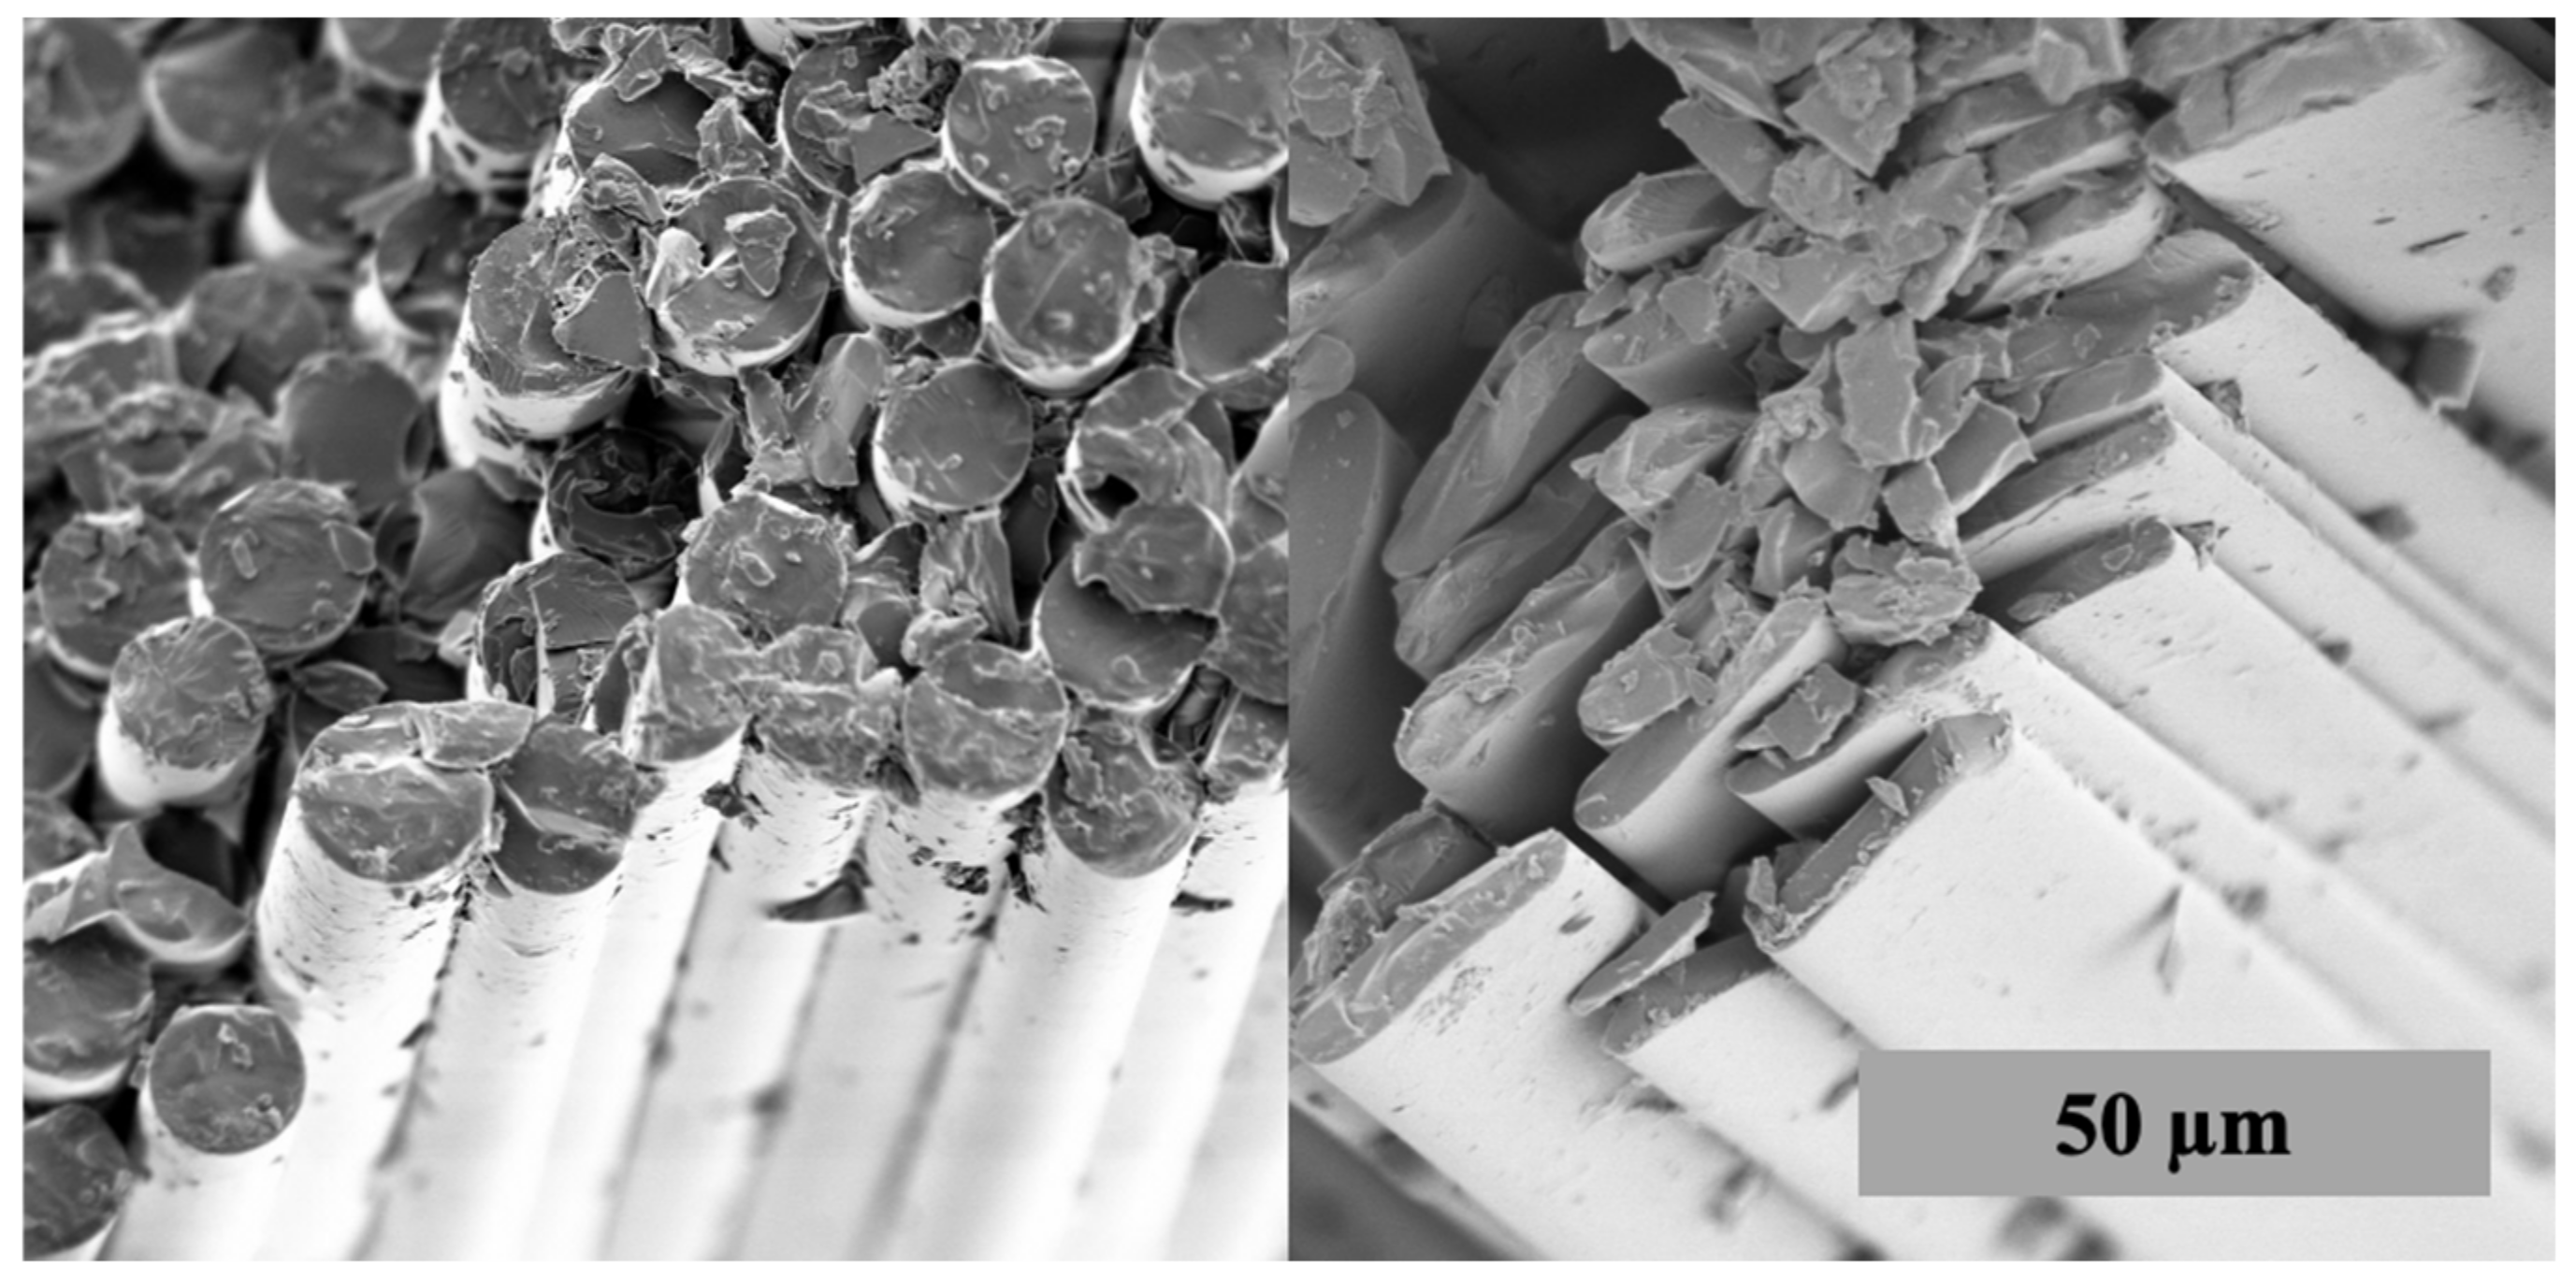
Many other glass fibre manufacturers have also issued patents on bushing plate design for the production of non-circular cross-section glass fibres. More recently these same manufacturers have also made composite reinforcement products based on “flat” fibres available [31,32,33]. Figure 1 shows an SEM comparison of the traditional circular cross section glass fibres with the more recent flat cross section glass fibres. The typical geometry of such flat fibres which can be described as a flattened oval or an edge-rounded rectangular cross section with a “flatness” (K) defined as the ratio of major axis (2a) to minor axis (2b) where the thin edge of the flat fibre has radius b. Commercial flat fibre products have a flatness in the range of 2–4, with K = 4 being the most common [31,32,33]. It is notable that the currently available flat glass fibre products are all chopped fibre products for use in extrusion/injection moulding of short fibre-reinforced composites.
Despite the availability of flat glass fibres for some years, there have been very few published studies of the properties of flat glass fibres and their composites. An extensive search has only turned up five journal papers where the performance of flat glass fibre-reinforced composites has been reported. In an early study, Deng et al. investigated the performance of unidirectional continuous fibre-reinforced epoxy laminates containing circular or flat glass fibres [34,35]. The flat fibres had a flatness value of K = 4 and a cross section area equivalent to that of the 13 µm diameter circular fibres. Their results over a range of mechanical tests showed little significant differences between the performance of the laminates containing the different glass fibres. Tanaka et al. compared circular and flat glass fibre performance of injection moulded long fibre polypropylene composites [36]. The flat fibres had a flatness value of K = 4 and a cross section area equivalent to that of the 17 µm diameter circular fibres. Over the fibre weight range of 20–50%, the flat fibre gave consistently lower melt shear viscosity and longer average residual fibre lengths in the moulded composites. Unnotched Charpy impact performance was also consistently higher for flat fibre composites especially at higher fibre contents where circular fibres showed a decreasing performance with increasing fibre content. In a Korean language paper, Heo et al. reported on the performance of injection moulded short fibre polyphenylene sulphide composites containing circular or flat glass fibres [37]. The flat fibres had a flatness value of K = 4 and a cross section area equivalent to that of the 15 µm diameter circular fibres. They found that the tensile strength of flat fibre composites was greater (up to +20%) at all weight fractions investigated (30–70%) [37]. The average residual fibre lengths in the moulded composites were consistently higher for the flat fibre composites over this fibre content range. Notched Izod impact performance was also consistently higher for flat fibre composites especially at higher fibre contents where circular fibres also showed a decreasing performance with increasing fibre content. In another Korean language paper from the same research group, Kim et al. reported on the properties of injection moulded short fibre polyethylene terephthalate composites containing the same two glass fibre types [38]. Their results were later published in an English language paper [39]. Similar to the previous paper, they found higher composite tensile strength for the flat fibre composites over a 15–45% fibre weight fraction range. However, in this case, there was no significant differences in the impact performance of the flat and circular fibre-reinforced composites.
3. Critical Fibre Length
The micromechanical understanding of the strength performance of injection moulded discontinuous fibre-reinforced composites is inexorably linked to the concept of critical fibre length. Thomason has pointed out that it is possible to define a number of “critical” fibre lengths for discontinuous fibre-reinforced composites depending on whether modulus, strength, or impact performance is under consideration [40]. However, the most common usage of critical fibre length refers to the term in the Kelly–Tyson equation for the calculation of the strength of discontinuous fibre-reinforced composites. Considering a single fibre composite, where the fibre modulus is much greater than the matrix modulus, the external load is transferred across the fibre–matrix interface by shear stress (τ) to the load bearing fibre. The classic approach to defining critical fibre length (Lc) involves balancing the peak tensile stress (σf) transferred to a discontinuous fibre through the shear force (τ) at the interface [4,41,42,43]. For a fibre with cross sectional area (Ao) and perimeter (Po), we obtain:
For the simple geometry of a circular cross section fibre with diameter (D)
Substituting into Equation (1) results in the well-known definition of Lc as
If we now consider the case of a flat fibre with circular edges and an equivalent cross-sectional area to a circular fibre (Ao) with diameter (D), this has a cross sectional area Af = Ao. It can be shown [42] that since a = Kb then the perimeter (Pf) of the flat fibre is given by
Hence, the area-to-perimeter ratio of a flat fibre in terms of the area-to-perimeter ratio of an equivalent cross section area circular fibre is given by
Consequently, the critical fibre length for a flat fibre with an equal cross section, fibre strength, and interfacial strength is given by
For an elliptical cross section fibre, with major axis (2a) and minor axis (2b), a similar procedure for calculating the change in Lc from a circular fibre of the same cross sectional area may be followed. Unfortunately, there is no formula to calculate the exact perimeter of an ellipse (Pe), but it can be approximated by
Considering the equations for the area of the circular and elliptical fibre, it can be shown that the circular fibre perimeter can be expressed as
and, hence,
Consequently, the area-to-perimeter ratio of an elliptical fibre in terms of the area-to-perimeter ratio of an equivalent cross section area circular fibre is given by
Finally, the critical fibre length for an elliptical shaped fibre with equal cross section, fibre strength, and interfacial strength to a circular cross section fibre is given by
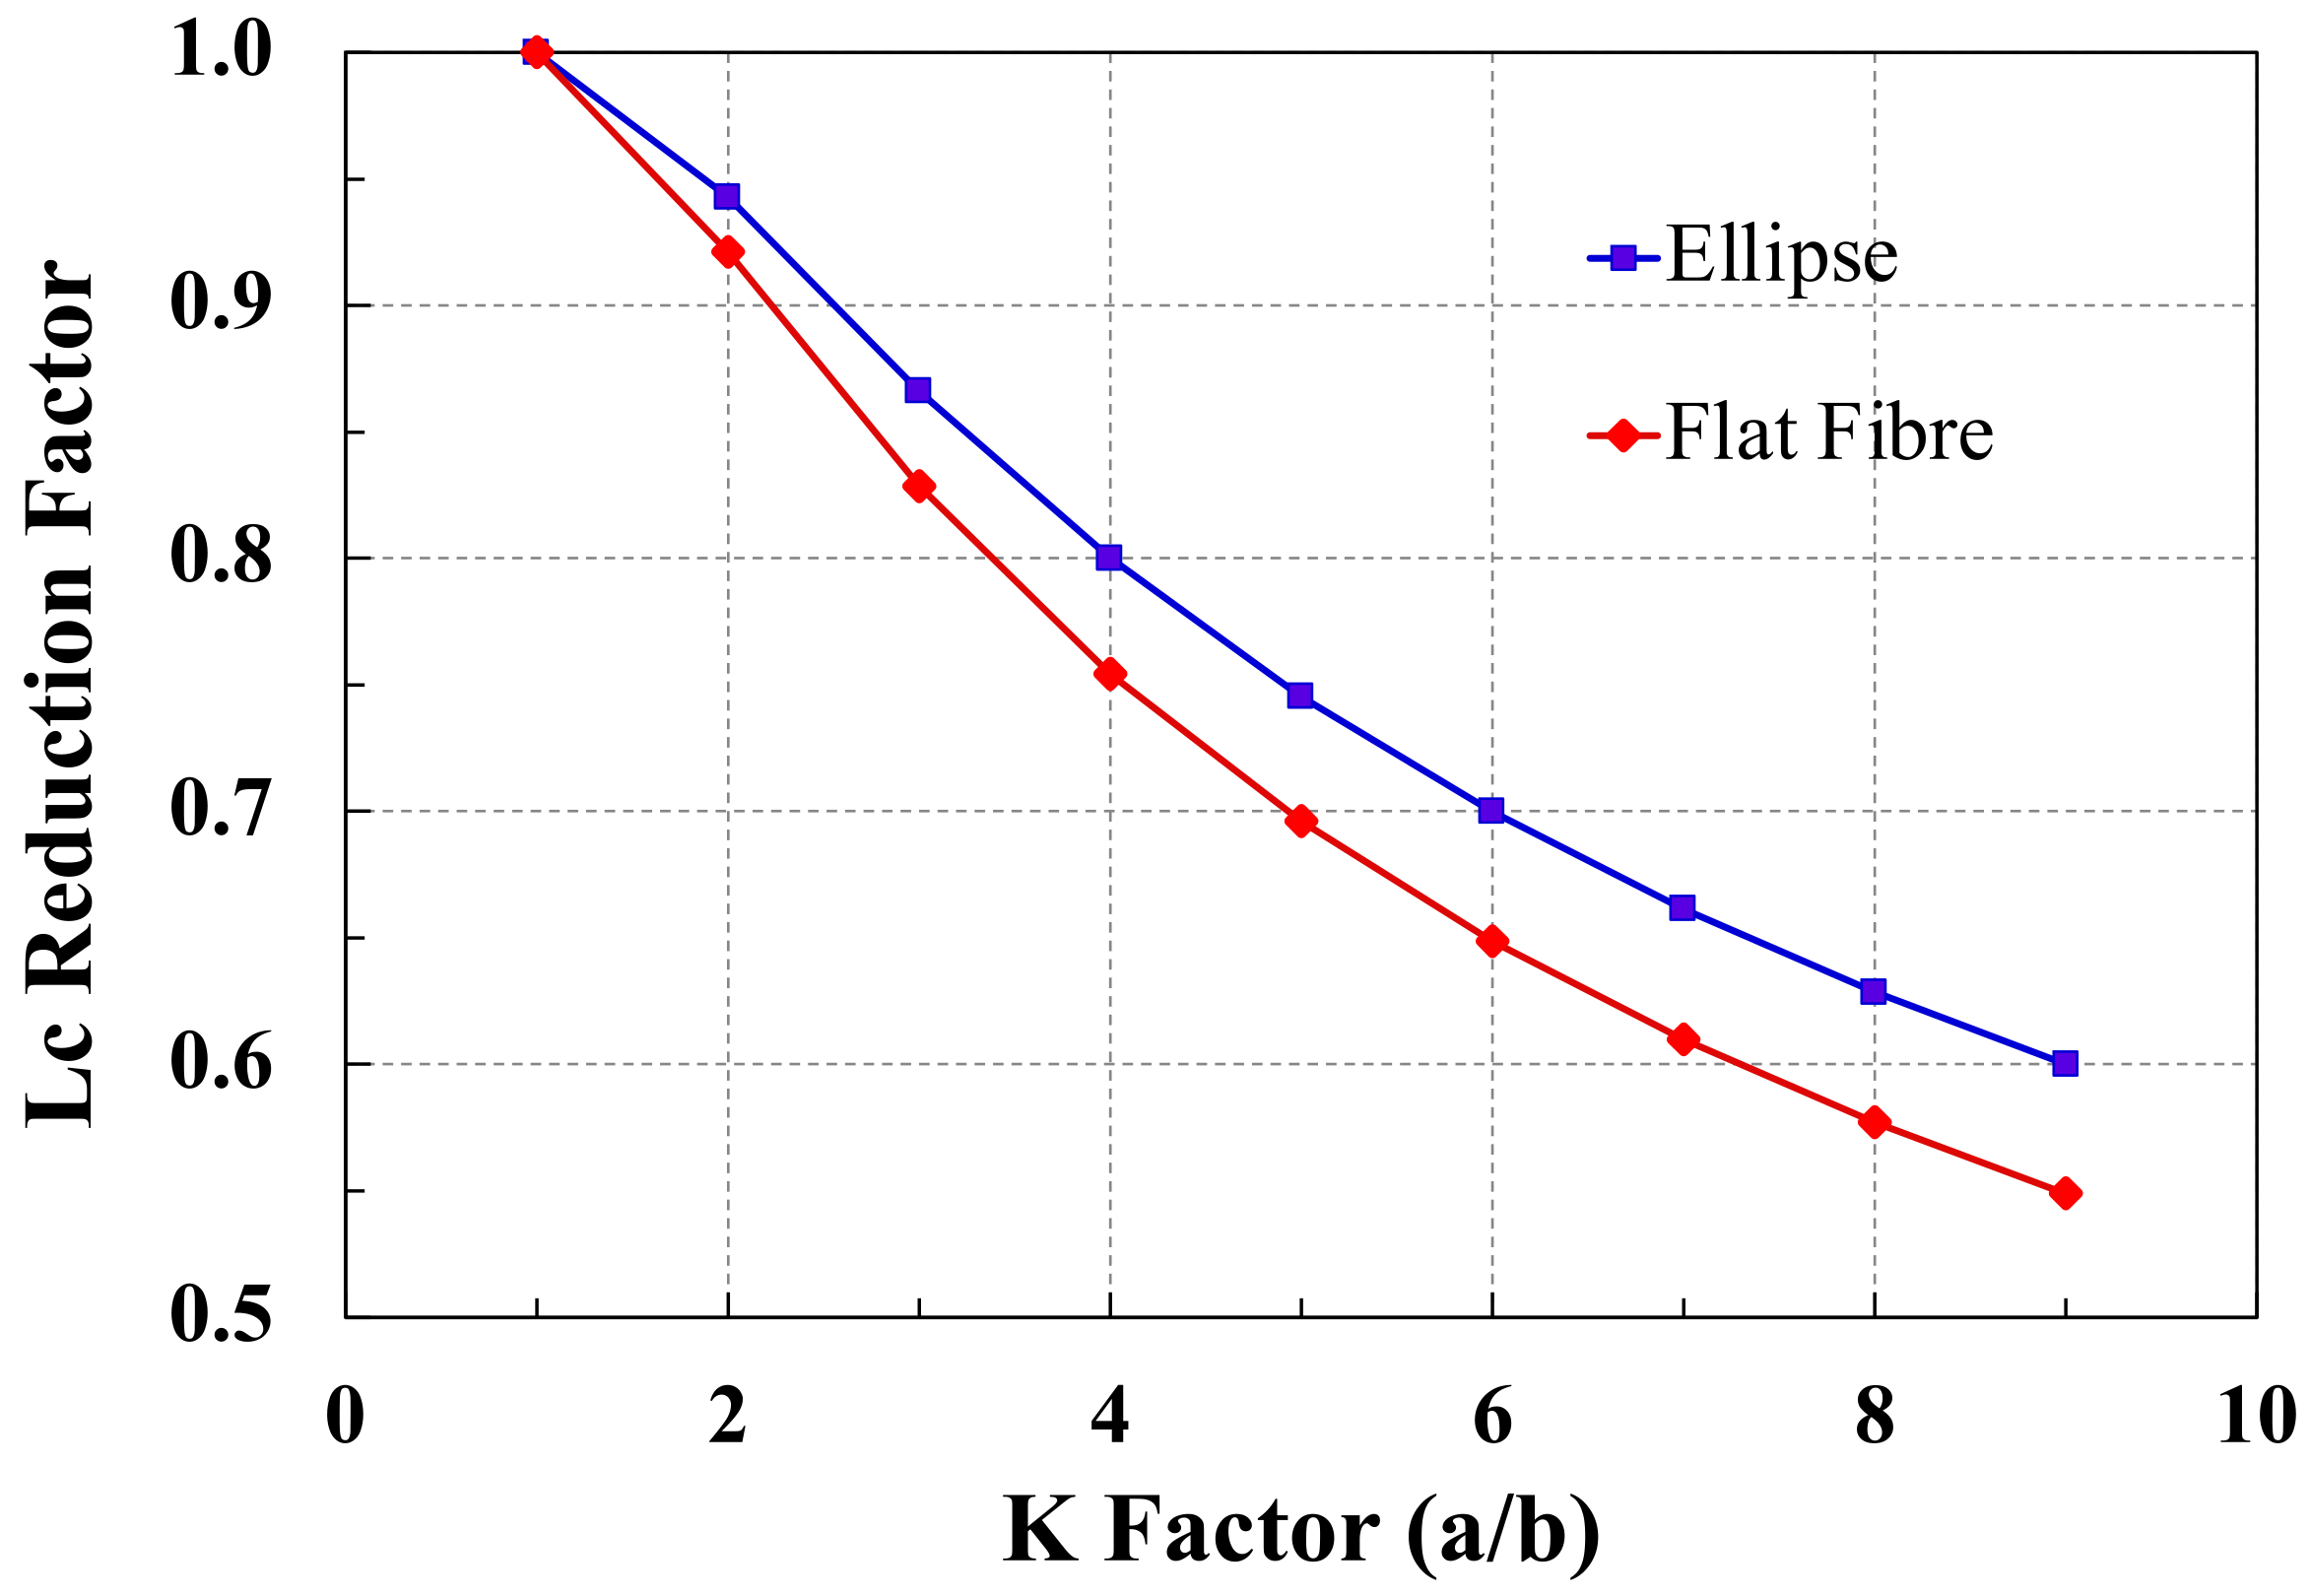
Figure 2 shows values obtained from Equations (5) and (10) for the Cf and Ce parameters for fibres with various degrees of flatness parameter K. It can be seen that Cf decreases as the flatness of the fibre cross section increases. Moreover, the values of Cf and Ce are less than unity for all values of K. Consequently, it appears that the critical fibre length for flat or elliptical cross section fibres is always smaller than that of a circular cross section fibre of equal area, strength and interfacial strength.
4. Composite Strength Effects
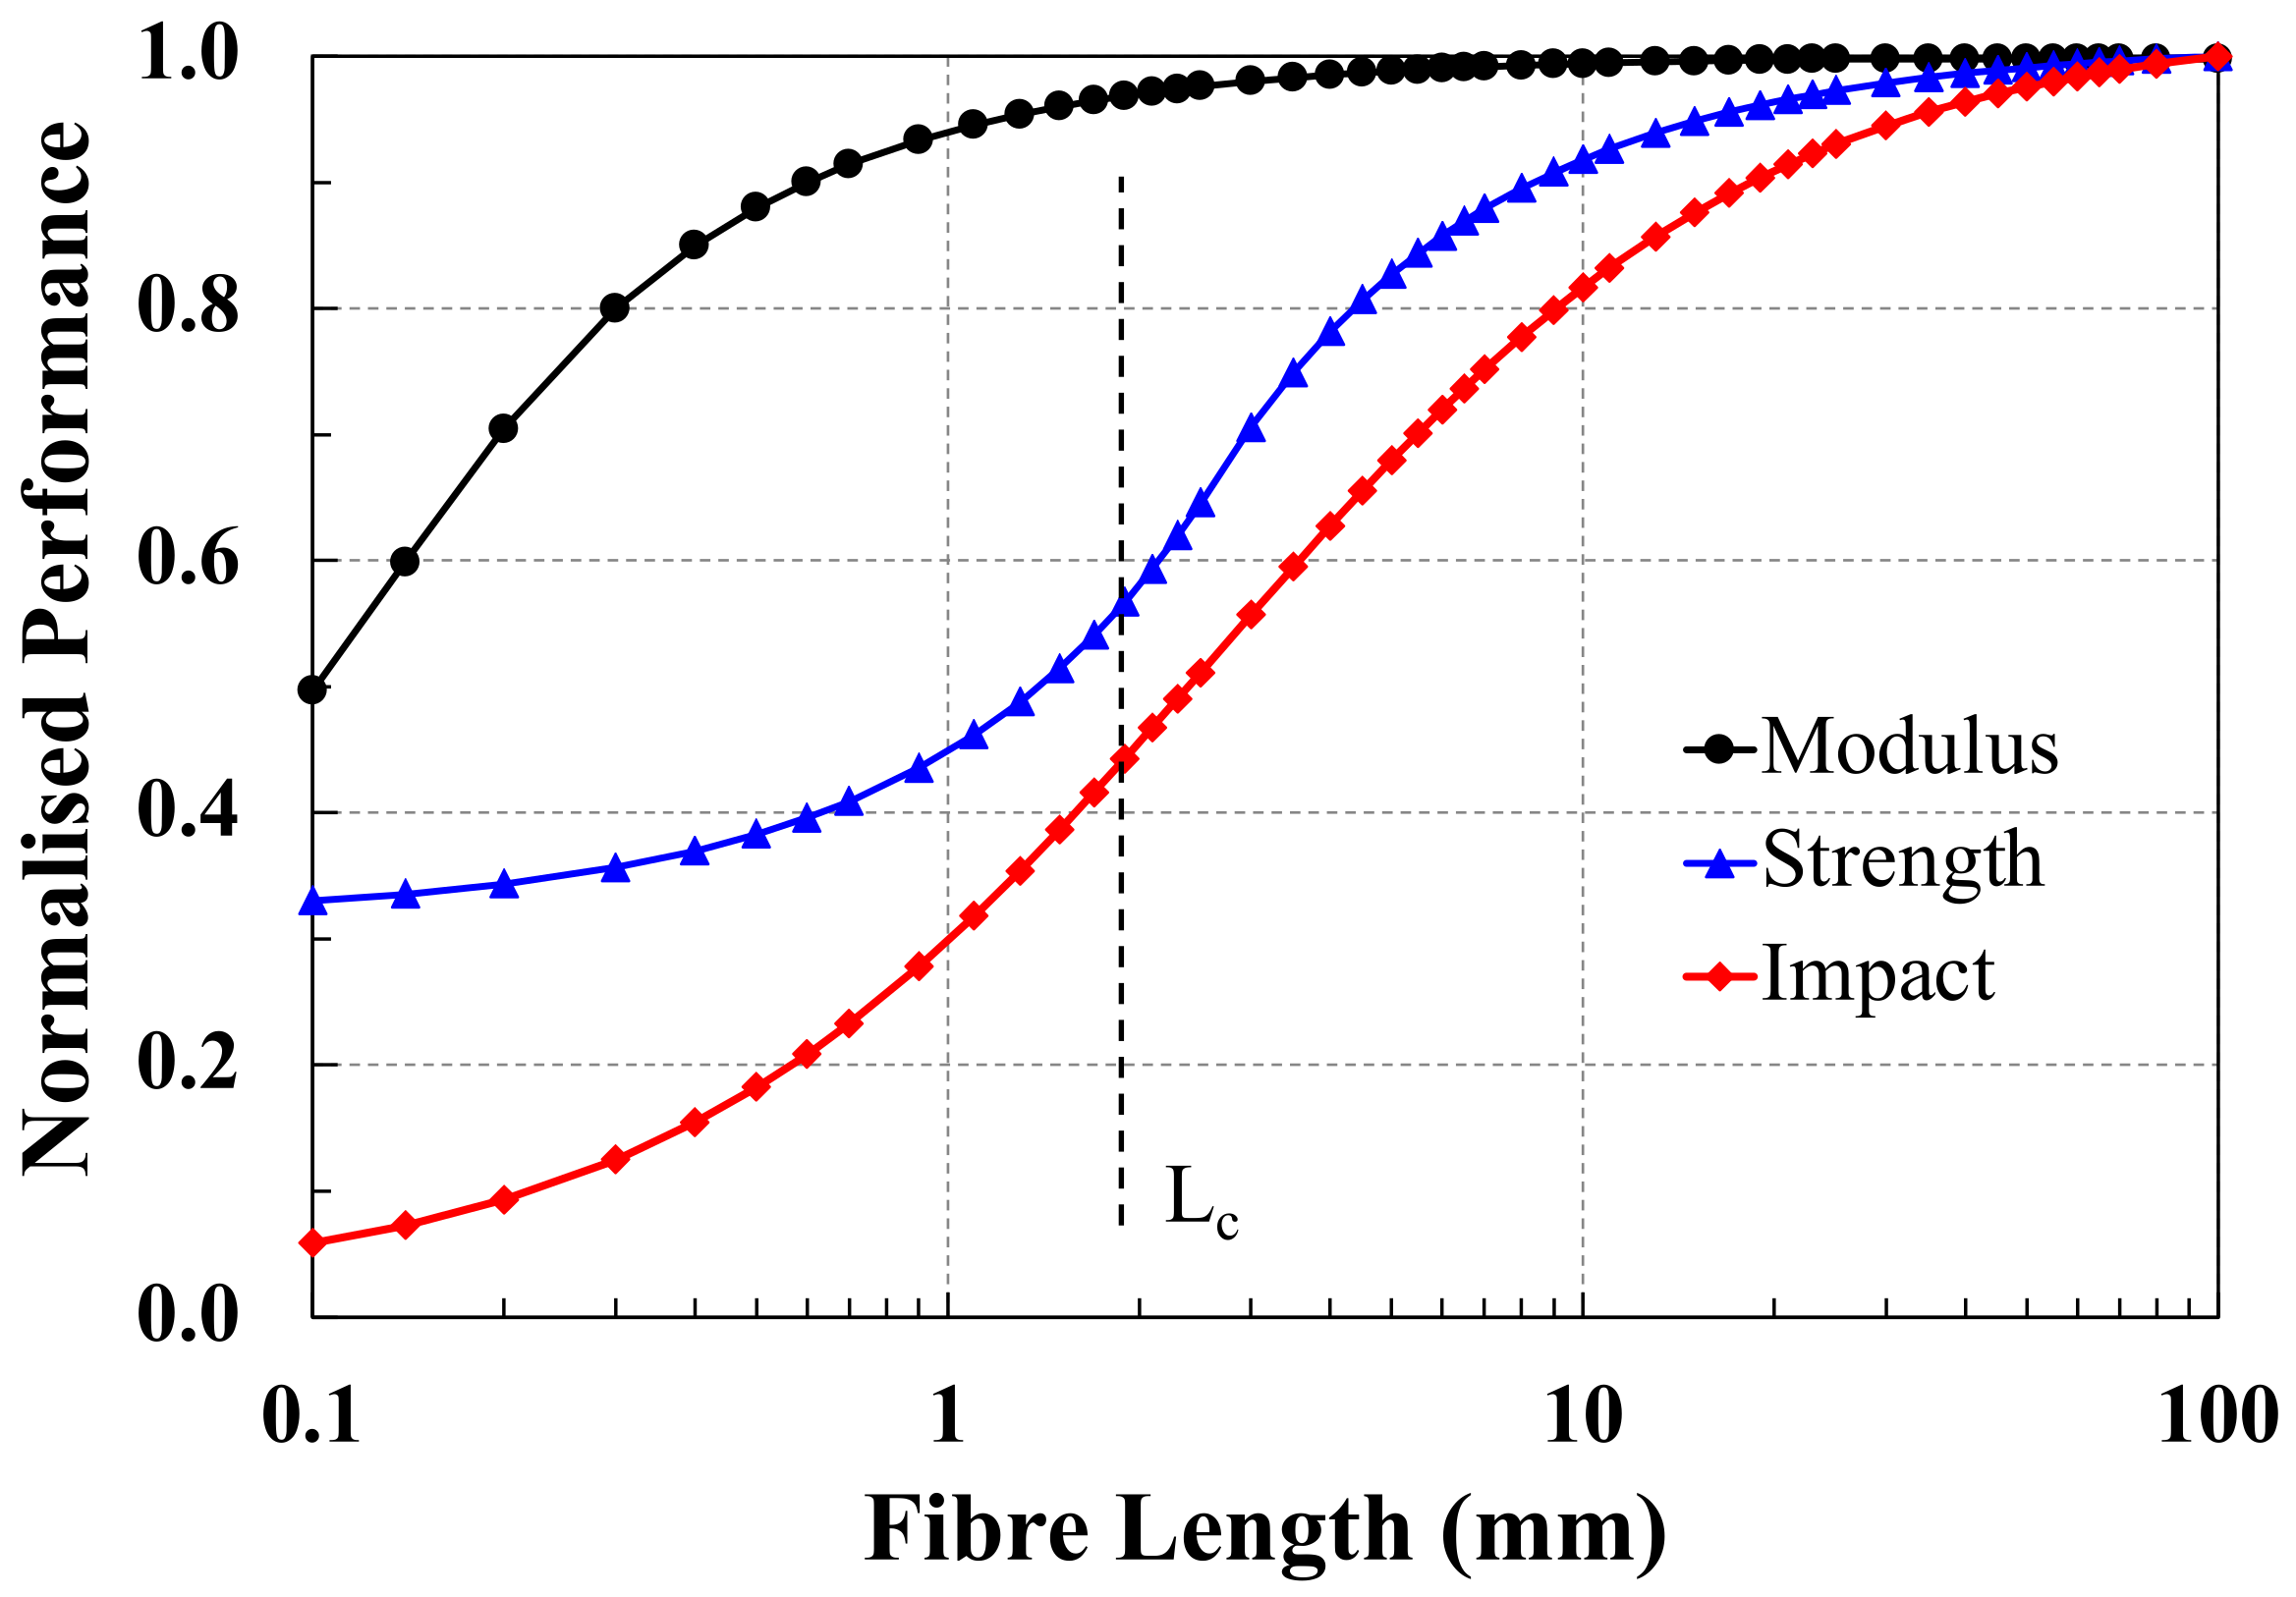
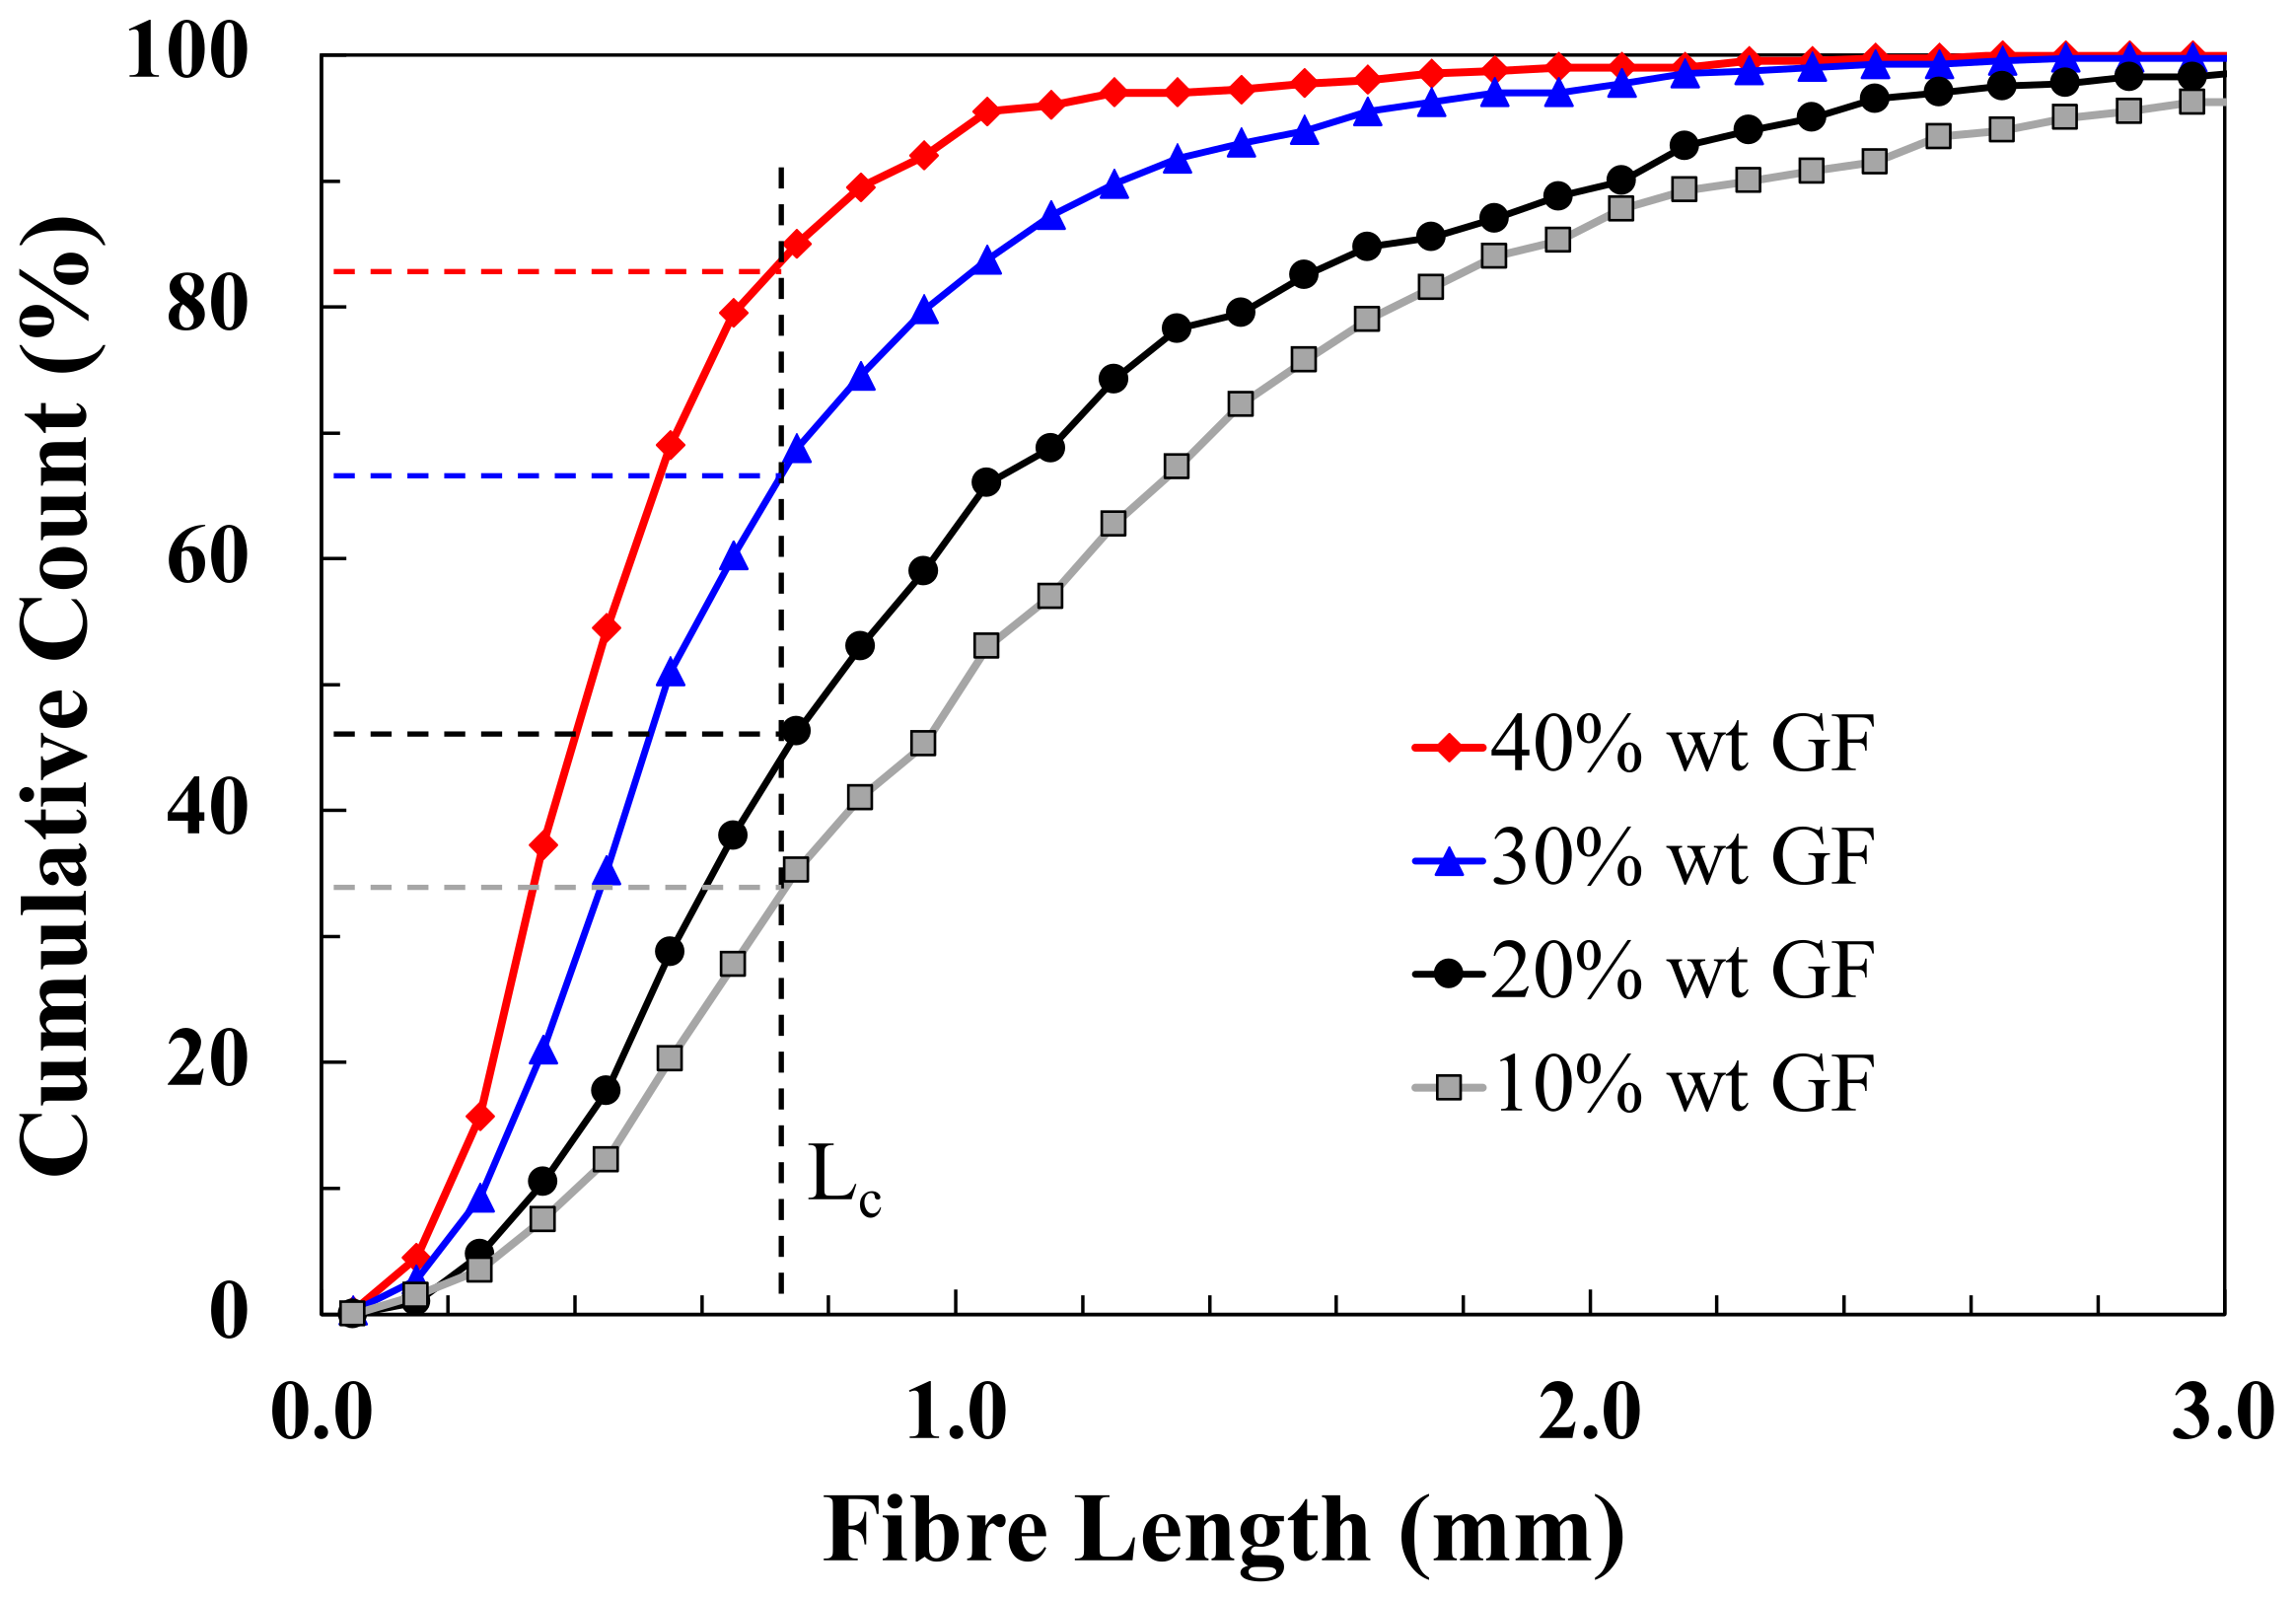
One composite application where the concept of critical fibre length is very commonly applied is that of discontinuous fibre-reinforced composites and, most often, those short fibre thermoplastics (SFT) and long fibre thermoplastics (LFT) processed by injection moulding. Thomason has discussed in detail the role of Lc on the performance of these composites, and Figure 3 shows a summary of how the performance characteristics of composite modulus, strength, and notched impact in relation to the fibre length of a unidirectional discontinuous glass fibre-reinforced polypropylene [1,2,3,40]. Each of these properties has been normalised to the value predicted for continuous reinforcement length and so all values in Figure 3 fall in the range 0–1. It is important to note that, for the Kelly–Tyson form of critical fibre length, the fibre contribution to the composite strength has only reached 50% of the maximum fibre contribution at Lc. To attain greater than 90% of the maximum theoretical strength would require using fibres with length >5 Lc. In a similar vein, to attain 90% of the maximum notched impact in this system, it would require a fibre length >10 Lc. Furthermore, the results shown in Figure 3 were generated for single values of fibre length; however, in real injection moulded SFT and LFT, there is usually a very broad range of fibre lengths present. Figure 4 shows some actual fibre length distributions obtained from injection moulded short glass fibre-reinforced polypropylene composites with different fibre contents [40]. It can be seen that a significant proportion of the fibres in such composites are shorter than Lc and that the proportion of sub-critical fibres increase with increasing composite fibre content.
The effects of these differences in Lc on composite strength can be modelled using micromechanical methods such as the Kelly–Tyson equation for the prediction of the strength (σuc) of a composite reinforced with discrete aligned fibres [4,40,41,42,43]. This model is well known and can be expressed as σuc = ηo (X + Y) + Z, where Z is the matrix contribution, X is the sub-critical fibre contribution, and Y is the super critical contribution, in reference to the critical fibre length defined by Equation (1). Although the model was originally developed for aligned discontinuous fibre composites (ηo = 1), it is often presented with an additional average fibre orientation factor (ηo) when used for the performance of injection moulded composites.
By considering the previous discussion on the effect of fibre cross section shape on the critical fibre length, it is relatively simple to show that Equation (12) should be modified to account for the cross-section shape factor (C) to give
where the sub-critical and super-critical fibre lengths are now defined with respect to the modified values of Lc (Equation (6) or (11)). It can easily be seen that if C is always less than unity for non-circular cross section fibres, then Equation (13) will always give a higher predicted value of stress than Equation (12).
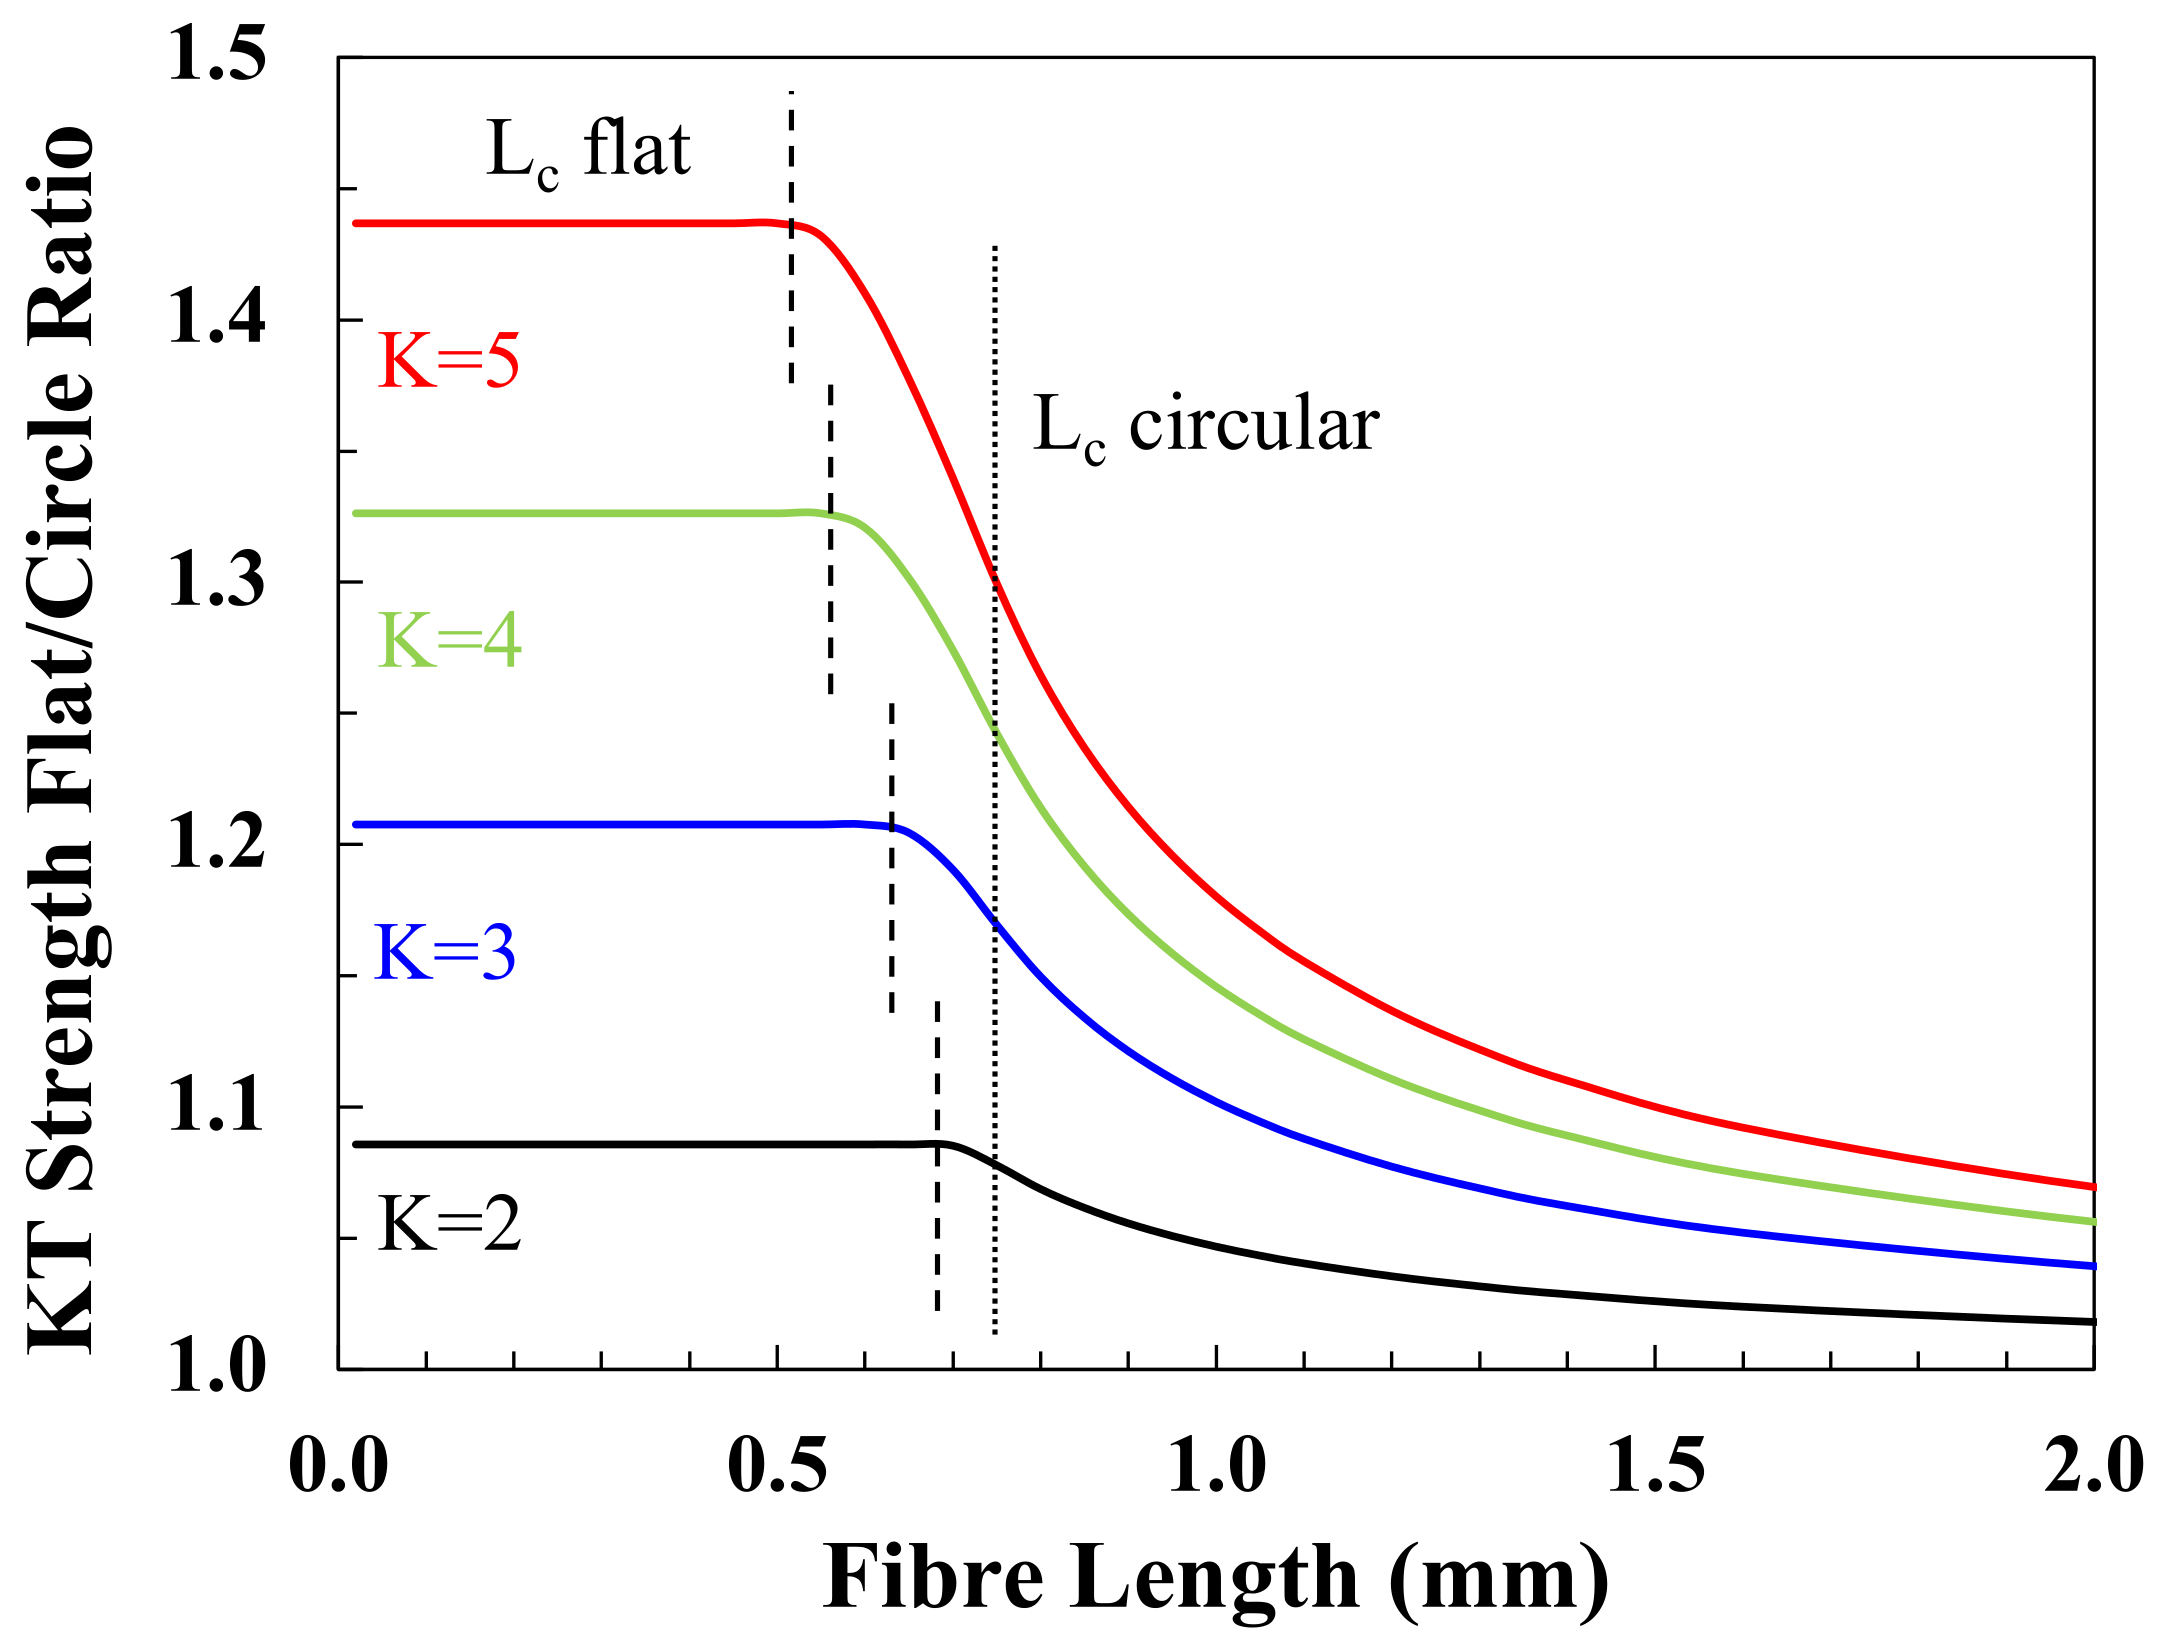
Figure 5 compares the prediction of the Kelly–Tyson Equation (12) for circular glass fibres and modified Kelly–Tyson Equation (13) for flat glass fibres for the fibre contribution (X + Y) to the strength of unidirectional reinforced polypropylene as a function of the fibre length for different fibre weight fractions. The input parameters used were fibre flatness K = 4, τ = 16.2 MPa (homopolymer PP with 2% added polymeric coupling agent), σf = 1.8 GPa, and circular fibre diameter D = 13.6 µm [40,43]. It can be seen that the flat fibre composites have a consistently higher fibre contribution to their strength over the entire fibre length range. The higher strength contribution for flat fibres is also greater as the fibre content increases. The ratio of flat fibre strength contribution to circular fibre strength contribution is equal at all fibre contents, and the ratio of the two is shown in Figure 6 as a function of fibre length for different values of flatness (K). The flat fibre advantage, for the fibre contribution to composite strength, is a constant maximum for fibre lengths shorter than the flat critical fibre length (Equation (6)). Note that the flat critical fibre length decreases as K increases. The flat fibre strength advantage also increases in proportion to the value of K. For the typical K = 4 value of commercially available flat glass fibres, this means an apparent 33% greater contribution to composite strength for all fibres shorter that flat critical fibre length. For fibre lengths greater than the flat fibre Lcf, the strength advantage decreases from the maximum value and tends to a value of unity as the fibres become much longer. This is understandable as the fibre strength contribution will tend towards that of continuous fibres, and this is assumed to be equal for all values of K in the analysis.
A somewhat similar approach was used by Greenveld and Wagner when calculating the effect of the more complex cross sectional shapes of nanotube reinforcements on their critical fibre length [44]. They also presented an analysis of the influence of reinforcement fibre perimeter and area on the critical fibre length. They also modelled the effect of different nanoreinforcement shapes on the strength of composites using the X, Y, and Z components of the Kelly–Tyson equation considering the two cases of the fibre length being either above or below Lc. With fibre lengths shorter than Lc, they found that a thin wall ribbon shape filler, such as graphene, improved the reinforcement contribution to composite strength by a factor of two over that of a thin walled hollow filler of arbitrary shape. Similar to the results in Figure 6, they noted that this was due to the doubling of the interfacial area. For filler lengths greater than Lc, they also noted that the maximum strength contribution, in both cases, tended towards the simple rule of mixtures for continuous reinforcement and, hence, the difference in the strength contributions of different shape fillers disappear (assuming they have the same ultimate strength), as also shown in Figure 6.
For a prediction of the flat fibre effect in real composites, Equations (12) and (13) indicate that the matrix contribution, the average fibre orientation parameter, and the fibre length distribution must also be taken into account. Figure 7 shows the flat fibre (K = 4) strength advantage predictions for injection moulded glass reinforced polypropylene composites as a function of fibre length. The data in this Figure now include the effect of the matrix contribution to the composite strength and an average orientation parameter of ηo = 0.69 (typical for these injection moulded short fibre composites [43]) to the K-T model predictions. It can be seen that the flat fibre advantage is now dependent on the fibre content and decreases with decreasing fibre content. This is due to the fact that the matrix contribution to both flat and circular fibre-reinforced composites is equal and proportionally greater as the fibre content of the composites is decreased. Most interestingly, the data in Figure 7 now predicts that the flat fibre advantage is a maximum at the flat fibre Lcf for any fibre content.
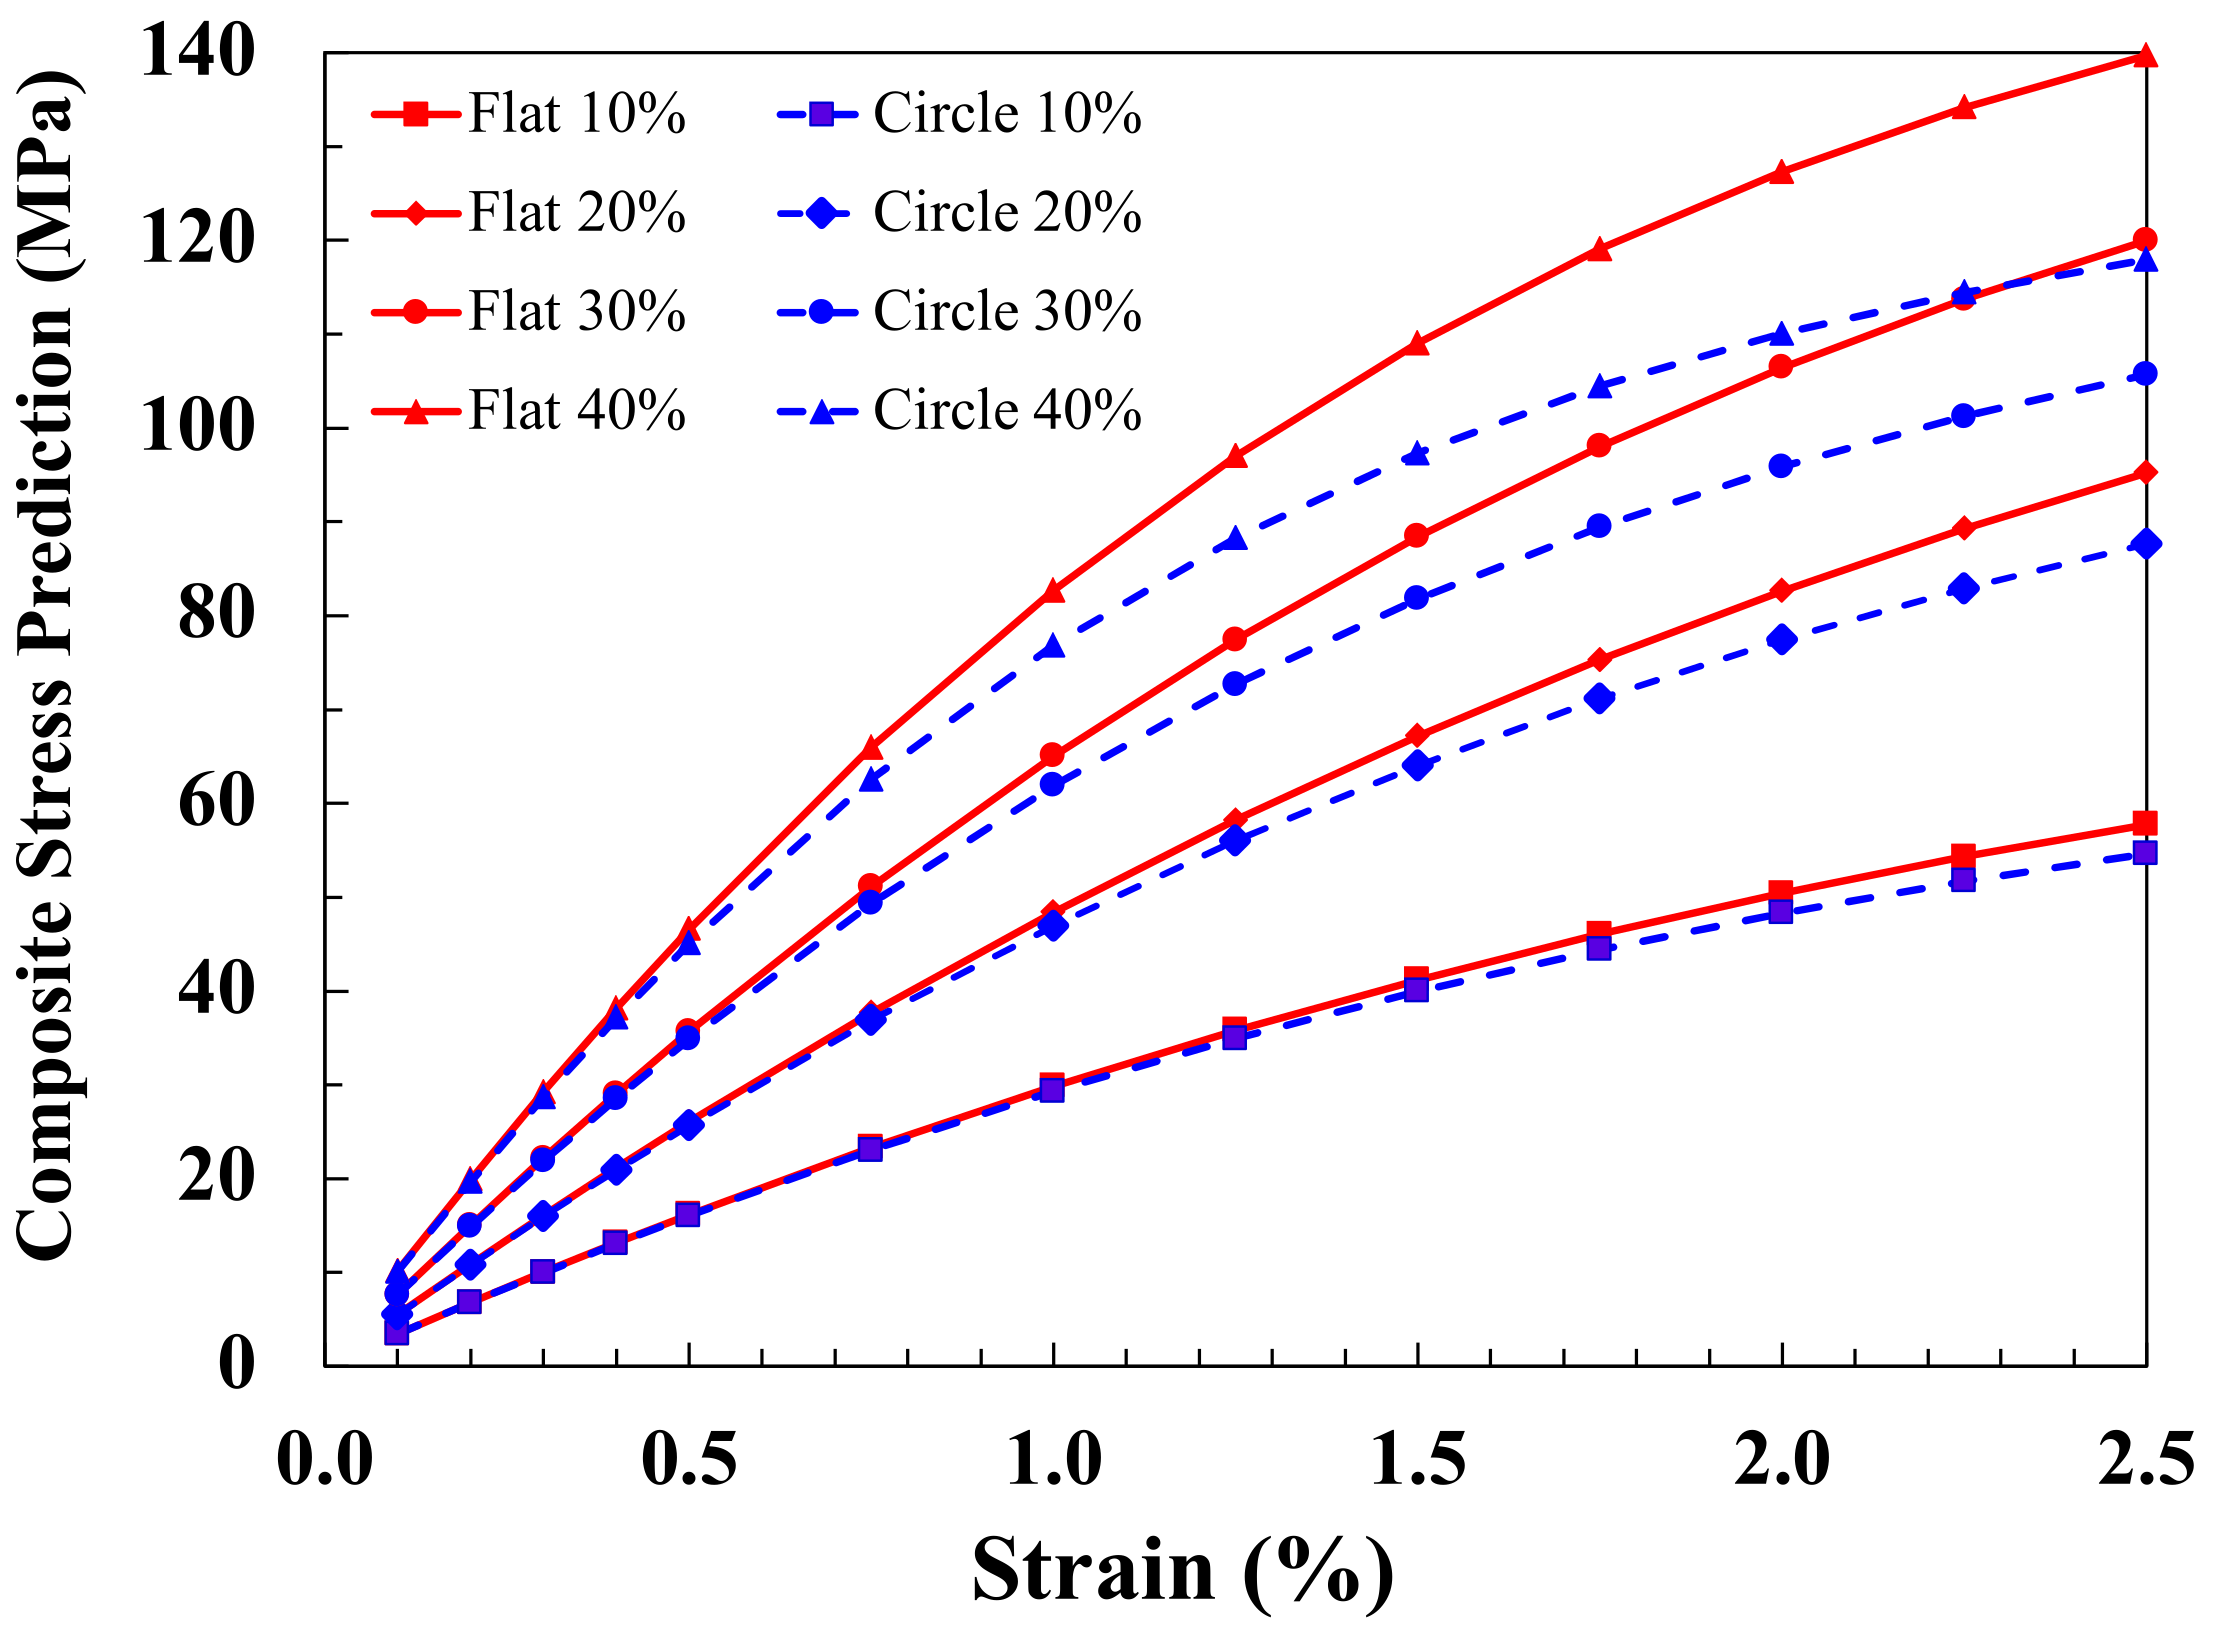
Thomason has reported the fibre length distribution in real injection moulded short glass fibre-reinforced polypropylene for a range of fibre weight fractions [43]. These distributions have been used to calculate composite strength values for both flat and circular fibre composites, and the ratio of the predicted stress–strain relationships are shown in Figure 8 for four different fibre weight fractions. It should be noted that the assumption here is that both flat and circular fibres have the same fibre length distribution. Typical non-linear stress–strain curves are predicted for all composites. Nevertheless, it can be seen that the flat fibre composites are always at higher stress levels for any fixed strain value, and this difference increases with increasing strain and increasing fibre content.
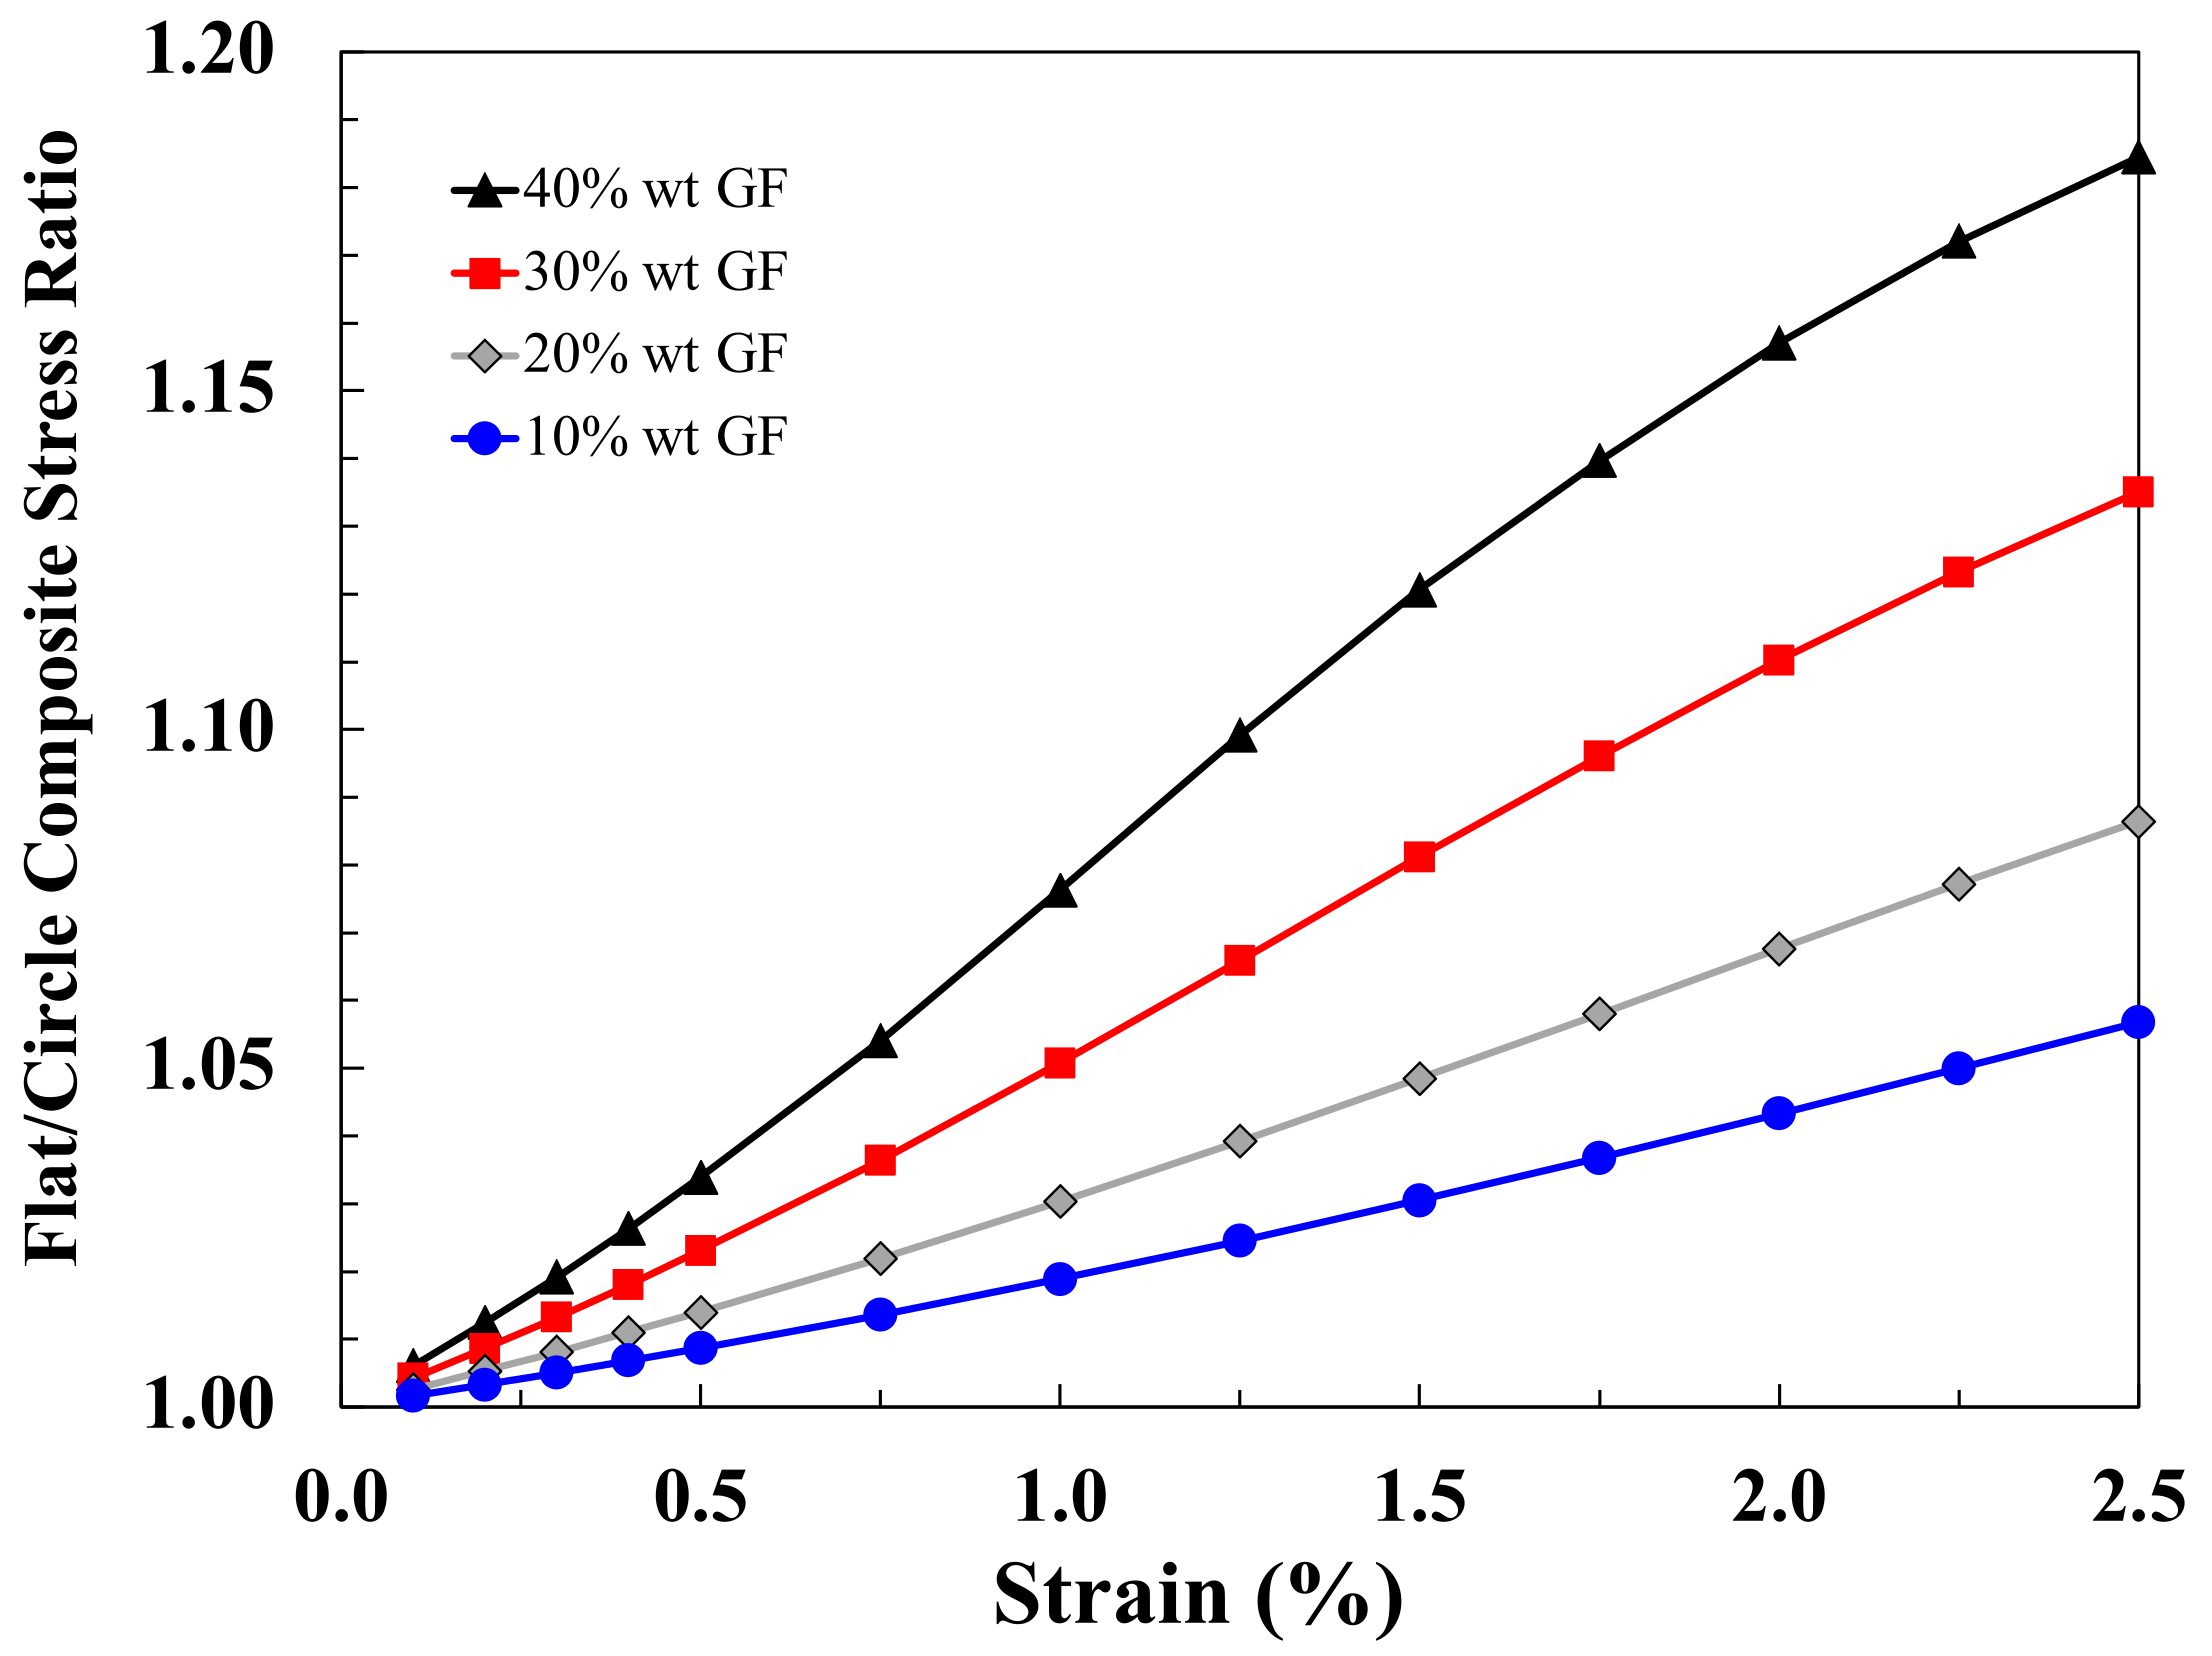
This is illustrated clearly in Figure 9, which shows the ratio of the composite stress levels of the two composite types at different strain values. The final flat fibre strength advantage over circular fibres will lie somewhere on the lines shown in Figure 9. The actual value will depend on what the strain to failure is for these composites. For circular fibres, Thomason reported values in the range 2.3–3.3% [43], which would result in a predicted strength advantage for injected moulded short flat glass fibre-reinforced polypropylene of approximately 12–20% for typical moulding compound fibre contents in the 30–40% by weight range.
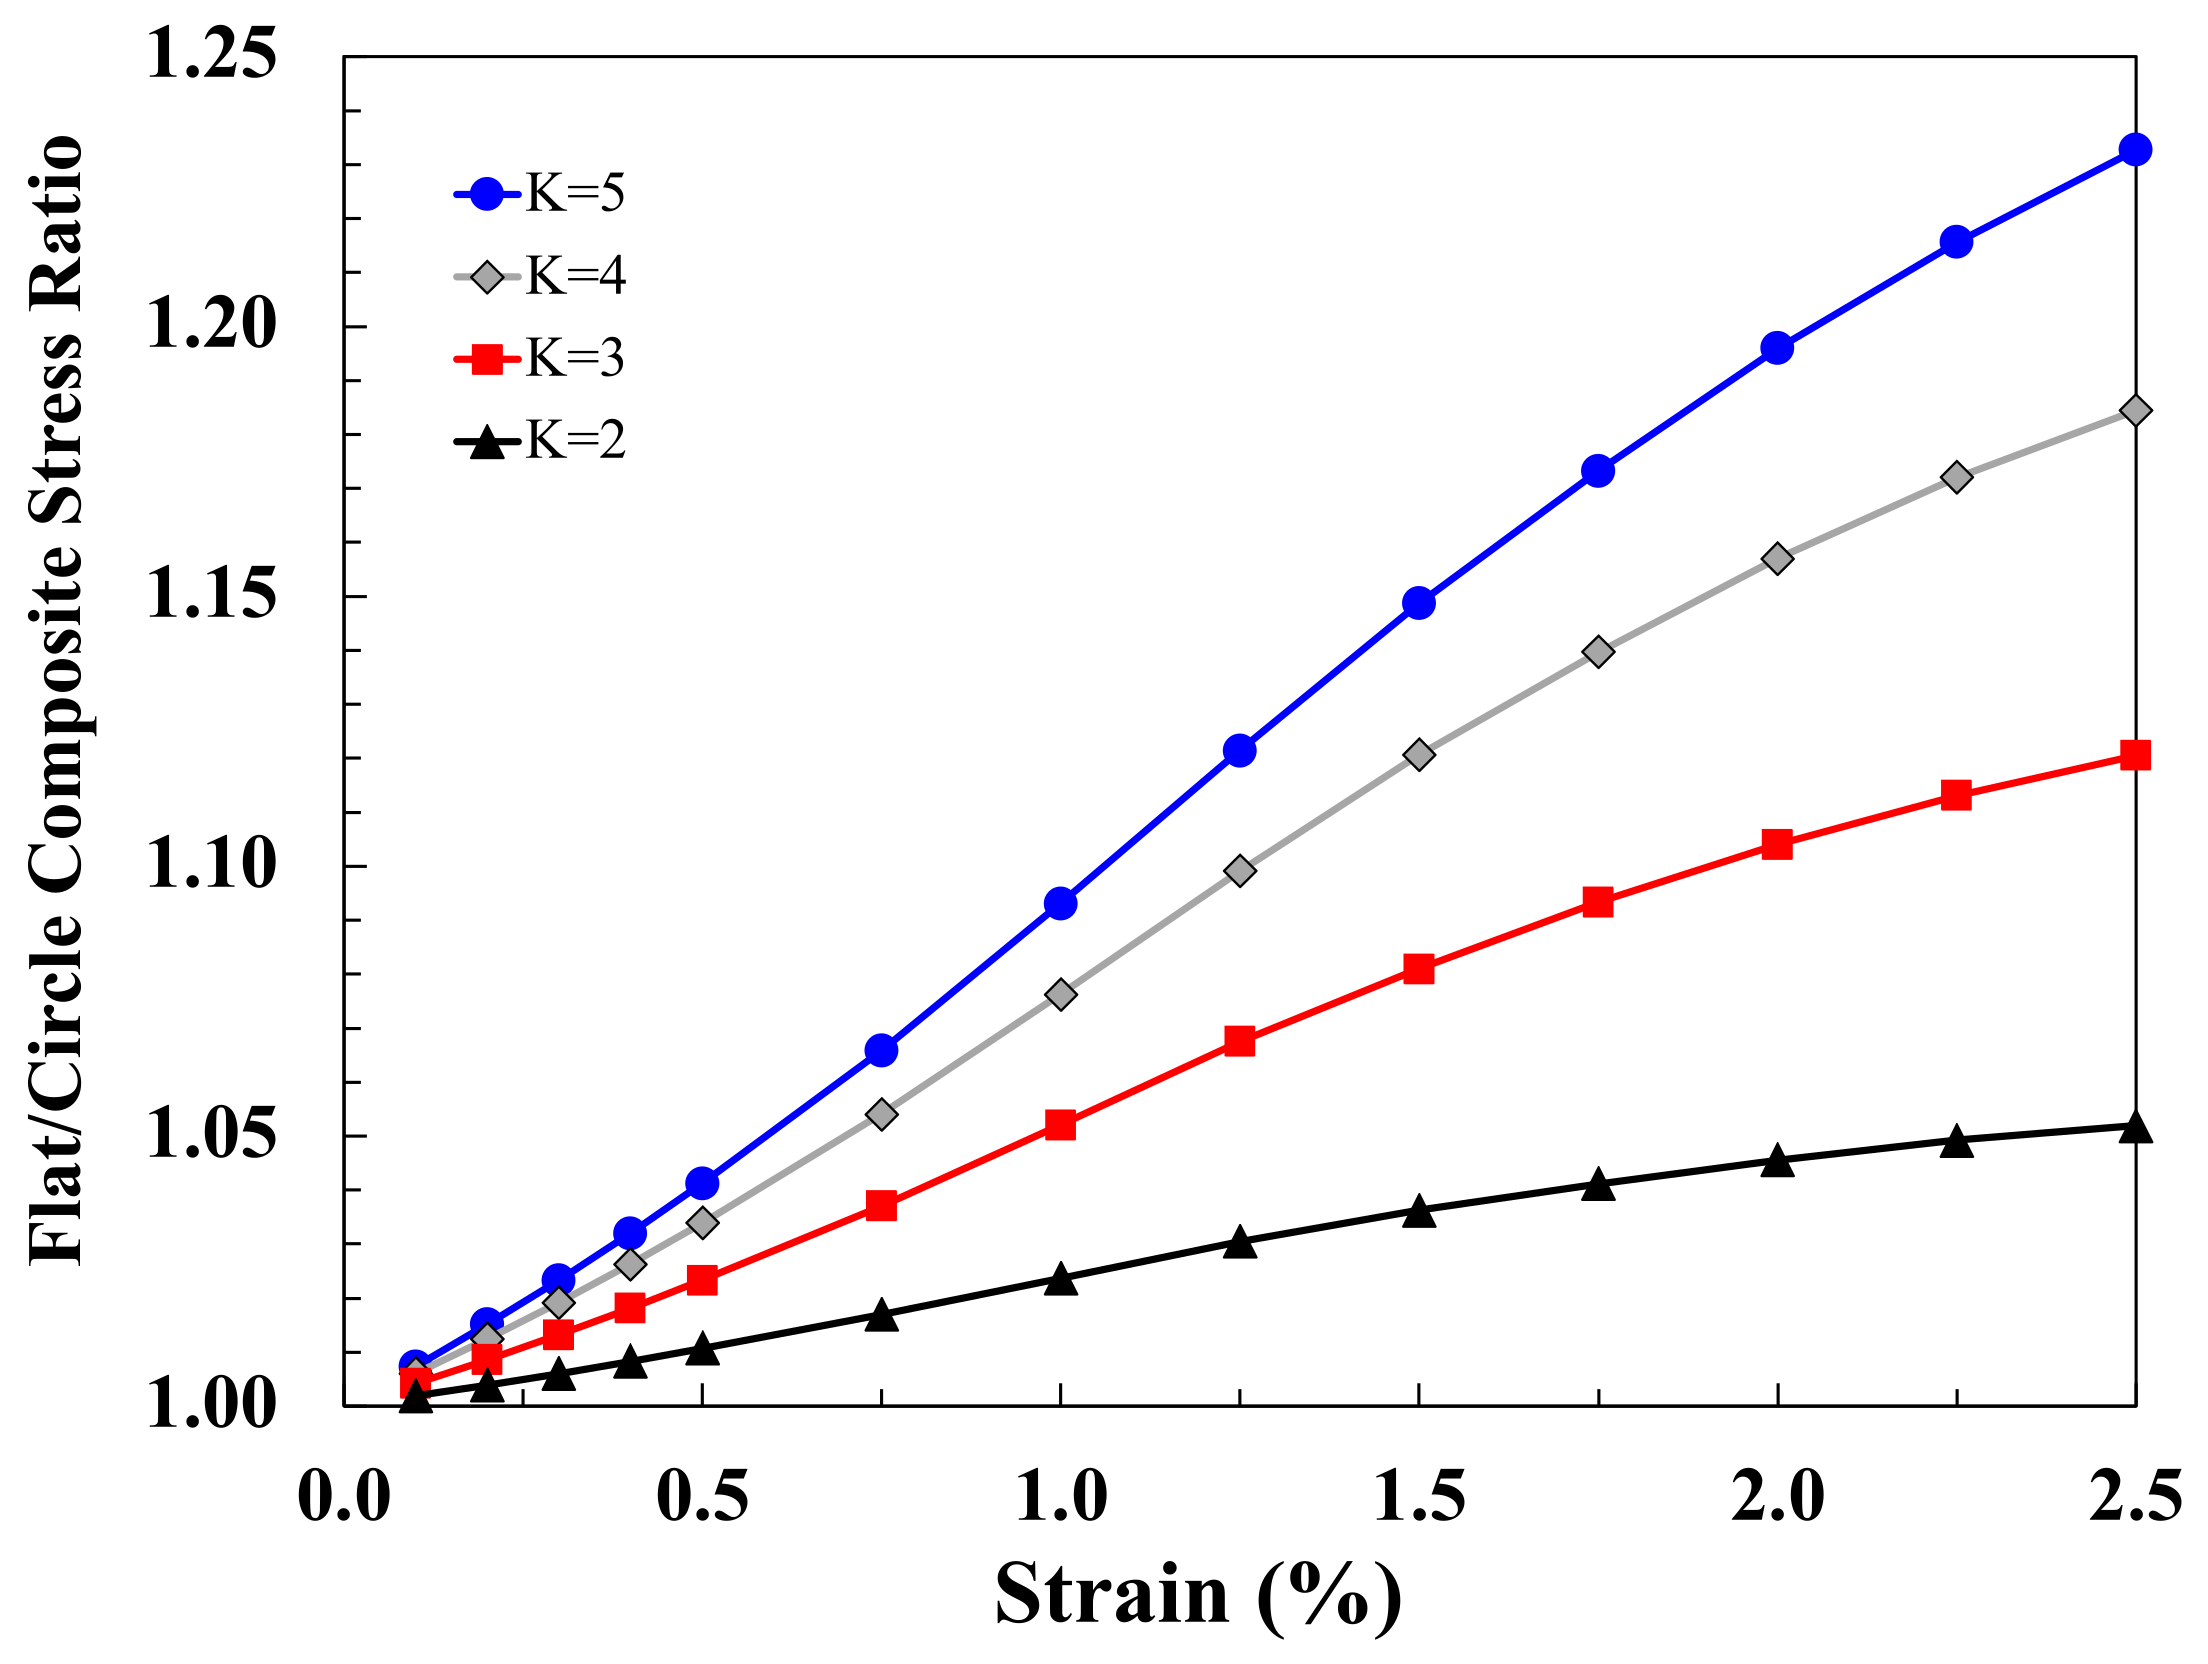
Figure 10 presents the results of a similar analysis, where the flat glass fibre flatness factor K has been varied for a constant composite glass fibre content of 40% wt. As might be expected from the results shown in Figure 6, the results in Figure 10 predict that the flat fibre advantage for injection moulded glass fibre polypropylene composites increases directly with the flat fibre flatness. For the commercially available flatness range of 3–4, a 12% to 18% flat fibre advantage in composite tensile strength is predicted at a 2.5% strain to failure. Clearly it is worth recapping at this point that this analysis assumes that the flat glass fibre composites have the same fibre strength distribution, fibre orientation distribution, fibre length distribution, and strain to failure as the circular glass fibres.
The very limited experimental data available in the literature comparing the effects of flat fibre versus circular fibre on the tensile strength of injection moulded short fibre thermoplastics at different fibre contents. Data for a K = 4 glass reinforced PPS system has been published by Heo et al. [37] and for K = 4 flat fibre in recycled PET, as reported by Kim et al. [38,39]. Although the data in these papers is for composites with different thermoplastic matrix systems, it does appear that the flat:circular tensile strength ratio does increase systematically with increasing glass fibre content. Moreover, the levels of flat:circular advantage in tensile strength do not disagree with the levels predicted in Figure 9 and Figure 10. Despite the difference in polymer matrices for these systems, it does appear that the theoretical values calculated in this work agree well with the limited experimental data available.
5. Natural Fibres
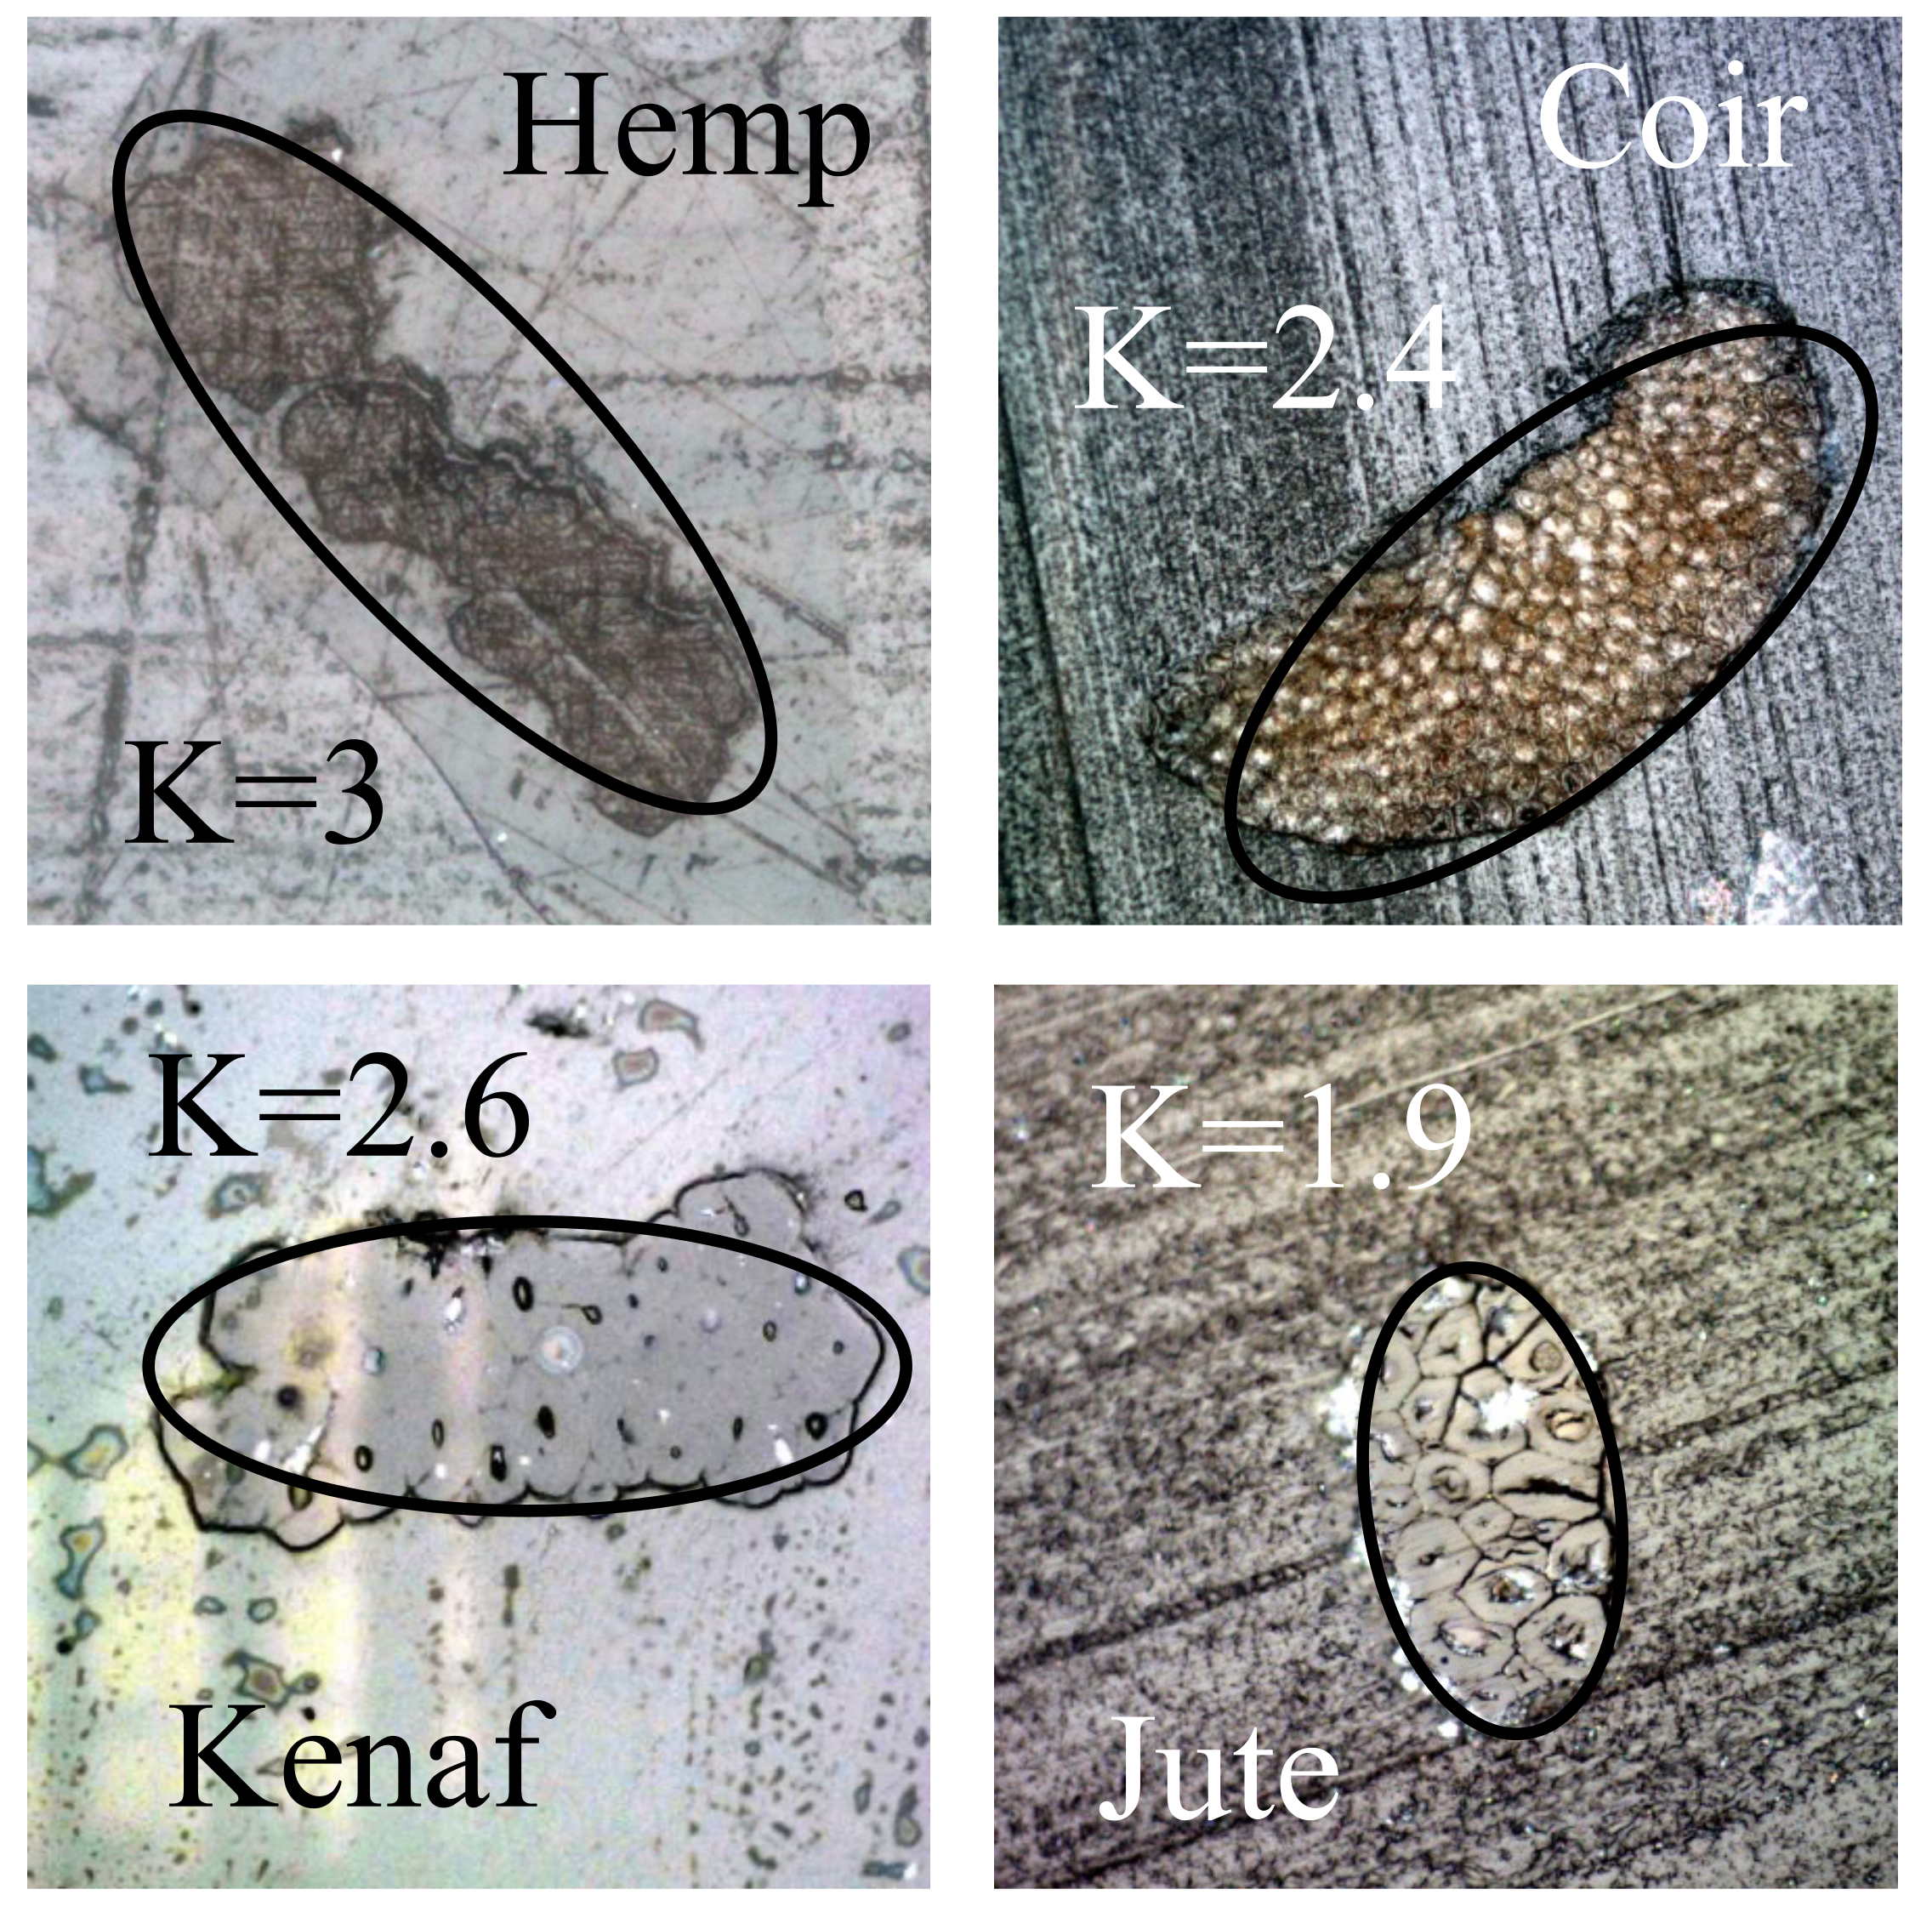
Although the use of renewable materials in composite applications is not a new idea, in recent years, there has been a growing interest in the research of fibres derived from natural sustainable sources as potential reinforcements for high performance composite materials [16,17,18,19,20,21,22,23,24,25,26,27,28]. This increased interest in natural fibre composites has multiple drivers, growing environmental concern, possible cost competitiveness, the depletion and price of oil, and new regulations for a cleaner and safer environment. Many types of natural fibre have been identified that may be made to appear to have some appropriate mechanical properties for structural purposes, such as low density, high specific strength, and stiffness. However, these fibres suffer from the natural variability, which is inherent in materials sourced directly from nature. In particular, natural fibres rarely have either a circular or a uniform cross section, the cross-section shape varies hugely from fibre-to-fibre and also significantly along the length of individual fibres [21,22,23,24,25,26,27,28]. Some typical natural fibre cross sections are shown in Figure 11.
The non-circularity of these natural fibres was recently highlighted as a significant source of error in estimating the fibre tensile strength, and a number of authors have shown that their cross section can be better estimated by an ellipse shape rather than circular [21,23,28]. It is clear in Figure 11 that an ellipse is a better model for the cross-section shape of these fibres with major-to-minor axis ratios between one and five being commonly observed [21,23,28]. The critical fibre length adjustment factor for an elliptical cross section is shown in Figure 2 as a function of K value. Similar to the flat fibre curve, it can be seen that Lc for an oval fibre can be as much as 25% lower than that of a circular cross section fibre of equivalent area in the K = 1 to 5 range. Nevertheless, it can also be noted in the images in Figure 11 that the irregular nature of the natural fibre surface means that the actual perimeter of these fibres is most likely still greater than that of a smooth ellipse. This would result in even larger potential reductions in Lc for these fibres when compared to a circular cross section of equal area. Consequently, for those taking up the challenge of micromechanical modelling of natural fibres and their composites, it is clear that consideration must be given to the non-circular cross section of individual fibres when the Lc parameter is being discussed. However, given the previously mentioned enormous range of inter-fibre and intra-fibre variation in natural fibre cross sectional shapes and areas, no further analysis is undertaken in this work.
6. Carbon Fibres
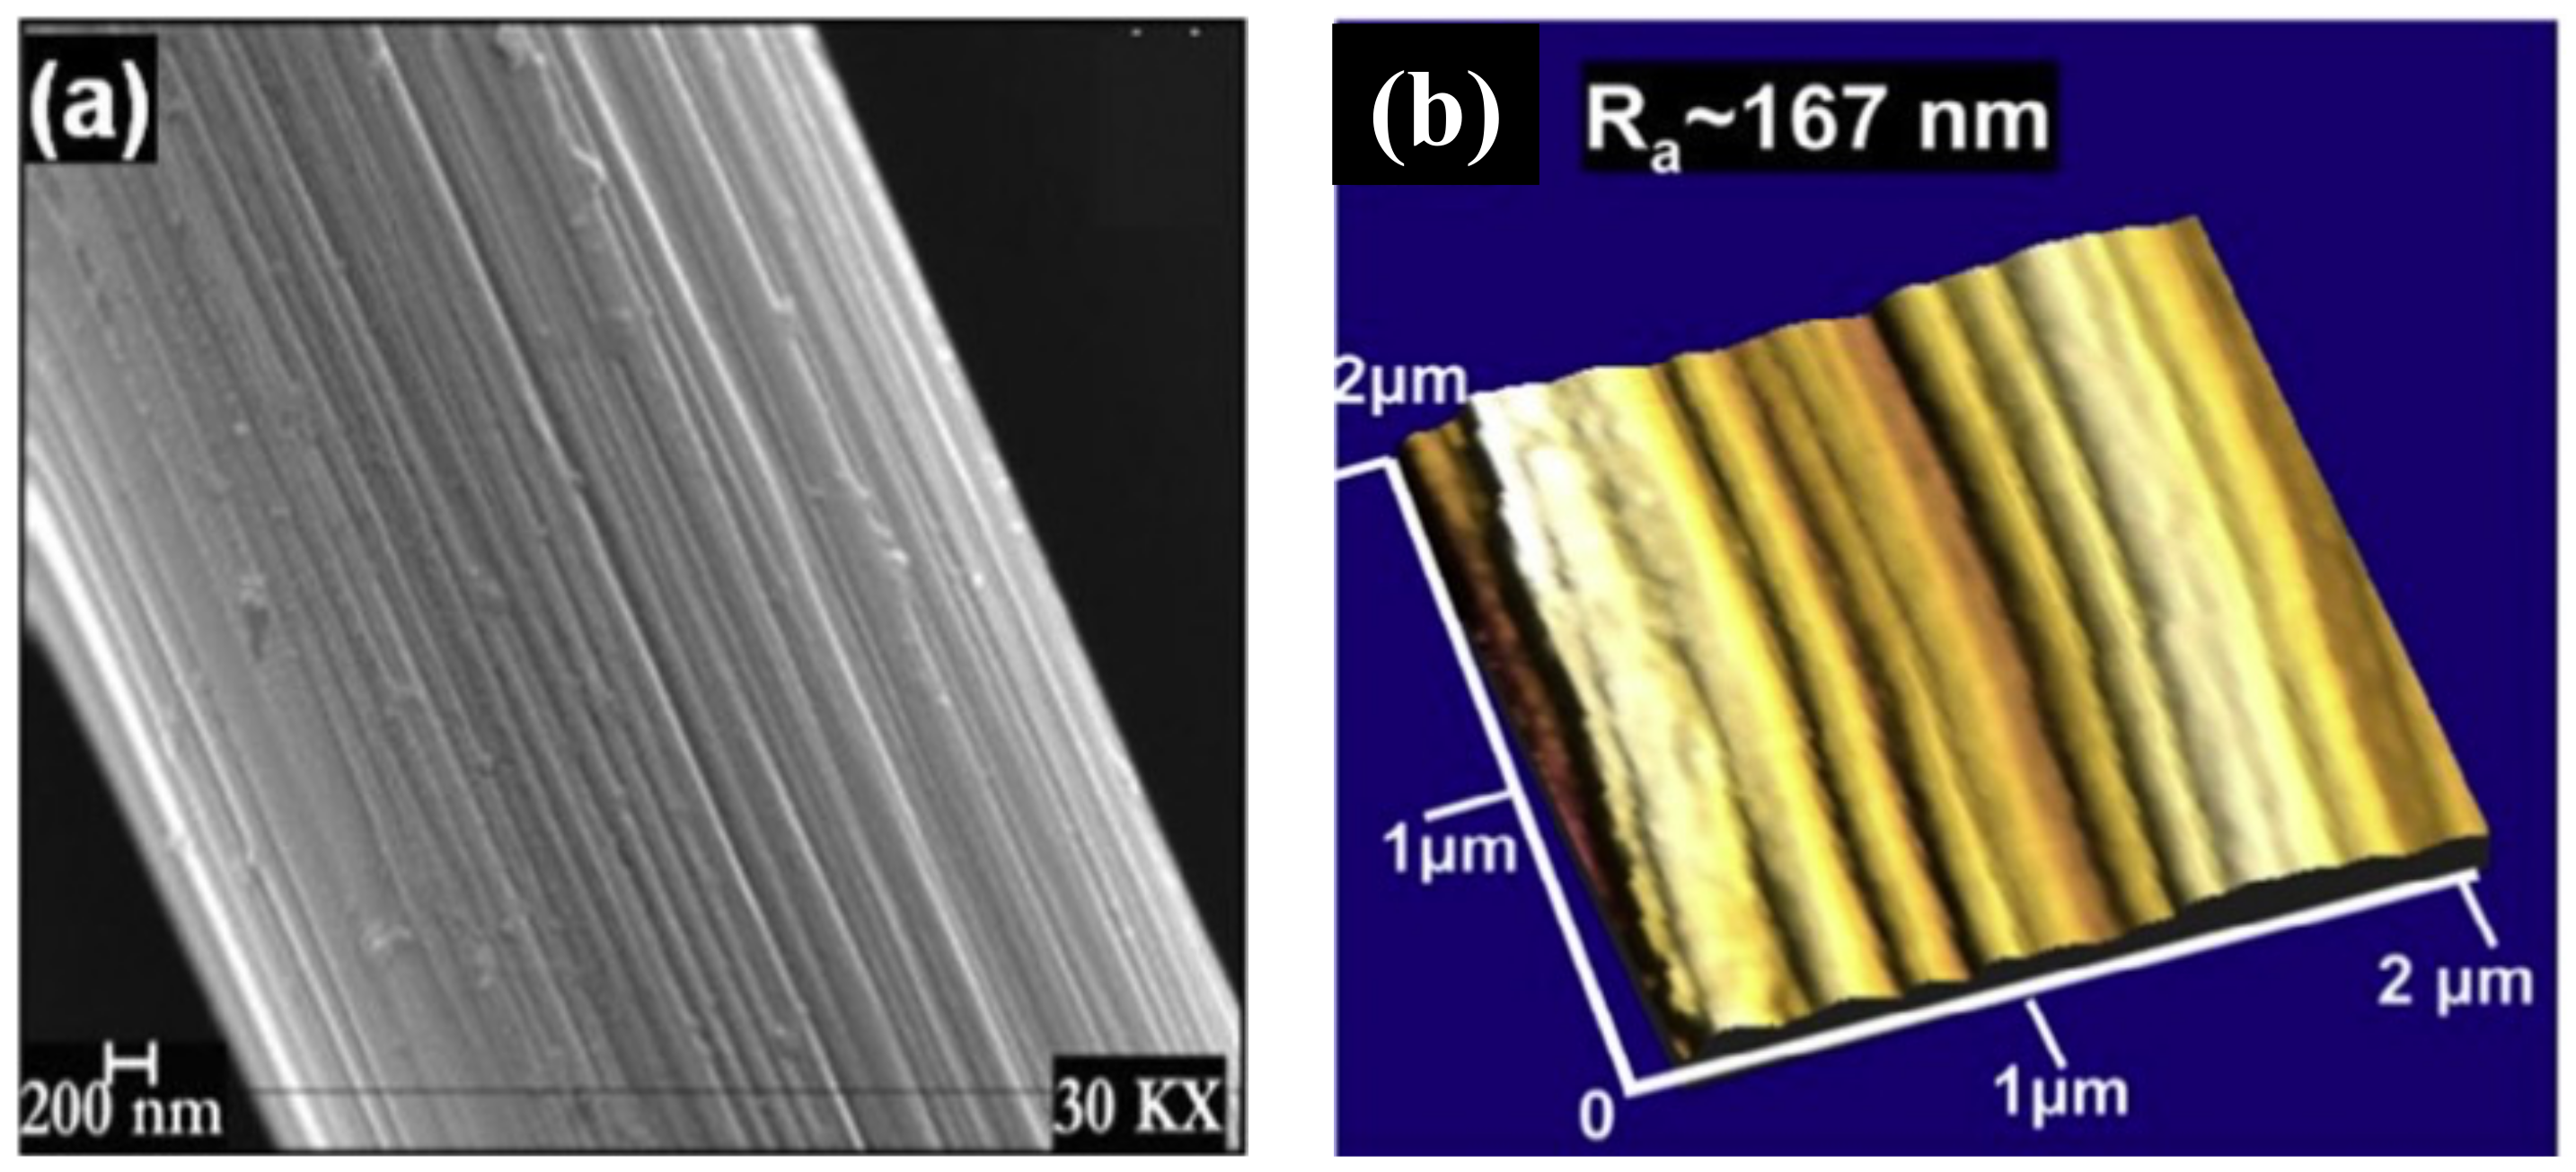
The literature on carbon fibres also reveals a wide range of fibre cross section shapes. This is illustrated in Figure 12 taken from a paper by Newcomb et al. [45]. It is clear that all of the different fibres in this figure will have different individual values of area:perimeter ratio, which will result in different values for the appropriate shape factor for the reduction in Lc for that fibre type. Once again, it is beyond the scope of this single paper to discuss all of these fibre shapes, but it is noted that some of the fibres in Figure 12 will require a shape factor which will lead to significant reductions in actual Lc values compared to the use of a circular cross section model. However, there is an additional aspect to the surface morphology of many carbon fibres, which does merit further discussion in terms of area:perimeter ratio and its effect on Lc. Many carbon fibres have grooves distributed along the axial direction of fibres, which are inherited from the surface grooves of precursor fibres [45,46,47]. Researchers often use scanning electron microscopy or atomic force microscopy to visualise these grooved structures, as illustrated in Figure 13 [47]. The surface morphology, and, in particular, the dimensions of these surface grooves depend on the type of carbon fibre, the production process and conditions, and the post-production surface treatment. Sometimes, carbon fibres are designed to contain grooves to mechanically anchor the fibres to the resin, thereby minimizing fibre pull-out and improving composite interfacial performance [48]. However, given the preceding discussion, it is also possible that a contribution to any apparent improvement in interfacial adhesion may also be due to overlooked changes to the critical fibre length in the system due to an unaccounted for decrease in the fibre area:perimeter ratio, due to the surface roughness caused by these grooves.
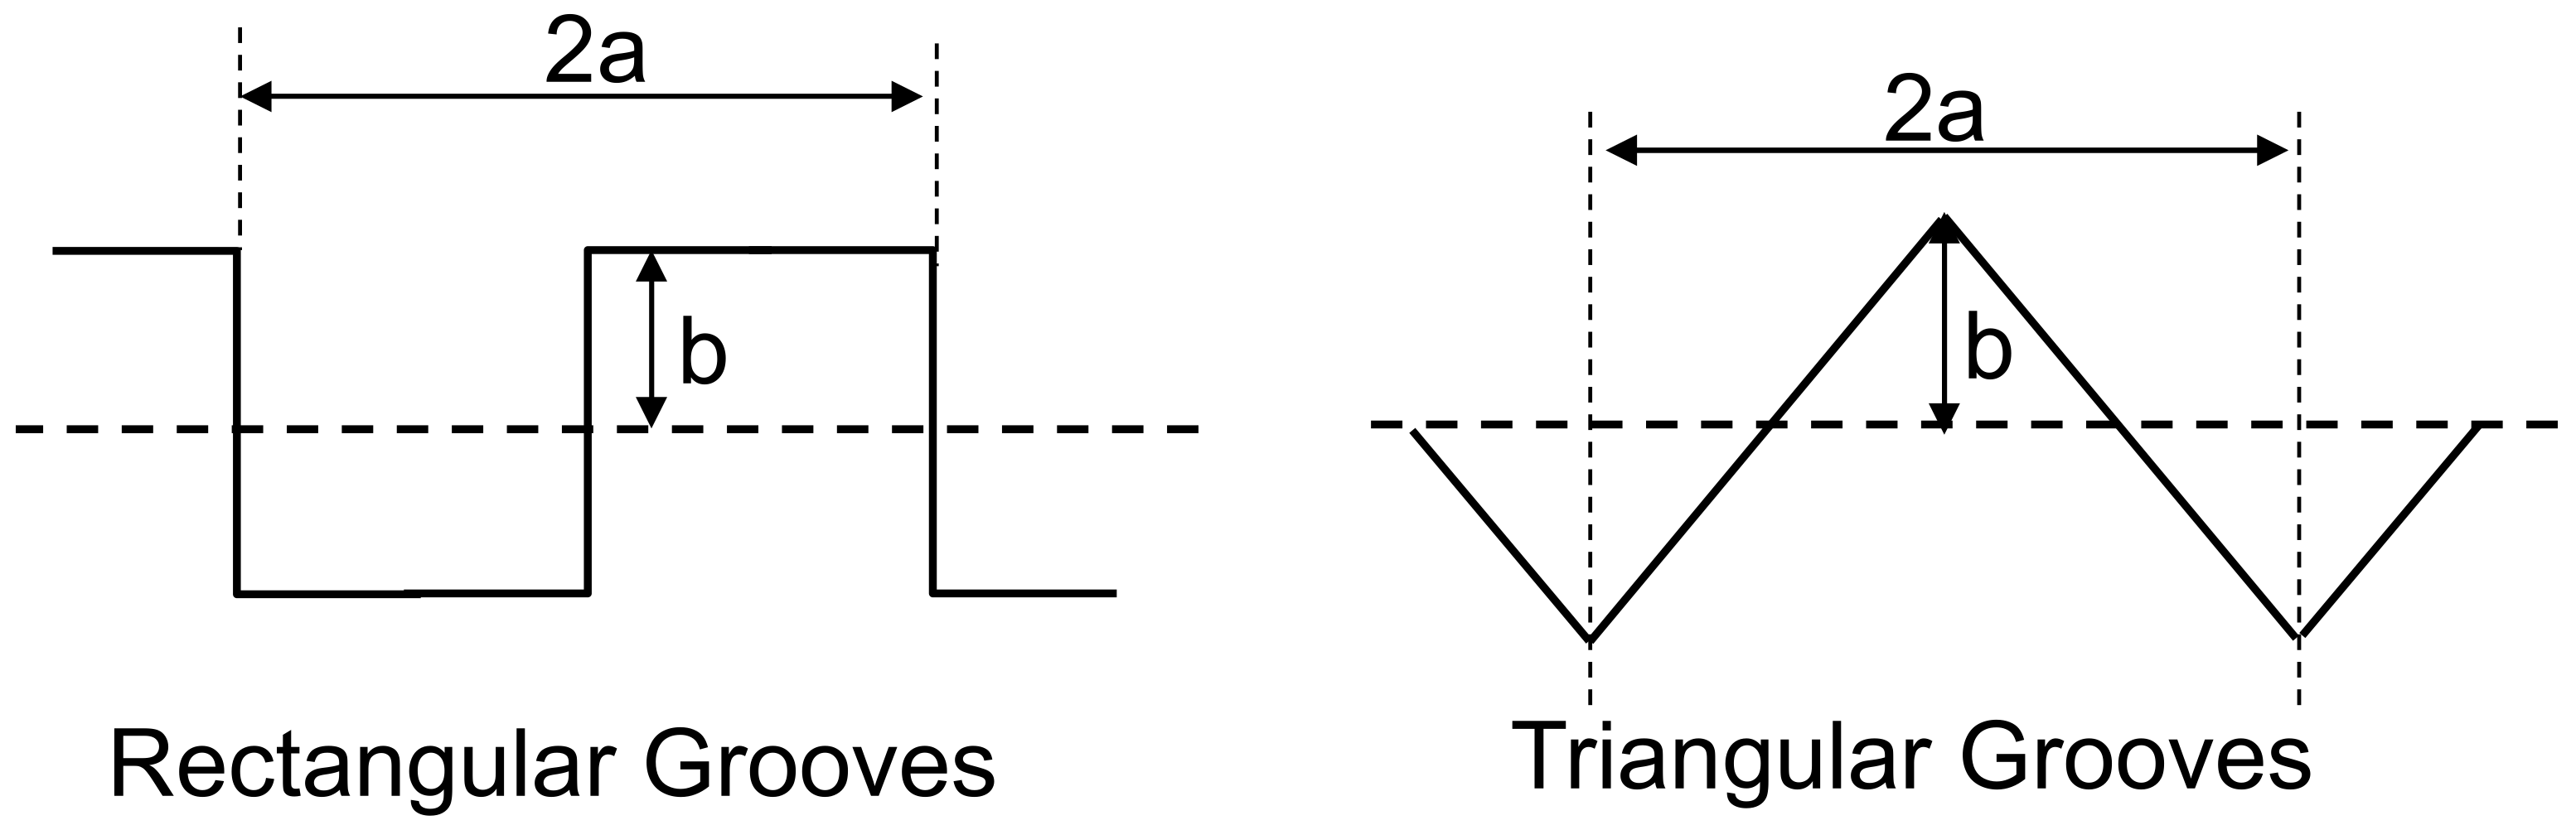
Figure 14 shows two simple models for the grooved surface of a circular cross-section carbon fibre (of diameter D), where either a regular rectangular shapes groove or a triangular shaped groove surface is considered. It is assumed that the grooves pictured in Figure 14 repeat systematically around the perimeter of the fibre. The perimeter (Prect) of the fibre with a rectangular grooved surface is
For small values of b/D, Arect = Ao, hence,
Similarly, the perimeter (Ptri) of the fibre with a triangular grooved surface is
For small values of b/D, Atri = Ao, hence,
The Ci factors in Equations (15) and (17) are, therefore, the Lc reduction factors, due to the increase perimeter of the fibres due to the surface grooves. Values for these factors are plotted in Figure 15 as a function of the value of b/a. Once again, it can be seen that consideration of the increased fibre perimeter, in this case due to surface grooves, may lead to significant changes in the value of critical fibre length for a carbon fibre depending on the dimensions of the grooves. Yao and Chen have published values of b/a up to 0.36 for T-300 PAN carbon fibres with different levels of surface etching [48]. This range is marked in Figure 15 and indicates a possible reduction of up to 30% in Lc due to surface grooves. This groove related reduction would have to be subtracted in addition to any Lc reduction due to non-circularity of the fibre cross section. This could result in a 50% or more error in characterising the critical fibre length of such fibres if considering them as approximately circular in cross section with a smooth surface.
It seems likely that the effects of the relatively regular shaped surface roughness of carbon fibres on critical fibre length will also be mirrored in natural fibre systems where the fibre surface is also commonly not smooth. However, as remarked above, the enormous variability in the inter-fibre and intra-fibre morphology of natural fibres makes a generalised analysis of such effects impractical. From a micromechanical viewpoint, it is worth noting that the effect of fibre surface morphology on critical fibre length further highlights the importance of fully characterising the wetting of the fibre surface by the polymer matrix on a microscopic level.
Finally, it is also worth pointing out that this analysis implies that accurate characterisation of the fibre perimeter is critical in the application of single fibre techniques, such as the fragmentation test and the fibre pull-out and microbond test, to obtain values of the interfacial stress transfer capability or IFSS. Both these techniques require accurate determination of the fibre perimeter in order to obtain accurate estimates of the IFSS of the fibre–matrix system. Approximating the perimeter of a non-circular fibre to that of a circular fibre will lead to an overestimation of IFSS in all cases. In particular, the commonly used simple analysis of fragmentation test results [4,5,6] depends directly on evaluating the critical fibre length. It is clear from the preceding modelling and analysis that ignoring the non-circular fibre cross section or significant levels of surface roughness in the calculations may well lead to significantly erroneous results.
7. Conclusions
The perimeter of non-circular cross section fibres is always greater than that of a circular fibre with an equal cross-sectional area. Consequentially, analytical modelling of this phenomenon showed that the critical fibre length (Lc) in composites with non-circular fibres is always less when compared to circular fibres with an equal cross-sectional area. Examples based on the shape of commercially available flat glass fibres revealed that Lc depends on the flatness parameter of the fibres and can result in reductions of up to 30%. Further modelling of composite strength using the Kelly–Tyson theory predicted that flat fibres provide a consistently higher fibre contribution to composite strength over the entire fibre length range. This effect is at a maximum for short fibres with lengths below Lc. Further modelling, which accounted for the matrix contribution and fibre orientation and length distribution effects typical in injection moulded composites, predicted a flat fibre advantage in composite tensile strength, which increased with fibre flatness and composite fibre content. This was shown to result in a predicted strength advantage for injected moulded short flat glass fibre-reinforced polypropylene of approximately 12–18% for typical moulding compound fibre contents in the 30–40% by weight range.
The effects of fibre non-circularity were also discussed for natural fibres and carbon fibres. It was noted that almost all natural fibres are non-circular, as are many of the available carbon fibres; hence, these fibres will also exhibit significant reductions in actual Lc values compared to the use of a circular cross section approximation. The effects of surface roughness, in particular the grooved structure found on the surface of many carbon fibres, was also modelled. Results predicted a possible reduction of up to 30% in Lc due to the surface grooves on carbon fibres. This groove-related reduction would have to be subtracted in addition to any Lc reduction due to non-circularity of the fibre cross section, which could then result in 50% or more error in characterising the Lc of such fibres if considering them as approximately circular in cross section with a smooth surface.
Finally, it was noted that the results from these models predict that ignoring non-circularity fibre cross section or significant fibre surface roughness in the application of single fibre techniques such as the fragmentation test, the fibre pull-out test, or the microbond test to obtain values of the interfacial stress transfer capability or IFSS may well lead to significantly erroneous results.
Funding
This research received no external funding.
Institutional Review Board Statement
Not applicable.
Informed Consent Statement
Not applicable.
Data Availability Statement
Not applicable.
Conflicts of Interest
The author declares no conflict of interest.
References
- Thomason, J.L.; Vlug, M.A. Influence of fibre length and concentration on the properties of glass fibre-reinforced polypropylene: 1. Tensile and flexural modulus. Compos. Part A Appl. Sci. Manuf. 1996, 27, 477–484. [Google Scholar] [CrossRef]
- Thomason, J.L.; Vlug, M.A.; Schipper, G.; Krikor, H.G.L.T. The influence of fibre length and concentration on the properties of glass fibre reinforced polypropylene: Part 3 strength and strain at failure. Compos. Part A Appl. Sci. Manuf. 1996, 27, 1075–1084. [Google Scholar] [CrossRef]
- Thomason, J.L.; Vlug, M.A. Influence of fibre length and concentration on the properties of glass fibre-reinforced polypropylene: 4. Impact Prop. Compos. Part A Appl. Sci. Manuf. 1997, 28, 277–288. [Google Scholar] [CrossRef]
- Herrera-Franco, P.J.J.; Drzal, L.T. Comparison of methods for the measurement of fibre/matrix adhesion in composites. Composites 1992, 23, 2–27. [Google Scholar] [CrossRef]
- Tripathi, D.; Jones, F.R. Single fibre fragmentation test for assessing adhesion in fibre reinforced composites. J. Mater. Sci. 1998, 33, 1–16. [Google Scholar] [CrossRef]
- Aliotta, L.; Lazzeri, A. A proposal to modify the Kelly-Tyson equation to calculate the interfacial shear strength (IFSS) of composites with low aspect ratio fibers. Compos. Sci. Technol. 2020, 186, 107920. [Google Scholar] [CrossRef]
- Sherman, L.M. Novel Flat Fiberglass Enhances Injection Molded TP Composites; Plastics Technology, 2018; Available online: https://www.ptonline.com/articles/novel-flat-fiberglass-enhances-injection-molded-tp-composites (accessed on 28 June 2022).
- Mapleston, P. Reinforcing Options for Compounders. Compounding World, October 2018; pp. 77–84. Available online: https://content.yudu.com/web/1rl19/0A1rl2p/CWOct18/html/index.html?page=78&origin=reader (accessed on 10 October 2018).
- Edie, D.; Fox, N.; Barnett, B.; Fain, C. Melt-spun non-circular carbon fibers. Carbon 1986, 24, 477–482. [Google Scholar] [CrossRef]
- Edie, D.; Fain, C.; Robinson, K.; Harper, A.; Rogers, D. Ribbon-shape carbon fibers for thermal management. Carbon 1993, 31, 941–949. [Google Scholar] [CrossRef]
- Jeong, G.; Lim, J.H.; Choi, C.; Kim, S.-W. A virtual experimental approach to evaluate transverse damage behavior of a unidirectional composite considering noncircular fiber cross-sections. Compos. Struct. 2019, 228, 111369. [Google Scholar] [CrossRef]
- Go, M.-S.; Park, S.-M.; Kim, D.-W.; Hwang, D.-S.; Lim, J.H. Random fiber array generation considering actual noncircular fibers with a particle-shape library. Appl. Sci. 2020, 10, 5675. [Google Scholar] [CrossRef]
- Kim, D.W.; Lim, J.H.; Kim, S.W.; Kim, Y.H. Micro-computed tomography-aided modeling for misaligned and noncircular fibers of unidirectional composites and validation under a transverse tensile loading. Compos. Sci. Technol. 2021, 212, 108879. [Google Scholar] [CrossRef]
- Ennis, B.L.; Perez, H.S.; Norris, R.E. Identification of the optimal carbon fiber shape for cost-specific compressive performance. Mater. Today Commun. 2022, 33, 104298. [Google Scholar] [CrossRef]
- Kitagawa, Y.; Yoshimura, A.; Arai, M.; Goto, K.; Sugiura, N. Experimental and numerical evaluation of effects of kidney-shape carbon fiber on transverse cracking of carbon fiber reinforced plastics. Compos. Part A Appl. Sci. Manuf. 2022, 152, 106690. [Google Scholar] [CrossRef]
- Peças, P.; Carvalho, H.; Salman, H.; Leite, M. Natural fibre composites and their applications: A review. J. Compos. Sci. 2018, 2, 66. [Google Scholar] [CrossRef] [Green Version]
- Lee, C.H.; Khalina, A.; Lee, S.H. Importance of interfacial adhesion condition on characterization of plant-fiber-reinforced polymer composites: A review. Polymers 2021, 13, 438. [Google Scholar] [CrossRef]
- Dąbrowska, A. Plant-Oil-Based Fibre Composites for Boat Hulls. Materials 2022, 15, 1699. [Google Scholar] [CrossRef]
- Ahmad, H.; Chhipi-Shrestha, G.; Hewage, K.; Sadiq, R. A Comprehensive Review on Construction Applications and Life Cycle Sustainability of Natural Fiber Biocomposites. Sustainability 2022, 14, 15905. [Google Scholar] [CrossRef]
- Kamarudin, S.H.; Mohd Basri, M.S.; Rayung, M.; Abu, F.; Ahmad, S.; Norizan, M.N.; Osman, S.; Sarifuddin, N.; Desa, M.S.Z.M.; Abdullah, U.H.; et al. A Review on Natural Fiber Reinforced Polymer Composites (NFRPC) for Sustainable Industrial Applications. Polymers 2022, 14, 3698. [Google Scholar] [CrossRef]
- Haag, K.; Müssig, J. Scatter in tensile properties of flax fibre bundles: Influence of determination and calculation of the cross-sectional area. J. Mater. Sci. 2016, 51, 7907–7917. [Google Scholar] [CrossRef]
- Zuccarello, B.; Marannano, G. Random short sisal fiber biocomposites: Optimal manufacturing process and reliable theoretical models. Mater. Des. 2018, 149, 87–100. [Google Scholar] [CrossRef]
- Garat, W.; Corn, S.; Le Moigne, N.; Beaugrand, J.; Bergeret, A. Analysis of the morphometric variations in natural fibres by automated laser scanning: Towards an efficient and reliable assessment of the cross-sectional area. Compos. Part A Appl. Sci. Manuf. 2018, 108, 114–123. [Google Scholar] [CrossRef]
- Zuccarello, B.; Militello, C.; Bongiorno, F. Influence of the anisotropy of sisal fibers on the mechanical properties of high performance unidirectional biocomposite lamina and micromechanical models. Compos. Part A Appl. Sci. Manuf. 2021, 143, 106320. [Google Scholar] [CrossRef]
- Thomason, J.L.; Rudeiros-Fernández, J.L. Modelling the influence of fibre internal structure on the measured modulus of technical natural fibres. Compos. Part A Appl. Sci. Manuf. 2021, 147, 106478. [Google Scholar] [CrossRef]
- Soatthiyanon, N.; Crosky, A.; Heitzmann, M.T. Comparison of Experimental and Calculated Tensile Properties of Flax Fibres. J. Compos. Sci. 2022, 6, 100. [Google Scholar] [CrossRef]
- Thomason, J.L.; Carruthers, J.; Kelly, J.; Johnson, G. Fibre cross-section determination and variability in sisal and flax and its effects on fibre characterisation. Compos. Sci. Technol. 2011, 71, 1008–1015. [Google Scholar] [CrossRef]
- Thomason, J.L.; Carruthers, J. Natural fibre cross sectional area, its variability and effects on the determination of fibre properties. J. Biobased Mater. Bioenergy 2012, 6, 424–430. [Google Scholar] [CrossRef]
- Gallucci, R.; Naar, R.; Liu, H.I.; Mordecai, W.; Yates, J.; Huey, L.; Schweizer, R. Reducing warp in thermoplastics with bilobe glass fibers. Plast. Eng. 1993, 49, 23–25. [Google Scholar]
- Huey, L.J.; Beuther, P.D. Method and Apparatus for Making Non-Circular Mineral Fibers. U.S. Patent 4,636,234, 13 January 1987. [Google Scholar]
- Available online: https://www.nittobo.co.jp/eng/business/glassfiber/frtp/hisff.htm (accessed on 15 October 2022).
- Available online: https://www.neg.co.jp/en/product/e-flat_list/ (accessed on 1 October 2020).
- Available online: http://en.cpicfiber.com/index.php/index/listproducts/s/106/c/53 (accessed on 16 January 2019).
- Deng, S.; Ye, L.; Mai, Y.-W. Influence of fibre cross-sectional aspect ratio on mechanical properties of glass fibre/epoxy composites I. Tensile and flexure behaviour. Compos. Sci. Technol. 1999, 59, 1331–1339. [Google Scholar] [CrossRef]
- Deng, S.; Ye, L.; Mai, Y.-W. Influence of fibre cross-sectional aspect ratio on mechanical properties of glass-fibre/epoxy composites II. Interlaminar fracture and impact behaviour. Compos. Sci. Technol. 1999, 59, 1725–1734. [Google Scholar] [CrossRef]
- Tanaka, K.; Tsutao, K.; Tatnaka, T.; Anguri, A. Injection Molding of Flat Glass Fiber Reinforced Thermoplastics. Int. J. Mod. Phys. B 2012, 24, 2555–2560. [Google Scholar] [CrossRef]
- Heo, K.-Y.; Park, S.; Lee, E.-S.; Kim, M.-S.; Sim, J.; Ba, J. A Study on Properties of the Glass Fiber Reinforced PPS Composites for Automotive Headlight Source Module. Compos. Res. 2016, 29, 293–298. [Google Scholar] [CrossRef] [Green Version]
- Kim, J.-H.; Lee, E.-S.; Kim, M.-S.; Sim, J.-H. Mechanical characteristics of gf/recycled PET thermoplastic composites with chopped fiber according to cross section. Text. Color. Finish. 2017, 29, 239–246. [Google Scholar]
- Sim, J.; Yu, S.-H.; Yoon, H.-S.; Kwon, D.-J.; Lee, D.-H.; Bae, J.-S. Characteristic evaluation and finite element analysis of glass fiber/recycled polyester thermoplastic composites by cross-sectional shape of glass fiber. Compos. Part B Eng. 2021, 223, 109095. [Google Scholar] [CrossRef]
- Thomason, J.L. The influence of fibre length and concentration on the properties of glass fibre reinforced polypropylene: 5. Injection moulded long and short fibre PP. Compos. Part A Appl. Sci. Manuf. 2002, 33, 1641–1652. [Google Scholar] [CrossRef]
- Kelly, A.; Tyson, W.R. Tensile properties of fibre-reinforced metals. J. Mech. Phys. Solids. 1965, 13, 329–350. [Google Scholar] [CrossRef]
- Thomason, J.L. Flat glass fibres: The influence of fibre cross section shape on composite micromechanics and composite strength. Compos. Part A Appl. Sci. Manuf. 2023, 169, 107503. [Google Scholar] [CrossRef]
- Thomason, J.L. Micromechanical Parameters from Macromechanical Measurements on glass reinforced polypropylene. Compos. Sci. Tech. 2002, 62, 1455–1468. [Google Scholar] [CrossRef] [Green Version]
- Greenfeld, I.; Wagner, H.D. Nanocomposite toughness, strength and stiffness: Role of filler geometry. Nanocomposites 2015, 1, 3–17. [Google Scholar] [CrossRef] [Green Version]
- Newcomb, B.A.; Giannuzzi, L.A.; Lyons, K.M.; Gulgunje, P.V.; Gupta, K.; Liu, Y.; Kamath, M.; McDonald, K.; Monn, J.; Feng, B.; et al. High resolution transmission electron microscopy study on polyacrylonitrile/carbon nanotube based carbon fibers and the effect of structure development on the thermal and electrical conductivities. Carbon 2015, 93, 502–514. [Google Scholar] [CrossRef] [Green Version]
- Qian, X.; Zou, R.; OuYang, Q.; Wang, X.; Zhang, Y. Surface structural evolvement in the conversion of polyacrylonitrile precursors to carbon fibers. Appl. Surf. Sci. 2015, 327, 246–252. [Google Scholar] [CrossRef]
- Sharma, M.; Gao, S.; Mäder, E.; Sharma, H.; Wei, L.Y.; Bijwe, J. Carbon fiber surfaces and composite interphases. Compos. Sci. Technol. 2014, 104, 35–50. [Google Scholar] [CrossRef]
- Yao, Y.; Chen, S. Effects of the longitudinal surface roughness on fiber pull-out behavior in carbon fiber-reinforced epoxy resin composites. J. Appl. Mech. 2013, 80, 2179–2189. [Google Scholar] [CrossRef]
Figure 1.
SEM of circular and flat cross-section glass fibres.

Figure 2.
Lc reduction factors (C) for flat and elliptical fibres versus flat flatness (K).

Figure 3.
Prediction of normalised performance of GF-PP composite versus fibre length [4].
Figure 3.
Prediction of normalised performance of GF-PP composite versus fibre length [4].

Figure 4.
Some fibre length distributions in injection moulded GF-PP composites [40].
Figure 4.
Some fibre length distributions in injection moulded GF-PP composites [40].

Figure 5.
Kelly–Tyson equation prediction of flat and circular fibre strength contribution in unidirectional discontinuous GF-PP composites.
Figure 5.
Kelly–Tyson equation prediction of flat and circular fibre strength contribution in unidirectional discontinuous GF-PP composites.

Figure 6.
Kelly–Tyson equation prediction of flat/circular strength contribution ratio in unidirectional discontinuous GF-PP composites for fibre with different flatness ratios (K).
Figure 6.
Kelly–Tyson equation prediction of flat/circular strength contribution ratio in unidirectional discontinuous GF-PP composites for fibre with different flatness ratios (K).

Figure 7.
Kelly–Tyson equation prediction of flat/circle strength ratio for GF-PP including matrix contribution and average fibre orientation for injection moulded samples.
Figure 7.
Kelly–Tyson equation prediction of flat/circle strength ratio for GF-PP including matrix contribution and average fibre orientation for injection moulded samples.

Figure 8.
Kelly–Tyson equation prediction of stress–strain of injection moulded GF-PP with flat (K = 4) and circular cross-section fibres.
Figure 8.
Kelly–Tyson equation prediction of stress–strain of injection moulded GF-PP with flat (K = 4) and circular cross-section fibres.

Figure 9.
Prediction of flat/circle ratio of stress in injection moulded GF-PP composites for K = 4 flat fibres.
Figure 9.
Prediction of flat/circle ratio of stress in injection moulded GF-PP composites for K = 4 flat fibres.

Figure 10.
Prediction of flat/circle ratio of stress in injection moulded 40% GF-PP composites for different flatness fibres.
Figure 10.
Prediction of flat/circle ratio of stress in injection moulded 40% GF-PP composites for different flatness fibres.

Figure 11.
Optical micrographs of various natural fibre cross section shapes.

Figure 12.
SEM of various carbon fibre cross sections (a) T300, (b) IM7, (c) GT PAN, (d) GT PAN/CNT-A (0.42 wt%), (e) GT PAN/CNT-B1, (f) GT PAN/CNT-A, and (g) GT PAN/CNT-C (see reference [45] for further details).
Figure 12.
SEM of various carbon fibre cross sections (a) T300, (b) IM7, (c) GT PAN, (d) GT PAN/CNT-A (0.42 wt%), (e) GT PAN/CNT-B1, (f) GT PAN/CNT-A, and (g) GT PAN/CNT-C (see reference [45] for further details).

Figure 13.
Visualisation of carbon fibre surface grooves by (a) SEM, (b) AFM [47].
Figure 13.
Visualisation of carbon fibre surface grooves by (a) SEM, (b) AFM [47].

Figure 14.
Geometrical models of carbon fibre surface grooves.

Figure 15.
Lc reduction factor due to carbon fibre surface grooves.

Disclaimer/Publisher’s Note: The statements, opinions and data contained in all publications are solely those of the individual author(s) and contributor(s) and not of MDPI and/or the editor(s). MDPI and/or the editor(s) disclaim responsibility for any injury to people or property resulting from any ideas, methods, instructions or products referred to in the content. |
© 2023 by the author. Licensee MDPI, Basel, Switzerland. This article is an open access article distributed under the terms and conditions of the Creative Commons Attribution (CC BY) license (https://creativecommons.org/licenses/by/4.0/).
Share and Cite
MDPI and ACS Style
Thomason, J. The Influence of Fibre Cross Section Shape and Fibre Surface Roughness on Composite Micromechanics. Micro 2023, 3, 353-368. https://doi.org/10.3390/micro3010024
AMA Style
Thomason J. The Influence of Fibre Cross Section Shape and Fibre Surface Roughness on Composite Micromechanics. Micro. 2023; 3(1):353-368. https://doi.org/10.3390/micro3010024
Chicago/Turabian StyleThomason, James. 2023. "The Influence of Fibre Cross Section Shape and Fibre Surface Roughness on Composite Micromechanics" Micro 3, no. 1: 353-368. https://doi.org/10.3390/micro3010024