Review

Vibrational Raman Spectroscopy of the Hydration Shell of Ions

1
Industrial Hygiene & Safety Section, Bhabha Atomic Research Center, Homi Bhabha National Institute, Trombay, Mumbai 400085, India
2
Radiation & Photochemistry Division, Bhabha Atomic Research Centre, Homi Bhabha National Institute, Trombay, Mumbai 400085, India
*
Author to whom correspondence should be addressed.
Liquids 2023, 3(1), 19-39; https://doi.org/10.3390/liquids3010003
Submission received: 31 October 2022 / Revised: 16 December 2022 / Accepted: 19 December 2022 / Published: 27 December 2022
(This article belongs to the Special Issue Hydration of Ions in Aqueous Solution)

Abstract

:
Ionic perturbation of water has important implications in various chemical, biological and environmental processes. Previous studies revealed the structural and dynamical perturbation of water in the presence of ions, mainly with concentrated electrolyte solutions having significant interionic interactions. These investigations highlighted the need of selective extraction of the hydration shell water from a dilute electrolyte solution that is largely free from interionic interactions. Double-difference infrared (DDIR) and Raman multivariate curve resolution (Raman-MCR), as well as MD simulation, provided valuable insight in this direction, suggesting that the perturbed water mainly resides in the immediate vicinity of the ion, called the hydration shell. Recently, we have introduced Raman difference spectroscopy with simultaneous curve fitting (Raman-DS-SCF) analysis that can quantitatively extract the vibrational response of the perturbed water pertaining to the hydration shell of fully hydrated ions/solute. The DS-SCF analysis revealed novel hydrogen-bond (H-bond) structural features of hydration water, such as the existence of extremely weakly interacting water–OH (νmax ~ 3600 cm−1) in the hydration shell of high-charge-density metal ions (Mg2+, Dy3+). In addition, Raman-DS-SCF retrieves the vibrational response of the shared water in the water–shared-ion pair (WSIP), which is different from the hydration shell water of either the interacting cation and anion. Herein, we discuss the perturbation of water H-bonding in the immediate vicinity of cation, anion, zwitterion and hydrophobes and also the inter-ionic interactions, with a focus on the recent results from our laboratory using Raman-DS-SCF spectroscopy.

1. Introduction

Water plays pivotal roles in atmospheric, chemical and biological processes [1,2,3,4]. In the real world, water rarely exists in its pure form; ions and amphiphiles are integral parts of natural water. Water as a liquid is highly structured due to its extensive hydrogen (H)-bond network, which is easily affected by external stimuli, including temperature, pressure, charge (ions) and other solutes with varying H-bonding abilities [5,6,7,8]. The majority of molecular interactions that dictate cellular processes in living organisms occur in the ion and amphiphile containing aqueous media known as the intra- and extra-cellular fluids. The water molecules in the immediate vicinity of ions and biomolecules not only act as a solvent but also as a ‘reactant’. The H-bonding of water is affected in the hydration shell of the ions and amphiphilic/hydrophobic biomolecules, which in turn influences the properties of these ions/molecules that play pivotal roles in biophysical/chemical processes, including the stability of secondary, tertiary and quaternary structures of proteins; selectivity of ion channel; cell-signaling; and the formation and flexibility of lipid membranes [9]. Being strongly associated, water exhibits the rapid delocalization of energy via its intra- and intermolecular vibrational modes; the structural perturbation of water in the ion hydration shell also affects the energy delocalization and reorganization dynamics in the hydration shell [6,10,11,12,13,14,15].
Early investigations categorized the charged groups/ions as the ‘kosmotrope’, i.e., the water structure maker, and the ‘chaotrope’, i.e., the water structure breaker, depending on their effect on the macroscopic properties of water such as viscosity, entropy and the salting in/out of proteins [6,16,17,18,19,20,21,22]. These descriptions, instead of the individual hydration of the ions in water, represent the cumulative effect of the cation and anion (produced by the electrolyte) on water H-bonding. As a result, the molecular-level description of the ionic perturbation of water remains elusive even after the categorization of ions as kosmotrope or chaotrope. Scattering-based techniques, such as neutron and X-ray diffraction, unveiled the geometrical distribution of water around an ion, enabling the determination of the number of water molecules in the first hydration shell, known as the coordination number (CN) [23,24,25,26,27]. The CN suggests the arrangement of water in the first hydration shell, but their H-bonding structure is not well understood by these measurements.
Vibrational spectroscopic techniques, such as IR, Raman and THz, are very sensitive to the H-bonded structure of water and have the potential to provide direct information by monitoring the intra- and inter-molecular vibrational modes of water. THz absorption spectroscopy, which measures the low-frequency intermolecular vibrational modes in the far-infrared region, revealed that the effect of a high-charge-density ion is extended beyond the first layer of water around the ion [13,28]. MD simulation in combination with THz spectroscopy further exposed interionic interactions that lead to the formation of a water–shared-ion pair (WSIP) and the dynamics of the shared water is cooperatively perturbed by the interacting ions [29]. The IR and Raman measurements of aqueous electrolyte solutions record the intramolecular modes (OH stretch (3400 cm−1) and HOH bend (1640 cm−1)) and intermolecular (librational (470 and 670 cm−1) and bend+librational combination (2110 cm−1)) and intermolecular H-bond stretch (185 cm−1)) vibration of water, irrespective of its position in bulk water or in the hydration shell of an ion. As a result, the experimental solution spectrum, especially for the diluted solution, contains a weak signal of the hydration water mixed with a huge signal of the bulk (unperturbed) water. This is why most early vibrational studies and even the recent THz studies were carried out with concentrated electrolyte solutions (a few-molar concentration) so that the relative contribution of the hydration water becomes appreciable in the experimental solution spectrum. However, at such a high electrolyte concentration, interionic interaction may lead to ion pairing, aggregation and the share/overlap of hydration shells, which invariably interfere with the native H-bonding of water in the hydration shell of a fully hydrated ion.
Analytical methods, such as spectral fitting, difference spectroscopy and factor analysis have been applied to extract the perturbed-water spectrum pertaining to the hydration shell of an ion [30,31,32]. In difference spectroscopy, the response of hydration water is obtained by subtracting the bulk water spectrum from the solution spectrum such that the subtracted spectrum provides the spectral signature of the water that are perturbed by the cation and anion. The improper (either excess or incomplete) subtraction of the bulk water spectrum may deform the band shape of the resulting salt-affected spectrum. While using salts of a fixed cation with varying anions (e.g., MgX2 with X = F, Cl, Br, I) and vice-versa, the series of difference-spectra obtained by this method provide a trend of the spectral change in the hydration shell of the anion. The subsequent fitting of the difference-spectra provides the spectrum of water in the hydration shell of the cation and anion, respectively, though the interionic interactions on the respective ion hydration shell spectra cannot be ignored.
Raman spectroscopy, in combination with multivariate curve resolution analysis (Raman-MCR) [33], successfully extracted the minimum area vibrational spectrum of the ion-affected water [34,35,36,37,38,39,40]. The ‘minimum area’ signifies the response of the ‘perturbed-water’ only; in other words, the hydration shell water whose vibrational response is similar to the bulk water is not retained in the MCR-extracted hydration shell spectrum. An important advantage of Raman-MCR is that it does not require any spectral fitting. However, the MCR method used in the study of ion hydration shells is heavily biased towards the perturbed water [34]. As a result, the MCR-extracted hydration shell spectrum fails to appreciate the subtle spectral features of water in the hydration shell of an ion. This limitation can be overcome to a great extent by using spectral fitting-guided minimum-area difference spectroscopy, known as difference spectroscopy, with simultaneous curve fitting (DS-SCF) analysis [41]. The application of Raman-DS-SCF revealed new features of water in the hydration shell of ions [42], which were obscured in the Raman-MCR [43], as well as double difference infrared, spectroscopy (DDIR) [44].
This review article describes the perturbation of the H-bonding and the vibrational coupling of water in the hydration shell of different ions, using DS-SCF and MCR methods on the Raman spectra of the corresponding dilute electrolyte solutions. Herein, hydration water refers to water that are in the close vicinity of ions, collectively called hydration shell water, regardless of their positions in the first, second or third hydration spheres that may exist depending on the charge density of the ion. The subsequent discussions are structured as follows. Section 2 provides a comparative discussion of the Raman-DS-SCF method with other hydration shell spectroscopy techniques. Section 3 and Section 4 describe the Raman spectrum of water in the OH stretch region and discuss the effect of isotopic dilution and electrolyte on the spectral line shape. Section 5 and Section 6 discuss the perturbation of H-bonding and vibrational coupling in the hydration shell of the anion and cation, respectively, with their varying natures such as charge density, valency, atomic/molecular nature, etc. The restructuring of hydration shell water for the formation of WSIP is described in Section 7. Section 8 and Section 9 discuss the hydration characteristics of a hydrophobic molecular ion (CH3)4N+;) and zwitterion (CH3)3N+-O), respectively. Finally, Section 10 provides a future perspective along with concluding remarks.

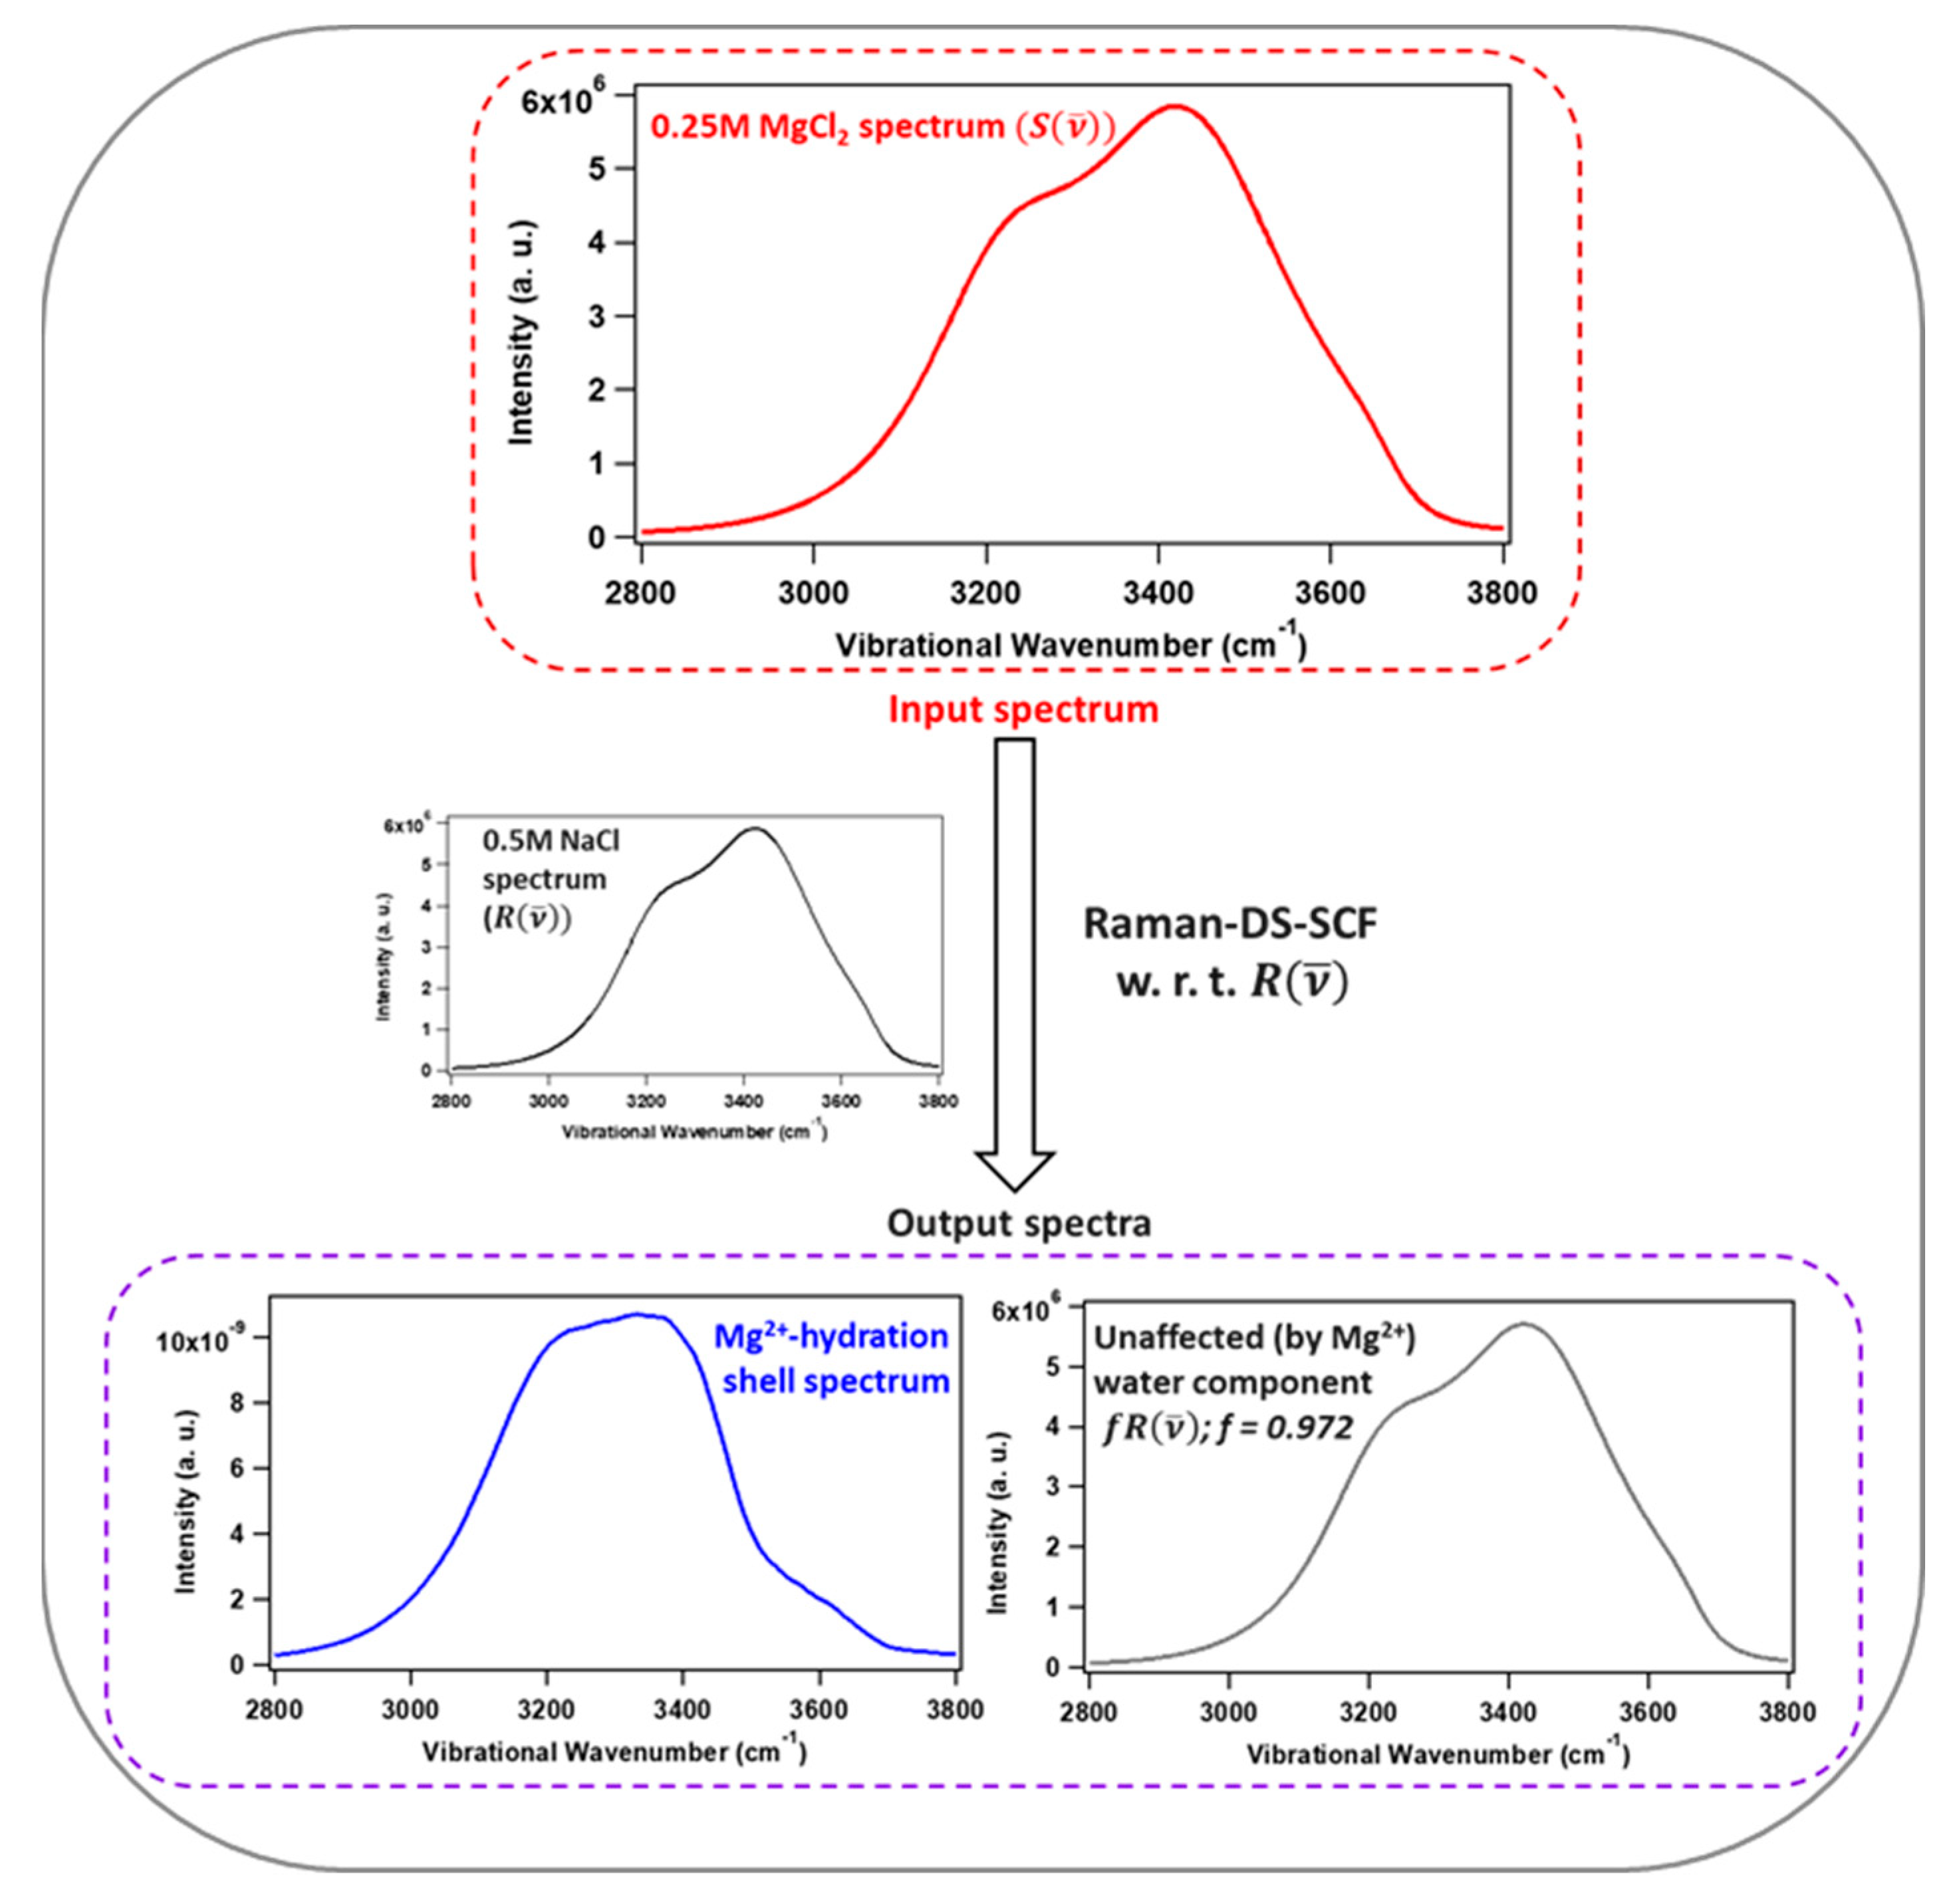
2. Raman-DS-SCF Analysis and Ion Hydration Shell

For the DS-SCF analysis, the Raman spectrum of a dilute electrolyte solution (~sub molar concentration) is considered as a linear combination of three spectral components: (1) vibrational response of the solute/ion (if any), (2) spectrum of the water that is perturbed by the ion/solute and (3) spectrum of the unperturbed water that is equivalent to the spectrum of the bulk water. Components 1 and 2 are associated with the solute and its hydration shell water, which is combinedly treated as the ion/solute-perturbed spectrum or the hydration shell spectrum. While subtracting the bulk-like water spectrum (reference spectrum; R ( ν ¯ ) ) from the solution spectrum ( S ( ν ¯ ) ), the emerging perturbed-water spectrum, along with the inherent vibrational bands of the solute (if any), is fitted with a combination of Gaussian bands following Equation (1).
S ( ν ¯ ) f R ( ν ¯ ) = n = 1 n ( A n e ( ν ¯ ν ¯ n ) 2 2 Γ n 2 ) + A 0
where f is the “appropriate fraction” of the reference spectrum ( R ( ν ¯ ) ) subtracted from the dilute solution spectrum ( S ( ν ¯ ) ). A n , ν ¯ n and Γ n are the amplitude, center frequency and fwhm of the nth band in components 1 and 2 (i.e., solute/ion’s own vibrational bands and that of the perturbed water). A 0 is a constant that takes care of the difference in constant background (if any) between the solution and reference spectra.
Figure 1 depicts the S ( ν ¯ ) for 0.25 M aqueous MgCl2, R ( ν ¯ ) corresponding to the 0.5 M aqueous NaCl and the Raman-DS-SCF-extracted hydration shell spectrum of Mg2+ ion. Instead of the neat water, a 0.5 M NaCl solution was chosen as the reference ( R ( ν ¯ ) ) , because the latter contains the same concentration of Cl (counter-ion) as in the 0.25 M aqueous MgCl2, such that the effect of the counter ion (Cl) is nullified in the DS-SCF-extracted spectrum, representing the hydration shell water of Mg2+. To be precise, the Mg2+ hydration shell spectrum shown in Figure 1 is the response of the Mg2+-associated water relative to that of Na+; however, due to the subtle influence of Na+ (on water) [45], the perturbed water spectrum predominantly represents the hydration shell response of Mg2+.
As can be seen in the hydration shell spectrum of the Mg2+ ion (blue curve, Figure 1), a weak band in the high-frequency region (~3600 cm−1) is distinctly visible in the Raman-DS-SCF extracted spectrum. Such subtle spectral features are not so obvious in the corresponding Raman-MCR-extracted Mg2+ hydration shell spectrum [43]. Moreover, unlike in the case of Raman-MCR, the Raman-DS-SCF extracted spectrum is not area-normalized, and hence retains quantitative information of the perturbed hydration shell water to a great extent [42]. The DDIR approach also applies difference spectroscopy and curve fitting, but the “fitting” analysis is carried out after the completion of the “subtraction” process [46,47,48], while in Raman-DS-SCF, the “subtraction” and “curve fitting” are carried out simultaneously with the gradual (small-step) increments of the ‘f’ factor while readjusting the Gaussian fitting coefficients. For the electrolytes with the dominant effect of the counter ion, unlike the DDIR, Raman-DS-SCF and Raman-MCR use an appropriate reference spectrum to automatically subtract the counter ion influence so that the subtracted spectrum is predominantly from the ion in question. Nevertheless, it is important to note that both Raman-MCR and Raman-DS-SCF are biased towards the perturbed water in the hydration shell, and the hydration water component having bulk-like vibrational response is not retained in the extracted spectrum.

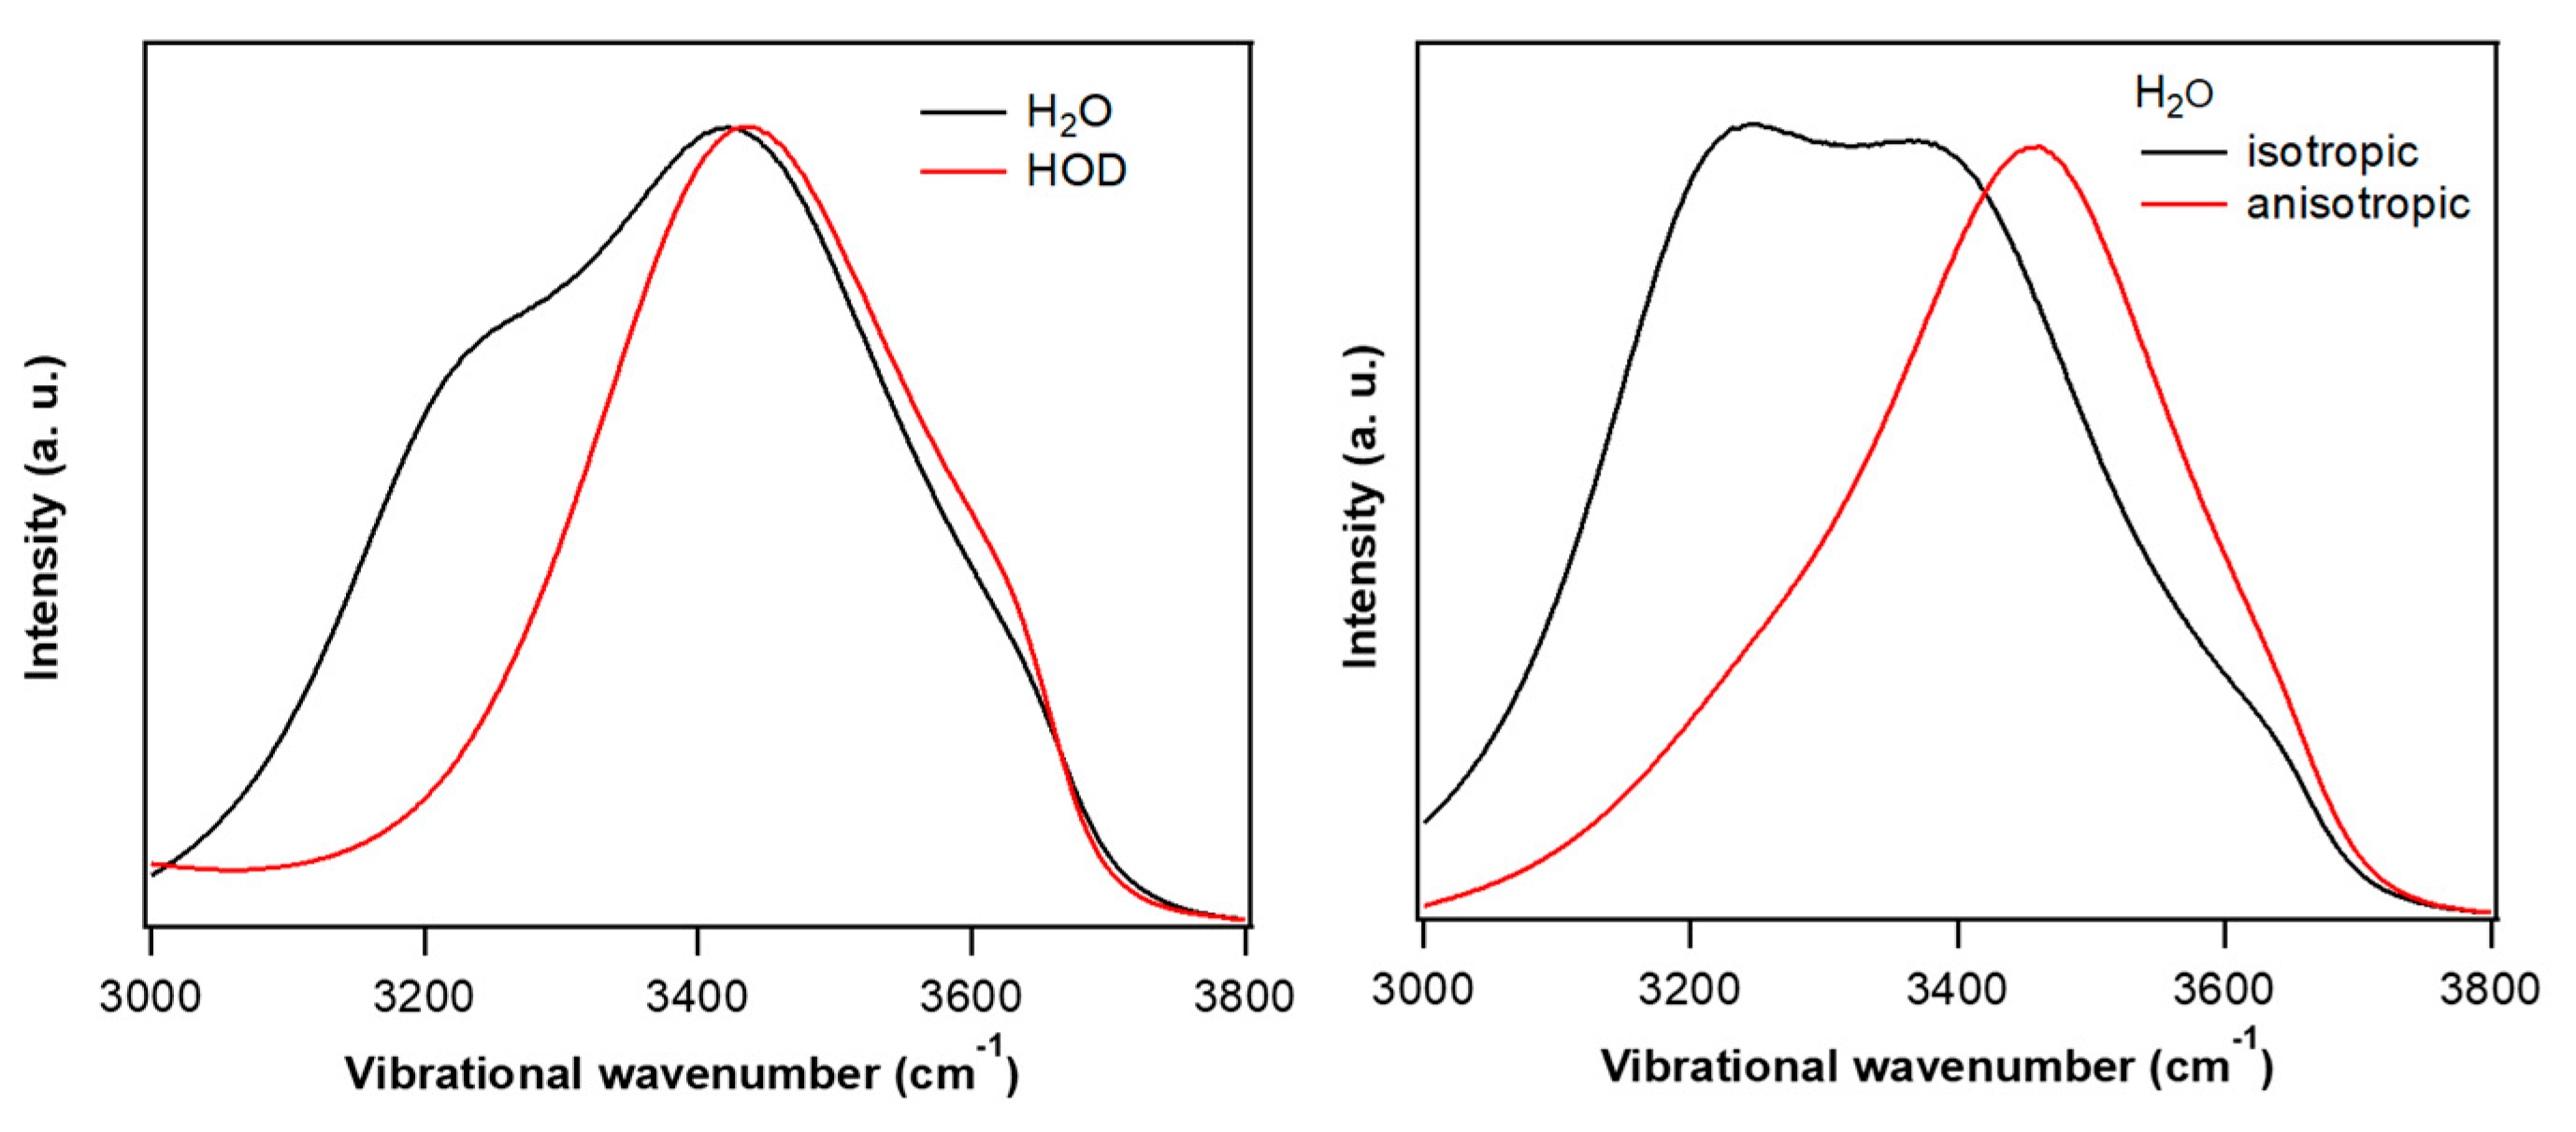
3. OH Stretch Spectra of Neat Water

The Raman OH stretch (3000–3800 cm−1) spectrum of water is affected in the presence of dissolved ions/solutes. These spectral changes are better understood by comparing the solution spectrum with the neat-water spectrum. Therefore, it important to briefly discuss the OH stretch spectrum of neat water. The Raman spectrum of neat water (Figure 2) shows a broad band in the OH stretch region, with a maximum at ∼3420 cm−1 and shoulders at ∼3250 and ∼3620 cm−1. The frequency of OH stretch vibration is strongly correlated with the H-bond strength: strengthening of the H-bond makes the parent O–H bond weaker, leading to a shift in the O–H stretch frequency to a lower wavenumber, termed the ‘red-shift’. Similarly, the weakening of H-bonding causes a shift in the O–H stretch frequency to a higher wavenumber, termed the ‘blue-shift’. However, the intramolecular vibrational coupling between the HOH-bend overtone and O–H stretch fundamental, called Fermi resonance (FR), as well as the intra- and intermolecular vibrational coupling of the OH-stretch, change the line shape of the OH stretch spectrum of water, barring its straightforward interpretation solely on the basis of the strength of H-bonding [37,49,50,51,52]. To correctly interpret the spectral change due to H-bonding, generally isotopically diluted water (HOD; a mixture of H2O and D2O) is used instead of isotopically pure H2O or D2O. An appropriate mixture of H2O and D2O (e.g., H2O:D2O = 1:9, v/v) is free from the intra- and intermolecular vibrational coupling due to the energetic mismatch of intramolecular vibrational modes (OD and OH stretches) and the bend overtones. As can be seen in Figure 2a, the peak-normalized OH stretch spectrum of HOD has substantially lower intensity around 3200 cm−1 compared to that of H2O. This indicates that the 3200 cm−1 band of water is predominantly due to intra- and inter-molecular vibrational coupling and Fermi resonance. Polarized Raman measurement provides the symmetry information of the vibrational bands. The lower-frequency region (<3300 cm−1) is dominated in the isotropic Raman spectrum, whereas the higher frequency region (>3300 cm−1) is dominated in the anisotropic spectrum (Figure 2b). The isotropic Raman spectrum of neat water is dominated by the symmetric OH stretch that are coupled in-phase with the symmetric OH stretch modes of neighboring water molecules and that appear towards the lower-frequency region of the OH stretch band [49]. The band shape of the anisotropic Raman spectrum is similar to the unpolarized Raman spectrum of HOD and assignable to the antisymmetric OH stretch mode of water. Thus, the isotopic dilution and polarized Raman measurements show that the spectral response at ∼3250 cm−1 region is dominated by the symmetric OH stretch that are intra- and intermolecularly coupled along with FR. The band at ∼3420 cm−1 represents the average H-bond strength of bulk water (free from coupling effects). The extreme high-frequency shoulder around 3620 cm−1 mainly corresponds to the very weakly H-bonded water or the water–OH with broken H-bonds (free OH) that exists transiently during the switching of the H-bonded partner among water molecules [53,54]. Thus, at any instant, bulk water can be thought of a mixture of water species with continuously varying H-bond strengths.

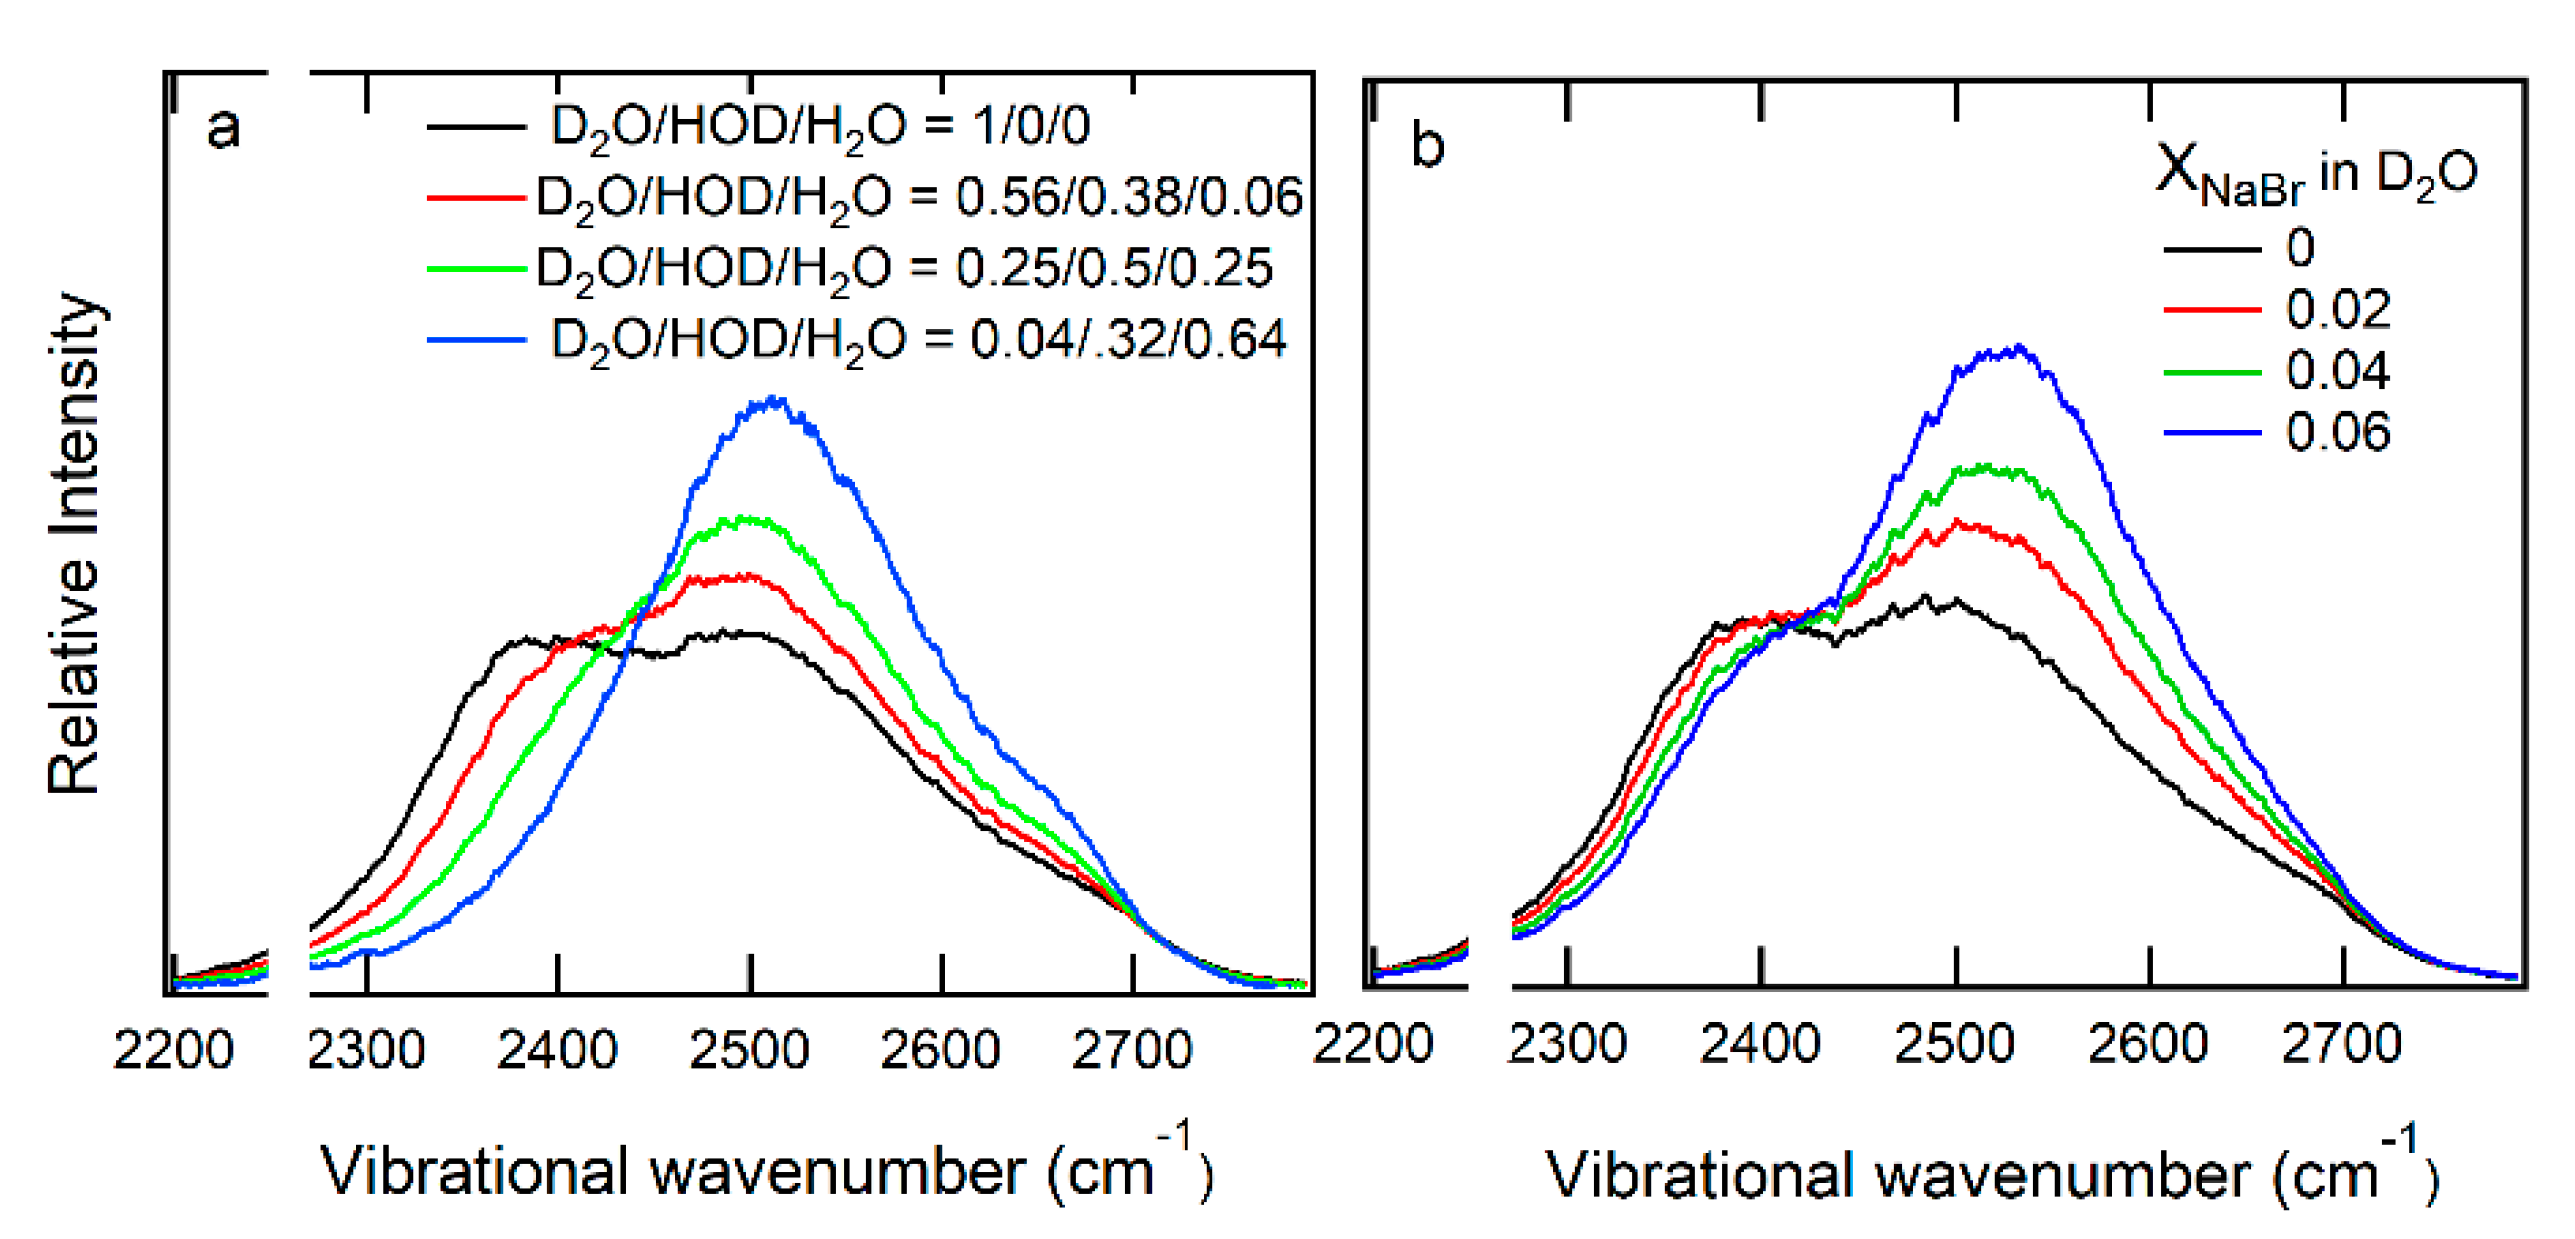
4. Effect of Electrolytes on the OH Stretch Raman Cross-Section and Vibrational Coupling of Water

Coupling among the vibrational modes in liquid water has a close relation with its structure and properties. For instance, strong intramolecular vibrational coupling leads to ultrafast energy delocalization among different intramolecular vibrational modes of a water molecule; while strong intermolecular coupling does the same among several water molecules (collective vibration) [51,55]. These ultrafast elementary processes play pivotal roles in water-mediated energy dissipation processes. Figure 3a shows the effect of isotopic dilution on the OD stretch spectrum of D2O. With an increasing percentage of H2O in D2O, the intensity around 2350 cm−1 (corresponding to the 3200 cm−1 for the OH stretch) decreases and that around 2500 cm−1 increases, making the overall spectrum narrower and blue-shifted compared to D2O. These spectral changes suggest the reduction of Fermi resonance and vibrational decoupling in D2O due to the addition of H2O (isotopic dilution). Interestingly, the addition of electrolytes, such as NaBr, has a similar effect on the OD stretch of D2O (Figure 3b). Except NaF, all other Na-halides lead to such a spectral change in the OD (or OH) stretch regions. Thus, the spectral change in Figure 3a,b indicates the reduced coupling (VC and FR) of water in the presence of NaX (X = Cl, Br, I) [37,45]. The reduction of coupling could be due to the change in OH stretch frequency (variation in H-bond strength) and the preferred orientation of water in the hydration shell of the ions. Quantitative estimation, on the basis of integrated Raman intensity, revealed that the Raman cross section increases in the presence of the halide ions, except F.

5. Hydration Shell of Ions

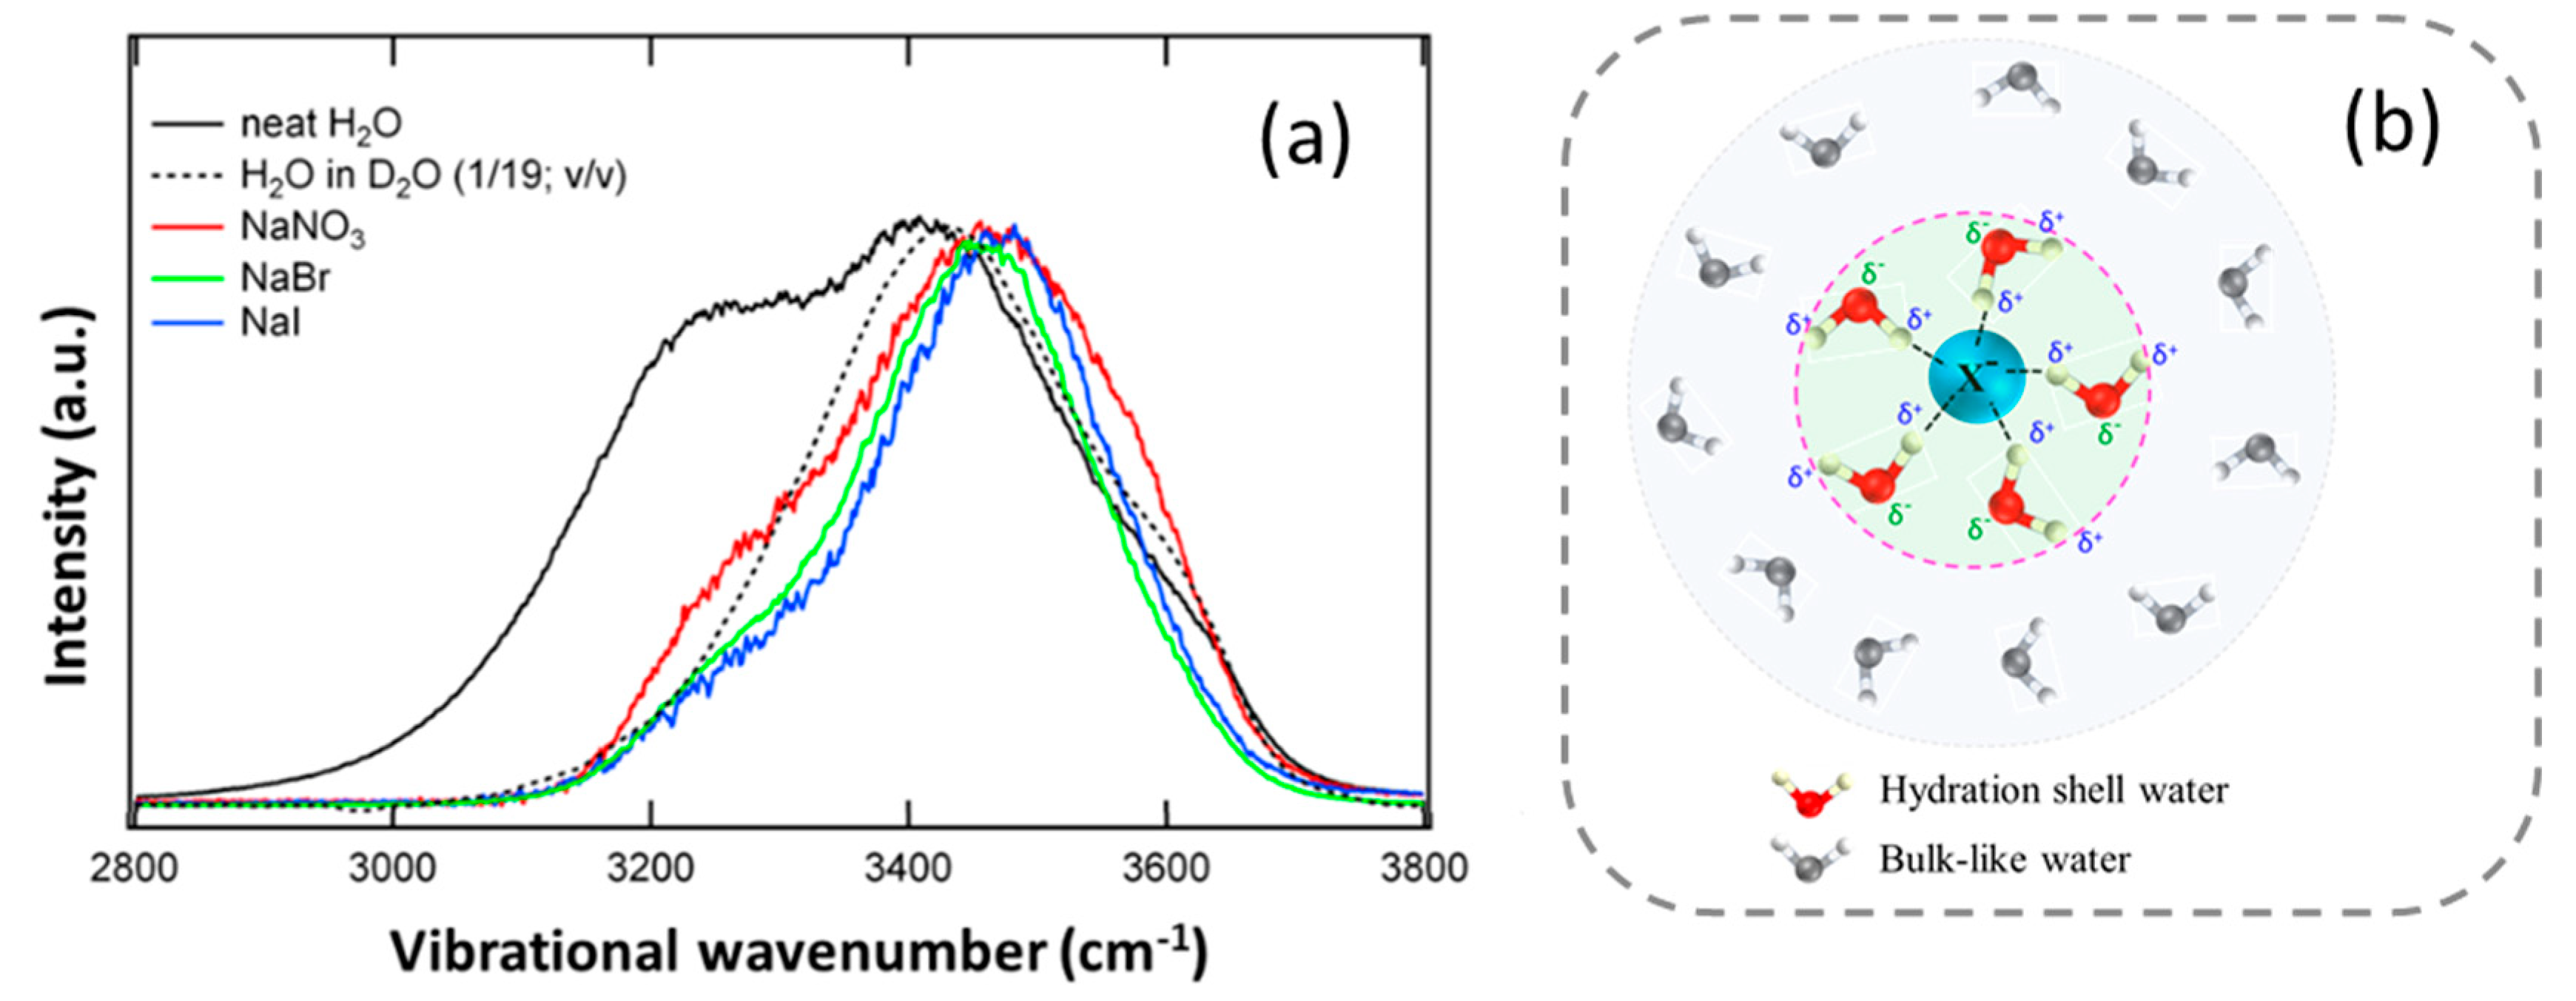
5.1. Water in the Hydration Shell of a Low-Charge-Density Monovalent Anion

Water interacts with anions through its hydrogen atom by forming an H-bond with the latter. The E-field around the ion reorients the water in the hydration shell such that the water–Hs are pointed ‘towards’ the hydrated anion and ‘away’ from the hydrated cation, following the law of electrostatics. Figure 4a shows the Raman spectrum of neat water and the MCR-extracted hydration shell water spectra of different monovalent anions. It is important to note that, for the hydration shell of low-charge-density anions, the band shapes of the MCR-extracted spectra are very similar to the Raman-DS-SCF-extracted spectra (not shown here). It is obvious that the spectral responses of hydration water are markedly different from the Raman spectrum of the bulk water. To examine the H-bond strength of water in the vicinity of ions, it is reasonable to compare the OH stretch spectra of hydration water with that of HOD, in which the intermolecular coupling of OH stretch modes is largely suppressed. The maxima of the OH stretch Raman band of the hydration water of the monovalent halide anions (Br, I) lie in the higher-frequency region (blue-shift) compare to that of HOD (Figure 4a), indicating weaker average H-bond strength of water in the hydration shell of the halide anions [36,39,45]. A similar spectral change was also observed for Cl (spectrum not shown here) [39]. Moreover, the extent of the blue-shift of the hydration water spectra (OH stretch) follows the order of the increasing size of the anions, i.e., Cl < Br < I. A triatomic monovalent anion with lower charge density than I (e.g., I3) shows a further decrease in the average H-bond strength of the hydration water than that of the I [56,57,58]. The monovalent NO3 anion also weakens the H-bond strength of its hydration shell water (Figure 4a) [36,44,59]. Further analysis of the integrated area of the 3250 cm−1 band with that of the H2O and HOD (decoupled OH) suggested a significant reduction (~80%) of the combined coupling effects (intermolecular coupling and Fermi resonance) in the vicinity of halide ions relative to the bulk water [36].

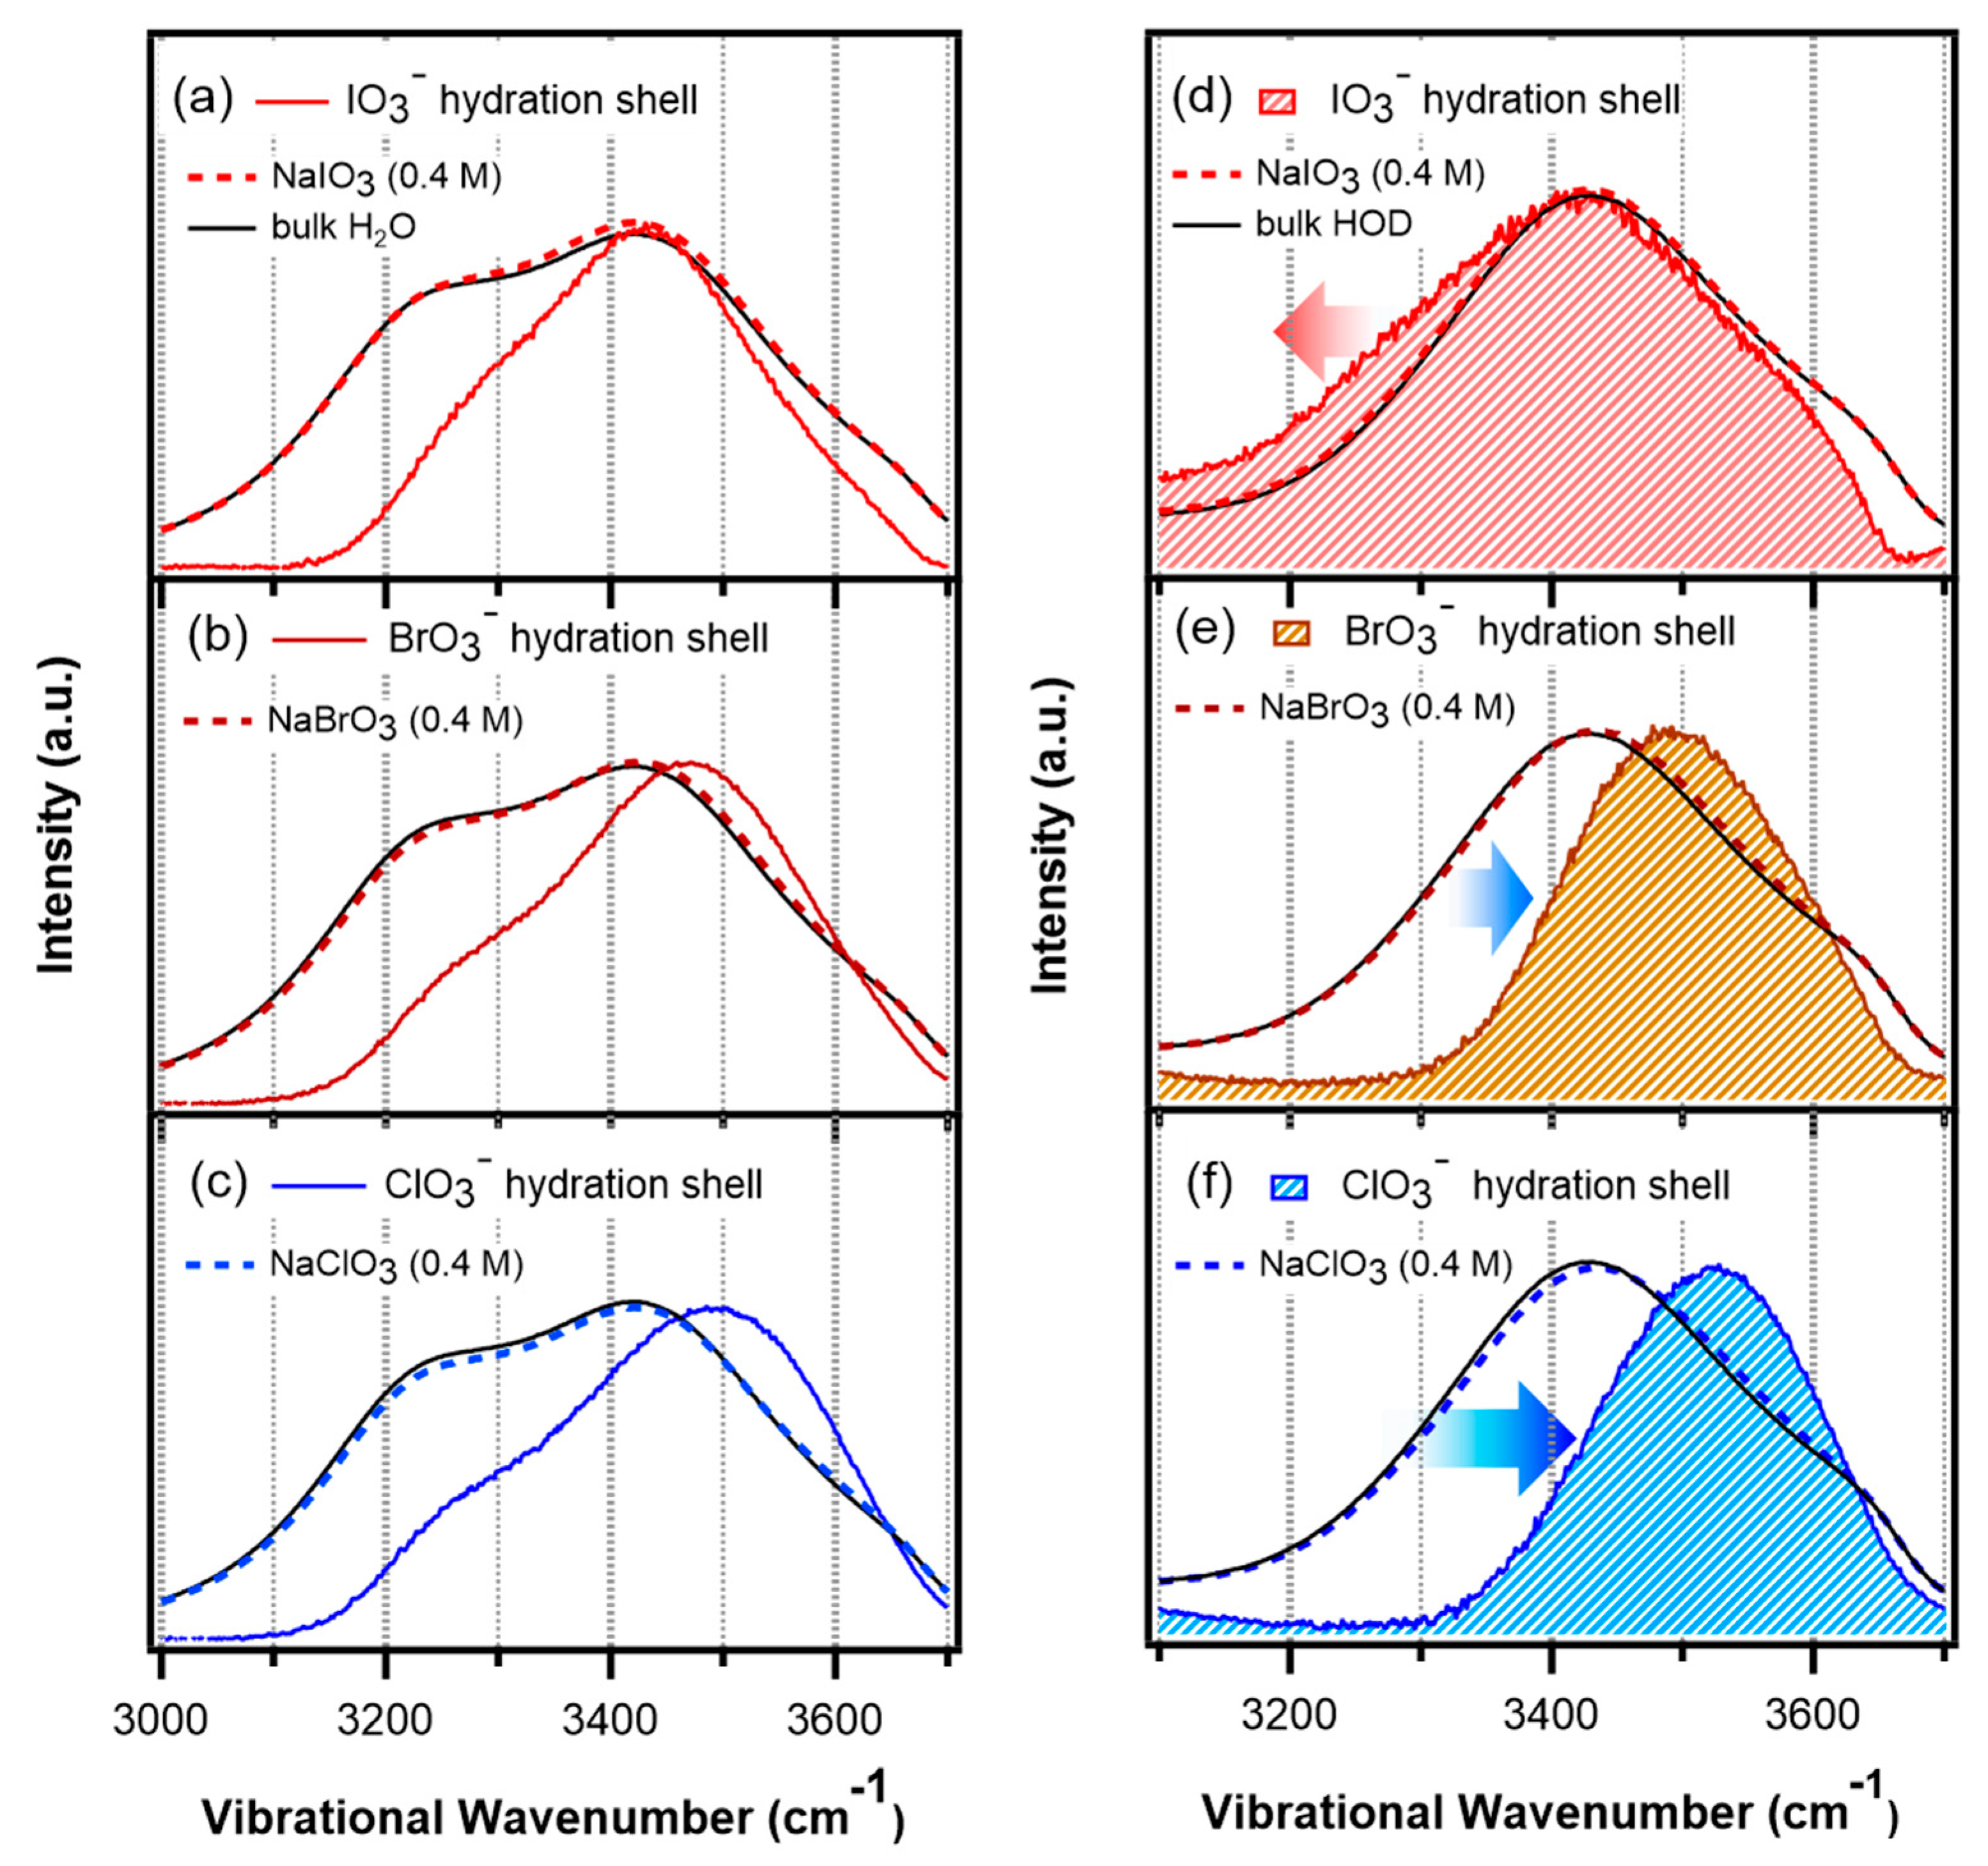
5.2. Hydration Shell of Monovalent Oxyhalide Anion

Although the halide ions weaken the H-bond strength of hydration water in the order Cl < Br < I, the oxyhalide ions affect the surrounding water differently. Figure 5a–c shows the hydration shell water spectra of ClO3, BrO3 and IO3 anions in H2O. The band maximum is gradually blue-shifted (shifted to the high-frequency side) as the central halogen atom changes from I to Br to Cl. The relative intensity of the 3200 cm−1 shoulder band is decreased due to reduced vibrational coupling and the Fermi resonance of water in the hydration shell of the oxyhalide anions, as has been observed with the halide ions [36,45]. The hydration shell spectra in HOD (Figure 5d–f) show that the OH stretch band maximum is blue-shifted by ~100 cm−1 and ~70 cm−1 for ClO3 and BrO3, respectively, while in the case of IO3, the relative intensity in the low-frequency region (below 3400 cm−1) is enhanced. Hence, ClO3 and BrO3 weaken the H-bond strength of their hydration water following the order ClO3 > BrO3, whereas IO3 is strengthened the same [60]. Using MD simulation and XAFS spectroscopy, Baer et al. showed that the central iodine atom of IO3 possesses a positive charge, while each of the three oxygen atoms bears a negative charge [61], which indicates two distinct hydration environments around the iodate ion corresponding to the cationic iodine and anionic oxygen atoms, respectively. MD simulation also revealed that the vibrational power spectra and distributions of different types of H-bonded water molecules hydrating the iodate-oxygens are very similar to that of bulk water [62]. Hence, the cationic iodine (of iodate) predominantly affects the structure of surrounding water. Thus, unlike the weakly interacting I anion, in spite of having an overall negative charge, IO3 effectively behaves as a hydrated cation in aqueous solution which makes the H-bonds of surrounding water stronger. The asymmetric hydration of IO3 in aqueous KIO3 solution has also been suggested by Raman-MCR study [56]. The MD simulation of BrO3 ion in water suggested that anionic oxygens (of BrO3) affect the hydrating water to a greater extent than the cationic bromine (of BrO3) and that the average strength of BrO3–water H-bonding is weaker than that of water–water in bulk [63].

5.3. Hydration Shell of High-Charge-Density Anions

For the high-charge-density anions, the Na-salt of F and CO32− anions has been analyzed with respect to the bulk water using Raman-DS-SCF analysis. The hydration water spectrum of F shows enhanced absorption (compared to neat water) in the low-frequency region of the OH stretch up to 2600 cm−1 (Figure 6) [64]. This indicates the strong H-bonding of water with the F ion. MD simulation also suggested that the reorientation dynamics of water in the first hydration shell of F is much slower than that of I, invoking stronger F−…H2O H-bonding [65]. Divalent CO32− anion perturbs the H-bond strength of hydration water quite similar to that of F, although the average number of water molecules perturbed per CO32− anion is greater than that of F (Figure 6) [64]. In the hydration shell Raman spectrum of CO32− and F ions in H2O, a new band appears in the lower-frequency region (~3050 cm−1) suggesting the presence of a very strong H-bond in hydration water [39,64]. Thus, unlike the low-charge-density monovalent ions (Cl, Br, I, ClO3, BrO3), higher-charge-density anions, such as F and CO32−, increase the average H-bond strength of water in their hydration shell compared to that of bulk water. The dip feature around 3200 cm−1 in the hydration shell spectra in H2O is due to the decoupling of the vibrational modes of water in the hydration shell of the ions; the dip feature is largely reduced in HOD. Hence, the structure of water in the hydration shell of CO32− and F is more inhomogeneous compared to bulk water. It is believed that two different types of water molecules exist in the hydration shell of the ions: water in the first hydration shell forms a very strong H-bond (~3050 cm−1) with the carbonate oxygen (or F), and water in the second hydration shell has an H-bond strength weaker than the first hydration shell but stronger than bulk water. In agreement with this, the calculated (MD simulation) stretch frequency of the water–OD, directly H-bonded to the CO32− oxygen, is red-shifted (i.e., shifted towards low frequency region) from that of bulk-water–OD, whereas the stretch frequency of the second hydration shell water lies in between that of the bulk and first hydration shell water [66]. These observations certainly indicate that the CO32− anion has a long-range effect on neighboring water molecules that goes beyond the first hydration shell.
In the case of SO42−, a distinct band around 3250 cm−1 is clearly visible is the hydration shell spectrum (in HOD; Figure 6e), though the band is not as intense as that with CO32−. In agreement with the OH stretch, the analysis of the HOH bending band revealed stronger H-bonding in the hydration shell of SO42− [39]. The difference spectroscopy-based IR methods in the OD stretch region also suggested that water forms H-bonds with sulfate ions stronger than that between two water molecules in bulk water [44,59]. Kameda et al. showed that the intermolecular H-bonded O–O distance between sulfate and water (in aqueous sulfuric acid solution) is shorter than that of pure water, suggesting a strongly H-bonded intermolecular interaction [67].
As expected, the trivalent PO43− anion induces the strong H-bonding of water in the hydration shell [36]. The Raman spectrum of aqueous PO43− solution in the low-wavenumber region (hindered translation of the H-bonded water molecules or the H-bond stretch) also confirmed the formation of strong P–O…H bonds in solution [68]. One interesting feature of the hydration shell water spectrum is that, unlike the case of other anions, the shoulder near 3600 cm−1, which represents weakly interacting or under-coordinated water–OH, is not reduced for PO43− [36]. Furthermore, Raman measurements of aqueous K3PO4 solutions showed a polarized shoulder band at ~3620 cm−1, which increased slightly in intensity with increasing concentration (range 0.7–5.3 M) of the salt [68]. Chandra and co-worker calculated the OD stretch frequencies in the hydration shells of PO43− [69]. They showed that the stretch frequency of OD in the first hydration shell that directly forms an H-bond with the anion is considerably red-shifted compared to the bulk water; whereas the other OD (of the same water forming an H-bond with the anion) stretch is blue-shifted and has significant overlap with the band of non-H-bonded OD in bulk water. On the basis of this observation, the authors speculated the existence of weakly H-bonded (compared to water–water in bulk) water–OD in the first hydration shell of the PO43− anion.

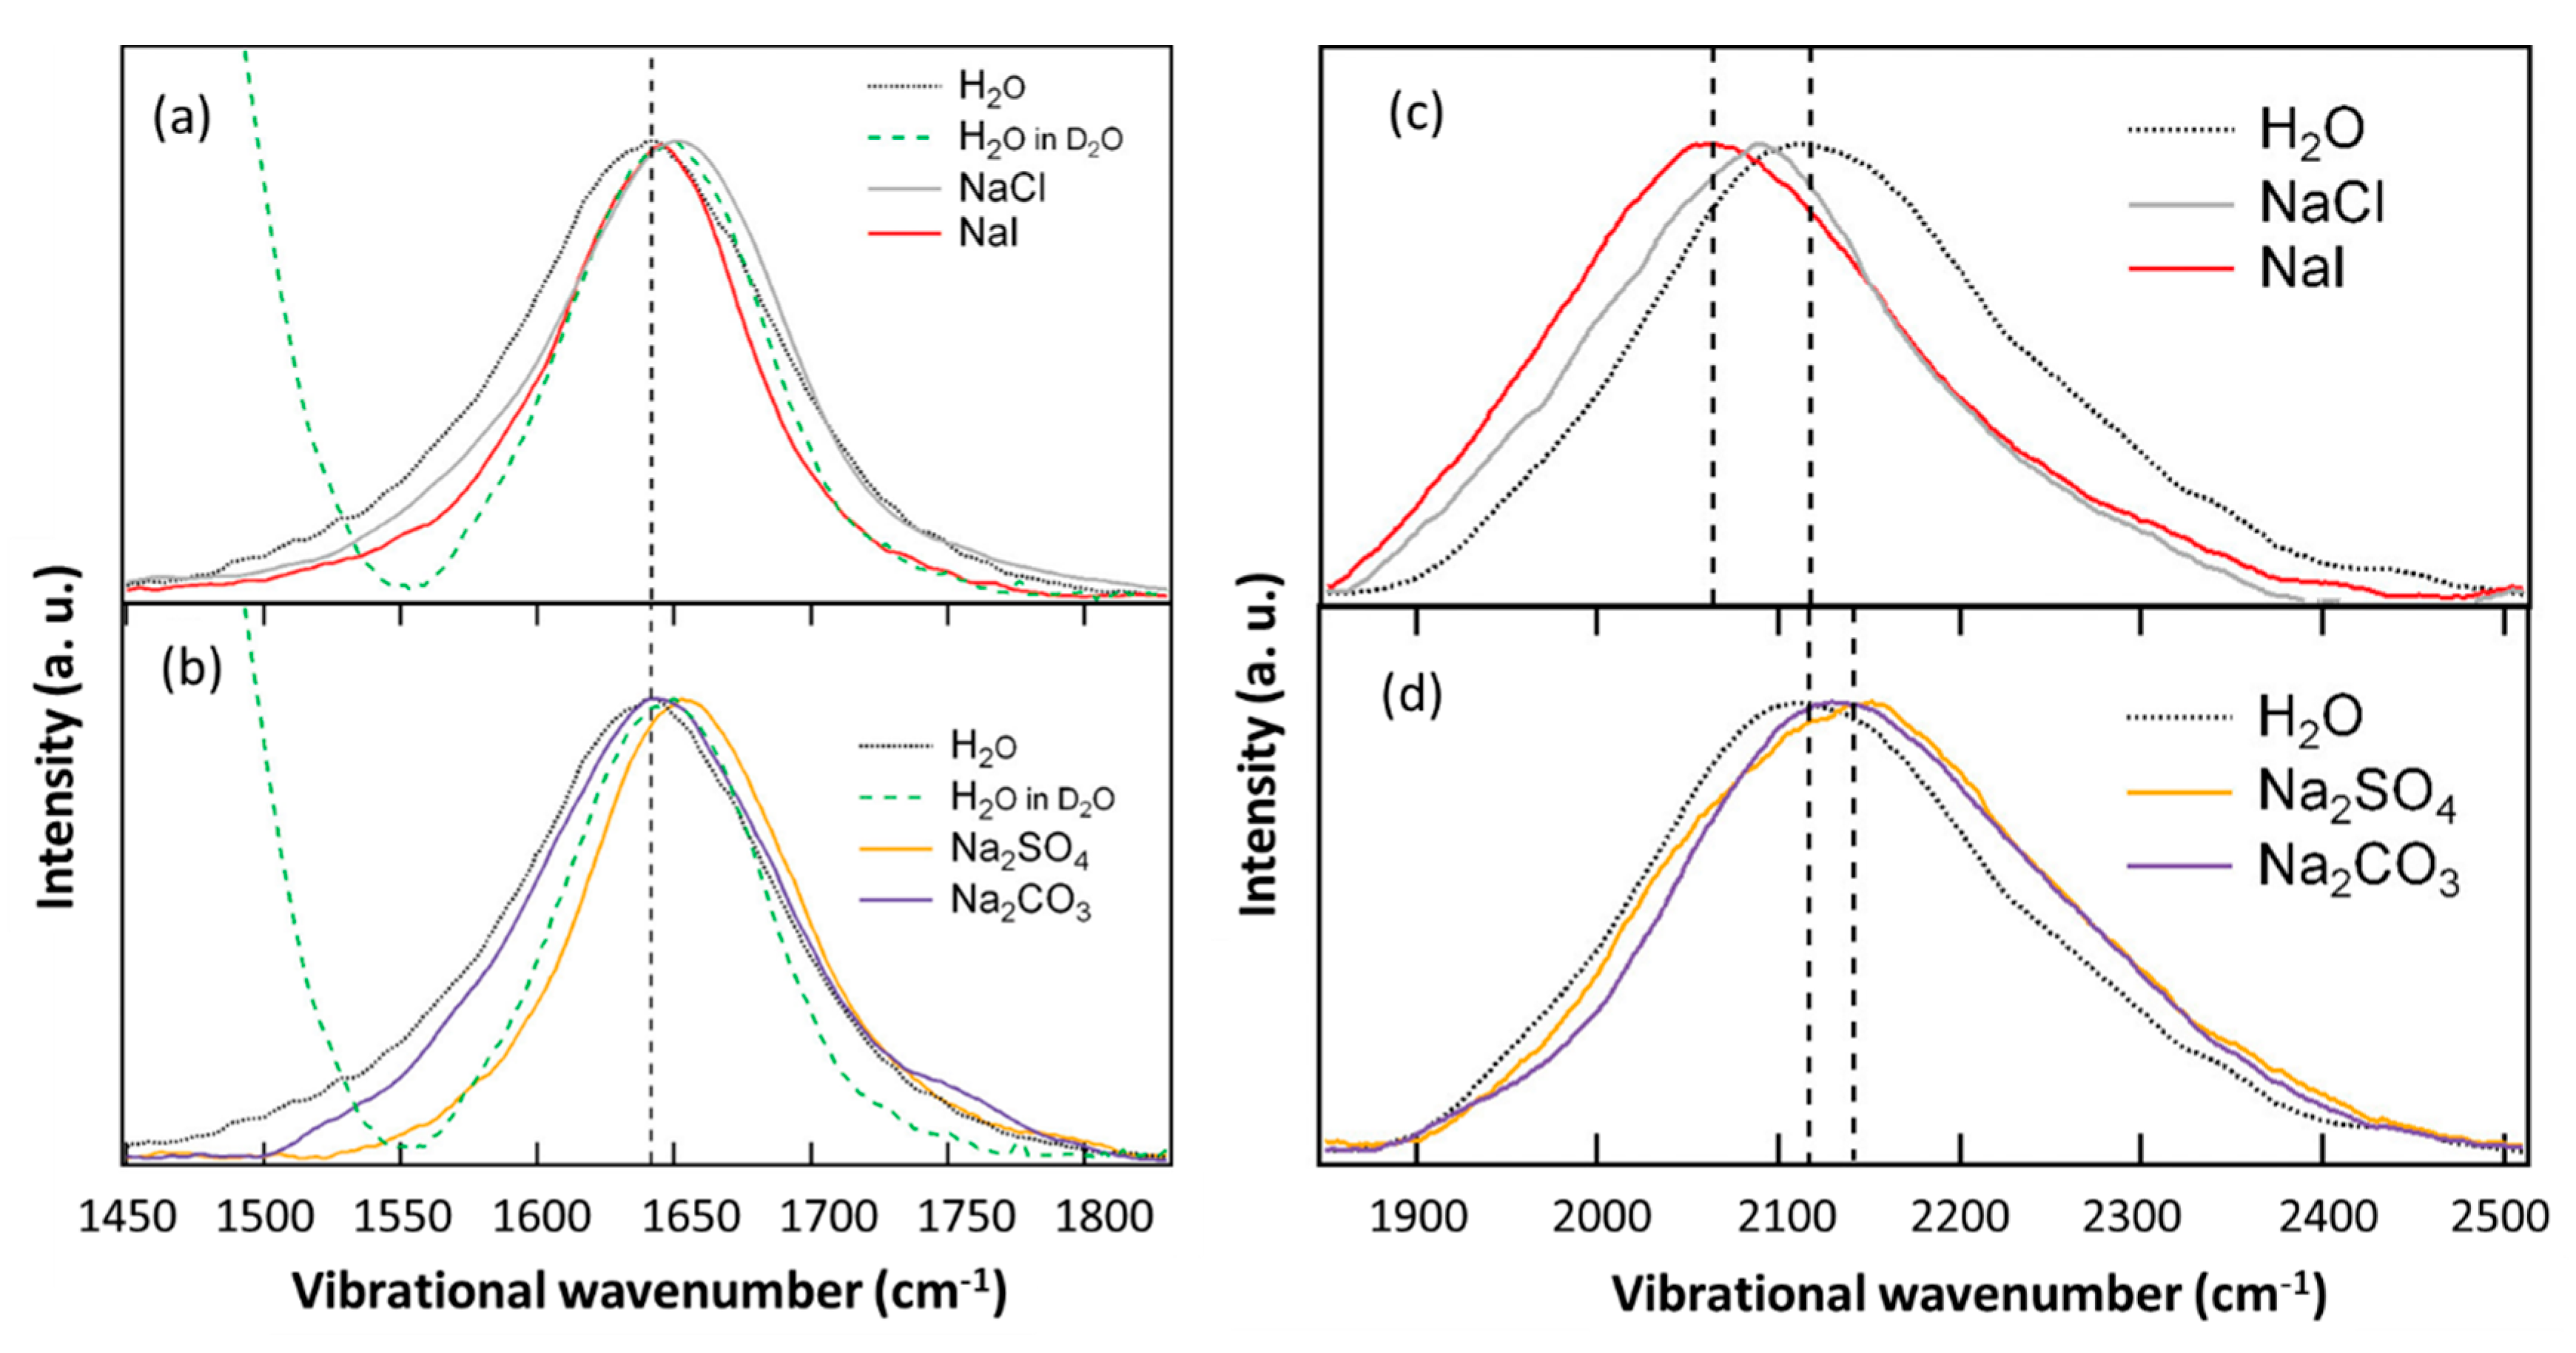
5.4. HOH Bend and Bend+Libration Combination Band of Water in the Anion Hydration Shell

The restricted rotational motions of water in the H-bonded network are termed as librational motions that play an important role in the energy transfer mechanism in liquid water. It has been suggested that, unlike fast intermolecular stretch-to-stretch energy transfer in water, intermolecular bend-to-bend transfer is much slower [70]. Rather, librational motions randomize the orientation of the HOH bending mode transition dipole moment much faster, and thus, the vibrational energy of the HOH bending mode is primarily released to the librational modes.
In the Raman spectrum of neat water, the HOH bend vibration of water appears at ~1640 cm−1 [71]. As the H-bond strength of water increases, the HOH bending motion becomes more restricted. Therefore, the HOH bending band of water is expected to be blue-shifted (red-shifted) in the hydration shell of ions, where the water H-bond is strengthened (weakened). Upon isotopic dilution, the HOH bend maximum is blue-shifted by ∼10 cm−1 and the spectral width is decreased due to vibrational decoupling (compare the black dotted and green dashed curves in Figure 7a,b). As can be seen in Figure 7a,b, the hydration shell spectra for Cl, I and SO42− ions are blue-shifted and have lower spectral width than that of neat H2O, indicating that the HOH bending mode of water in the hydration shell of these anions are decoupled from the neighboring water molecules. On the contrary, the hydration shell spectrum for CO32− showed comparable spectral width to that of bulk H2O (Figure 7b). It is likely that the larger spectral width (compared to that of other anions) for CO32− is because of the greater distribution of H-bond strength in the hydration shell.
Water librations represent a broad band over 300–1000 cm−1 in the Raman spectrum of neat water [8,72]. In fact, this broad librational response is composed of three overlapped bands (centered at ~450, ~580 and ~720 cm−1) arising from water librations about the three axes of rotation [72,73,74]. The librational band of water is red-shifted with increasing temperature signifying increased librational freedom because of the weakened H-bonding of water at elevated temperatures [75]. Hence, it is expected that the ions that induce the weakening (strengthening) of the H-bond strength of neighboring water will increase (decrease) the librational freedom of the hydration water. The bend+libration combination band of hydration water is red-shifted for monovalent Cl and I compared to the neat water (~2130 cm−1), while it is blue-shifted for divalent SO42− and CO32− (Figure 7c,d). The calculated librational band positions revealed that water molecules in the hydration shell of the monovalent Cl and I weakly interact with vicinal water and have higher librational freedom than bulk water [39]. Conversely, water in the immediate vicinity of divalent (strongly interacting) anions such as SO42− and CO32− have more restricted librational mobility compared to bulk water [39].

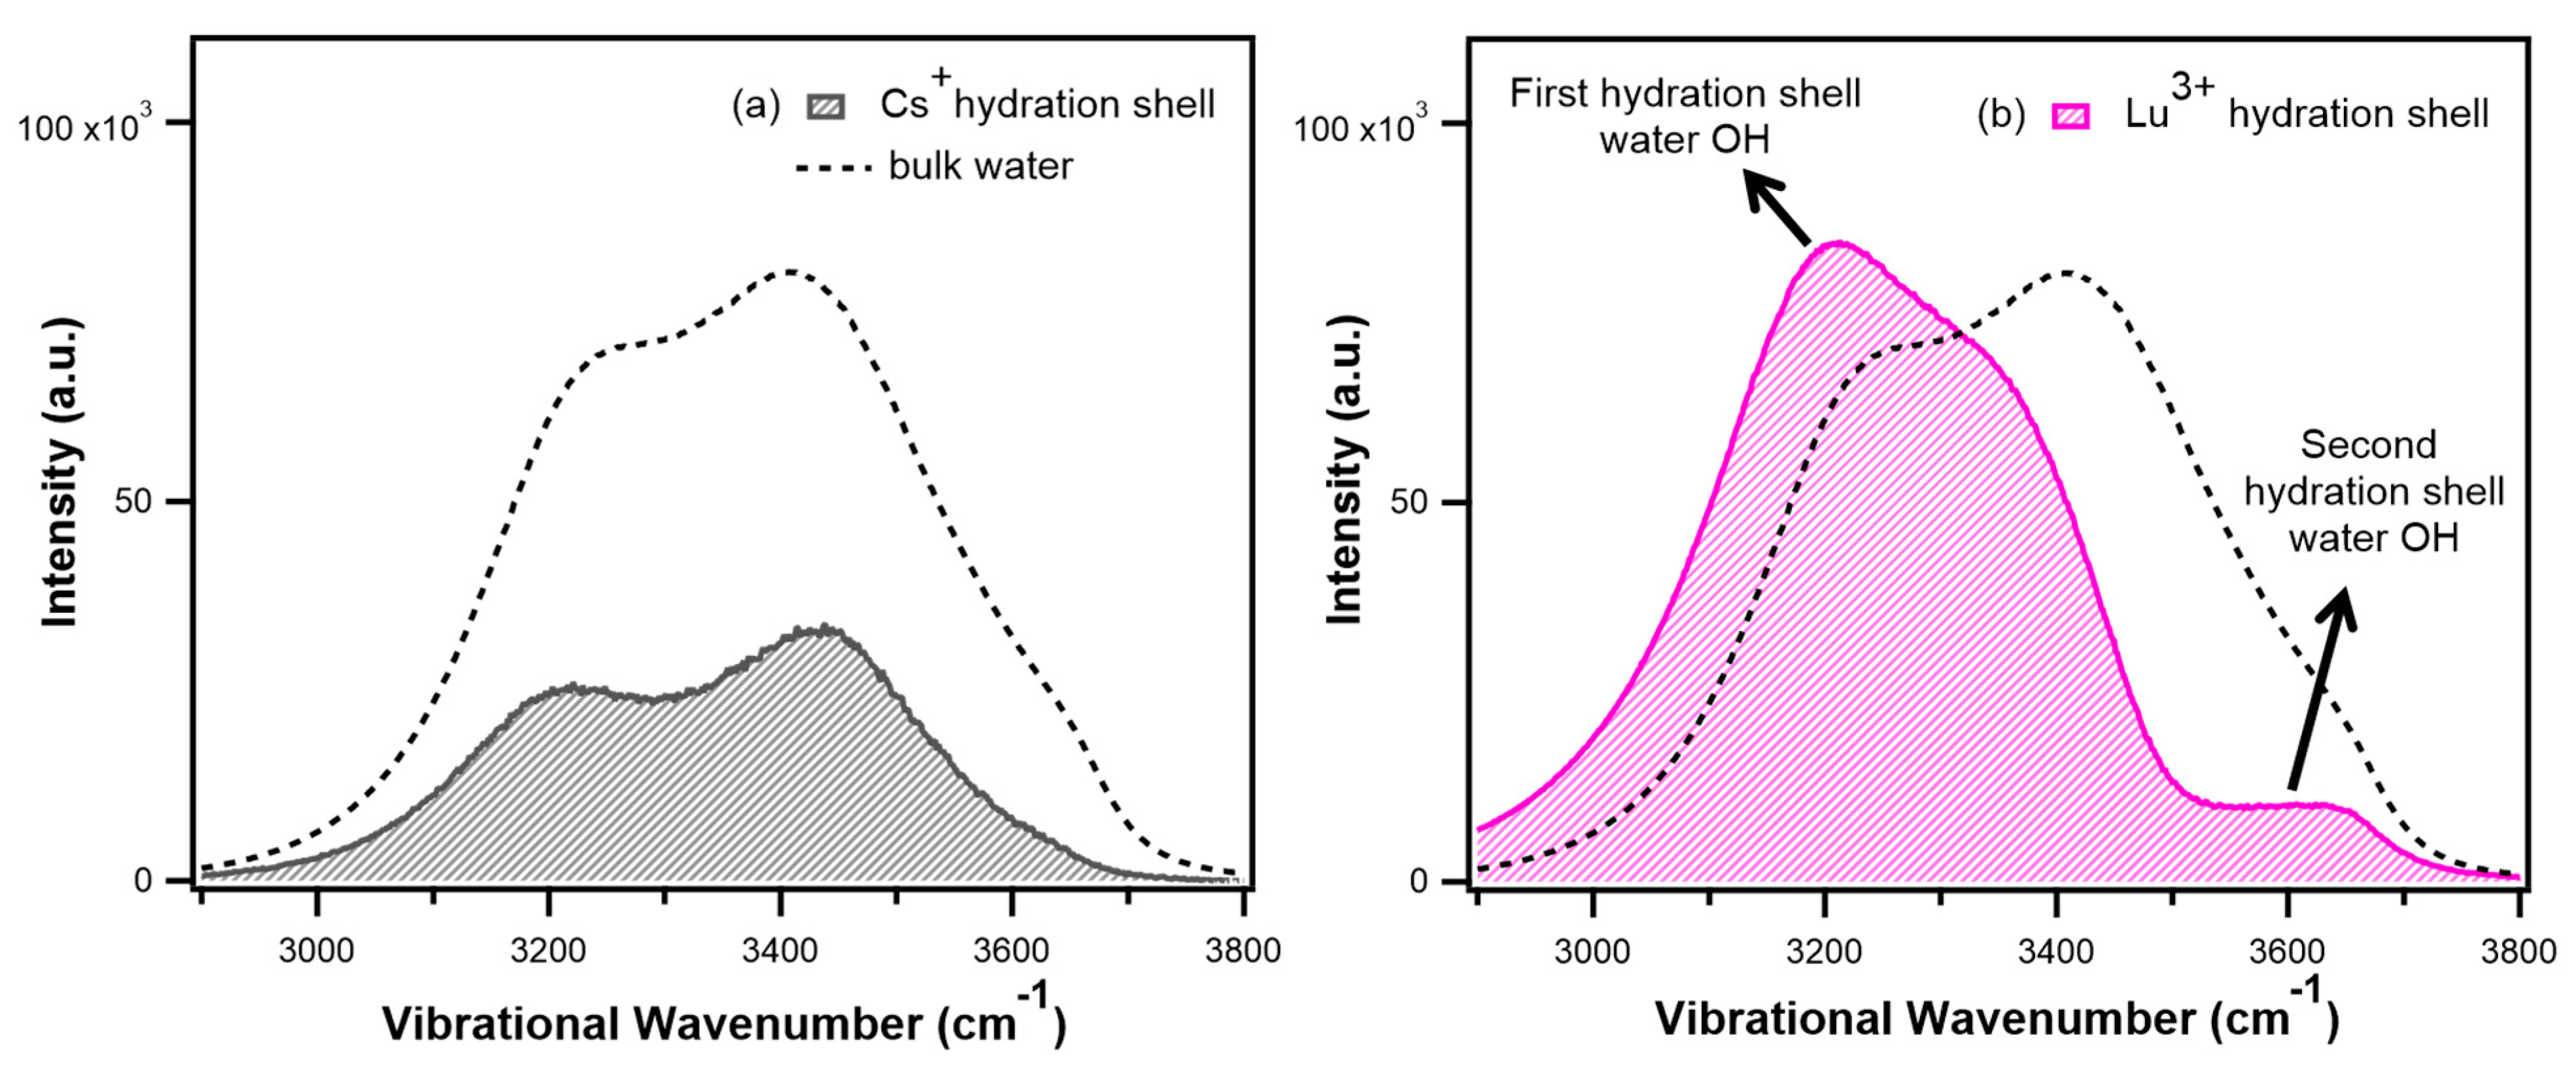
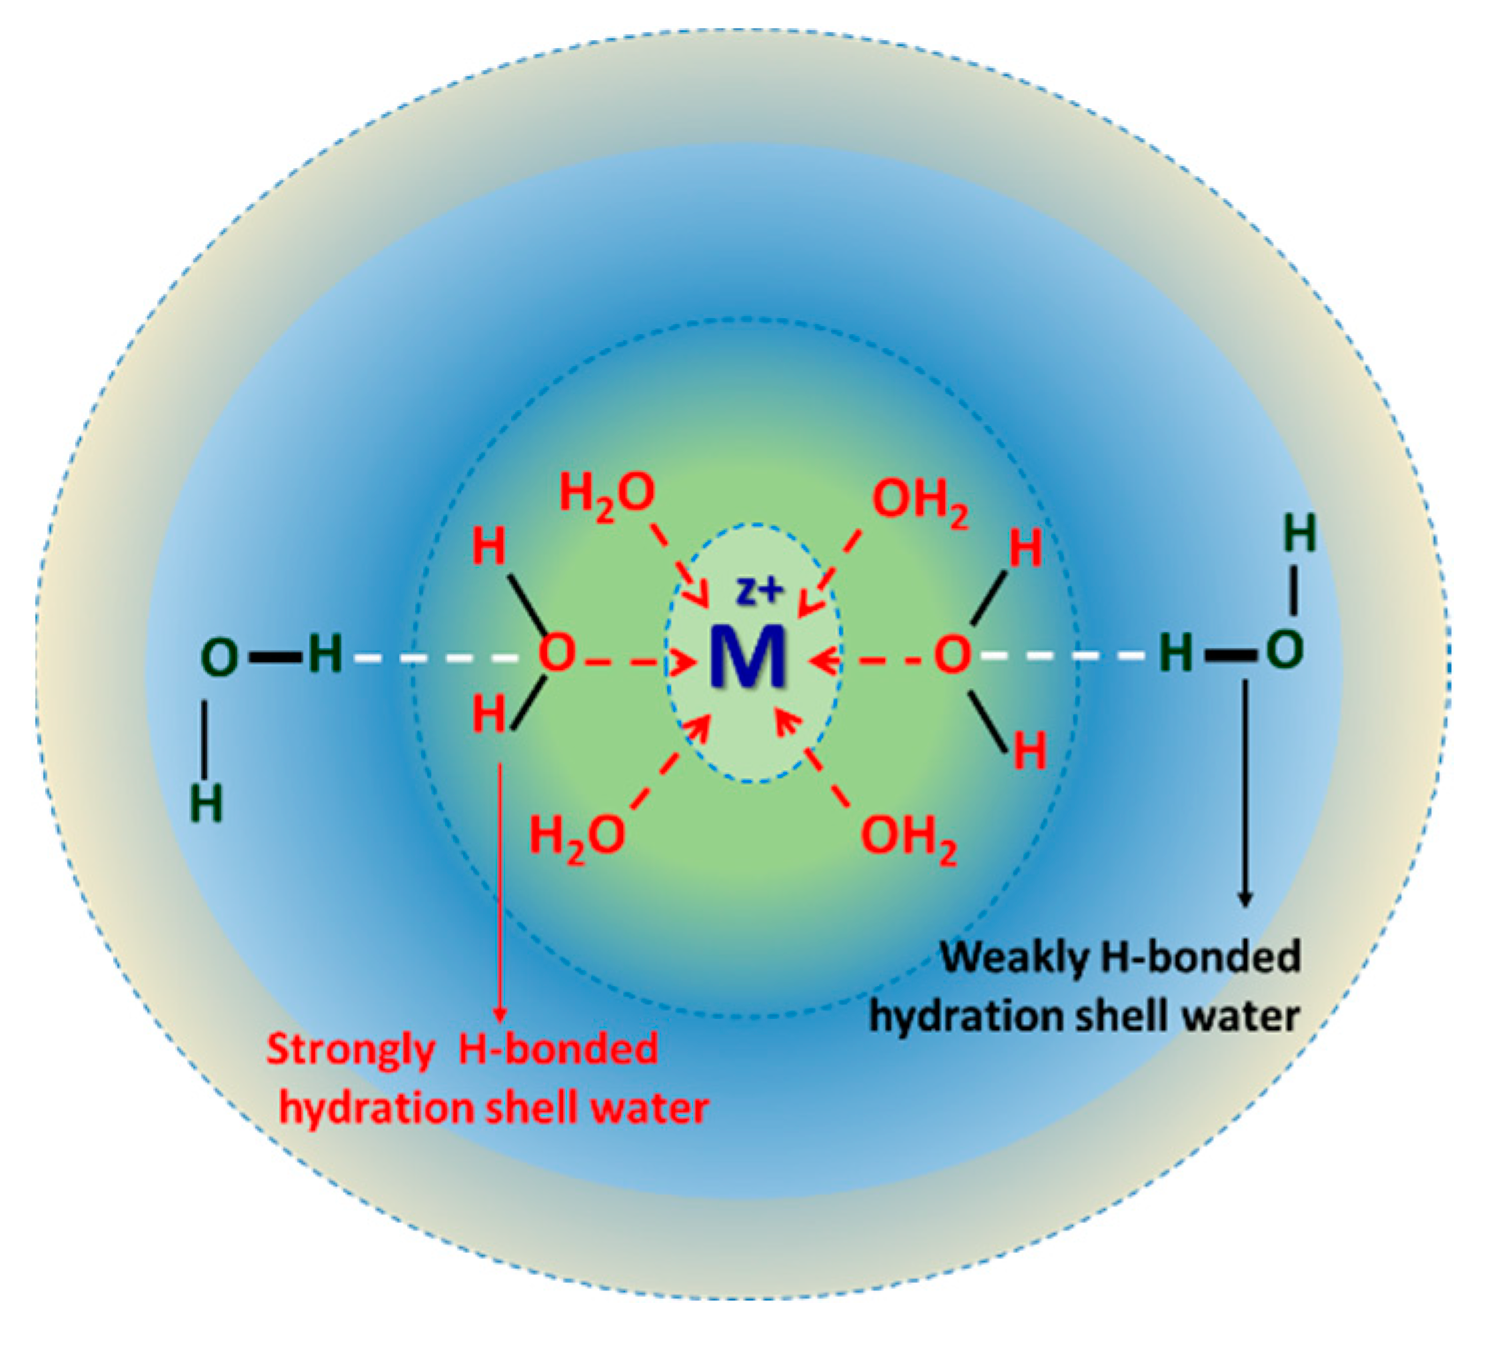
6. Water in the Hydration Shell of a Metal Cation

The local electric field around a cation orients hydration water dipole vectors to point radially away from the cation. The monovalent cations with low charge density (e.g., Na+, Cs+) exhibit a negligible effect on the H-bonded structure of the hydration water compared to the monovalent anions. Although monovalent Na+ does not have significant influence on the neighboring water [76], the cations with higher charge density are expected to perturb the water in their hydration shell. In fact, the DDIR study of divalent transition metal ions (Mn2+, Fe2+, Co2+) and trivalent lanthanide ions (La3+, Nd3+, Dy3+, Yb3+) with comparable ionic potential revealed quite a similar effect on the OD stretch band [77]. Rudolph and co-workers investigated a series of lanthanide ions (Ln3+: La3+, Ce3+, Pr3+, Nd3+, Sm3+, Ho3+, Er3+, Tm3+, Yb3+ and Lu3+) using Raman measurements that enabled determining the force constant of the Ln–O breathing modes of the aqua complexes [78,79]. It was observed that the strength of the force constant increases with decreasing Ln–O bond distances (bond distances: Lu–O < Yb–O < Tm–O < Er–O < Ho–O < Sm–O < Nd–O < Pr–O < Ce–O < La–O).
Recently, we have selectively extracted the OH stretch spectra of water in the hydration shell of a series of high-charge-density cations (Li+, Mg2+, Ca2+, Sr2+, Ba2+, La3+, Gd3+, Dy3+ and Lu3+, as well as H+) using Raman-DS-SCF spectroscopy [42]. It was observed that these cations strongly interact with their hydration water and profoundly affect the local water structure. Interestingly, the strong cation–water interaction not only increases the average H-bond strength of hydration water but also produces a small fraction of extremely weakly interacting water–OH in the hydration shell, which increases the structural heterogeneity therein (see Figure 8). Figure 8a,b compare the hydration shell spectra of monovalent Cs+ (low charge density) to trivalent Lu3+ (high charge density), as extracted by the Raman-DS-SCF method. The hydration shell spectrum (OH stretch band-shape) of Cs+ is qualitatively similar to that of bulk water. However, the hydration shell spectrum of Lu3+ shows distinct changes compared to that of bulk water: the spectral intensity is enhanced in the low-frequency region (below 3400 cm−1; strong H-bonding) and a small band appears at the high-frequency end near 3600 cm−1 (weakly interacting water–OH). The extremely weakly interacting water–OH is believed to have originated from the second hydration shell water–OH that donates an H-bond to the electron-deficient water–oxygen in the first hydration shell of the high-charge-density cations and distributed unevenly within the range of ionic influence (see Figure 9). In fact, this weakly interacting water–OH is different from the broken H-bonded OH transients (usually appearing at ∼3620 cm−1) that is uniformly distributed in bulk water [54]. Hence, the high-charge-density metal ions induce the structural perturbation of water beyond their first hydration shell, which was also suggested by MD simulation studies [80,81]. The number of affected water molecules by the metal cations is correlated with the ionic potential of the ions: higher the ionic potential, the greater the number of affected water molecules by the cations. Interestingly, among the lanthanides, the number of affected water molecules marginally decreases with increasing ionic potential. On moving from La3+ to Lu3+, the number of affected water molecules decreases following a similar trend as in the coordination numbers due to lanthanide contraction [82,83,84]. Nevertheless, the effects of cations on water cannot be described solely by the ionic potential. The ionic potential of Mg2+ is higher than that of La3+; however, the latter affects a greater number of water molecules. In addition to the ionic potential, the absolute charge (i.e., oxidation state) and the size of an ion play roles in the ion’s effect on water. Between two ions with the same ionic potential, the larger one affects a greater number of water molecules than the smaller one. Mg2+ and Dy3+ have the same ionic potential, but the latter ion affects a greater number of water molecules [42].
The perturbing influence of a proton (H+) on the structure of water is very similar to that of high-charge-density metal ions [42,43]. Indeed, H+ and a high-charge-density metal ion are similar from the perspective of interaction with hydration water: both of them accept electrons from the oxygen of the water in the first hydration shell.

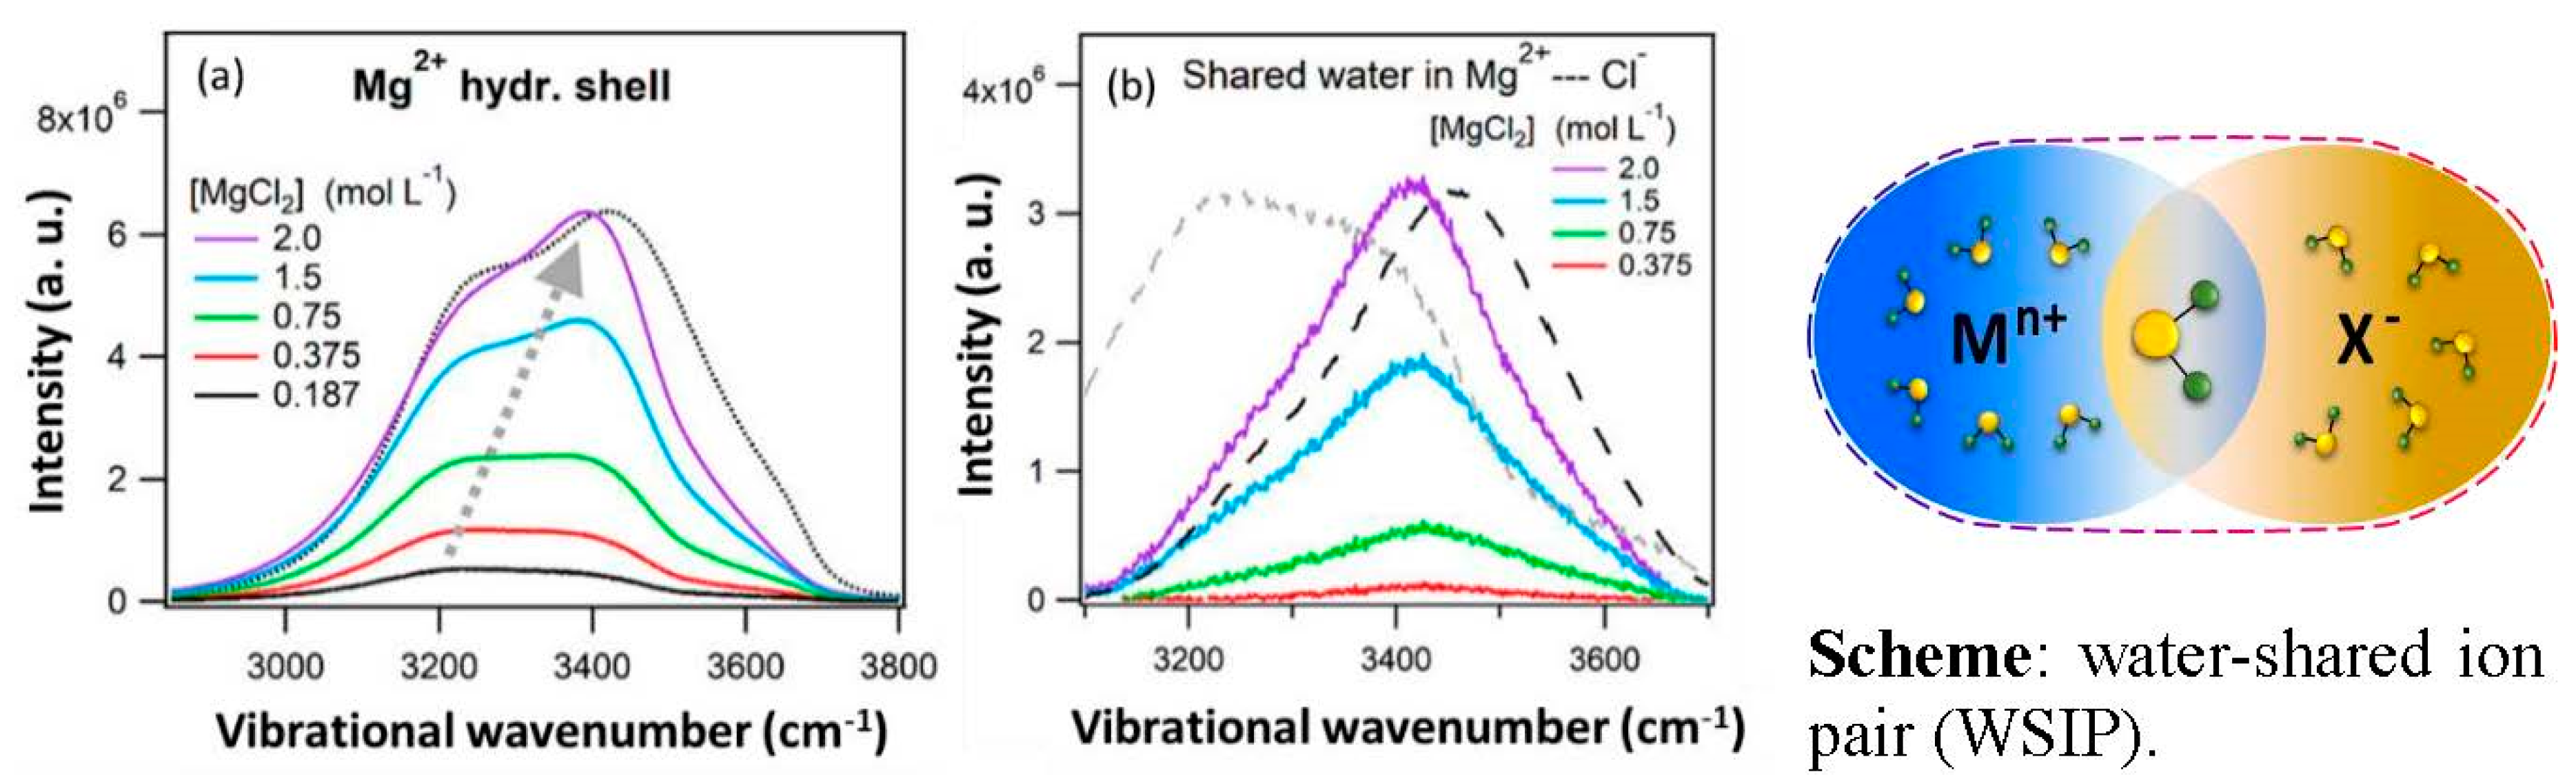
7. Water Shared Ion-Pair Formation and Restructuring of Hydration Shell Water

In a very dilute aqueous solution of an electrolyte, the cation and anion are hydrated separately and mostly do not influence the hydration shell structure of each other. In such a fully hydrated ion, the structural and dynamical properties of the hydrating water are perturbed by the physicochemical properties of the individual hydrated ion. However, with the increasing concentration of the electrolyte, the oppositely charged ions approach closer with their native hydration shells, which can mutually influence their properties [13,85,86]. In such cases, the native hydration shells of the oppositely charged ions overlap, and the intervening (shared) water becomes perturbed by both the interacting ions [87]. These ion-pairs are generally termed “solvent-shared ion-pairs (SSIP)”. The structural perturbation of water in hydrated ion-pairs is important in understanding the ionic mobilities and thermodynamics of solutions.
Raman-DS-SCF analysis successfully enabled the identification of the formation of SSIPs and suitably extracted the vibrational response of the shared water. As can be seen in Figure 10a, the band shape of the OH stretch hydration shell water spectra (extracted by Raman-DS-SCF) of Mg2+ in its aqueous chloride solution undergoes gradual changes with the increasing concentration of MgCl2 ([MgCl2] ≥ 0.37 M). The apparent band maxima of the Mg2+ hydration shell spectrum is shifted from ~3200 cm−1 to ~3400 cm−1 (as indicated by the gray dashed arrow in Figure 10a). This concentration-dependent spectral change indicates an interionic interaction between Mg2+ and Cl, forming SSIP. Further, a second-round DS-SCF analysis (Figure 10b) revealed that the shared water is affected by both Mg2+ and Cl; the average H-bonding of the shared water is weaker than the hydration shell water of Mg2+ but stronger than the hydration shell water of Cl. A similar observation was also observed for the case of an aqueous LaCl3 solution [88]. The perturbing influences of both the cation and anion on the shared water have also been suggested in the aqueous solutions of nitrate and the chloride salt of Fe(III) [89].
The Raman-DS-SCF analysis also enabled the identification of the type of ion-pair formed in the solution from the band shape and the intensity of the hydration shell water spectra. In the formation of SSIP, a fraction of the hydration shell water molecules of an ion is shared by its counterion. Hence, the average number of water molecules affected by the ion is not expected to vary significantly. As a result, the integrated intensity of the hydration shell water spectra that is a quantitative measure of the ion-affected water varies linearly with concentration. On the contrary, a fraction of water molecules is excluded from the hydration shell of an ion during the formation of contact ion pairs (CIP) where the ion directly interacts with its counterion. Thus, the average number of affected water molecules is expected to decrease during CIP formation. The integrated intensity of the Cl-affected water spectrum (OH stretch) linearly increases with concentrations up to 3 M NaCl while showing negative deviation above 3 M NaCl, indicating the formation of CIP between Na+ and Cl (above 3M) [88]. On the contrary, in the cases of Mg2+- and La3+-salts, the predominant formation of SSIP was identified (data not shown here), in agreement with THz and dielectric relaxation spectroscopy studies [29,90]. X-ray absorption fine structure spectroscopy and neutron scattering investigations of divalent Ca2+ (chloride salt) solvation provided evidence for the predominant formation of Ca2+-OH2-Cl SSIPs compared to Ca2+-Cl CIPs, even at high (~6 M) concentrations [91,92]. Presumably, the strong interaction (i.e., tight binding) of first hydration shell water with high-charge-density cations (e.g., Mg2+ and La3+) promotes the preferential formation of SSIP, while weaker ion–water interaction favors the formation of CIP in NaCl solution.
Ion-pairing in aqueous solution has also been recently detected using Raman-MCR and IR-MCR analyses [93,94]. The analyses of the band shape (OH stretch) and intensity of the Raman-MCR extracted ion-perturbed water spectra of aqueous NaOH and LiOH solutions revealed that SSIPs are predominantly formed in these solutions, while CIPs only become significant at higher concentrations [93]. In fact, the strong H-bonding between OH and the first hydration shell water (HOH…OH) favors the predominant formation of SSIP. Moreover, the ion-pairing in aqueous NaOH and LiOH is enthalpically disfavored and entropically favored (i.e., positive ΔH and ΔS), implying that the thermodynamics of ion-pairing is dominated by ion–water interaction rather the electrostatic attraction between the oppositely charged ions.

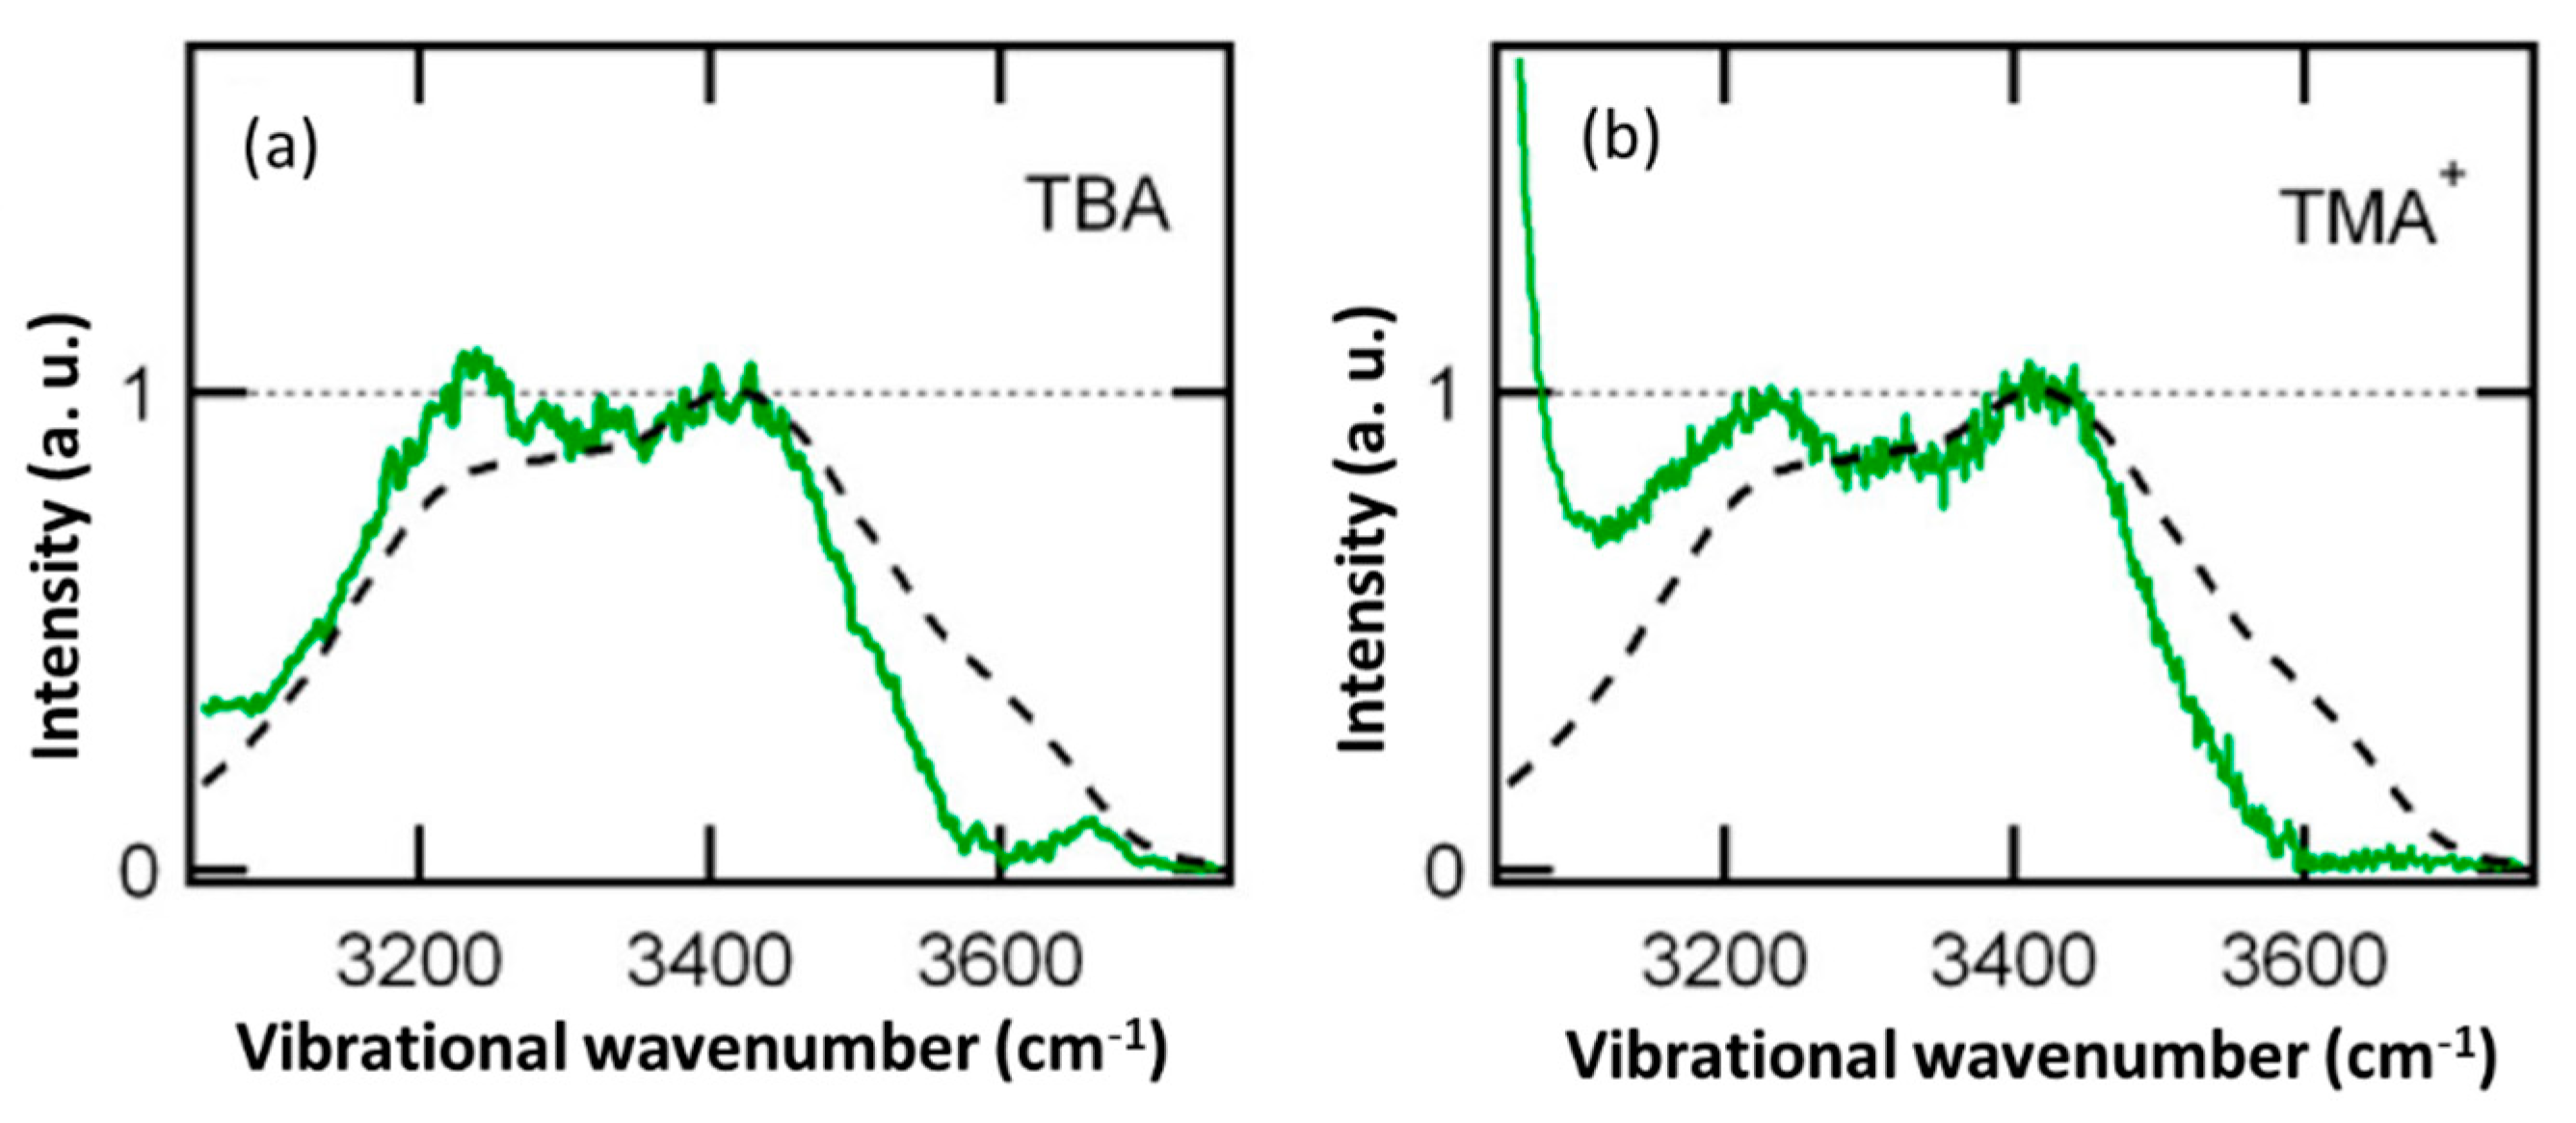
8. Water in the Hydration Shell of Hydrophobic Molecular Cation ((CH3)4N+)

Ions containing hydrophobic molecular groups exhibit distinct local effects on the neighboring water molecules. The hydration shell spectrum (OH stretch) of tetramethylammonium cation ((CH3)4N+; TMA+) closely resembles that of tert-butyl alcohol (TBA; an uncharged hydrophobe), showing “hydrophobic hydration” around the tetramethyl group (Figure 11). Water lacks favorable interactions with non-polar hydrophobes and is unable to form H-bonds. Accordingly, water molecules around a hydrophobe reorganize themselves to optimize the water–water interaction, resulting in increased average H-bond strength (i.e., the enhanced intensity ~3200 cm−1; compare the green and black dashed curves of Figure 11a,b), along with some non-H-bonded “dangling OH” defects (small band ~3670 cm−1 in case of TBA hydration shell) [95,96]. Notably, the dangling OH defect of hydrophobic hydration in TMA+ is largely suppressed due to the presence of a cationic charge. The ion–dipole interaction between the positively charged TMA+ and hydration water preferentially orients the latter, pointing their hydrogens away from the TMA+ surface, suppressing the propensity of dangling OH (3670 cm−1 band is absent in TMA+ hydration shell).

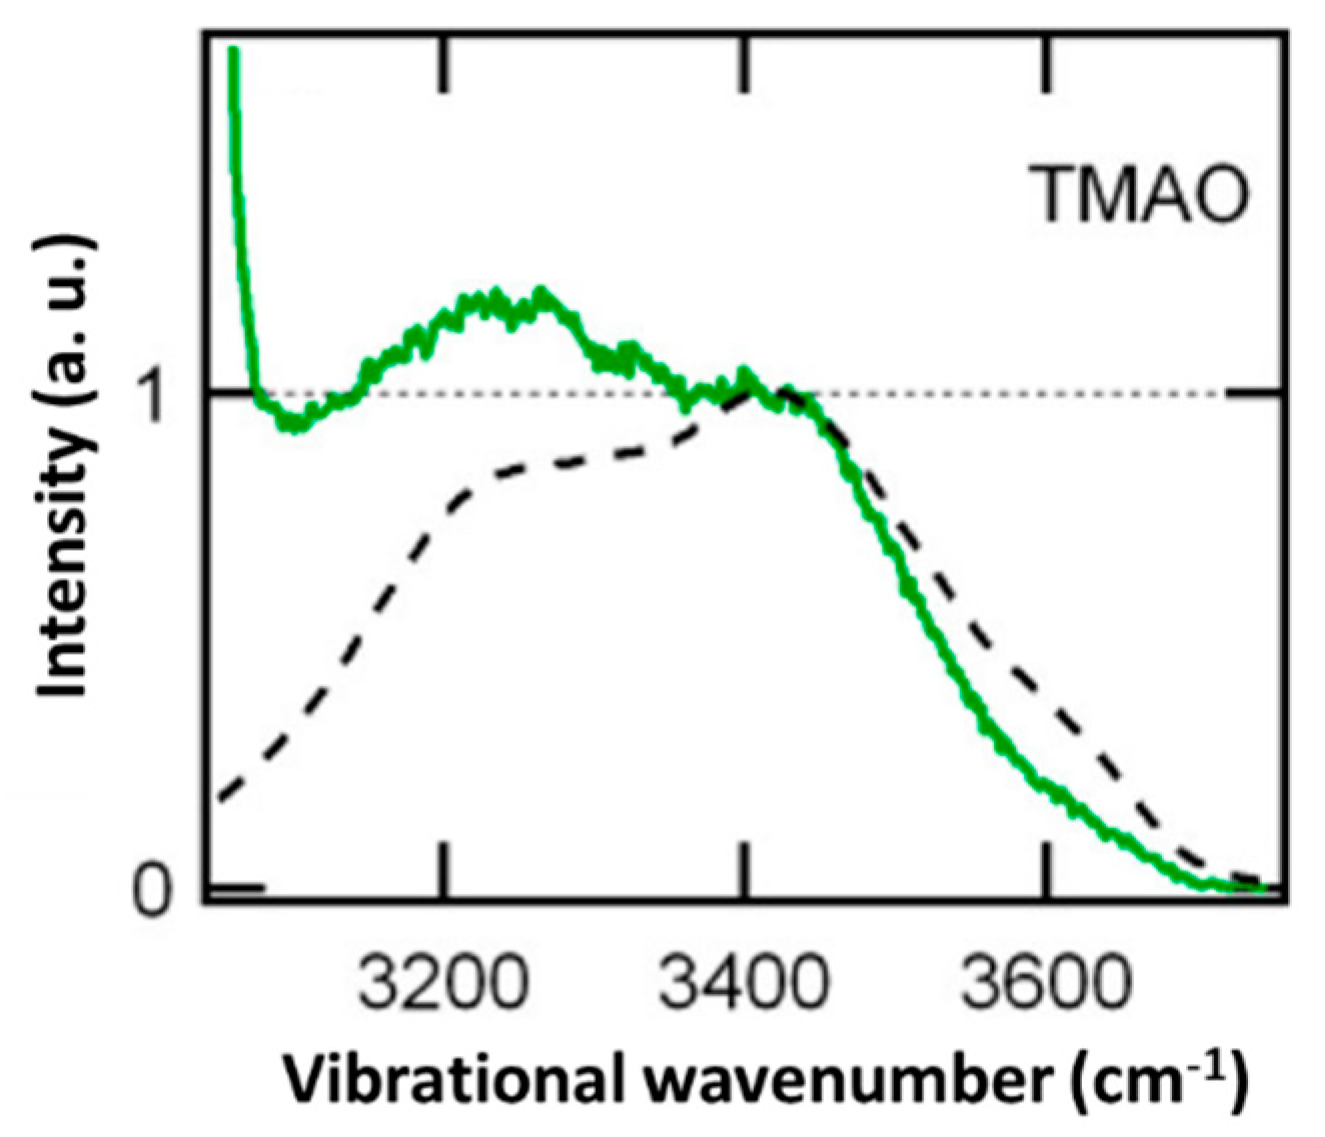
9. Water in the Hydration Shell of Zwitterion, Trimethylamine N-Oxide (CH3)3N+-O)

In the case of zwitterions, such as trimethylamine N-oxide (TMAO), which contains a hydrophobic trimethyl and an zwitterionic N-oxide (N+-O) group, shows different local hydration characteristics: hydrophobic hydration around the trimethyl group and hydrophilic (ionic) hydration of the N-oxide group (Figure 12) [97]. In addition to hydrophobic hydration, the TMAO–oxygen forms a stronger H-bond with the hydration water compared to that in bulk water (reflected by the markedly enhanced intensity ~3230 cm−1 in the TMAO hydration shell spectrum compared to both the TBA and the TMA+ hydration shell; compare the green curves of Figure 11 and Figure 12). In fact, a balance between these differential hydration characteristics (hydrophobic vs. ionic) of TMAO is believed to have implications in its interfacial properties and its interactions with a biological membrane/water interface [98,99]. Moreover, the hydration of such an amphoteric molecule is very sensitive to the local physicochemical environment. In aqueous solution, for example, TMAO experiences van der Waals attraction with TBA and hence, interacts through its trimethyl moiety. This is governed by their mutual hydrophobic interaction with water, which makes the trimethyl group of TMAO less exposed to water [100]. On the other hand, TMAO electrostatically interacts with cationic TMA+ through its negatively charged oxygen, which orients the trimethyl group of TMAO away from TMA+ and renders them exposed to water [100].

10. Conclusions and Future Perspective

Anions and cations exert specific perturbation on the H-bonded structure of water. The strength of H-bonding and water libration are altered in the immediate vicinity of the ions, causing the decoupling of the intra- and intermolecular vibrational modes of water. The ion effect on water increases with increasing charge density for both anions as well as cations. Monovalent anions have relatively stronger influences on the hydration water compared to the monovalent cations with a similar charge density. Nevertheless, the multivalent cations strongly interact with water that not only increases the average H-bond strength of hydration water but also produces very weakly interacting water–OH beyond the first hydration shell. In the case of fully hydrated ions, the structure of hydration water becomes perturbed primarily by the individual hydrated ion, while at higher concentrations, interionic interaction between anions and cations starts to form ion-pairs (SSIP and CIP). In SSIP, the intervening shared water is perturbed by both ions, forming an ion-pair. In fact, the predominant formation of SSIP or CIP is driven by the specific nature of the individual ion–water interaction. Hydrophobic molecular ions exhibit distinct local hydration characteristics.
Ion-induced perturbation modifies coupling between vibrational modes of water. Anion–water interaction decouples the vibrational modes of the hydration water from its H-bonded partner. The vibrational coupling of water plays crucial roles in the biochemical reactions of enzymes [101,102]. Quantification of the vibrational coupling of perturbed water by metal ions with biochemical relevance is expected to provide a better understanding of such systems.
The majority of the IR and Raman spectroscopic investigations have used the OH stretch band of water as a marker of the ion effect on the water structure. Presumably, this is because of the high oscillator strength and the higher sensitivity of the OH stretch towards a structural perturbation of the water than that of its other vibrational modes. However, recent FTIR spectroscopic measurements indicated the potential of HOH bending and bend+libration combination band of water as powerful probes for solute-induced perturbations of a water H-bond network [103,104,105]. Moreover, probing low-frequency intermolecular H-bond stretch (~200 cm−1) and librational modes can decipher the structural perturbation of water by ions (data not yet published). The low-frequency vibrational modes of water can be applied as complementary probes to the widely studied OH stretch mode in elucidating the structure of water.
One emerging trend is the combined investigation of ionic hydration in bulk as well as at aqueous interface. It is observed that the ion-induced perturbations of H-bonding structure in the bulk water and at the air/water interface are strongly correlated [56,60,64]. The local hydration characteristics of ions in bulk water dictate their surface affinity [56]. In fact, kosmotropic electrolytes perturb the structure of water at the air/water–electrolyte interface through their strongly solvated anion hydration shell [64]. DS-SCF analysis of the vibrational response from bulk water and the aqueous interface can provide a unified picture of a specific ion effect in bulk water and at the aqueous interfaces.

Funding

Bhabha Atomic Research Centre (BARC), Department of Atomic Energy, Government of India.

Acknowledgments

The authors gratefully acknowledge Awadhesh Kumar and A. K. Tyagi. N.G. thanks Alok Srivastava for his encouragement. S.R. and A.B. acknowledge DAE (HBNI, BARC) for Ph.D. fellowship. The financial support from BARC, Department of Atomic Energy, Government of India, is gratefully acknowledged.

Conflicts of Interest

The authors declare no conflict of interest.

References

  1. Jacob, D. The role of water vapour in the atmosphere. A short overview from a climate modeller’s point of view. Phys. Chem. Earth Part A Solid Earth Geod. 2001, 26, 523–527. [Google Scholar] [CrossRef]
  2. Vaida, V. Perspective: Water cluster mediated atmospheric chemistry. J. Chem. Phys. 2011, 135, 020901. [Google Scholar] [CrossRef] [PubMed]
  3. Wiggins, P.M. Role of water in some biological processes. Microbiol. Rev. 1990, 54, 432–449. [Google Scholar] [CrossRef]
  4. Pal, S.K.; Zewail, A.H. Dynamics of Water in Biological Recognition. Chem. Rev. 2004, 104, 2099–2124. [Google Scholar] [CrossRef]
  5. Walrafen, G.E. Raman Spectral Studies of the Effects of Solutes and Pressure on Water Structure. J. Chem. Phys. 1971, 55, 768–792. [Google Scholar] [CrossRef]
  6. Marcus, Y. Effect of Ions on the Structure of Water: Structure Making and Breaking. Chem. Rev. 2009, 109, 1346–1370. [Google Scholar] [CrossRef]
  7. Gaballa, G.A.; Neilson, G.W. The effect of pressure on the structure of light and heavy water. Mol. Phys. 1983, 50, 97–111. [Google Scholar] [CrossRef]
  8. Walrafen, G.E. Raman Spectral Studies of the Effects of Temperature on Water and Electrolyte Solutions. J. Chem. Phys. 1966, 44, 1546–1558. [Google Scholar] [CrossRef]
  9. Dudev, T.; Lim, C. Importance of Metal Hydration on the Selectivity of Mg2+ versus Ca2+ in Magnesium Ion Channels. J. Am. Chem. Soc. 2013, 135, 17200–17208. [Google Scholar] [CrossRef]
  10. Cota, R.; Woutersen, S.; Bakker, H.J. Accelerated Vibrational Energy Relaxation of Water in Alkaline Environments. J. Phys. Chem. B 2021, 125, 11980–11986. [Google Scholar] [CrossRef]
  11. Timmer, R.L.A.; Tielrooij, K.J.; Bakker, H.J. Vibrational Förster transfer to hydrated protons. J. Chem. Phys. 2010, 132, 194504. [Google Scholar] [CrossRef] [PubMed] [Green Version]
  12. Wachter, W.; Kunz, W.; Buchner, R.; Hefter, G. Is There an Anionic Hofmeister Effect on Water Dynamics? Dielectric Spectroscopy of Aqueous Solutions of NaBr, NaI, NaNO3, NaClO4, and NaSCN. J. Phys. Chem. A 2005, 109, 8675–8683. [Google Scholar] [CrossRef] [PubMed]
  13. Tielrooij, K.J.; Garcia-Araez, N.; Bonn, M.; Bakker, H.J. Cooperativity in Ion Hydration. Science 2010, 328, 1006–1009. [Google Scholar] [CrossRef] [PubMed]
  14. Kim, J.S.; Wu, Z.; Morrow, A.R.; Yethiraj, A.; Yethiraj, A. Self-Diffusion and Viscosity in Electrolyte Solutions. J. Phys. Chem. B 2012, 116, 12007–12013. [Google Scholar] [CrossRef]
  15. Cota, R.; van Dam, E.P.; Woutersen, S.; Bakker, H.J. Slowing Down of the Molecular Reorientation of Water in Concentrated Alkaline Solutions. J. Phys. Chem. B 2020, 124, 8309–8316. [Google Scholar] [CrossRef]
  16. Collins, K.D.; Washabaugh, M.W. The Hofmeister effect and the behaviour of water at interfaces. Q. Rev. Biophys. 1985, 18, 323–422. [Google Scholar] [CrossRef]
  17. Collins, K.D. Charge Density-Dependent Strength of Hydration and Biological Structure. Biophys. J. 1997, 72, 65–76. [Google Scholar] [CrossRef] [Green Version]
  18. Collins, K.D. Why continuum electrostatics theories cannot explain biological structure, polyelectrolytes or ionic strength effects in ion–protein interactions. Biophys. Chem. 2012, 167, 43–59. [Google Scholar] [CrossRef] [Green Version]
  19. Gurney, R.W. Ionic Processes in Solution; McGraw-Hill: New York, NY, USA, 1953. [Google Scholar]
  20. Jones, G.; Dole, M. The viscosity of aqueous solutions of strong electrolytes with special reference to barium chloride. J. Am. Chem. Soc. 1929, 51, 2950–2964. [Google Scholar] [CrossRef]
  21. Näslund, L.-Å.; Edwards, D.C.; Wernet, P.; Bergmann, U.; Ogasawara, H.; Pettersson, L.G.M.; Myneni, S.; Nilsson, A. X-ray Absorption Spectroscopy Study of the Hydrogen Bond Network in the Bulk Water of Aqueous Solutions. J. Phys. Chem. A 2005, 109, 5995–6002. [Google Scholar] [CrossRef]
  22. Hofmesiter, F. About the science of the effects of salts: About the water withdrawing effect of the salts. Arch. Exp. Pathol. Pharmacol. 1888, 24, 247–260. [Google Scholar]
  23. Mason, P.E.; Ansell, S.; Neilson, G.W.; Rempe, S.B. Neutron Scattering Studies of the Hydration Structure of Li+. J. Phys. Chem. B 2015, 119, 2003–2009. [Google Scholar] [CrossRef] [PubMed]
  24. Wang, Y.; Wang, G.; Bowron, D.T.; Zhu, F.; Hannon, A.C.; Zhou, Y.; Liu, X.; Shi, G. Unveiling the structure of aqueous magnesium nitrate solutions by combining X-ray diffraction and theoretical calculations. Phys. Chem. Chem. Phys. 2022, 24, 22939–22949. [Google Scholar] [CrossRef]
  25. van der Vegt, N.F.A.; Haldrup, K.; Roke, S.; Zheng, J.; Lund, M.; Bakker, H.J. Water-Mediated Ion Pairing: Occurrence and Relevance. Chem. Rev. 2016, 116, 7626–7641. [Google Scholar] [CrossRef] [Green Version]
  26. Ohtaki, H.; Radnai, T. Structure and dynamics of hydrated ions. Chem. Rev. 1993, 93, 1157–1204. [Google Scholar] [CrossRef]
  27. Jalilehvand, F.; Spångberg, D.; Lindqvist-Reis, P.; Hermansson, K.; Persson, I.; Sandström, M. Hydration of the Calcium Ion. An EXAFS, Large-Angle X-ray Scattering, and Molecular Dynamics Simulation Study. J. Am. Chem. Soc. 2001, 123, 431–441. [Google Scholar] [CrossRef]
  28. Schwaab, G.; Sebastiani, F.; Havenith, M. Ion Hydration and Ion Pairing as Probed by THz Spectroscopy. Angew. Chem. Int. Ed. 2019, 58, 3000–3013. [Google Scholar] [CrossRef]
  29. Sebastiani, F.; Verde, A.V.; Heyden, M.; Schwaab, G.; Havenith, M. Cooperativity and ion pairing in magnesium sulfate aqueous solutions from the dilute regime to the solubility limit. Phys. Chem. Chem. Phys. 2020, 22, 12140–12153. [Google Scholar] [CrossRef]
  30. Chen, Y.; Zhang, Y.-H.; Zhao, L.-J. ATR-FTIR spectroscopic studies on aqueous LiClO4, NaClO4, and Mg(ClO4)2 solutions. Phys. Chem. Chem. Phys. 2004, 6, 537–542. [Google Scholar] [CrossRef]
  31. Max, J.-J.; Blois, S.d.; Veilleux, A.; Chapados, C. IR Spectroscopy of aqueous alkali halides. Factor analysis. Can. J. Chem. 2001, 79, 13–21. [Google Scholar] [CrossRef]
  32. Yonehama, K.; Yoshimura, Y.; Takekiyo, T.; Kanno, H. Variation of the Uncoupled OD Stretching Frequency with Electrolyte Concentration in Aqueous Electrolyte Solutions. Bull. Chem. Soc. Jpn. 2009, 82, 563–569. [Google Scholar] [CrossRef]
  33. Perera, P.; Wyche, M.; Loethen, Y.; Ben-Amotz, D. Solute-Induced Perturbations of Solvent-Shell Molecules Observed Using Multivariate Raman Curve Resolution. J. Am. Chem. Soc. 2008, 130, 4576–4577. [Google Scholar] [CrossRef] [PubMed]
  34. Fega, K.R.; Wilcox, A.S.; Ben-Amotz, D. Application of Raman Multivariate Curve Resolution to Solvation-Shell Spectroscopy. Appl. Spectrosc. 2012, 66, 282–288. [Google Scholar] [CrossRef] [PubMed]
  35. Rankin, B.M.; Ben-Amotz, D. Expulsion of Ions from Hydrophobic Hydration Shells. J. Am. Chem. Soc. 2013, 135, 8818–8821. [Google Scholar] [CrossRef] [PubMed]
  36. Ahmed, M.; Namboodiri, V.; Singh, A.K.; Mondal, J.A.; Sarkar, S.K. How Ions Affect the Structure of Water: A Combined Raman Spectroscopy and Multivariate Curve Resolution Study. J. Phys. Chem. B 2013, 117, 16479–16485. [Google Scholar] [CrossRef]
  37. Ahmed, M.; Singh, A.K.; Mondal, J.A.; Sarkar, S.K. Water in the Hydration Shell of Halide Ions Has Significantly Reduced Fermi Resonance and Moderately Enhanced Raman Cross Section in the OH Stretch Regions. J. Phys. Chem. B 2013, 117, 9728–9733. [Google Scholar] [CrossRef]
  38. Ahmed, M.; Singh, A.K.; Mondal, J.A. Hydrogen-bonding and vibrational coupling of water in a hydrophobic hydration shell as observed by Raman-MCR and isotopic dilution spectroscopy. Phys. Chem. Chem. Phys. 2016, 18, 2767–2775. [Google Scholar] [CrossRef]
  39. Ahmed, M.; Namboodiri, V.; Singh, A.K.; Mondal, J.A. On the Intermolecular Vibrational Coupling, Hydrogen Bonding, and Librational Freedom of Water in the Hydration Shell of Mono- and Bivalent Anions. J. Chem. Phys. 2014, 141, 164708. [Google Scholar] [CrossRef]
  40. Ben-Amotz, D. Hydration-Shell Vibrational Spectroscopy. J. Am. Chem. Soc. 2019, 141, 10569–10580. [Google Scholar] [CrossRef]
  41. Roy, S.; Biswas, B.; Ghosh, N.; Singh, P.C.; Mondal, J.A. Hydrophobic Hydration of Fluoroalkyl (C-F) is Distinctly Different from that of Its Hydrogenated Counterpart (C-H) as Observed by Raman Difference with Simultaneous Curve Fitting Analysis. J. Phys. Chem. C 2019, 123, 27012–27019. [Google Scholar] [CrossRef]
  42. Patra, A.; Roy, S.; Saha, S.; Palit, D.K.; Mondal, J.A. Observation of Extremely Weakly Interacting OH (~3600 cm−1) in the Vicinity of High Charge Density Metal Ions (Mz+; z = 1, 2, 3): A Structural Heterogeneity in the Extended Hydration Shell. J. Phys. Chem. C 2020, 124, 3028–3036. [Google Scholar] [CrossRef]
  43. Daly, C.A.; Streacker, L.M.; Sun, Y.; Pattenaude, S.R.; Hassanali, A.A.; Petersen, P.B.; Corcelli, S.A.; Ben-Amotz, D. Decomposition of the Experimental Raman and Infrared Spectra of Acidic Water into Proton, Special Pair, and Counterion Contributions. J. Phys. Chem. Lett. 2017, 8, 5246–5252. [Google Scholar] [CrossRef] [PubMed]
  44. Stangret, J.; Gampe, T. Ionic Hydration Behavior Derived from Infrared Spectra in HDO. J. Phys. Chem. A 2002, 106, 5393–5402. [Google Scholar] [CrossRef]
  45. Perera, P.N.; Browder, B.; Ben-Amotz, D. Perturbations of Water by Alkali Halide Ions Measured using Multivariate Raman Curve Resolution. J. Phys. Chem. B 2009, 113, 1805–1809. [Google Scholar] [CrossRef]
  46. Lindgren, J.; Hermansson, K.; Wojcik, M.J. Theoretical Simulation and Experimental-Determination of OH And OD Stretching Bands of Isotopically Diluted Hdo Molecules in Aqueous-Electrolyte Solutions. J. Phys. Chem. 1993, 97, 5254–5259. [Google Scholar] [CrossRef]
  47. Kristiansson, O.; Lindgren, J.; De Villepin, J. A quantitative infrared spectroscopic method for the study of the hydration of ions in aqueous solutions. J. Phys. Chem. 1988, 92, 2680–2685. [Google Scholar] [CrossRef]
  48. Śmiechowski, M.; Stangret, J. Vibrational spectroscopy of semiheavy water (HDO) as a probe of solute hydration. Pure Appl. Chem. 2010, 82, 1869–1887. [Google Scholar] [CrossRef]
  49. Sokołowska, A.; Kęcki, Z. Inter- and intra-molecular coupling and Fermi resonance in the Raman spectra of liquid water. J. Raman Spectrosc. 1986, 17, 29–33. [Google Scholar] [CrossRef]
  50. Auer, B.M.; Skinner, J.L. IR and Raman Spectra of Liquid Water: Theory and Interpretation. J. Chem. Phys. 2008, 128, 224511. [Google Scholar] [CrossRef]
  51. Hare, D.E.; Sorensen, C.M. Interoscillator coupling effects on the OH stretching band of liquid water. J. Chem. Phys. 1992, 96, 13–22. [Google Scholar] [CrossRef]
  52. Sovago, M.; Campen, R.K.; Wurpel, G.W.H.; Müller, M.; Bakker, H.J.; Bonn, M. Vibrational Response of Hydrogen-Bonded Interfacial Water is Dominated by Intramolecular Coupling. Phys. Rev. Lett. 2008, 100, 173901. [Google Scholar] [CrossRef] [PubMed]
  53. Wang, Z.; Pakoulev, A.; Pang, Y.; Dlott, D.D. Vibrational Substructure in the OH Stretching Transition of Water and HOD. J. Phys. Chem. A 2004, 108, 9054–9063. [Google Scholar] [CrossRef]
  54. Eaves, J.D.; Loparo, J.J.; Fecko, C.J.; Roberts, S.T.; Tokmakoff, A.; Geissler, P.L. Hydrogen bonds in liquid water are broken only fleetingly. Proc. Natl. Acad. Sci. USA 2005, 102, 13019–13022. [Google Scholar] [CrossRef] [PubMed] [Green Version]
  55. Yang, M.; Skinner, J.L. Signatures of Coherent Vibrational Energy Transfer in IR and Raman Line Shapes for Liquid Water. Phys. Chem. Chem. Phys. 2010, 12, 982–991. [Google Scholar] [CrossRef]
  56. Saha, S.; Roy, S.; Mathi, P.; Mondal, J.A. Polyatomic Iodine Species at the Air–Water Interface and Its Relevance to Atmospheric Iodine Chemistry: An HD-VSFG and Raman-MCR Study. J. Phys. Chem. A 2019, 123, 2924–2934. [Google Scholar] [CrossRef]
  57. Jena, N.K.; Josefsson, I.; Eriksson, S.K.; Hagfeldt, A.; Siegbahn, H.; Björneholm, O.; Rensmo, H.; Odelius, M. Solvent-Dependent Structure of the I3 Ion Derived from Photoelectron Spectroscopy and Ab Initio Molecular Dynamics Simulations. Chem.—Eur. J. 2015, 21, 4049–4055. [Google Scholar] [CrossRef]
  58. Josefsson, I.; Eriksson, S.K.; Ottosson, N.; Öhrwall, G.; Siegbahn, H.; Hagfeldt, A.; Rensmo, H.; Björneholm, O.; Odelius, M. Collective hydrogen-bond dynamics dictates the electronic structure of aqueous I3. Phys. Chem. Chem. Phys. 2013, 15, 20189–20196. [Google Scholar] [CrossRef] [Green Version]
  59. Bergstroem, P.A.; Lindgren, J.; Kristiansson, O. An IR Study of the Hydration of Perchlorate, Nitrate, Iodide, Bromide, Chloride and Sulfate Anions in Aqueous Solution. J. Phys. Chem. 1991, 95, 8575–8580. [Google Scholar] [CrossRef]
  60. Roy, S.; Mondal, J.A. “Breaking” and “Making” of Water Structure at the Air/Water–Electrolyte (NaXO3; X = Cl, Br, I) Interface. J. Phys. Chem. Lett. 2021, 12, 1955–1960. [Google Scholar] [CrossRef]
  61. Baer, M.D.; Pham, V.-T.; Fulton, J.L.; Schenter, G.K.; Balasubramanian, M.; Mundy, C.J. Is Iodate a Strongly Hydrated Cation? J. Phys. Chem. Lett. 2011, 2, 2650–2654. [Google Scholar] [CrossRef]
  62. Sharma, B.; Chandra, A. Nature of hydration shells of a polyoxy-anion with a large cationic centre: The case of iodate ion in water. J. Comput. Chem. 2018, 39, 1226–1235. [Google Scholar] [CrossRef] [PubMed]
  63. Sharma, B.; Chandra, A. Born–Oppenheimer Molecular Dynamics Simulations of a Bromate Ion in Water Reveal Its Dual Kosmotropic and Chaotropic Behavior. J. Phys. Chem. B 2018, 122, 2090–2101. [Google Scholar] [CrossRef] [PubMed]
  64. Roy, S.; Mondal, J.A. Kosmotropic Electrolyte (Na2CO3, NaF) Perturbs the Air/Water Interface through Anion Hydration Shell without Forming a Well-Defined Electric Double Layer. J. Phys. Chem. B 2021, 125, 3977–3985. [Google Scholar] [CrossRef]
  65. Boisson, J.; Stirnemann, G.; Laage, D.; Hynes, J.T. Water reorientation dynamics in the first hydration shells of F and I. Phys. Chem. Chem. Phys. 2011, 13, 19895–19901. [Google Scholar] [CrossRef] [PubMed] [Green Version]
  66. Yadav, S.; Chandra, A. Structural and Dynamical Nature of Hydration Shells of the Carbonate Ion in Water: An Ab Initio Molecular Dynamics Study. J. Phys. Chem. B 2018, 122, 1495–1504. [Google Scholar] [CrossRef] [PubMed]
  67. Kameda, Y.; Hosoya, K.; Sakamoto, S.; Suzuki, H.; Usuki, T.; Uemura, O. Hydrogen-bonded structure in aqueous sulfuric acid solutions. J. Mol. Liq. 1995, 65–66, 305–308. [Google Scholar] [CrossRef]
  68. Rudolph, W.W.; Irmer, G. Raman and Infrared Spectroscopic Investigations on Aqueous Alkali Metal Phosphate Solutions and Density Functional Theory Calculations of Phosphate—Water Clusters. Appl. Spectrosc. 2007, 61, 1312–1327. [Google Scholar] [CrossRef]
  69. Sharma, B.; Chandra, A. Ab Initio Molecular Dynamics Simulation of the Phosphate Ion in Water: Insights into Solvation Shell Structure, Dynamics, and Kosmotropic Activity. J. Phys. Chem. B 2017, 121, 10519–10529. [Google Scholar] [CrossRef]
  70. Yu, C.-C.; Chiang, K.-Y.; Okuno, M.; Seki, T.; Ohto, T.; Yu, X.; Korepanov, V.; Hamaguchi, H.-O.; Bonn, M.; Hunger, J.; et al. Vibrational couplings and energy transfer pathways of water’s bending mode. Nat. Commun. 2020, 11, 5977. [Google Scholar] [CrossRef]
  71. Seki, T.; Chiang, K.-Y.; Yu, C.-C.; Yu, X.; Okuno, M.; Hunger, J.; Nagata, Y.; Bonn, M. The Bending Mode of Water: A Powerful Probe for Hydrogen Bond Structure of Aqueous Systems. J. Phys. Chem. Lett. 2020, 11, 8459–8469. [Google Scholar] [CrossRef]
  72. Walrafen, G.E. Raman Spectral Studies of the Effects of Temperature on Water Structure. J. Chem. Phys. 1967, 47, 114–126. [Google Scholar] [CrossRef]
  73. Cho, M.; Fleming, G.R.; Saito, S.; Ohmine, I.; Stratt, R.M. Instantaneous normal mode analysis of liquid water. J. Chem. Phys. 1994, 100, 6672–6683. [Google Scholar] [CrossRef]
  74. Nash, C.P.; Donnelly, T.C.; Rock, P.A. Raman spectra in the libration region of concentrated aqueous solutions of lithium-6 and lithium-7 halides. Evidence for tetrahedral Li(OH2)4+. J. Solut. Chem. 1977, 6, 663–670. [Google Scholar] [CrossRef]
  75. Carey, D.M.; Korenowski, G.M. Measurement of the Raman spectrum of liquid water. J. Chem. Phys. 1998, 108, 2669–2675. [Google Scholar] [CrossRef]
  76. Cappa, C.D.; Smith, J.D.; Messer, B.M.; Cohen, R.C.; Saykally, R.J. Effects of Cations on the Hydrogen Bond Network of Liquid Water:  New Results from X-ray Absorption Spectroscopy of Liquid Microjets. J. Phys. Chem. B 2006, 110, 5301–5309. [Google Scholar] [CrossRef] [PubMed] [Green Version]
  77. Bergstroem, P.A.; Lindgren, J. Infrared study on the hydration of manganese (2+), iron (2+), cobalt (2+), lanthanum (3+), neodymium (3+), dysprosium (3+), and ytterbium (3+) ions in dilute aqueous solution. Inorg. Chem. 1992, 31, 1529–1533. [Google Scholar] [CrossRef]
  78. Rudolph, W.W.; Irmer, G. Raman spectroscopic characterization of light rare earth ions: La3+, Ce3+, Pr3+, Nd3+ and Sm3+–hydration and ion pair formation. Dalton Trans. 2017, 46, 4235–4244. [Google Scholar] [CrossRef]
  79. Rudolph, W.; Irmer, G. On the Hydration of Heavy Rare Earth Ions: Ho3+, Er3+, Tm3+, Yb3+ and Lu3+—A Raman Study. Molecules 2019, 24, 1953. [Google Scholar] [CrossRef] [Green Version]
  80. Das, B.; Mondal, S.; Chandra, A. Two-Dimensional Infrared Spectroscopy of Aqueous Solutions of Metal Nitrates: Slowdown of Spectral Diffusion in the Presence of Divalent Cations. J. Phys. Chem. B 2020, 124, 7391–7404. [Google Scholar] [CrossRef]
  81. Zeng, Y.; Jia, Y.; Yan, T.; Zhuang, W. Binary structure and dynamics of the hydrogen bonds in the hydration shells of ions. Phys. Chem. Chem. Phys. 2021, 23, 11400–11410. [Google Scholar] [CrossRef]
  82. Habenschuss, A.; Spedding, F.H. The coordination (hydration) of rare earth ions in aqueous chloride solutions from x-ray diffraction. I.TbCl3, DyCl3, ErCl3, TmCl3, and LuCl3. J. Chem. Phys. 1979, 70, 2797–2806. [Google Scholar] [CrossRef]
  83. Habenschuss, A.; Spedding, F.H. The coordination (hydration) of rare earth ions in aqueous chloride solutions from x-ray diffraction. II. LaCl3, PrCl3, and NdCl3a). J. Chem. Phys. 1979, 70, 3758–3763. [Google Scholar] [CrossRef]
  84. Duvail, M.; Vitorge, P.; Spezia, R. Building a polarizable pair interaction potential for lanthanoids(III) in liquid water: A molecular dynamics study of structure and dynamics of the whole series. J. Chem. Phys. 2009, 130, 104501. [Google Scholar] [CrossRef] [PubMed] [Green Version]
  85. Verde, A.V.; Santer, M.; Lipowsky, R. Solvent-shared pairs of densely charged ions induce intense but short-range supra-additive slowdown of water rotation. Phys. Chem. Chem. Phys. 2016, 18, 1918–1930. [Google Scholar] [CrossRef] [Green Version]
  86. Yadav, S.; Chandra, A. Preferential solvation, ion pairing, and dynamics of concentrated aqueous solutions of divalent metal nitrate salts. J. Chem. Phys. 2017, 147, 244503. [Google Scholar] [CrossRef]
  87. Marcus, Y.; Hefter, G. Ion Pairing. Chem. Rev. 2006, 106, 4585–4621. [Google Scholar] [CrossRef]
  88. Roy, S.; Patra, A.; Saha, S.; Palit, D.K.; Mondal, J.A. Restructuring of Hydration Shell Water due to Solvent-Shared Ion Pairing (SSIP): A Case Study of Aqueous MgCl2 and LaCl3 Solutions. J. Phys. Chem. B 2020, 124, 8141–8148. [Google Scholar] [CrossRef]
  89. Baumler, S.M.; Hartt, V.W.H.; Allen, H.C. Hydration of ferric chloride and nitrate in aqueous solutions: Water-mediated ion pairing revealed by Raman spectroscopy. Phys. Chem. Chem. Phys. 2019, 21, 19172–19180. [Google Scholar] [CrossRef]
  90. Friesen, S.; Hefter, G.; Buchner, R. Cation Hydration and Ion Pairing in Aqueous Solutions of MgCl2 and CaCl2. J. Phys. Chem. B 2019, 123, 891–900. [Google Scholar] [CrossRef]
  91. Fulton, J.L.; Heald, S.M.; Badyal, Y.S.; Simonson, J.M. Understanding the Effects of Concentration on the Solvation Structure of Ca2+ in Aqueous Solution. I:  The Perspective on Local Structure from EXAFS and XANES. J. Phys. Chem. A 2003, 107, 4688–4696. [Google Scholar] [CrossRef]
  92. Badyal, Y.S.; Barnes, A.C.; Cuello, G.J.; Simonson, J.M. Understanding the Effects of Concentration on the Solvation Structure of Ca2+ in Aqueous Solution. II:  Insights into Longer Range Order from Neutron Diffraction Isotope Substitution. J. Phys. Chem. A 2004, 108, 11819–11827. [Google Scholar] [CrossRef]
  93. de Oliveira, D.M.; Bredt, A.J.; Miller, T.C.; Corcelli, S.A.; Ben-Amotz, D. Spectroscopic and Structural Characterization of Water-Shared Ion-Pairs in Aqueous Sodium and Lithium Hydroxide. J. Phys. Chem. B 2021, 125, 1439–1446. [Google Scholar] [CrossRef] [PubMed]
  94. Drexler, C.I.; Miller, T.C.; Rogers, B.A.; Li, Y.C.; Daly, C.A.; Yang, T.; Corcelli, S.A.; Cremer, P.S. Counter Cations Affect Transport in Aqueous Hydroxide Solutions with Ion Specificity. J. Am. Chem. Soc. 2019, 141, 6930–6936. [Google Scholar] [CrossRef] [PubMed]
  95. Perera, P.N.; Fega, K.R.; Lawrence, C.; Sundstrom, E.J.; Tomlinson-Phillips, J.; Ben-Amotz, D. Observation of water dangling OH bonds around dissolved nonpolar groups. Proc. Natl. Acad. Sci. USA 2009, 106, 12230–12234. [Google Scholar] [CrossRef] [PubMed] [Green Version]
  96. Davis, J.G.; Gierszal, K.P.; Wang, P.; Ben-Amotz, D. Water Structural Transformation at Molecular Hydrophobic Interfaces. Nature 2012, 491, 582–585. [Google Scholar] [CrossRef]
  97. Ahmed, M.; Namboodiri, V.; Mathi, P.; Singh, A.K.; Mondal, J.A. How Osmolyte and Denaturant Affect Water at the Air–Water Interface and in Bulk: A Heterodyne-Detected Vibrational Sum Frequency Generation (HD-VSFG) and Hydration Shell Spectroscopic Study. J. Phys. Chem. C 2016, 120, 10252–10260. [Google Scholar] [CrossRef]
  98. Mondal, J.A. Effect of Trimethylamine N-Oxide on Interfacial Electrostatics at Phospholipid Monolayer–Water Interfaces and Its Relevance to Cardiovascular Disease. J. Phys. Chem. Lett. 2016, 7, 1704–1708. [Google Scholar] [CrossRef]
  99. Mondal, J.A. Metabolite-Affected Interfacial Electrostatics and Its Role in the Pathogenesis of Cardiovascular Disease: An Interface-Selective Vibrational Spectroscopic Study. J. Phys. Chem. C 2016, 120, 21642–21651. [Google Scholar] [CrossRef]
  100. Roy, S.; Patra, A.; Palit, D.K.; Mondal, J.A. Interaction of Zwitterionic Osmolyte Trimethylamine N-oxide (TMAO) with Molecular Hydrophobes: An Interplay of Hydrophobic and Electrostatic Interactions. J. Phys. Chem. B 2021, 125, 10939–10946. [Google Scholar] [CrossRef]
  101. Salazar-Salinas, K.; Baldera-Aguayo, P.A.; Encomendero-Risco, J.J.; Orihuela, M.; Sheen, P.; Seminario, J.M.; Zimic, M. Metal-Ion Effects on the Polarization of Metal-Bound Water and Infrared Vibrational Modes of the Coordinated Metal Center of Mycobacterium tuberculosis Pyrazinamidase via Quantum Mechanical Calculations. J. Phys. Chem. B 2014, 118, 10065–10075. [Google Scholar] [CrossRef] [Green Version]
  102. Vergauwe, R.M.A.; Thomas, A.; Nagarajan, K.; Shalabney, A.; George, J.; Chervy, T.; Seidel, M.; Devaux, E.; Torbeev, V.; Ebbesen, T.W. Modification of Enzyme Activity by Vibrational Strong Coupling of Water. Angew. Chem. Int. Ed. 2019, 58, 15324–15328. [Google Scholar] [CrossRef] [PubMed]
  103. Deng, G.-H.; Shen, Y.; Chen, H.; Chen, Y.; Jiang, B.; Wu, G.; Yang, X.; Yuan, K.; Zheng, J. Ordered-to-Disordered Transformation of Enhanced Water Structure on Hydrophobic Surfaces in Concentrated Alcohol–Water Solutions. J. Phys. Chem. Lett. 2019, 10, 7922–7928. [Google Scholar] [CrossRef] [PubMed]
  104. Verma, P.K.; Kundu, A.; Puretz, M.S.; Dhoonmoon, C.; Chegwidden, O.S.; Londergan, C.H.; Cho, M. The Bend+Libration Combination Band Is an Intrinsic, Collective, and Strongly Solute-Dependent Reporter on the Hydrogen Bonding Network of Liquid Water. J. Phys. Chem. B 2018, 122, 2587–2599. [Google Scholar] [CrossRef] [PubMed]
  105. Shattuck, J.; Shah, P.; Erramilli, S.; Ziegler, L.D. Structure Making and Breaking Effects of Cations in Aqueous Solution: Nitrous Oxide Pump–Probe Measurements. J. Phys. Chem. B 2016, 120, 10569–10580. [Google Scholar] [CrossRef]
Figure 1. Input and output spectra corresponding to the extraction of Mg2+ hydration shell spectrum using Raman-DS-SCF analysis. Input: Raman spectra of 0.25 M MgCl2 (red) as the solution spectrum and 0.5 M NaCl (black) as the reference spectrum. Output: Mg2+ hydration shell spectra (blue) and spectrum of water that are unperturbed by Mg2+ (   fR ( ν ¯ ) ), which is basically the fraction of the reference spectrum removed from the solution spectrum. The coefficients of the Raman-DS-SCF fitting analysis are shown in Table 1 for reference.
Liquids 03 00003 g001
Figure 2. (a) Raman spectra of H2O and HOD (H2O:D2O = 1:9 (v/v)) in the OH stretch region; (b) Isotropic (Iiso)and anisotropic (Ianiso) Raman spectra of H2O. All spectra are peak-normalized at 3420 cm−1. The isotropic and anisotropic Raman spectra are calculated as Iiso = I − 4/3I and Ianiso = 4/3I. where I and I are the parallel and perpendicular spectra recorded by placing a laminated film polarizer (in the detection path) in the parallel and perpendicular orientation with respect to the polarization of the excitation beam.
Liquids 03 00003 g002
Figure 3. Raman spectra (OD stretch) of (a) D2O-H2O mixtures with different mole ratios and (b) D2O with different mole fractions of NaBr. The spectra are normalized for the concentration of OD oscillator in NaBr solution and D2O-H2O mixture. (Reprinted with permission from ref. [37]. Copyright 2013 American Chemical Society).
Liquids 03 00003 g003
Figure 4. (a) Hydration shell water spectra (OH stretch) for I, Br and NO3 in the dilute aqueous solution (1.0 M) of the respective Na-salts. Raman spectra of neat H2O and HOD (H2O/D2O = 1/19; v/v) are shown for comparison. (Reprinted with permission from ref. [36]. Copyright 2013 American Chemical Society). (b) Schematic representation of the first hydration shell of an anion (the number of water molecules shown in the hydration shells are just representative in nature and do not indicate the coordination number of the ions).
Liquids 03 00003 g004
Figure 5. Raman-DS-SCF-extracted hydration shell spectra (peak intensity normalized) of oxyhalide anions in H2O (ac) and HOD (H2O:D2O = 1:6 (v/v); (df)); IO 3 (red; (a,d)), BrO 3 (brown; (b,e)), and ClO 3 (blue; (c,f)). The experimental Raman spectra of the salt solutions (dashed curves) and that of the neat H2O (HOD) (black curve) are shown in each panel for reference. (Reprinted with permission from ref. [60]. Copyright 2021 American Chemical Society).
Liquids 03 00003 g005
Figure 6. Raman-DS-SCF-extracted hydration shell spectra (OH stretch) of CO 3 2 and F in H2O (a,b) and HOD (H2O:D2O = 1:6 (v/v); (c,d)); CO 3 2 (shaded green; (a,c)) and F (shaded orange; (b,d)). The experimental Raman spectra of the salt solutions (dashed curves) and that of the neat H2O (HOD) (black shaded curve) are shown in each panel for reference. DS-SCF-extracted hydration shell spectra (OH stretch) of SO 4 2 (e) in HOD. (Figure 6a–d are reprinted with permission from ref. [64]. Copyright 2021 American Chemical Society).
Liquids 03 00003 g006
Figure 7. Hydration shell spectra (retrieved by Raman-MCR) of monovalent (Cl and I) and divalent (CO32− and SO42−) anions in the HOH bend (a,b) and bend+libration combination regions (c,d); Cl in NaCl (gray), I in NaI (red), SO42− in Na2SO4 (orange) and CO32− in Na2CO3 (purple) solutions (~1 M). The Raman spectrum of bulk H2O (black dotted curve) is shown in each panel for reference. MCR-retrieved spectrum of H2O in D2O (green dashed curve) that bears the Raman response of decoupled H2O (around 1650 cm−1) are shown in panels (a,b) for reference. (Reprinted from ref. [39] with the permission of AIP Publishing).
Liquids 03 00003 g007
Figure 8. Raman-DS-SCF-extracted OH stretch spectra (shaded curves) of water in the hydration shell of (a) Cs+ in CsCl (0.6 M) and (b) Lu3+ in LuCl3 (0.2 M). The spectrum of the bulk water (black dashed curve; multiplied by a factor of 1/20) is shown in each panel for comparison. (Reprinted with permission from ref. [42]. Copyright 2020 American Chemical Society).
Liquids 03 00003 g008
Figure 9. Schematic of the hydration shell of a high-charge-density cation: dashed white lines represent a very weak H-bond; the corresponding parent OH appears at ∼3600 cm−1 in the hydration shell spectrum.
Liquids 03 00003 g009
Figure 10. (a) Raman-DS-SCF-extracted hydration shell spectra (OH stretch) of Mg2+ in MgCl2 solution corresponding to different salt concentrations. Raman spectrum of the bulk water (dotted curve) is shown for reference; (b) The second round Raman-DS-SCF-extracted OH stretch spectra (solid curves) of the shared water in SSIP formed between Mg2+ and Cl, corresponding to different salt concentrations. The hydration shell spectra of the fully hydrated ions corresponding to Mg2+ (gray dashed line) and Cl (black dashed line) are shown for reference. Scheme: Water-shared ion pair representing the hydration water along with the shared water in the hydration shell. (Reprinted with permission from ref. [88]. Copyright 2020 American Chemical Society).
Liquids 03 00003 g010
Figure 11. Hydration shell spectra (OH stretch; retrieved by Raman-MCR) of (a) TBA and (b) TMA+ in aqueous solution (0.8 M). The spectrum of bulk water (black dashed curve) is shown in each panel for reference. (Reprinted with permission from ref. [97]. Copyright 2016 American Chemical Society).
Liquids 03 00003 g011
Figure 12. Hydration shell spectra (OH stretch; retrieved by Raman-MCR) of TMAO in 0.8 M aqueous solution. The spectrum of bulk water (black dashed curve) is shown for reference. (Reprinted with permission from ref. [97]. Copyright 2016 American Chemical Society).
Liquids 03 00003 g012
Table 1. Fitting parameters of Mg2+-hydration shell spectrum (OH stretch).
CoefficientsPeak 1Peak 2Peak 3Peak 4
Amplitude, A n , (×10−4)2.217.29.93.0
Peak center (cm−1), ν ¯ n 3048323433993561
fwhm (cm−1), Γ n 1551136592
A 0 , (×10−4)−0.27
Disclaimer/Publisher’s Note: The statements, opinions and data contained in all publications are solely those of the individual author(s) and contributor(s) and not of MDPI and/or the editor(s). MDPI and/or the editor(s) disclaim responsibility for any injury to people or property resulting from any ideas, methods, instructions or products referred to in the content.

