1. Introduction
Ionic liquids are salts in the liquid state. Due to the strong ionic bond between the cation and the anion, most ionic compounds exist in the form of crystal lattice (solid state) at room temperature. However, many asymmetric organic based ionic liquids appear in liquid form at room temperature due to the weaker ionic bonding between the cation and anion. Ionic liquids have many interesting properties, as they share the properties of molten salts as well as organic liquids, such as low volatility, thermal stability, electrical conductivity, non-flammability, and much more. Ionic liquids are known to be good solvents for many polar and nonpolar solutes. Combined with their special properties, ionic liquids are good replacements for the conventional toxic and volatile organic solvents. Each ionic liquid has different properties to others. In order to alter, tune, and enhance the properties of ionic liquids, sometimes, it is necessary to mix different ionic liquids to achieve the desired properties.
However, using mixtures of ionic liquids in chemical processes requires the reliable estimations of the mixtures’ physical properties, such as refractive index and density. Many general mixing rules for liquids have been proposed so far, which describe specific types of systems. This emphasizes the need to examine these mixing rules with respect to ionic liquid mixtures and to determine the best mixing rule for each physical property. Furthermore, assuming ideal behavior for the mixtures simplifies their complexity. Hence, the validity and accuracy of an ideal mixture assumption are uncertain and need to be examined. This will give a clearer picture in the design stage about the uncertainty of the calculations and in estimating the safety factor required for the design.
In addition to the existing empirical rules for the estimation of the different properties of the ionic liquid mixtures, such as refractive index, artificial intelligence (AI) models such as artificial neural networks (ANNs), regression models, fuzzy logic, support vector machine (SVM), and neural-based fuzzy interference system (ANFIS), can be used to predict the behavior of such complex systems. Different techniques have already been applied for the calculation of the various thermophysical properties of ionic liquid mixtures. Among various AI techniques, ANN alone or along with evolutionary algorithms such as genetic algorithms (GAs) and particle swarm optimization (PSO) has been used effectively to predict the properties of ionic liquid binary mixtures [
1,
2,
3,
4]. These techniques can predict responses with high accuracy, regardless of variation in input parameters. Very few studies have assessed the ability of the ANFIS model for this purpose [
5]. ANFIS, however, is a potential soft computational modelling technique that combines the power of ANN with fuzzy logic [
6,
7,
8]. ANFIS, as with the ANN, learns from training data with any complex relationships, then implements the solutions on a fuzzy inference system (FIS). ANFIS can use FIS to define hidden layers and to improve its predictive ability; thus, it eliminates the difficulty of defining the hidden layers that often exist in ANN; however, the number of membership functions (MFs) should be defined per input. The number of MFs depends on the number of the existing dataset. Their ability to overcome problems with experimental and deterministic models makes them ideal for complex chemical processes. However, determining the structure of ANN has become a major challenge in developing a highly accurate model [
9]. Consequently, Hosoz et al. [
10] pointed out that ANFIS, according to other studies, can predict more accurately than ANN. However, in other studies, it has been stated that the accuracy of these techniques depends on how they are implemented and their applications [
11]. Considering all the aforementioned facts, in the present study, we have made an attempt to develop and examine an ANFIS model to predict the properties of ionic liquid binary mixtures. Our measured density and refractive index of binary ionic liquid mixtures as well as the available published data on these properties have been used in this work.
2. Properties of Binary Liquid Mixtures
2.1. Molar Volume
For ideal liquid mixtures, the molar volume is defined as:
where
is the molar volume of the mixture,
is the individual molar volume of component
i, and
is mole fraction of component
i. Many liquids do not form ideal mixtures and hence do not show volume additivity. The deviation from ideality can be calculated by introducing excess molar volume term to the previous equation. Hence, the equation is written as:
2.2. Mixture Density
The density of a mixture can be defined as the overall mass of mixture occupying one unit volume. It can be calculated by:
where
is the mixture density,
is the total mass of mixture, and
is the total volume of mixture. For ideal liquid mixtures, using volume additivity, this equation can be written in terms of an individual component’s densities as follows:
where
is the density of component
i and
is the mass fraction of component
i. The average absolute relative difference percent (AARD%) is a good statistical parameter for analyzing the success of the proposed correlations for different properties such as density, which is defined as:
2.3. Refractive Index
There are several mixing rules for the refractive index of mixtures in the literature. The most well-known correlations which have been used in this work are the following:
- ○
Lorentz–Lorenz relation (L–L)
where
is the refractive index of the mixture,
is the refractive index of pure component
i, and
is the volume fraction of component
i in the mixture.
- ○
Gladstone–Dale (G–D)
- ○
Arago–Biot (A–B)
- ○
Weiner’s relation (W)
- ○
Heller’s relation (H)
3. Materials and Experiments
The ionic liquids used in this work are 1-butyl-3-methylimidazolium thiocyanate ([BMIM][SCN]), 1-butyl-3-methylimidazolium tetrafluoroborate ([BMIM][BF4]), 1-hexyl-3-methylimidazolium tetrafluoroborate ([HMIM][BF4]), and 1-hexyl-3-methylimidazolium hexafluorophosphate ([HMIM][PF6]). These ionic liquids were supplied by Io-li-tec and used as received. However, new measurements for the density and refractive index were taken for the pure ionic liquids to be used as reference.
Table 1 shows the purity of each ionic liquid reported by Io-li-tec and their molecular weights.
A pipette was used to transfer exact amounts of ionic liquids in a graduated cylinder to measure the total volume, each with uncertainty of 0.05 and 0.1 cm3, respectively. A mass balance of an uncertainty of 1 × 10⁻⁴ g was used to measure the mass of the samples. The refractive index was measured using a programmable digital KEM Refractometer (Kyoto Electronics Manufacturing Co., LTD., Model RA 620, Kyoto, Japan) connected to a water bath to maintain constant temperature. The uncertainty in the refractive index measurement is 1 × 10⁻⁵, and the uncertainty in the temperature measurement is 0.1 K. The density was measured using an Anton Paar U-tube Densitometer (Model DMA 4500 M, Anton Paar GmbH, Graz, Austria) connected to a water bath. The uncertainty in the density measurement is 5 × 10⁻⁵ g cm−3, while the uncertainty in the temperature measurement was 0.1 K.
The density and refractive index of all samples were measured at 20 °C for the pure ionic liquids using an Anton Paar U-tube Densitometer and a Programmable Digital KEM Refractometer, respectively. The temperature was constantly maintained at 20 °C by connecting both the densitometer and the refractometer to a water bath set to a temperature of 20 °C. Binary mixtures of different ionic liquids were prepared from different volume compositions. The mass of each ionic liquid as well as the total mass of the mixture were measured before transfer to the graduated cylinder. A droplet was taken to be used in the refractometer to measure the refractive index. The remainder of the mixture was used to measure the mixture density using the density meter.
4. The Developed ANFIS Model and EFAST Sensitivity Analysis
Fuzzy logic is an appropriate technique for solving complex and nonlinear problems. ANNs have a strong ability to learn from existing data. Fuzzy logic theory is a powerful tool to deal with uncertainty. In general, fuzzy logic is an approach to calculate the degree of accuracy instead of using two-state true or false logic. Therefore, combining fuzzy logic theory with ANNs could provide great results for describing complex patterns, which is called ANFIS modelling. FIS assigns fuzzy rules and a membership function (MF) which ANN can optimize. Takagi–Sugeno and Mamdani are two well-known structures of FISs. Each FIS consists of a number of fuzzy rules, and each fuzzy rule has an antecedent and a consequent. In Mamdani-type FISs, both antecedents and consequents include fuzzy values; however, in Takagi–Sugeno-type FISs, the consequent of fuzzy rules are in the form of a fixed number (for zero type Takagi–Sugeno FISs) or a linear combination of inputs; this type of FISs are often used in ANFIS modelling. In this study, an ANFIS model was developed using the Takagi–Sugeno structure with the Neuro-Fuzzy Designer app in MATLAB 2017a software [
9]. The ANFIS structure comprises four layers, which are fuzzy, product, consequent calculation, and output layer. The first layer includes antecedent fuzzy values (also known as membership functions), the inputs enter these fuzzy values, and a membership grade is produced for each fuzzy value in each rule. In layer 2, the product of membership grades in a fuzzy rule is used as the firing strength of the rule in this this research. Then, in layer 4 (in parallel with layers 1 and 2), the output of each rule is calculated using the input values. In the last layer, the output of the FIS is calculated by the output values and firing strengths of all rules. In this research, the weighted sum of outputs was used, where the weight of each rule output is the firing strength of the same rule. The unknowns of this modelling problem were the number of rules and fuzzy values (membership functions) of rules and consequent parameters. These were identified by using the experimental data.
In this study, various membership functions were investigated for their use in the rules’ antecedents, such as the triangular-shaped membership function (trimf) and others, for which the details can be found elsewhere [
12]. The result of this comparison is given in
Section 6.
To estimate the density parameter using ANFIS, 1670 datasets were collected from the literature, which were applied for model training and cross validation. Cross validation partition defines a random partition on a dataset. This partition is used to define training and validation sets for validating a model. In this study, the early stopping method was used for preventing overfitting and the total dataset partitioned into training (85%) and holdout cross validation (15%) partitions. The holdout cross validation method creates a random nonstratified partition for holdout validation on n observations. Then, to determine the predictive power of the model, the measured data from this study (16 samples) were introduced to the model as external validation or a test dataset. The same procedure was followed for modelling the refractive index parameter, in which 149 data were collected and utilized from the published data for training and validation. Finally, 16 new measured data from this study were entered into the model for external validation. The hybrid-learning algorithm (as detailed in [
13]) was used for parameter estimation, and the validity of the optimized ANFIS model was evaluated using experimental test data. The coefficient of determination (
R2), the root-mean-squared error (RMSE), and average absolute relative deviation (AARD%) were calculated to evaluate the model’s performance [
14,
15].
where
Ye,
Yp, and
Ye show the actual response, predicted response, and the average of the actual response, respectively, and
n is the number of datasets.
For complex nonlinear models, such as the artificial intelligence models, global sensitivity analysis (GSA) techniques are able to provide appropriate information about parameter sensitivity. In the present study, the extended Fourier amplitude sensitivity test (EFAST), which is one of the efficient and well-known GSA methods, was applied for sensitivity analysis in MATLAB 2017 software. FAST is a variance-based global sensitivity analysis technique, which is based on conditional variances, indicating the individual or interaction effects of the uncertain inputs on the response parameter [
16].
5. Experiments
5.1. Pure Ionic Liquids
Density and refractive index of the pure ionic liquids measured at 20 °C are shown in
Table 2.
These values are used as references for the pure components in the analysis. Ionic liquid mixtures prepared for the experiments were labeled, and their measured masses and volumes at 20 °C are shown in
Table 3.
Table 3 shows the volume and mass of each component in the mixture. The mass of each component was used to calculate the mass fraction and mole fraction needed for the rest of calculations.
5.2. Mixtures of Ionic Liquids
5.2.1. Molar Volume and Density of Ionic Liquid Mixtures
Table 4 shows the measured mixture density, ideal mixture density, AARD%, measured mixture molar volume, ideal mixture molar volume, excess molar volume, and AARD% of the prepared ionic liquids.
5.2.2. Refractive Index of Ionic Liquid Mixtures
Table 5 shows the experimental refractive indices of the ionic liquid mixtures and the calculated values using different empirical mixing rules.
As we can see from
Table 5, the refractive index of the ionic liquid mixtures can be confidently estimated using any of the discussed empirical formulae since the average relative error is around 0.25% for each correlation. However, Heller’s relation (H) best estimates the refractive index of these ionic liquid mixtures with an average relative error of 0.242%.
6. ANFIS Modelling
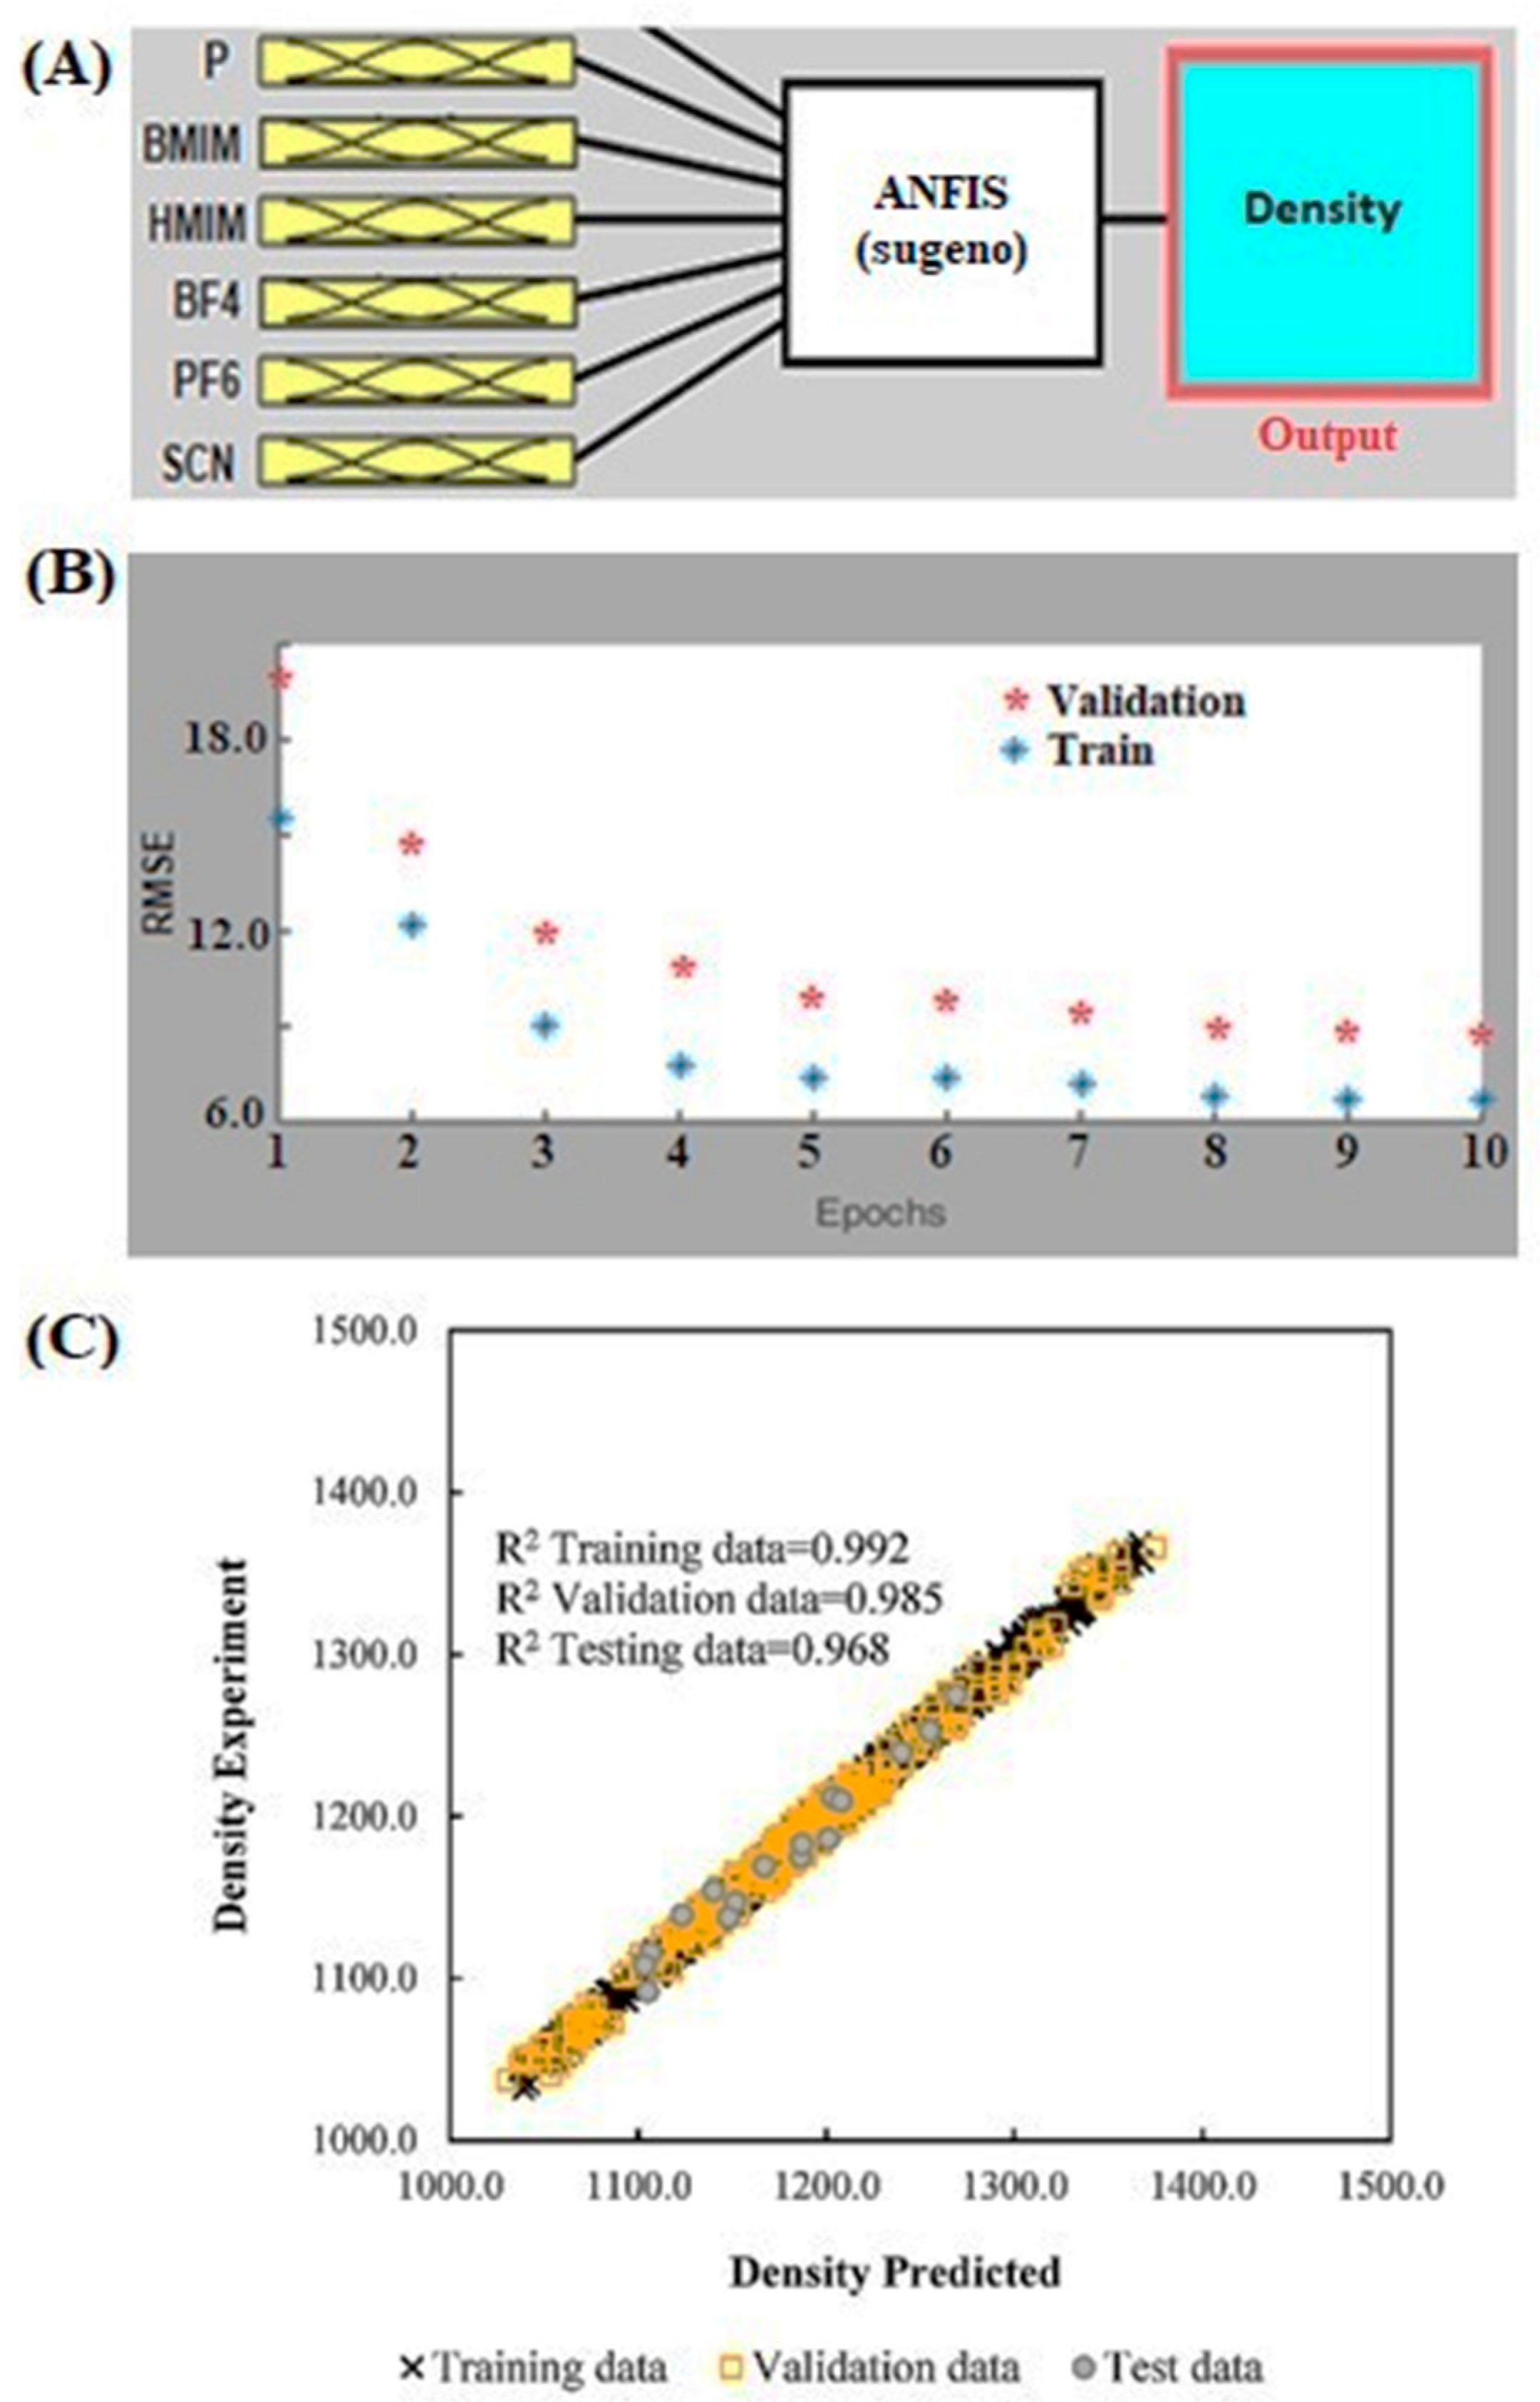
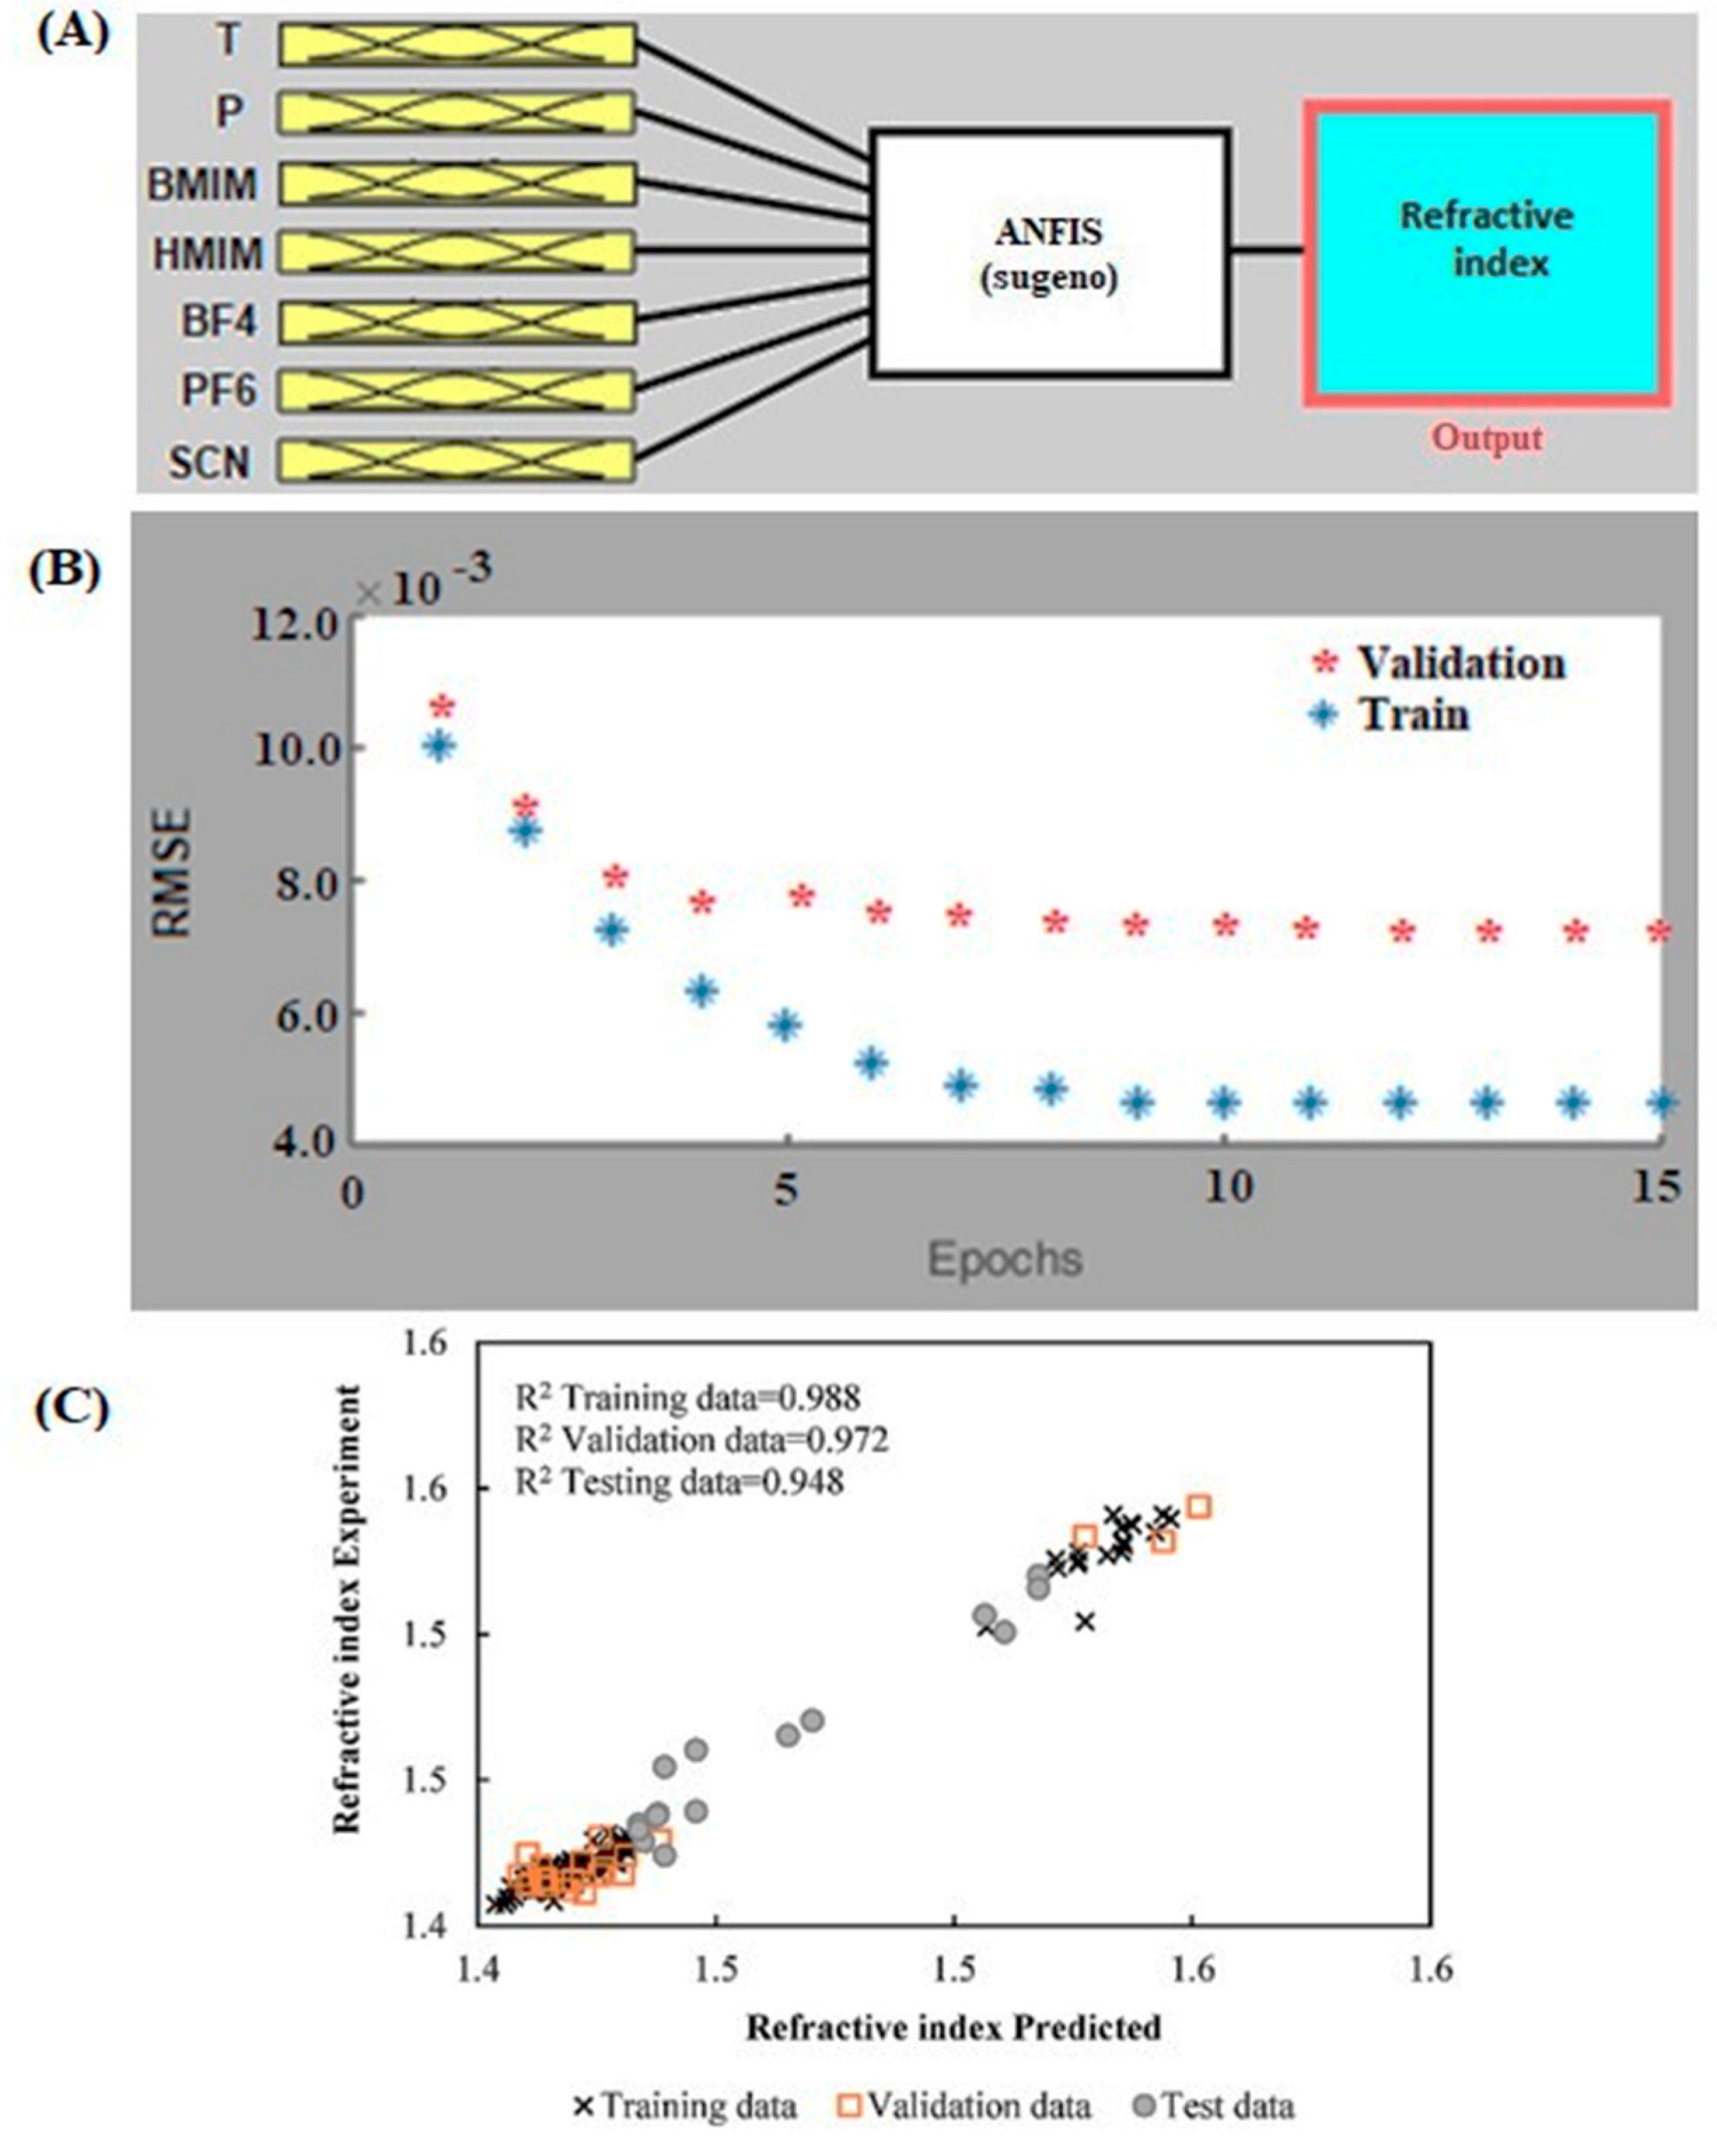
The ANFIS models, developed to predict the density and refractive index of ionic liquid mixtures, are shown in
Figure 1A and
Figure 2A. In this structure, we have employed the Takagi–Sugeno-type FIS with Gaussian curve membership functions. The ANFIS model has seven inputs of temperature (T), pressure (P), BMIM (mole fraction of BMIM ion), HMIM (mole fraction of HMIM ion, BF4 (mole fraction of BF4 ion), PF6 (mole fraction of PF6 ion), and SCN (mole fraction of SCN ion) for density and refractive index prediction. The grid partition technique is used to generate the rules for the model. The obtained results showed that the Gaussian membership function (gaussmf), compared to other membership functions, has less prediction errors in both models.
Figure 1B and
Figure 2B illustrate the RMSE of the models’ training and validation stages. During the training and validation process of the ANFIS model, the RMSEs were plotted versus the number of epochs. The RMSE reduces and then remains constant after some epochs. The RMSE values of the validation step for the density and refractive index models were equal to 8.730 and 7.45 × 10
−3, respectively. The regression curves plotted in
Figure 1C and
Figure 2C display the model outputs, which show a very satisfactory performance. This comparison showed a good consistency between the predicted and actual responses of the ANFIS models.
We have used some statistical parameters as shown in
Table 6 to examine the performance of the developed models.
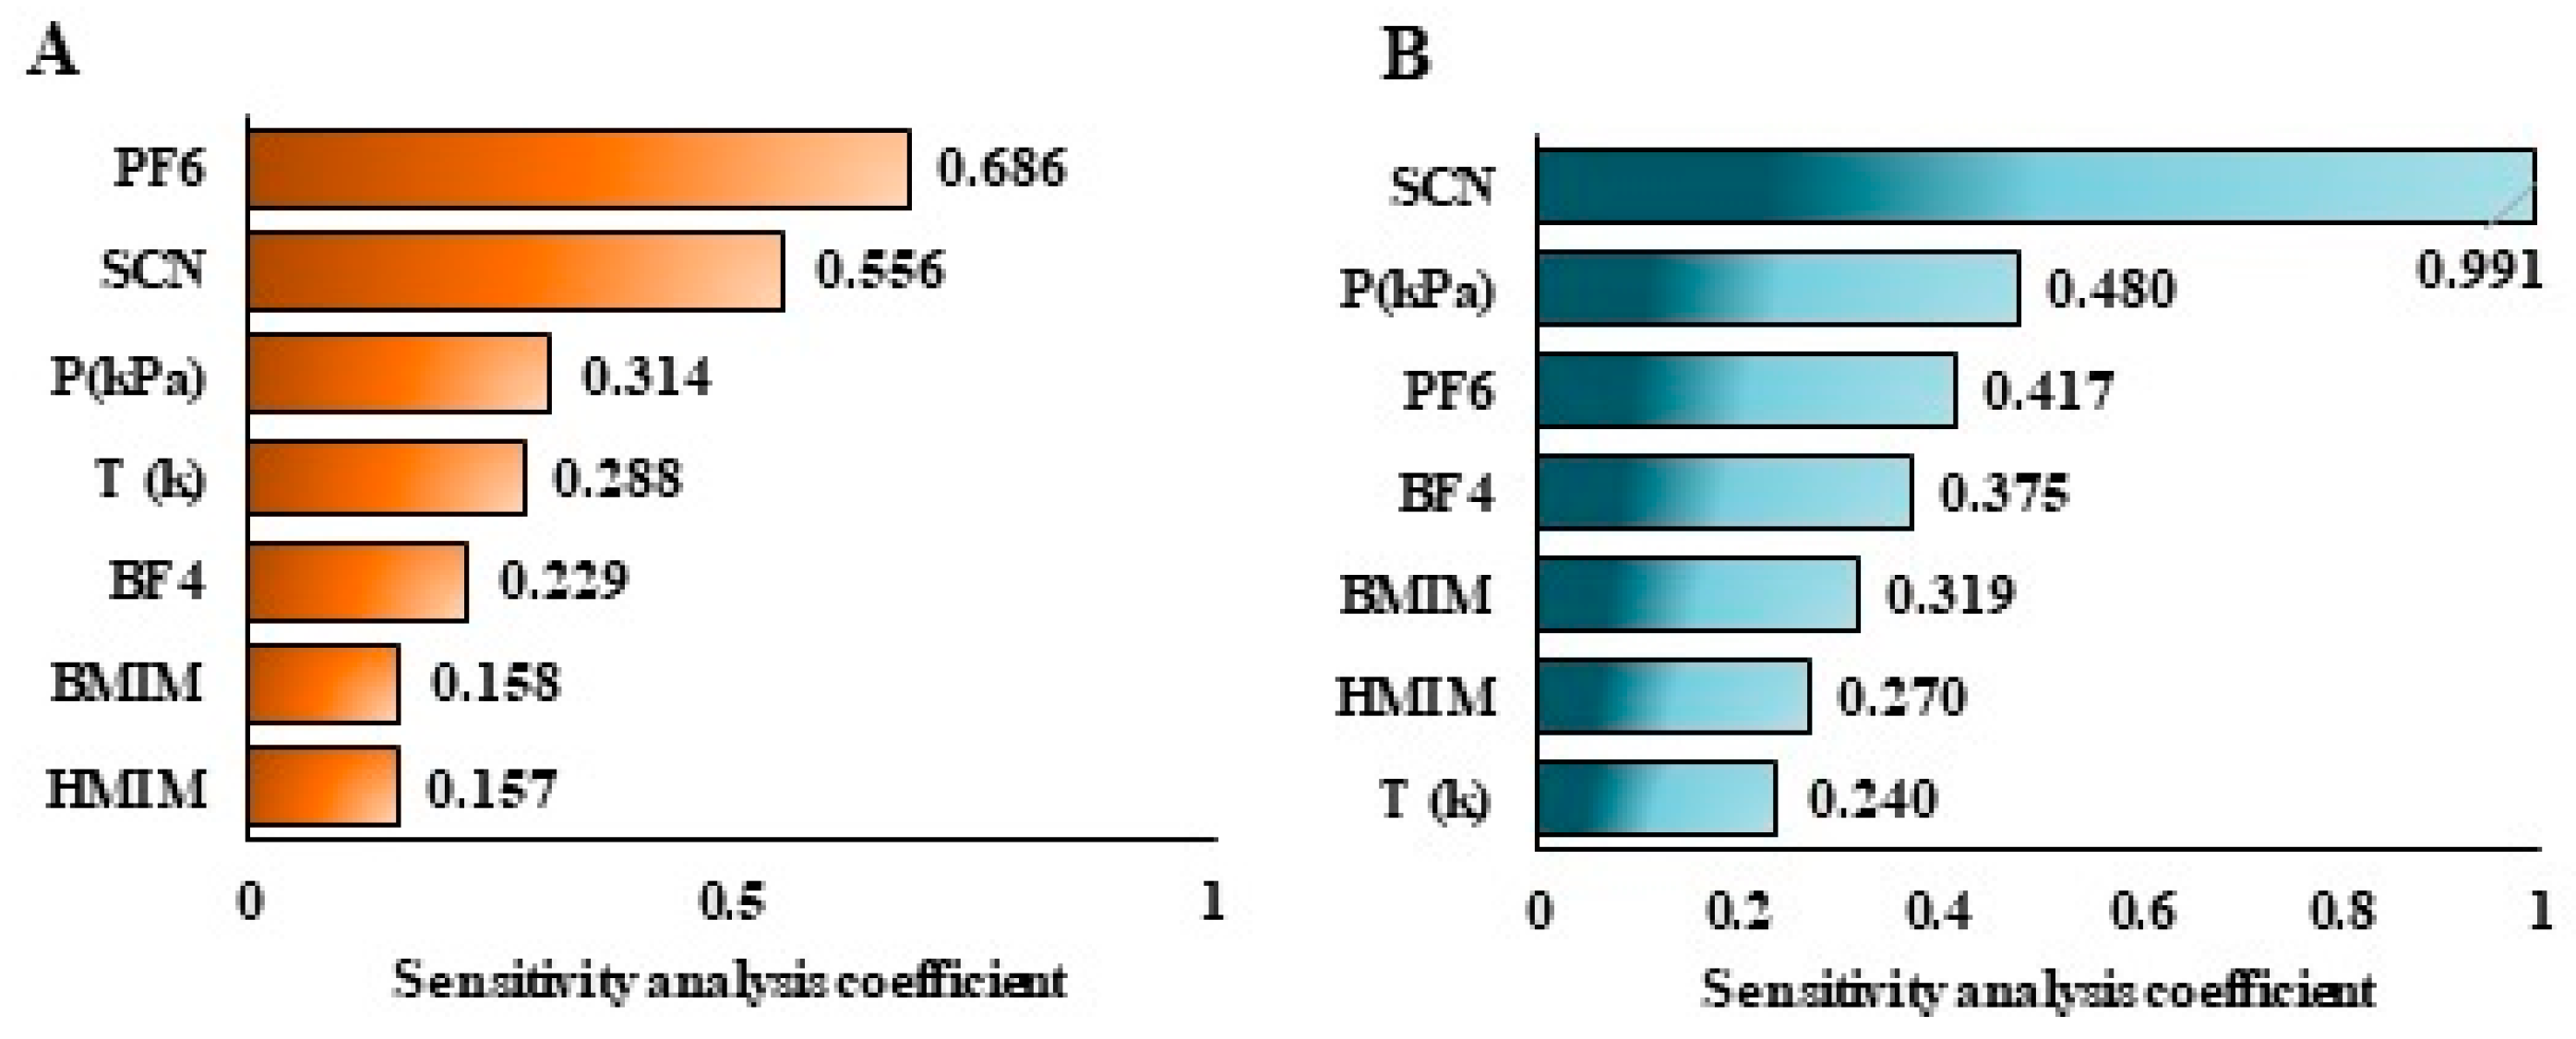
It is noteworthy that the ranges of error parameters for two responses (density and refractive index) are suitable at the training, validation, and test stages. The use of more data in the training and validation stages for density resulted in high predictive power, therefore the test data that were externally validated (not used in the training stage) resulted in predictions with higher accuracy. Moreover, a variance-based global analysis was performed using an extended EFAST method to determine which parameter had the greatest effect on the density and refractive index [
18]. According to
Figure 3A, the first three main factors affecting density are PF6, SCN, and pressure. In addition, according to
Figure 3B, the most effective input parameters for the refractive index were SCN, pressure, and PF6. The coefficient values of different parameters are given in
Figure 3.
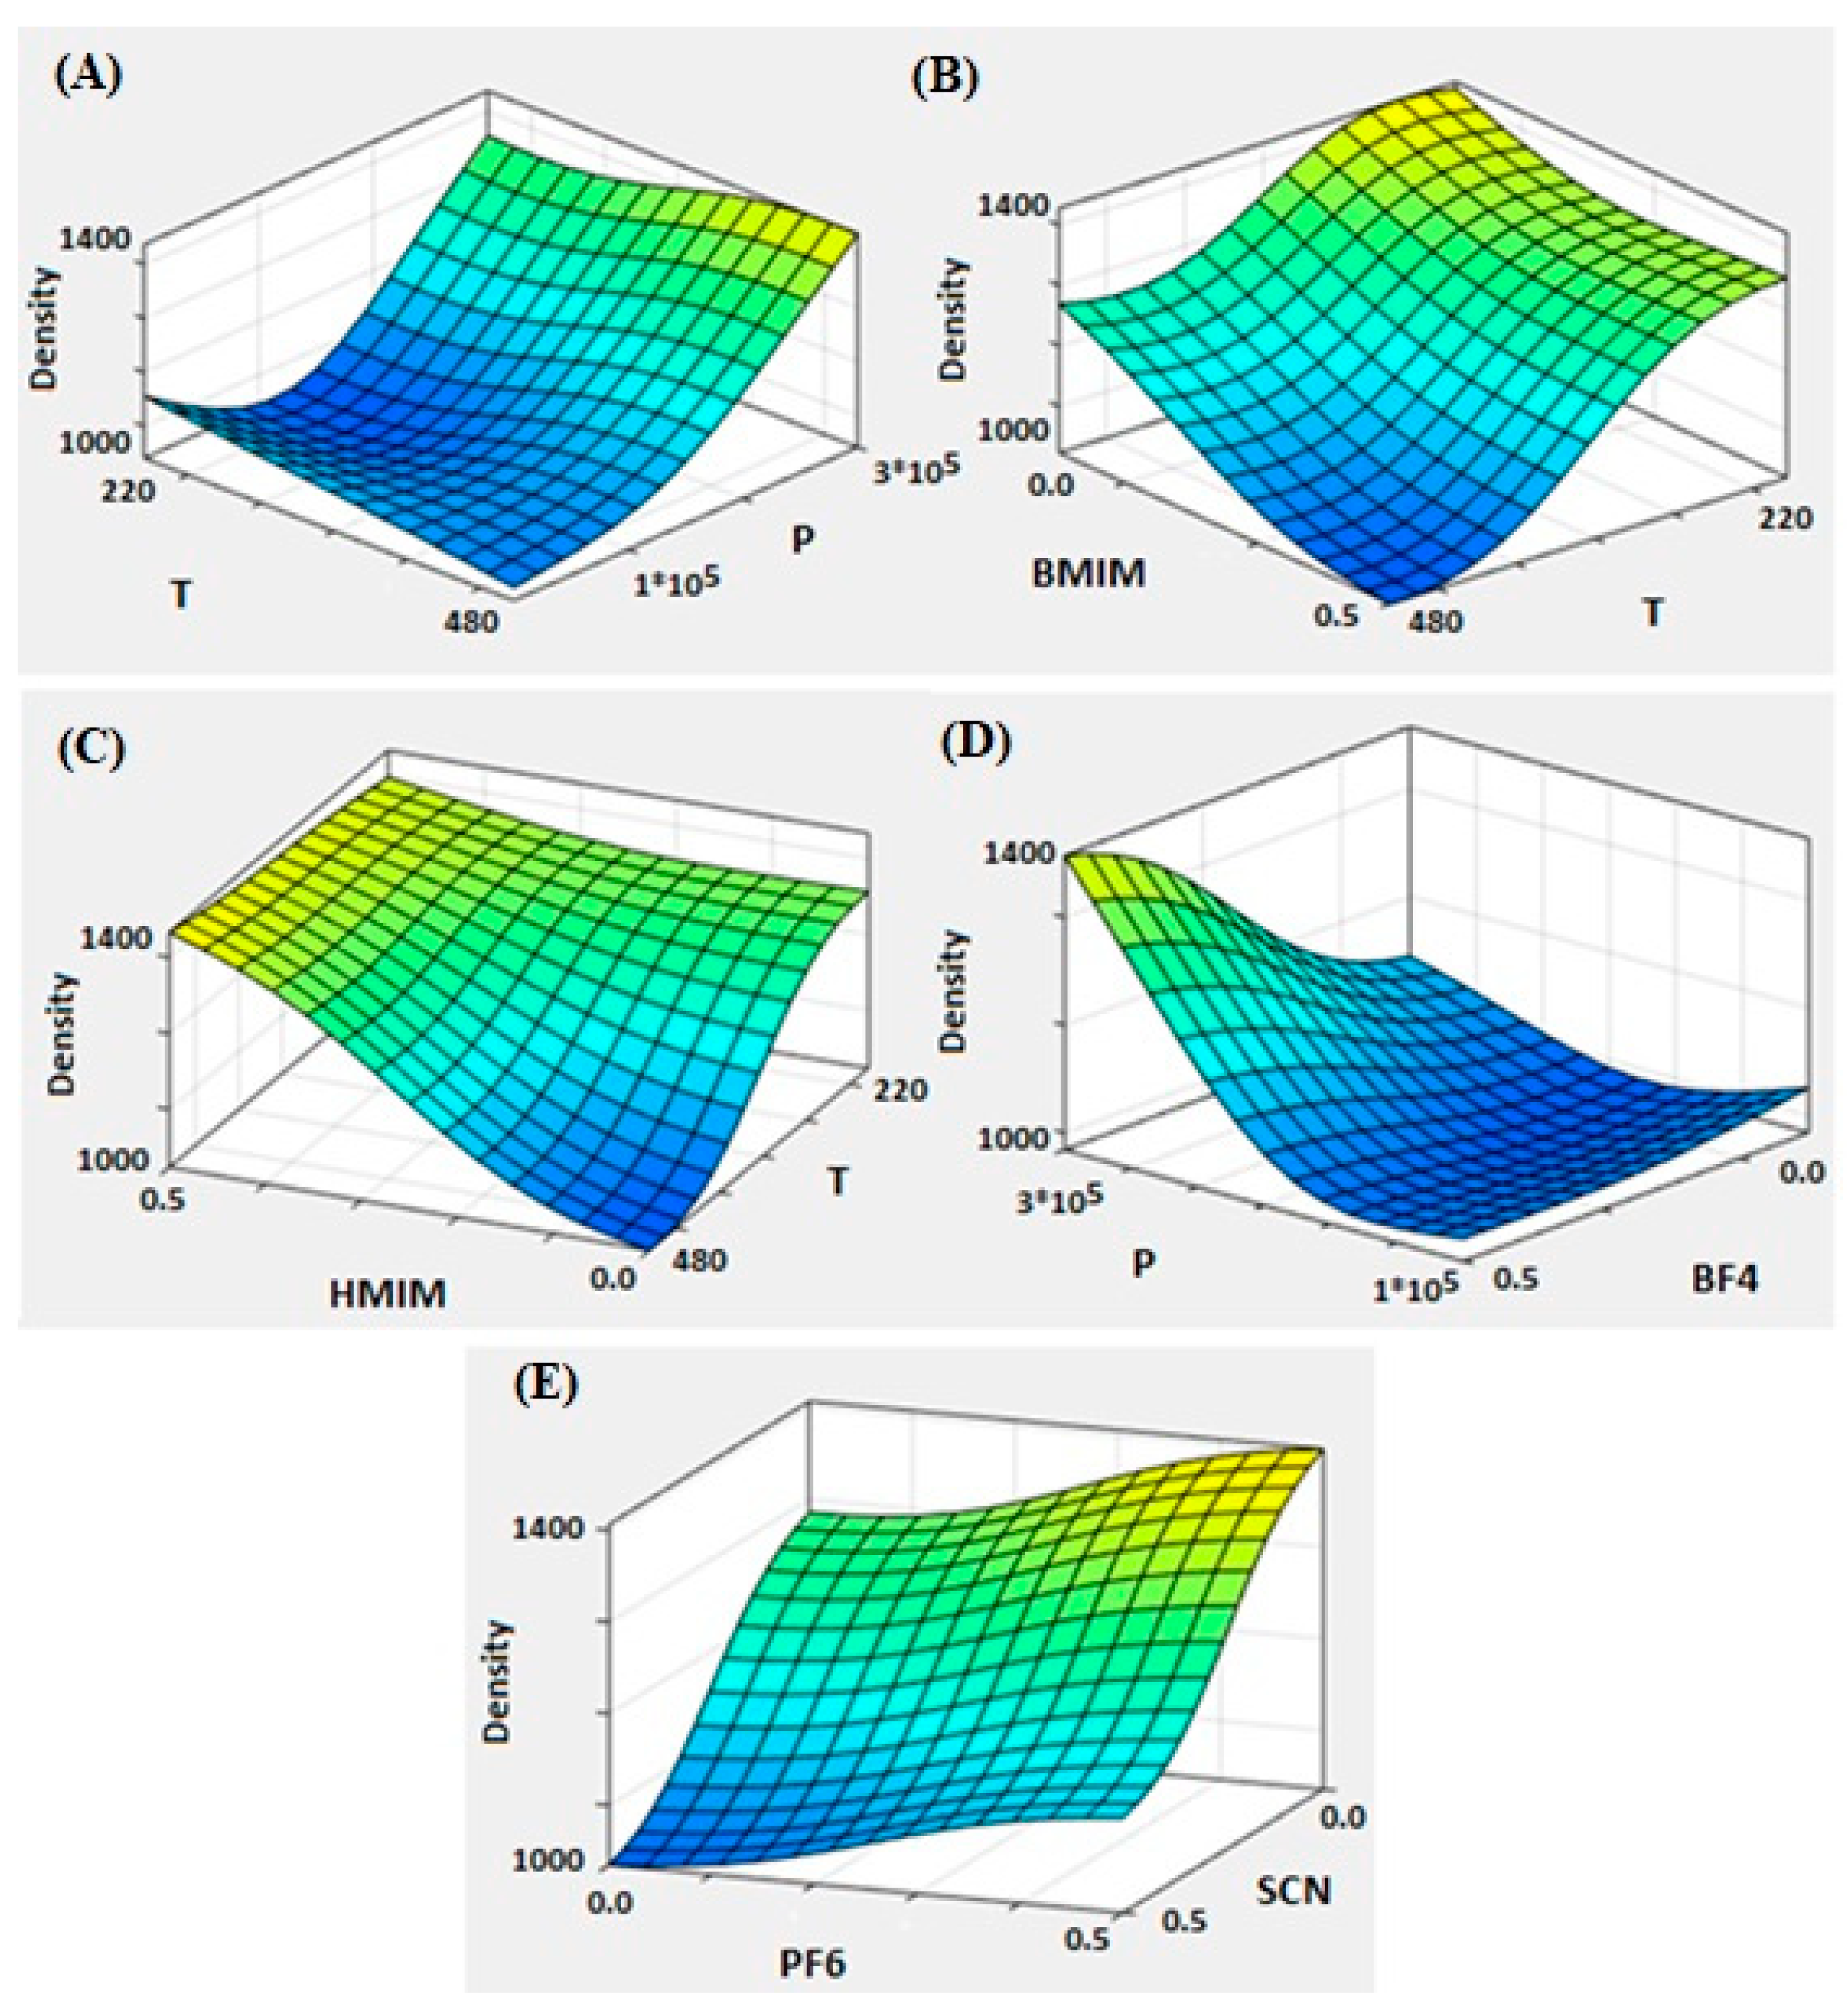
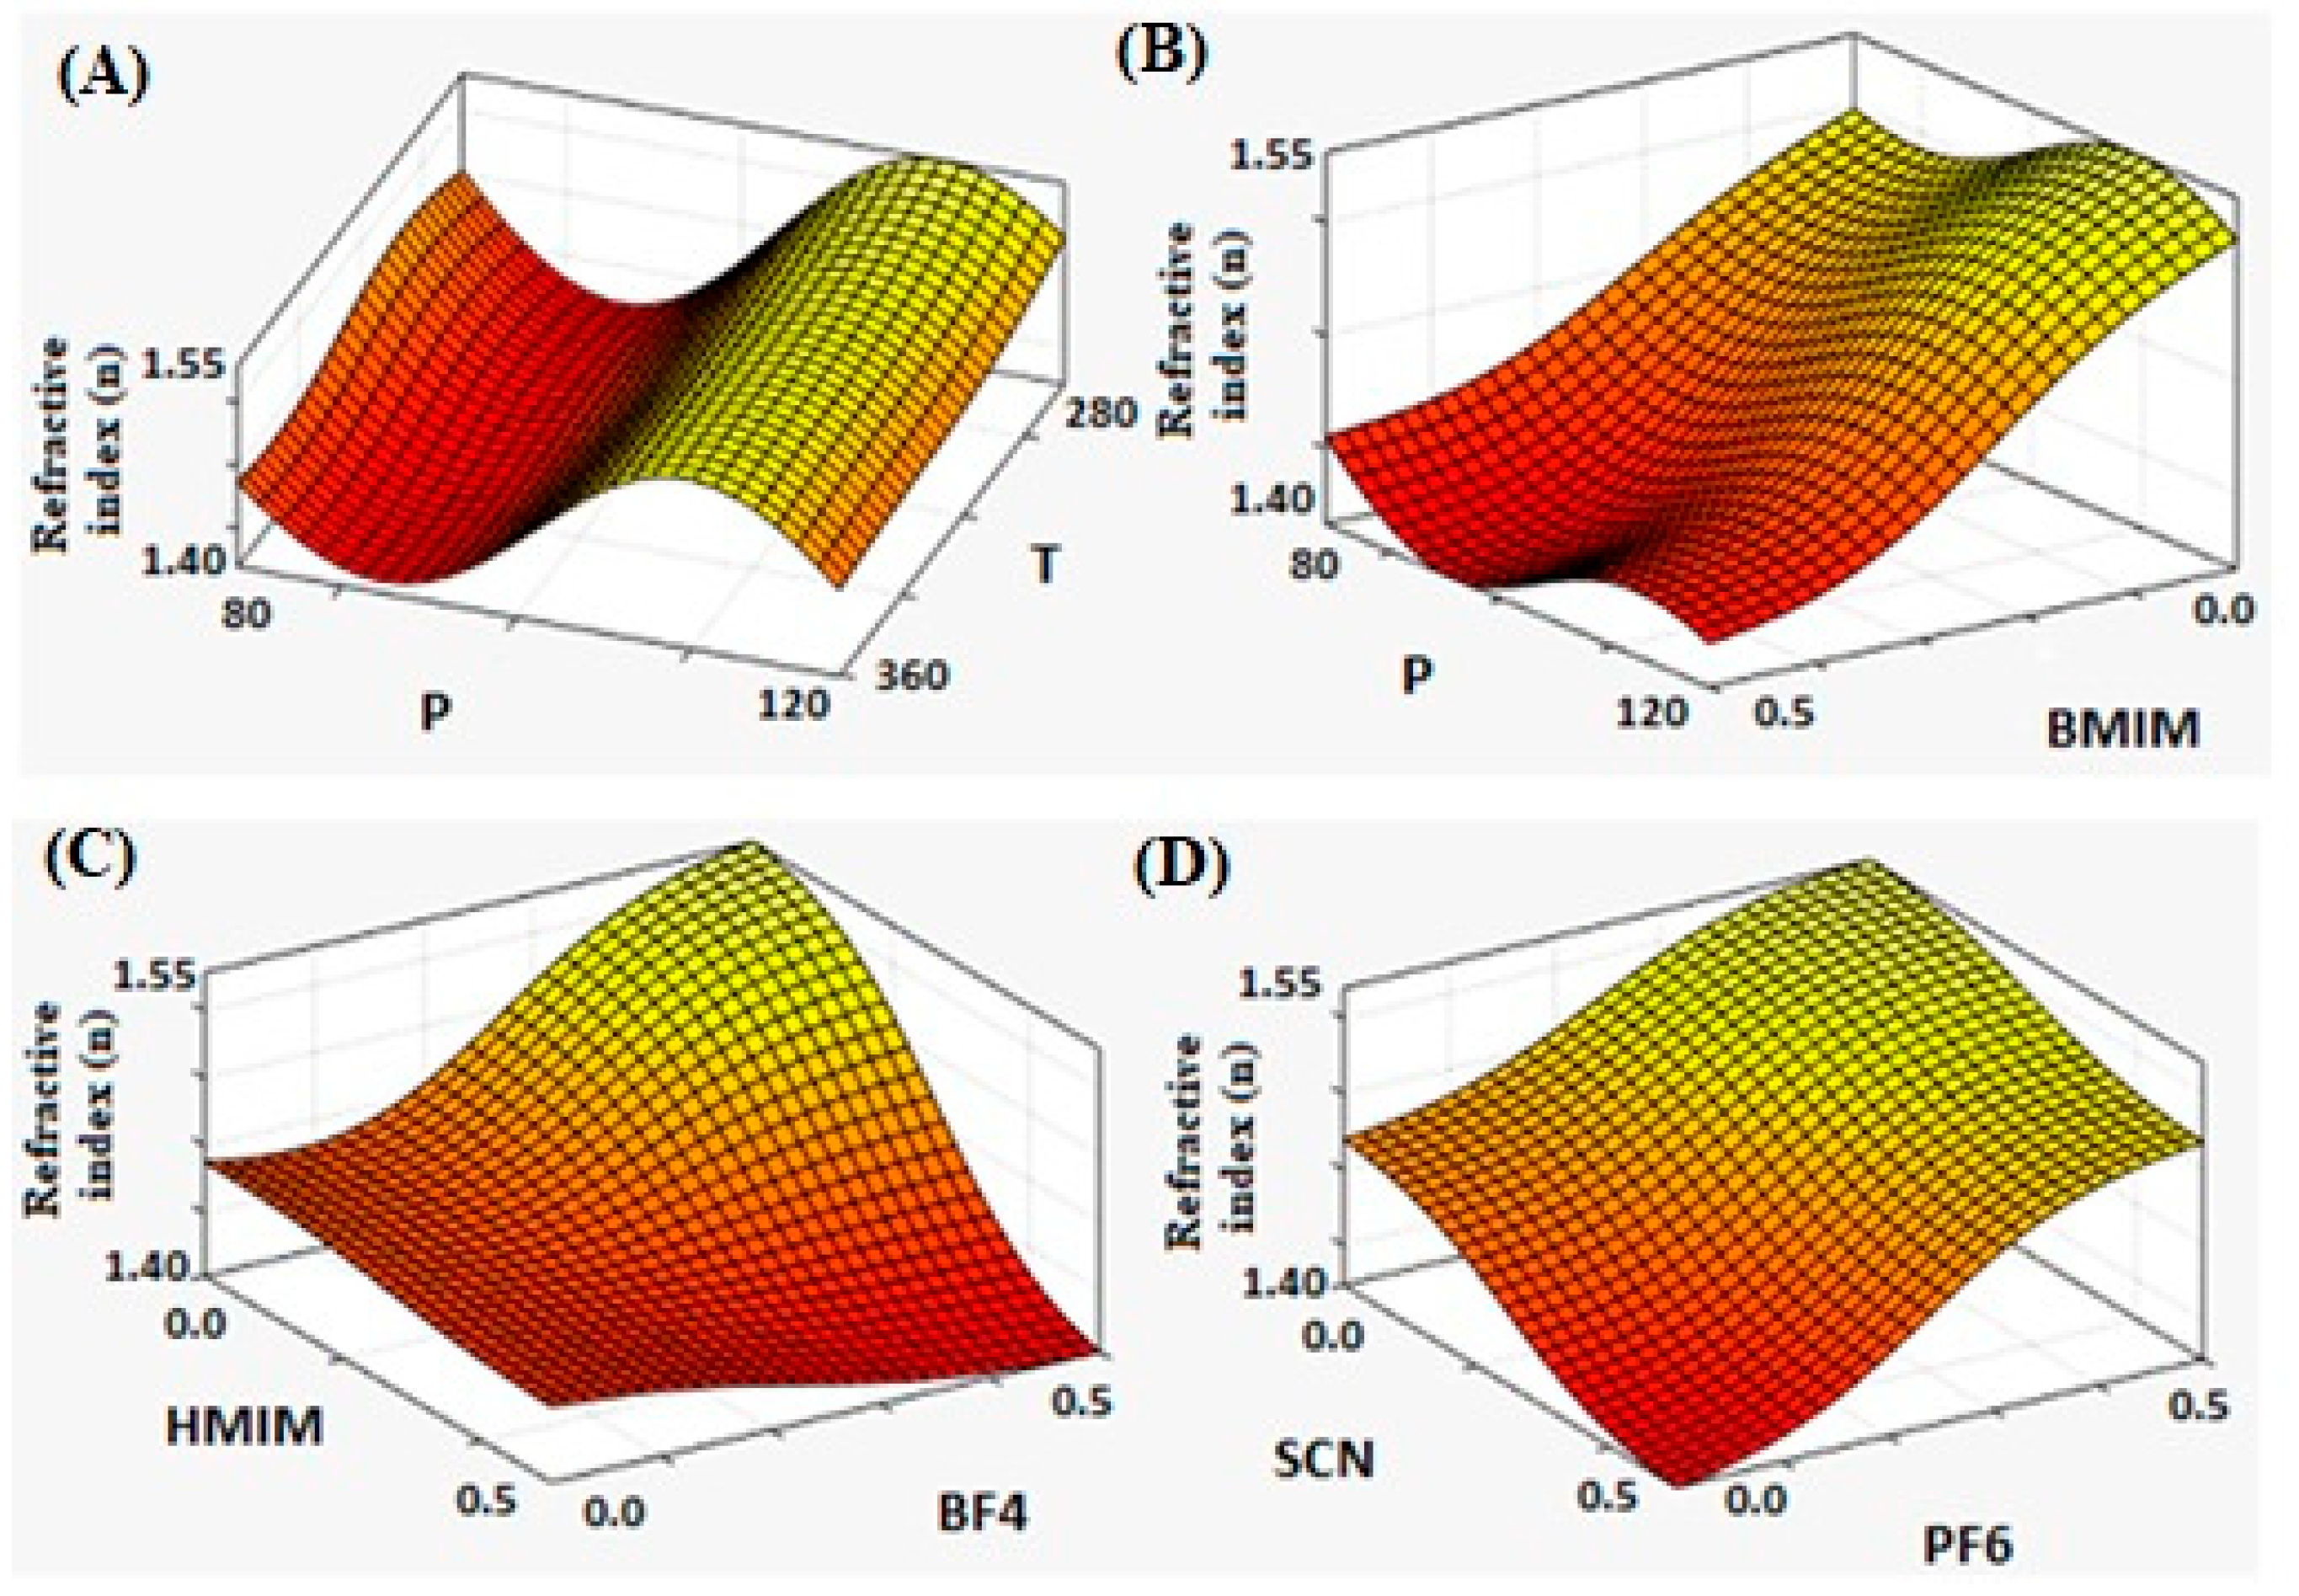
Figure 4 and
Figure 5 show the three-dimensional plots of the developed models for the density and refractive index (n). As shown in
Figure 4A,B, the density parameter often decreases with increasing temperature and increases with increasing pressure. In addition, an increase in parameters BMIM and SCN lead to a decrease in density (
Figure 4B,E). BF4 has very little effect on density (
Figure 4D). HMIM and PF6 have a positive correlation with density, as shown in
Figure 4C,E. It is evident from
Figure 5A that temperature has a negative effect on refractive index, and pressure has shown a non-uniform effect on it. However, the effect of the temperature on the refractive index is very small compared to the effect of pressure. In addition, an increase in parameters BMIM, BF4, and SCN leads to a decrease in the refractive index (
Figure 5B–D). HMIM has very little effect on the refractive index (
Figure 5C). PF6 has a positive correlation with the refractive index, which is shown in
Figure 5D. The model dataset contains 1670 density values over a temperature range of 220–472 K and a pressure range of 100–300,000 kPa collected from the NIST ILThermo database [
19]. The model dataset contains 1670 density values over a temperature range of 220–472 K and a pressure range of 100–300000 kPa collected from the NIST ILThermo database [
19]. Our dataset for the refractive index which contains 149 values also has been collected from the NIST ILThermo database [
19] in the range of 280–353 K for temperature, and the range of 81–116 kPa for pressure. This collected database is available in the
Supplementary file in excel.
7. Conclusions
Density and refractive index of different binary mixtures of ionic liquids were studied in this work. Some data were generated experimentally in this work and the rest of required data were collected from the literature. The effects of different variables such as temperature, pressure, and the molar concentrations of different functional groups in the ionic liquids were investigated. For analyzing the data, we first examined different models including empirical models for these properties. The deviation from the ideal mixture volume was calculated and found to be 0.78%. Therefore, it is a very accurate assumption to assume an ideal mixture and apply a volume additivity rule. Furthermore, the refractive indices of the binary ionic liquid mixtures were measured and compared with the estimated values using different empirical mixing rules. All of the empirical rules showed good performance for estimation of the refractive index of the binary ionic liquid mixtures, with an average percentage error around 0.25%. However, Heller’s relation was found to be the best model to estimate these mixtures’ refractive index with an average relative error of only 0.242%. For gaining a deep understanding of the effects of the different parameters on the density and refractive index of the studied mixtures, we have also developed artificial intelligence models. An ANFIS model was developed to predict a density and refractive index, and the grid partition technique was implemented. Our results showed that the Gaussian membership function, compared to other membership functions, has a low prediction error. Based on obtained results, the developed model showed excellent performance for predicting the density and refractive index of various mixtures, with overall R2, RMSE, and AARD% values of 0.985, 8.730, 0.649%, and 0.972, 7.45 × 10⁻³, and 0.444%, in cross validation, and 0.968, 7.274, 0.368%, and 0.948, 7.32 × 10⁻³, and 0.319% in the external validation stages, respectively. According to the sensitivity analysis using the EFAST method, the most effective input parameters for both properties were found to be SCN, pressure, and PF6.
Author Contributions
Conceptualization, G.R.V.-N.; methodology, G.R.V.-N.; software, F.M.; formal analysis, G.R.V.-N. and F.M.; resources, G.R.V.-N.; data curation, M.H.; writing—original draft preparation, G.R.V.-N., F.M. and M.H.; writing—review and editing, F.M., M.M. and G.R.V.-N.; project administration, G.R.V.-N.; funding acquisition, G.R.V.-N. and M.M. All authors have read and agreed to the published version of the manuscript.
Funding
The authors are thankful to Sultan Qaboos University for the financial support through the internal grant project number IG/ENG/PCED/22/02.
Data Availability Statement
Not applicable.
Conflicts of Interest
The authors declare no conflict of interest.
References
- Hemmati-Sarapardeh, A.; Tashakkori, M.; Hosseinzadeh, M.; Mozafari, A.; Hajirezaie, S. On the evaluation of density of ionic liquid binary mixtures: Modeling and data assessment. J. Mol. Liq. 2016, 222, 745–751. [Google Scholar] [CrossRef]
- Astray Dopazo, G.; González-Temes, M.; Larios López, D.; Mejuto, J.C. Density, viscosity and refractive index prediction of binary and ternary mixtures systems of ionic liquid. Mediterr. J. Chem. 2014, 3, 972–986. [Google Scholar] [CrossRef]
- Ornedo-Ramos, K.F.P.; Muriel, C.A.M.; Adornado, A.P.; Soriano, A.N.; Bungay, V.C. Prediction of density of binary mixtures of ionic liquids with alcohols (methanol/ethanol/1-propanol) using artificial neural network. ASEAN J. Chem. Eng. 2015, 15, 33–50. [Google Scholar] [CrossRef]
- Movagharnejad, K.; Vafaei, N. A Comparison Between GA and PSO Algorithms in Training ANN to Predict the Refractive Index of Binary Liquid Solutions. J. Chem. Pet. Eng. 2018, 52, 125–135. [Google Scholar]
- Barati-Harooni, A.; Najafi-Marghmaleki, A.; Mohammadi, A.H. ANFIS modeling of ionic liquids densities. J. Mol. Liq. 2016, 224, 965–975. [Google Scholar] [CrossRef]
- Mehrabi, D.; Mohammadzaheri, M.; Firoozfar, A.; Emadi, M. A fuzzy virtual temperature sensor for an irradiative enclosure. J. Mech. Sci. Technol. 2017, 31, 4989–4994. [Google Scholar] [CrossRef]
- Mohammadzaheri, M.; Grainger, S.; Bazghaleh, M. Fuzzy modeling of a piezoelectric actuator. Int. J. Precis. Eng. Manuf. 2012, 13, 663–670. [Google Scholar] [CrossRef]
- Mohammadzaheri, M.; Al Qallaf, A.; Ghodsi, M.; Ziaiefar, H. Development of a Fuzzy Model to Estimate the Head of Gaseous Petroleum Fluids Driven by Electrical Submersible Pumps. Fuzzy Inf. Eng. 2018, 10, 99–106. [Google Scholar] [CrossRef] [Green Version]
- Ibrahim, K.S.M.H.; Huang, Y.F.; Ahmed, A.N.; Koo, C.H.; El-Shafie, A. A review of the hybrid artificial intelligence and optimization modelling of hydrological streamflow forecasting. Alex. Eng. J. 2022, 61, 279–303. [Google Scholar] [CrossRef]
- Hosoz, M.; Ertunc, H.M.; Bulgurcu, H. An adaptive neuro-fuzzy inference system model for predicting the performance of a refrigeration system with a cooling tower. Expert Syst. Appl. 2011, 38, 14148–14155. [Google Scholar] [CrossRef]
- Gill, J.; Singh, J.; Ohunakin, O.S.; Adelekan, D.S. Artificial neural network approach for irreversibility performance analysis of domestic refrigerator by utilizing LPG with TiO2–lubricant as replacement of R134a. Int. J. Refrig. 2018, 89, 159–176. [Google Scholar] [CrossRef]
- Marjani, A.; Babanezhad, M.; Shirazian, S. Application of adaptive network-based fuzzy inference system (ANFIS) in the numerical investigation of Cu/water nanofluid convective flow. Case Stud. Therm. Eng. 2020, 22, 100793. [Google Scholar] [CrossRef]
- Mohammadzaheri, M.; Amouzadeh, A.; Doustmohammadi, M.; Emadi, M.; Jamshidi, E.; Ghodsi, M.; Soltani, P. Fuzzy Analysis of Resonance Frequencies for Structural Inspection of an Engine Cylinder Block. Fuzzy Inf. Eng. 2021, 13, 266–276. [Google Scholar] [CrossRef]
- Deng, Y.; Xiao, H.; Xu, J.; Wang, H. Prediction model of PSO-BP neural network on coliform amount in special food. Saudi J. Biol. Sci. 2019, 26, 1154–1160. [Google Scholar] [CrossRef] [PubMed]
- Jahangir, M.H.; Mousavi Reineh, S.M.; Abolghasemi, M. Spatial predication of flood zonation mapping in Kan River Basin, Iran, using artificial neural network algorithm. Weather Clim. Extrem. 2019, 25, 100215. [Google Scholar] [CrossRef]
- Ebert, N.; Goos, J.C.; Kirschbaum, F.; Yildiz, E.; Koch, T. Methods of sensitivity analysis in model-based calibration. Automot. Engine Technol. 2020, 5, 45–56. [Google Scholar] [CrossRef]
- Vakili-Nezhaad, G.R.; Vatani, M.; Asghari, M.; Ashour, I. Effect of temperature on the physical properties of 1-butyl-3-methylimidazolium based ionic liquids with thiocyanate and tetrafluoroborate anions, and 1-hexyl-3-methylimidazolium with tetrafluoroborate and hexafluorophosphate anions. J. Chem. Thermodyn. 2012, 54, 148–154. [Google Scholar] [CrossRef]
- Mohammadi, F.; Bina, B.; Karimi, H.; Rahimi, S.; Yavari, Z. Modeling and sensitivity analysis of the alkylphenols removal via moving bed biofilm reactor using artificial neural networks: Comparison of Levenberg Marquardt and particle swarm optimization training algorithms. Biochem. Eng. J. 2020, 161, 107685. [Google Scholar] [CrossRef]
- Ionic Liquids Database—ILThermo (v2.0). Available online: https://ilthermo.boulder.nist.gov/ (accessed on 23 July 2022).
| Publisher’s Note: MDPI stays neutral with regard to jurisdictional claims in published maps and institutional affiliations. |
© 2022 by the authors. Licensee MDPI, Basel, Switzerland. This article is an open access article distributed under the terms and conditions of the Creative Commons Attribution (CC BY) license (https://creativecommons.org/licenses/by/4.0/).

 ,
, 


