Article

Spatial Variation of Tetracycline-Resistant E. coli and Relationships with Water Quality Variables in Irrigation Water: A Pilot Study

1
Environmental Microbial and Food Safety Laboratory, Agricultural Research Service, United States Department of Agriculture, Beltsville, MD 20705, USA
2
Oak Ridge Institute of Science and Education, Oak Ridge, TN 37831, USA
*
Author to whom correspondence should be addressed.
Appl. Microbiol. 2023, 3(2), 504-518; https://doi.org/10.3390/applmicrobiol3020036
Submission received: 27 April 2023 / Revised: 18 May 2023 / Accepted: 26 May 2023 / Published: 30 May 2023

Abstract

:
Irrigation waters may facilitate the spread of antibiotic-resistant bacteria or genes to humans and animals. Monitoring of resistance in irrigated waters has become common; however, many studies do not incorporate a spatial component into sampling designs. The objective of this work was to assess spatiotemporal variations in tetracycline-resistant E. coli in an irrigation pond. Water samples were collected at 10 locations and two different water depths, and in situ and laboratory water quality measurements were performed. The percentage of E. coli resistant to the low (4 μg mL−1) and high (16 μg mL−1) tetracycline doses varied by date and location but were observed to be as high as 12.7% and 6.3% of the total population throughout the study, respectively. While significant differences were not observed between resistance levels measured at different depths, on one date resistant E. coli were only detected in samples collected at depth. Nitrate, fluorescent dissolved organic matter, and dissolved oxygen concentrations were found to be the leading control variables for the percentage of resistant E. coli. This work demonstrates that there may be substantial spatial variability in concentrations of antibiotic-resistant E. coli in irrigation ponds which should be accounted for in the design of monitoring programs.

1. Introduction

Antibiotic resistance is currently a major worldwide health challenge. Antibiotic-resistant bacteria (ARB) can cause diseases which are difficult to treat when the infecting bacteria are resistant to one or multiple drugs. The environment plays a major role in the transmission and evolution of ARB, and resistance is intimately linked with human and animal antibiotic use and excretion [1]. The aquatic environment has been identified as the most important environmental compartment of ARB, mostly due to its receiving wastewater effluents and surface runoff [2]. In recent years, E. coli has become a proxy microorganism to study the levels of ARB in the environment due to its ubiquity, extensive characterization as a model organism, and relevance in food safety [3,4]. However, while much work has gone into the study of concentrations of E. coli in irrigation sources and the related variability, information on the spatial and temporal distributions of antibiotic-resistant E. coli and the physicochemical water quality factors which may control resistance levels are not well understood. This has been acknowledged as a major emerging issue in monitoring and modeling the microbial quality of waters [5].
One of the most widely used classes of antibiotics are tetracyclines. Their affordability, accessibility, and standing as the most widely prescribed antibiotic class used for animals is largely responsible for its prominent presence in the environment [6,7,8,9]. Like all other antibiotics, there are currently no legal limits set for tetracycline-resistant bacteria concentrations, the presence of resistance genes, or antibiotic residues; rather, there exist only cautionary principles and calls for action by policymakers, possibly due to a lack of information to support the creation of regulatory standards [1].
In contrast with the size of the body of literature assessing spatial differences in antibiotic-resistant fecal bacteria in lotic waters (e.g., multiple locations along a river) [10,11,12,13,14], sampling of lentic waterbodies (e.g., ponds, lakes, dammed waters) is usually carried out with less spatial resolution, such that spatial variability in resistance cannot be accurately assessed. Additionally, in many cases, studies average measurement results from multiple locations rather than providing site-specific information. The results of the few studies examining the spatial variability of ARB in lakes indicate the need to sample several locations when performing resistance surveys. For example, a study focusing on antibiotic-resistant E. coli in Lake Jinsha found substantial differences in multidrug resistance ratios between the eight sampling locations [15]. In another study which assessed the spatial variability of bacteria resistant to six antibiotics in two lakes it was found that concentrations of resistant heterotrophic bacteria can vary by orders of magnitude at different sampling locations in the same waterbody [16].
Freshwater irrigation ponds serve as an important source of water for crops, yet information on the spatial distribution of ARB in these ponds is not currently available. Rather, the literature on ARB in irrigation ponds usually focuses on numerous ponds but only one sample is taken per sampling event (e.g., [17,18]). So far, spatial analysis of ARB in ponds has mostly been performed in stormwater, retention, or treatment ponds, but in many cases these involve sampling of the influent and effluent, with more intensive sampling rarely occurring [19,20]. A recent review on freshwater environments as reservoirs for ARB has pointed out that ponds could be high in ARB, but this cannot be properly evaluated if in the available studies only one sample is withdrawn for analysis [21].
Recent research has shown that antibiotics residing in irrigation waters can be taken up and bioaccumulated in irrigated plants [22]. Thus, contaminated irrigation waters and associated crops have the potential to act as vectors for the spread of antibiotic resistance to animal and human populations [23]. With this being the case, it is vital to develop better monitoring strategies to assess antibiotic resistance in irrigation water sources. Additionally, a recent review by Liguori et al. [4] poses numerous critical research questions regarding antibiotic resistance monitoring in surface waters, including assessment of environmental factors (e.g., pH, temperature, solar radiation, etc.), which may substantially elevate selective pressures for resistant microbes and the maintenance of antibiotic resistance genes (ARGs).
To our knowledge there have been no reports into the three-dimensional spatial variation of ARB in freshwater irrigation ponds or lakes. The objectives of this pilot project were to (1) assess the spatiotemporal variability of E. coli in non-amended and tetracycline-amended samples at two different antibiotic dosess and (2) determine predictive relationships between water quality variables and resistant E. coli populations.

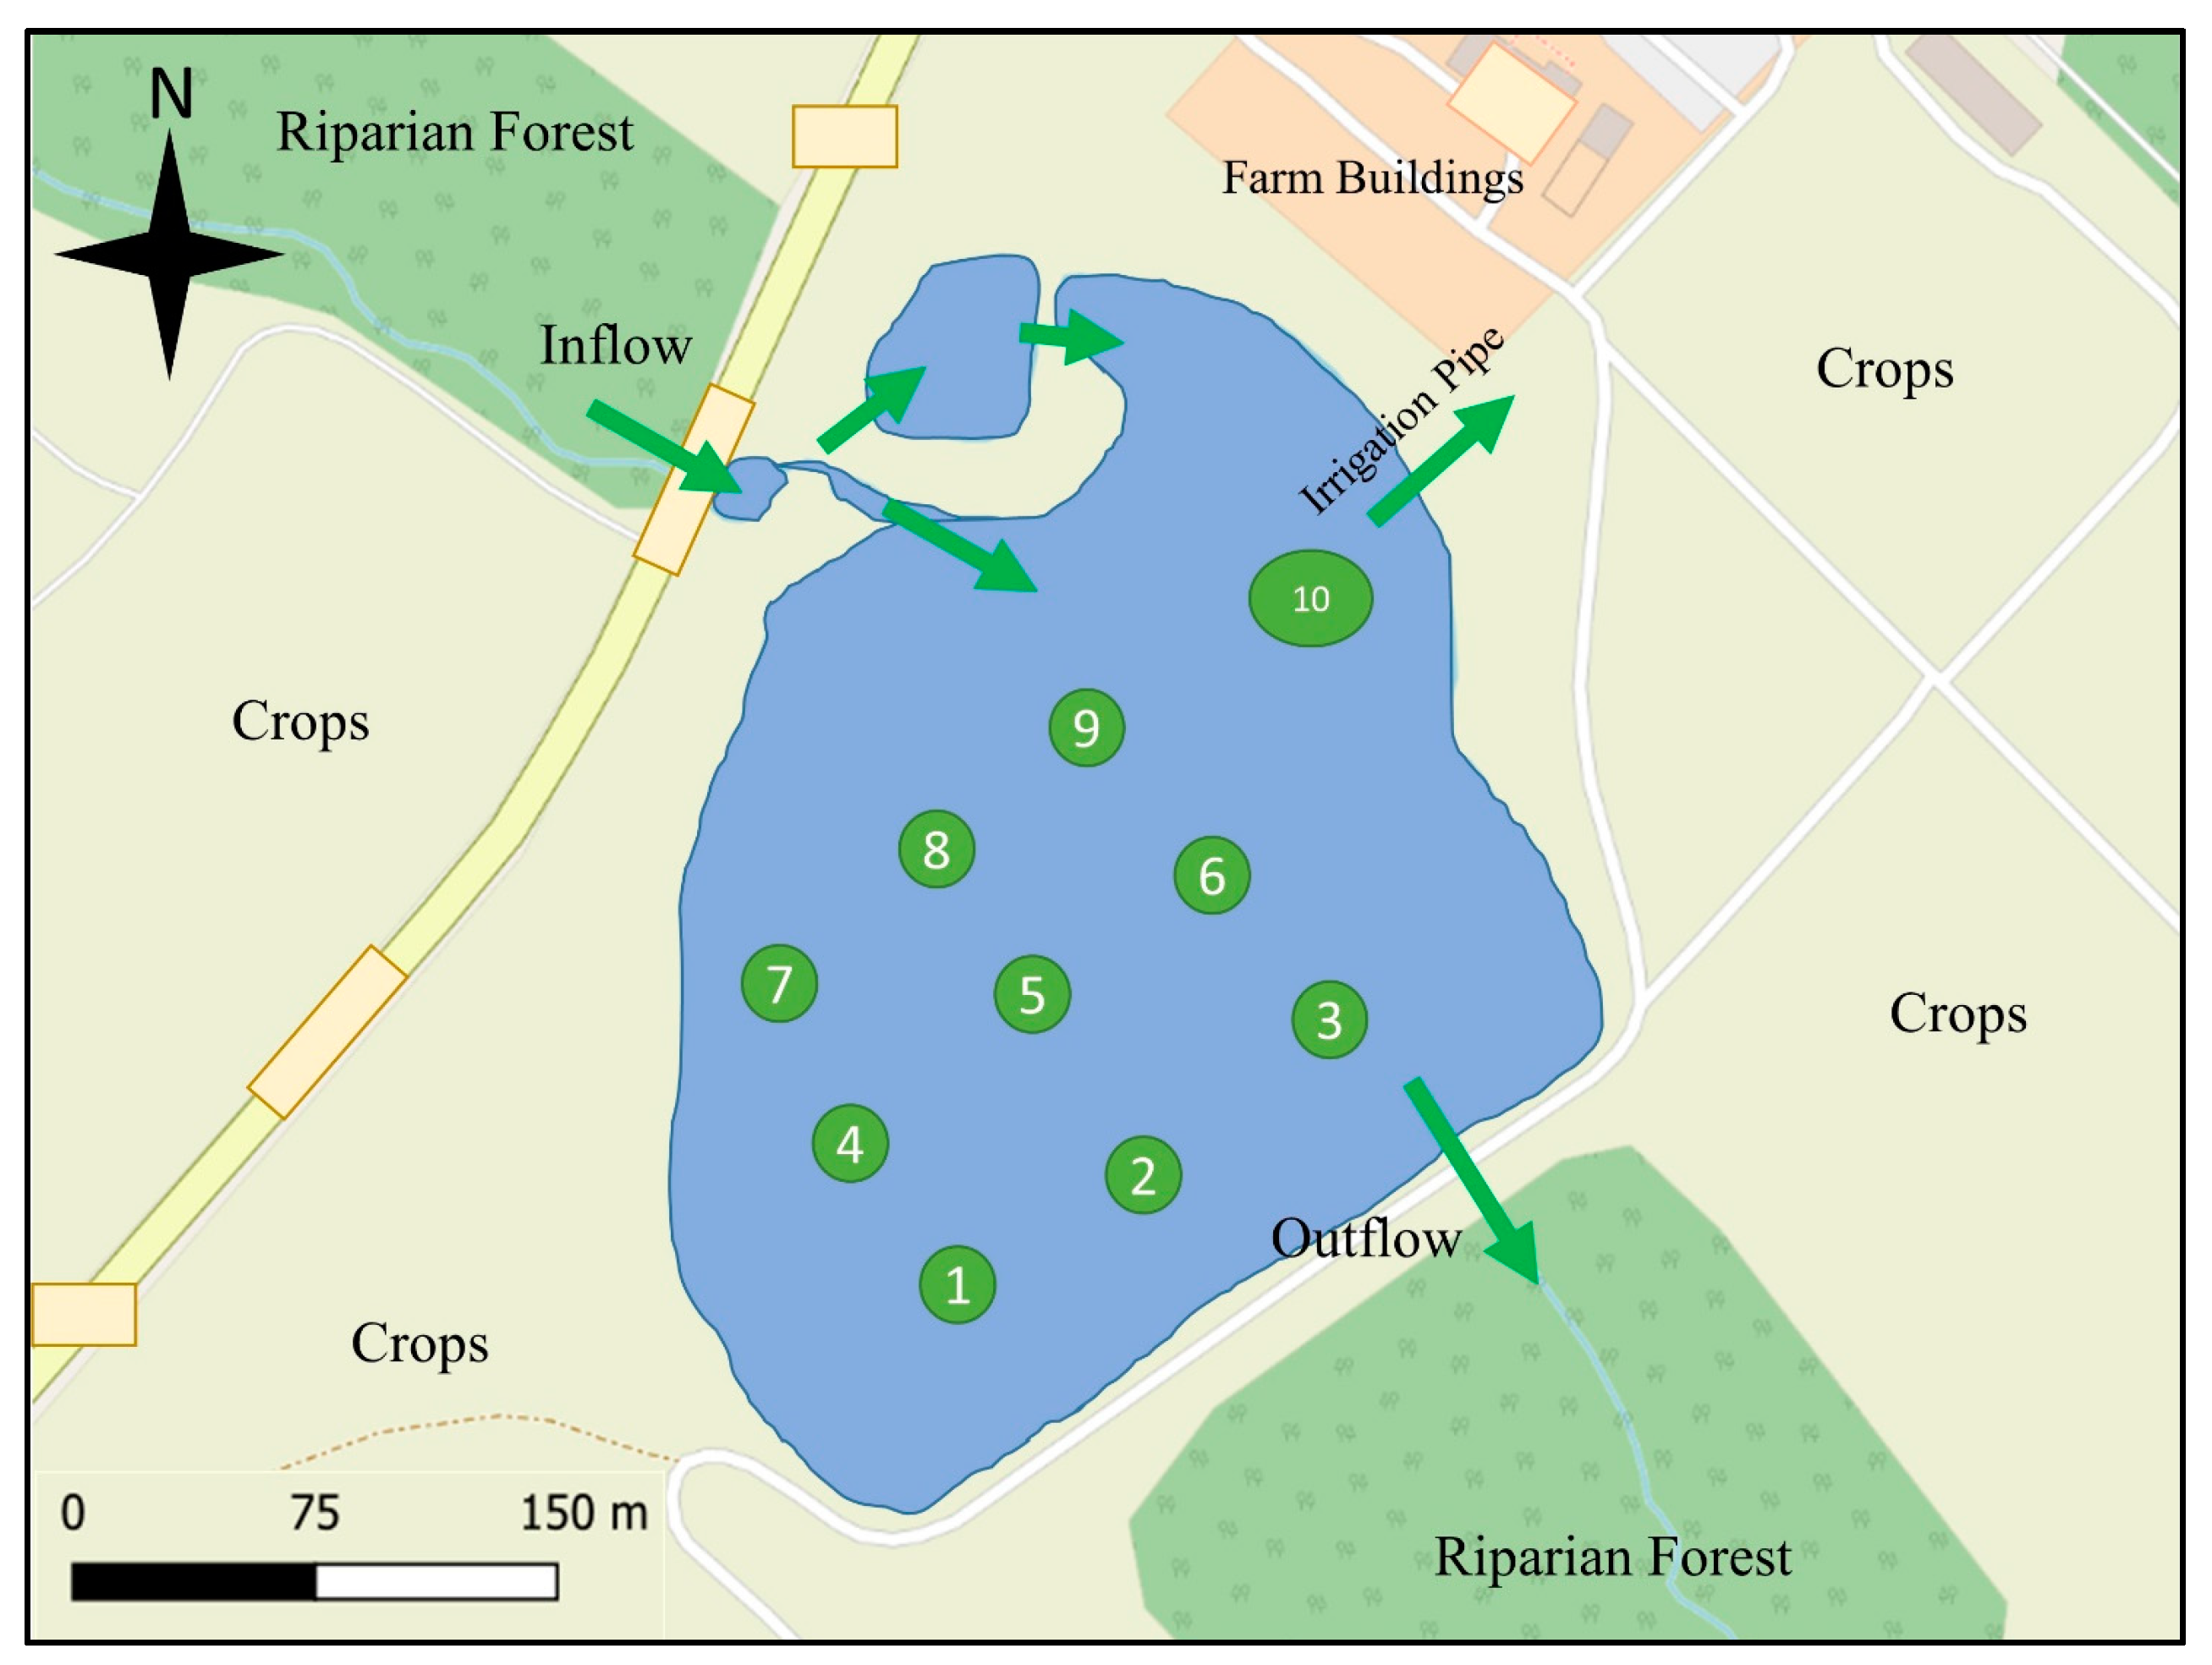
2. Materials and Methods

Water sampling was conducted from June to September of 2022 at a commercial farm with an actively used irrigation system in Maryland, USA (location withheld at the request of the owners). The irrigation pond measured in this study is approximately 40,000 m2. The property is zoned as cropland and has deciduous forested areas adjacent to the inflow and outflows. The areas to the North and Northeast are designated intensively managed row and garden cropland. The observed pond depths ranged from 0.40 m to 2.36 m with an average depth of 1.22 m. Sampling of the pond was conducted in a grid-like fashion with nine sampling locations each approximately 50 m apart and the 10th location placed at the irrigation intake (Figure 1). The pond is creek-fed from a riparian forest to the North, and water that enters the pond passes through two settling ponds before entering the larger pond. Areas in the Northern and Northwestern portions of the pond were not sampled due to the shallowness of the water.
Surface water samples (0–20 cm depth) were collected on 9 June 2022, 29 June 2022, 24 August 22, 1 September 22, 8 September 22, and 29 September 22 from 10 locations across the pond on each date. Subsurface samples were also collected at each location from a depth of 1 m. Depth samples were not collected if the water depth at a sampling location was less than 1 m. All samples were collected with a Hach Sigma 900 Max autosampler (Hach, Loveland, CO, USA) equipped with vinyl tubing which was lowered to the desired sampling depth. Upon arrival at a sampling site or when lowering the sampler to take the depth measurement, the tubing was flushed with water at that location for 10 s prior to sample collection. All samples were collected from a boat and were placed into a backpack cooler on the boat until they could be placed in a dark ice-filled cooler at the end of the sampling event.
A YSI EXO 2 (YSI, Yellow Springs, OH, USA) multiparameter sonde was used to measure in situ levels of water quality variables in the location where samples were collected. The EXO2 measured temperature (C) (°C), dissolved oxygen (DO) (mg L−1), pH (unitless), specific conductivity (SPC) (μS cm−1) turbidity (NTU) (NTU), phycocyanin (PC) (relative fluorescence unit (RFU)), and chlorophyll (CHL) (RFU). Photosynthetic active radiation (PAR) (W m−2) and total solar radiation (TSR) (W m−2) (Apogee Instruments Inc., Logan, UT, USA) were measured at the water surface and at the same depth as subsurface water samples. On the same day as sample collection, subsamples were partitioned in the laboratory for additional analyses. The levels of colored dissolved organic matter (CDOM) (μg L−1), in vivo chlorophyll (INV) (RFU), and phycocyanin (μg L−1) were measured with a fluorometer (AquaFlour, Turner Designs, CA, USA). Concentrations of nutrients including ammonia (NH3) (mg L−1), orthophosphate (PO4) (mg L−1), and nitrate (NO3) (mg L−1) were measured with a SEAL AQ300 (Seal Analytical Inc., Mequon, MA, USA) discrete nutrient analyzer. Concentrations of total carbon (TC) (mg L−1), inorganic carbon (TIC) (mg L−1), organic carbon (TOC) (mg L−1), and total nitrogen (TN) (mg L−1) and nitrate-nitrogen (NN) (mg L−1) were measured with a Formacs HT TOC/TN (Skalar Inc. Breda, Netherlands). All nutrient samples were filtered with a 0.45 um filter prior to analysis.
E. coli concentrations were enumerated using the Colilert Quanti-Tray 2000 system (IDEXX, Westbrook, MA, USA). Two levels of the antibiotic tetracycline (Zymo, Irvine, CA, USA) were added to samples prior to incubation as detailed in Galvin et al. [24]. A concentration of 4 ug/mL and of 16 ug/mL were added to subsamples and will be referred to as low and high tetracycline doses henceforth. The low and high concentrations were adopted from the Clinical Laboratory Standards Institutes (CLSI) breakpoint values for assessment of antibiotic resistant E. coli [25].

Data Analysis

Total coliform bacteria are also reportable from the Colilert system; however, due to an overwhelmingly large number of samples being above the higher detection limit they were excluded from the analysis but can be viewed in Supplementary Table S1. The percentages of low and high tetracycline-resistant E. coli were calculated by dividing the concentration in antibiotic-amended samples by the corresponding non-amended subsample and multiplying by 100. Percentages of tetracycline-resistant E. coli were assessed on the latter four sampling dates.
Correlations between E. coli concentrations, percentages of resistant E. coli, and water quality parameters were determined using the non-parametric Spearman rho (rs). A principal component analysis (PCA) was also used to explore the relationships between E. coli and water quality parameters and identify prevailing patterns in the dataset. For the PCA analysis, a correlation matrix was used to account for the differences in the scale of variables. Comparisons of cumulative probability distributions between surface and sub-surface samples were performed using the Kolmogorov–Smirnov (K–S) test. Kruskal–Wallis one way ANOVA on ranks was used to compare medians of resistant E. coli across dates, and the Mann–Whitney test was used for pairwise comparison of individual dates. All statistical testing and PCA analyses were performed using the PAST Software v4.12b (Paleontological Association, Oslo, Norway) [26]. Statistical significance in all tests was performed using the 0.05 level of probability. Graphs were generated using SigmaPlot v13 (Systat, San Jose, CA, USA), and the site map was created using QGIS v3.30.0.
Conditional decision trees (cTrees) were computed using water quality variables as inputs and the percentages of resistant E. coli as outputs. Traditional classification and regression trees (CART) operate using recursive binary partitioning to create splits in datasets which help to best distinguish between different values of the target variable (i.e., percentages of resistant E. coli) based on levels of the inputs (i.e., environmental variables). Instead of maximizing purity (or minimizing impurity) in split groups, cTrees use statistical permutation tests to determine whether a split based on a certain level of a parameter leads to a significant or insignificant improvement in model performance. Conditional trees have been shown to deal with multicollinearity and avoid bias and overfitting better than traditional regression trees [27]. cTrees were created using the R software (R Foundation for Statistical Computing, Vienna, Austria) [28] using the ‘partykit’ package [29]. All cTrees were run with default settings except that terminal nodes in the trees had to contain at least 10 observations.

3. Results

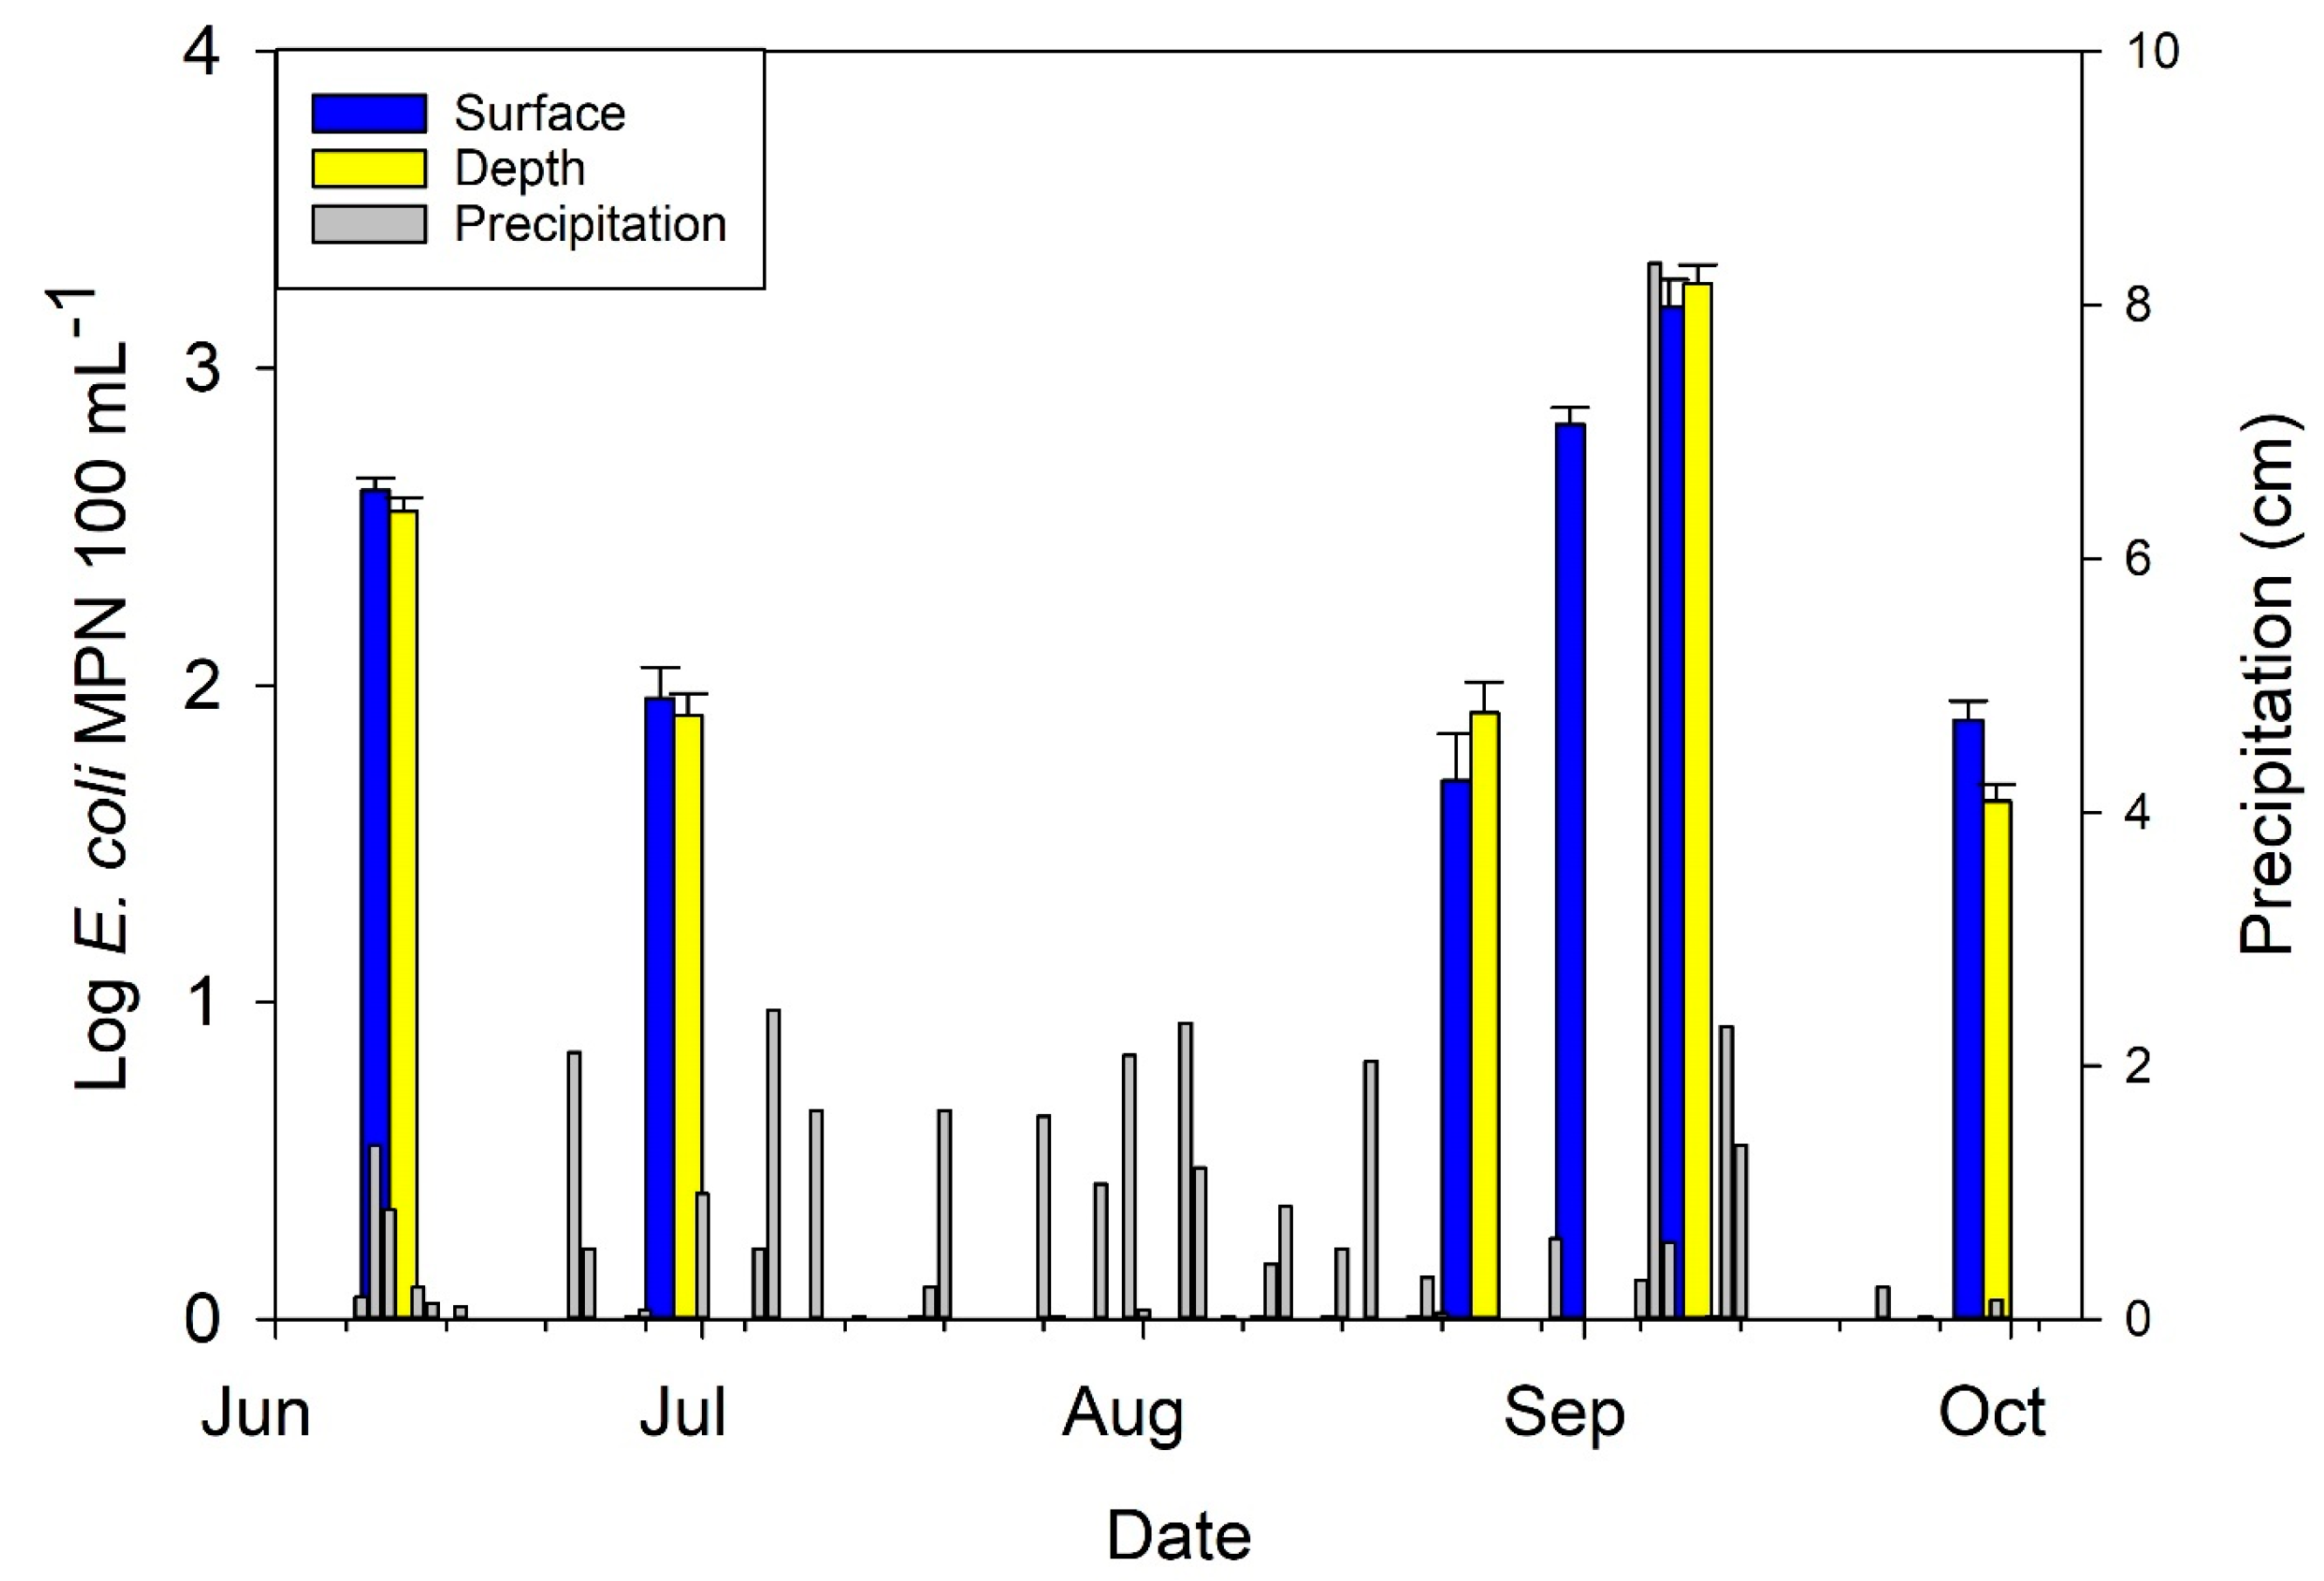
3.1. Variation of E. coli Concentrations across the Observation Period

Concentrations of E. coli measured in the pond along with precipitation amounts are shown in Figure 1. There was a negative correlation between the average E. coli concentration across the pond and the number of days between the last rainfall event and each sampling event (Spearman rs = −0.657, p = 0.175; rs = −0.600, p = 0.292 for surface and depth, respectively) and a positive correlation between concentrations and the sum of the precipitation amounts in the 72 h prior to sampling (Spearman rs = 0.885, p = 0.033; rs = 0.600, p = 0.350, respectively). In other words, concentrations of E. coli were higher on sampling dates closer to rainfall and when rainfall volumes were high and were low when the opposite was true.
Concentrations of E. coli were assessed at the surface and at 1 m depth on five of six dates (Figure 2; Supplementary Table S2). Concentration differences between surface and depth samples was the lowest on 9 June 2022 (12.4% difference) and highest on 24 August 2022 (48.5%) with an average of 10.8% across sampling dates. The K–S test showed that the distributions of surface and subsurface sample E. coli concentrations pooled across the study were not significantly different (p = 0.515). Linear regressions between surface and subsurface concentrations by date are shown in Supplementary Figure S1. Values of R2 between the two depths ranged from 0.088 (24 August 2022) to 0.953 (8 September 2022), and there was a positive correlation noted between samples taken from each sampling depth except on 24 August 2022 where a slightly negative correlation was observed (r = −0.079).
Coefficients of variation (CV) for concentrations of E. coli across sampling locations on each date ranged from 21.6% (9 June 2022) to 130% (24 August 2022) for surface samples and from 24.2% (9 June 2022) to 80.0% (1 September 2022) for depth samples. For surface samples across the observation period, the difference between the maximum and minimum concentrations measured at different sampling locations was typically within 100–200 MPN 100 mL−1. However, on 1 September 2022 and 8 September 2022 these differences were much larger at 855 and 3766 MPN 100 mL−1 respectively. These differences were between locations 1 and 10 and 2 and 10 for 1 September 2022 and 8 September 2022, respectively, with both cases involving lower concentrations at location 10. For depth samples, all dates but 8 September 2022 had maximum differences between sampling locations of 100–200 MPN 100 mL−1. On 8 September 2022 the maximum difference between locations for subsurface samples was 1201.5 MPN 100 mL−1, which was between locations 2 and 10, with the latter containing lower concentrations.

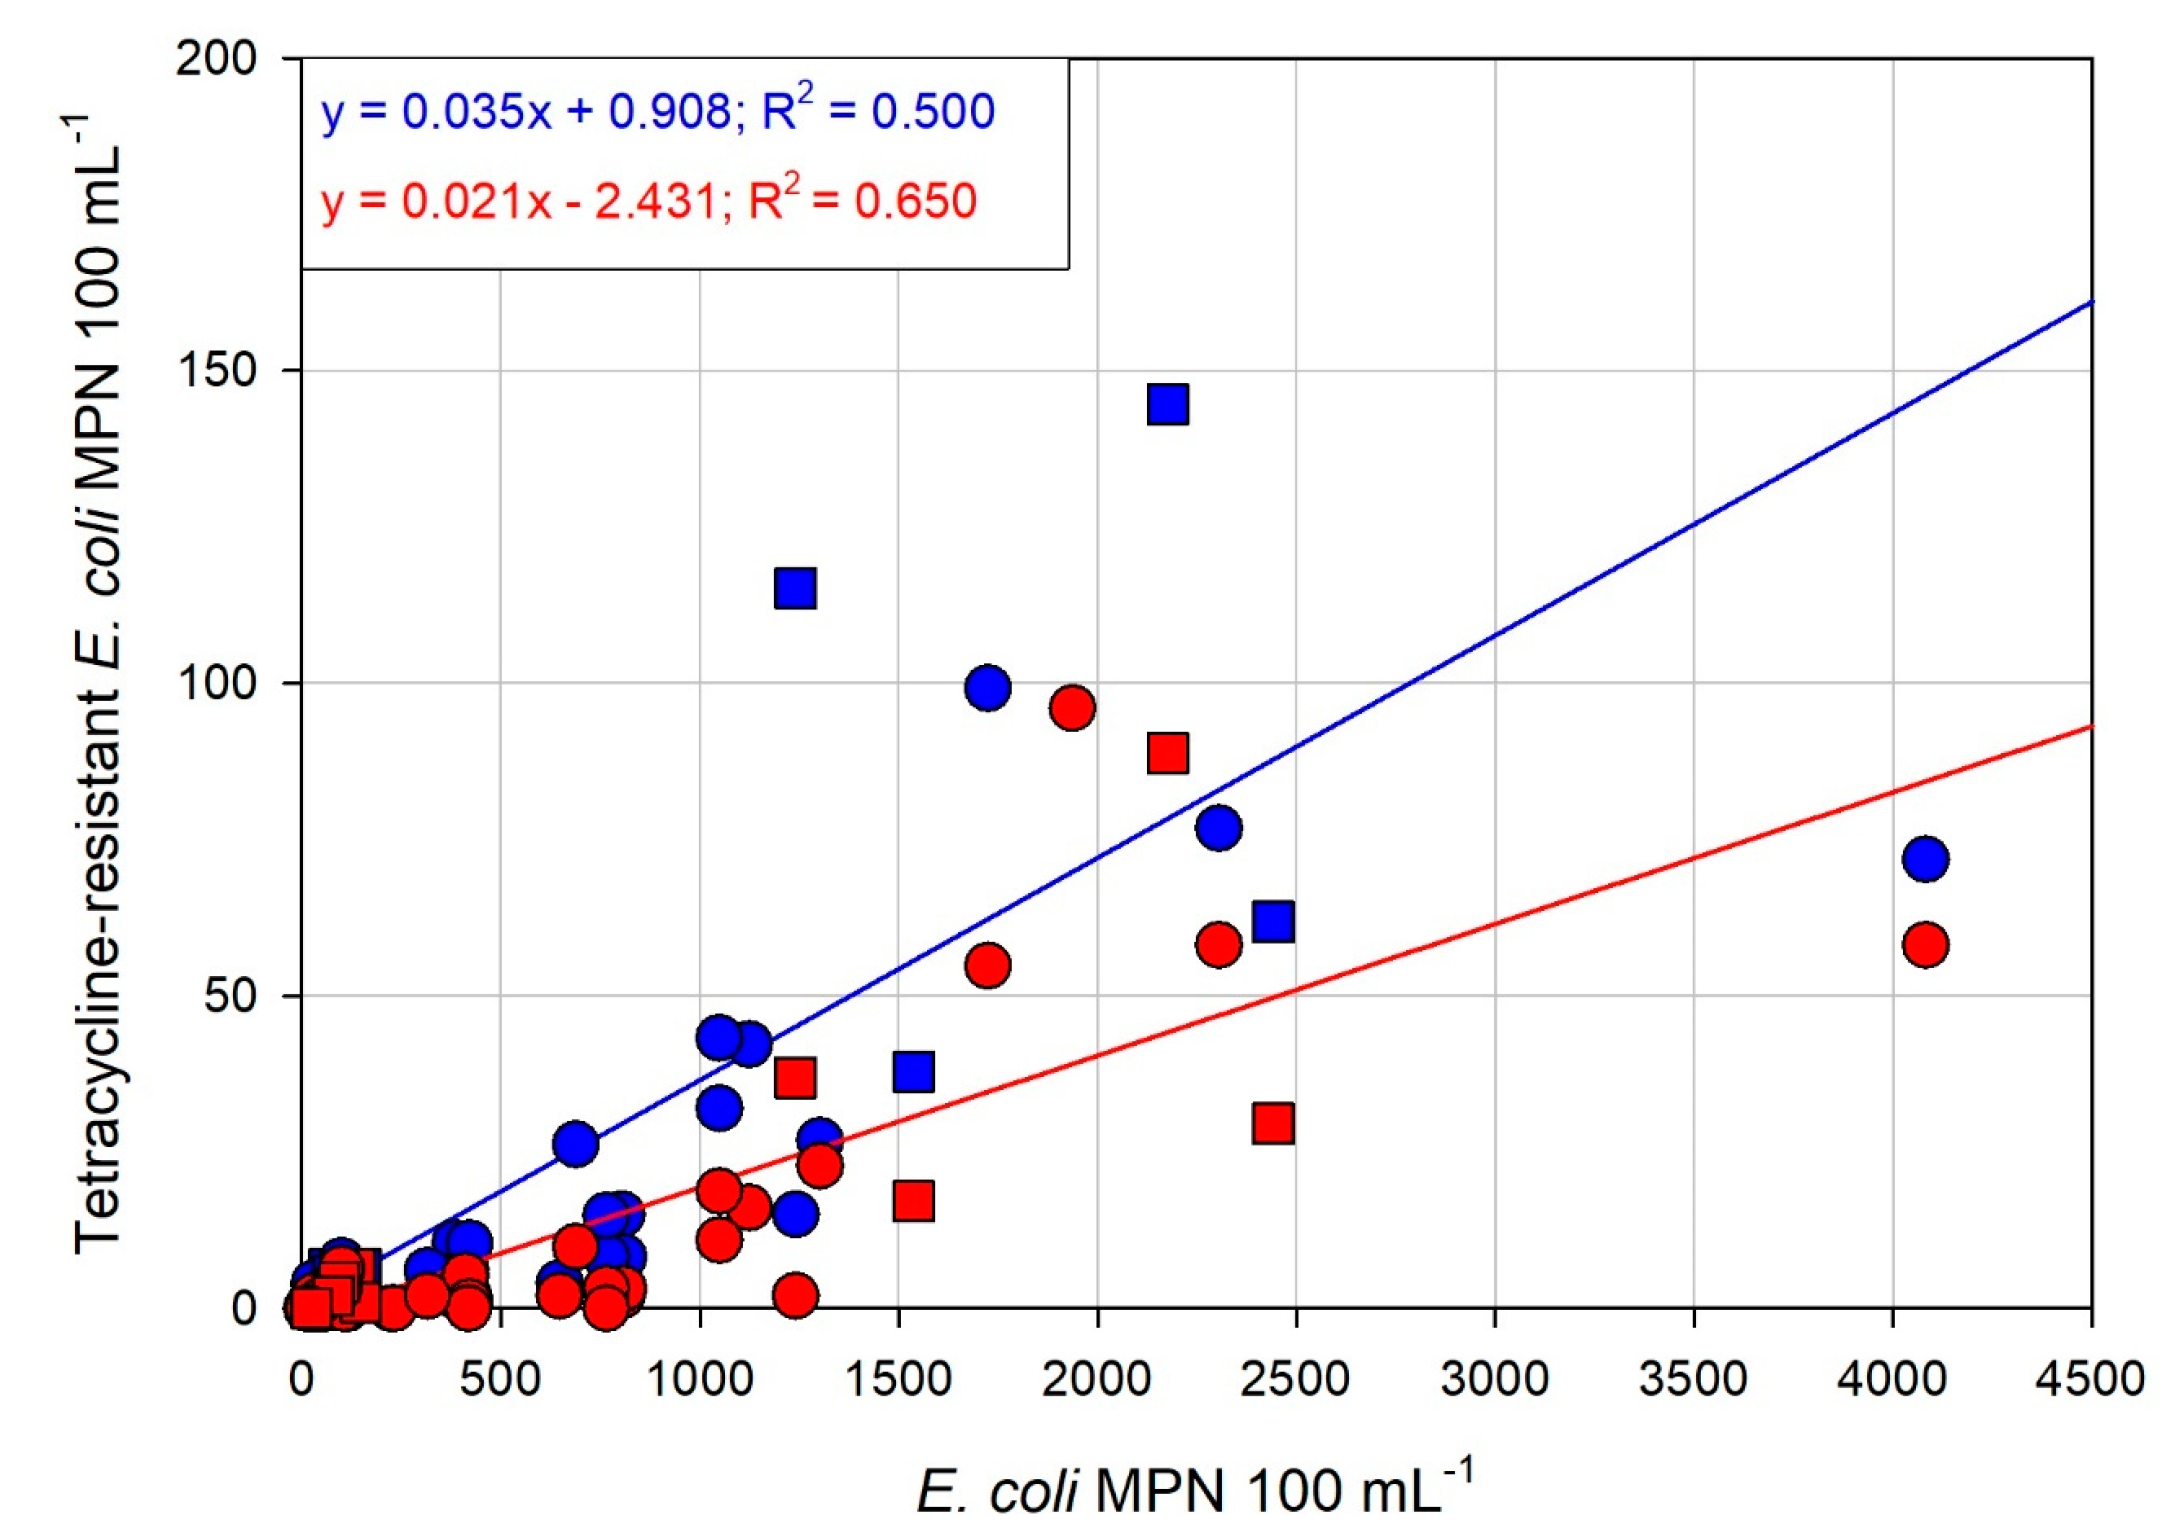
3.2. Dynamics of Tetracycline-Resistant E. coli

Concentrations of E. coli resistant to the low and high tetracycline doses showed moderate to strong correlation with E. coli concentrations in non-amended samples (rs = 0.710 and 0.810, respectively, both p < 0.05) (Figure 3). The correlation between E. coli concentrations at low and high doses in subsamples from the same original sample was very strong (rs = 0.957, p < 0.01). On average, the concentration of E. coli in non-amended samples was about 20 and 56 times greater than those measured in subsamples which received the low and high doses, respectively. The coefficients of variation for E. coli concentrations in the no-, low-, and high-doses of tetracycline were 148%, 160%, and 217%, respectively.
The slopes from the regression equations fit to the concentration data were found to be significantly different (F test, p = 0.007). However, in logarithmic coordinates and with the removal of zeros (i.e., only numbers from samples in which the low and high dose concentration was measurable) the slopes of the regression equations were nearly identical (p = 0.934) (Supplementary Figure S2). This indicated that subtraction of intercept values (i.e., y0(high dose)–y0(low dose)) would be a constant which was independent of the total E. coli population present. These values were 1.39 and 1.08, respectively, and the resulting value after subtraction was 0.31 or ≈ log10(2), meaning that the percentages of tetracycline resistant to total E. coli were on average two times different between the low and high doses.
Percentages of tetracycline-resistant E. coli to the low (PRELt) and high (PREHt) doses by date, location, and sampling depth are shown in Table 1. On 24 August 2022 only three of 19 samples were resistant to the high tetracycline dose (PREHt = 16 μg mL−1), and these samples were all collected from subsurface locations (Table 1). Locations 1-2, 2-2, and 5-2 showed PREHt of 0.9, 4.8, and 4.1%, respectively. On 1 September 2022 both high (ERPHt) and low (PRELt = 4 μg mL−1) dosages were applied to subsamples. The PRELt in surface samples ranged from 0.5% to 2.7% (CV = 50.2%), while the PREHt ranged from 0% to 1.3% (CV = 102.5%). On this date locations 9-1 and 10-1 were susceptible to the high dose while all other locations had measurable resistance. On 8 September 2022 no locations, surface or subsurface, showed complete susceptibility to tetracycline at either dose. The PRELt and PREHt in samples taken at the surface ranged from 1.75% to 10.5% (CV = 64.7%) and 0.63 to 5.0% (CV = 62.5%), respectively. For the subsurface samples these ranges were 2.45% to 9.29% (CV = 63.8%) and 1.11 to 4.08% (CV = 61.4%), respectively. The PRELt showed a weak negative correlation between surface and subsurface samples (rs = −0.105, p = 1) on 1 September 22, whereas the PREHt showed a strong positive relationship between sampling depths (rs = 0.948, p = 0.166). On 29 September 22 the PRELt and PREHt in the surface water ranged from 0 to 12.7% (CV = 86.5%) and from 0 to 6.3% (CV = 69.7%), respectively. These ranges for subsurface samples were from 0 to 8.9% (CV = 113.0%) and from 0 to 4.4% (CV = 85.5%) for the low and high doses, respectively. There was a positive correlation between water samples collected between depths for both the PRELt (rs = 0.670, p = 0.076) and PREHt (rs = 0.368, p = 0.362). Combining data from 8 September 22 and 29 September 22 provided similar positive strengths between surface and subsurface samples for the PRELt (rs = 0.578, p = 0.048, n = 12) and PREHt (rs = 0.562, p = 0.056, n = 12).
Kruskal–Wallace one-way ANOVA of ranks with sampling date as a factor showed that there was a significant difference in median PRELt in surface samples (p = 0.018). Mann–Whitney pairwise testing revealed significant differences between 1 September 2022 and 8 September 2022 (p = 0.002), but neither date contained significantly different percentages from those observed on 29 September 22 (p > 0.05). A significant difference was also found for PREHt (p < 0.013) with pairwise testing, showing significantly different median percentages between 1 September 2022 and 8 September 2022 (p < 0.001). For both the PRELt and PREHt in surface samples the median value increased from 1 September 2022 to 8 September 2022 to 29 September 2022. Statistical comparison of median PRELt and PREHt in subsurface samples could only be conducted on the last two dates. Mann–Whitney pairwise testing showed that depth was not a significant factor for the PRELt (p = 0.461) or PREHt (p = 0.367).
Cumulative probability distributions of PRELt and PREHt are shown in Supplementary Figure S3. Approximately 10% of the entire sample set showed full susceptibility to the low tetracycline dose while 40% were susceptible to the high dose. The K–S test for equality of cumulative distributions showed that the percentages of resistant E. coli were significantly different between tetracycline doses (p = 0.001). Distributions of antibiotic resistance for both the low and high doses did not significantly differ between sampling depths on any individual date (K-S test, p > 0.05) or when the four sampling dates were analyzed pooled together (p = 0.730 and p = 0.701 for low and high dose, respectively).
The plot of E. coli concentration versus PRELt and PREHt showed that the slopes of the regression lines for both doses were not significantly different from zero (F-test, p = 0.390) (Supplementary Figure S4). In this case, the data in the graph show that on average the resistance percentage does not significantly depend on the total concentration of E. coli present in the pond water. That is, this dataset shows that higher concentrations of E. coli present do not necessarily indicate that the percentage resistant to tetracycline will be higher and vice versa.

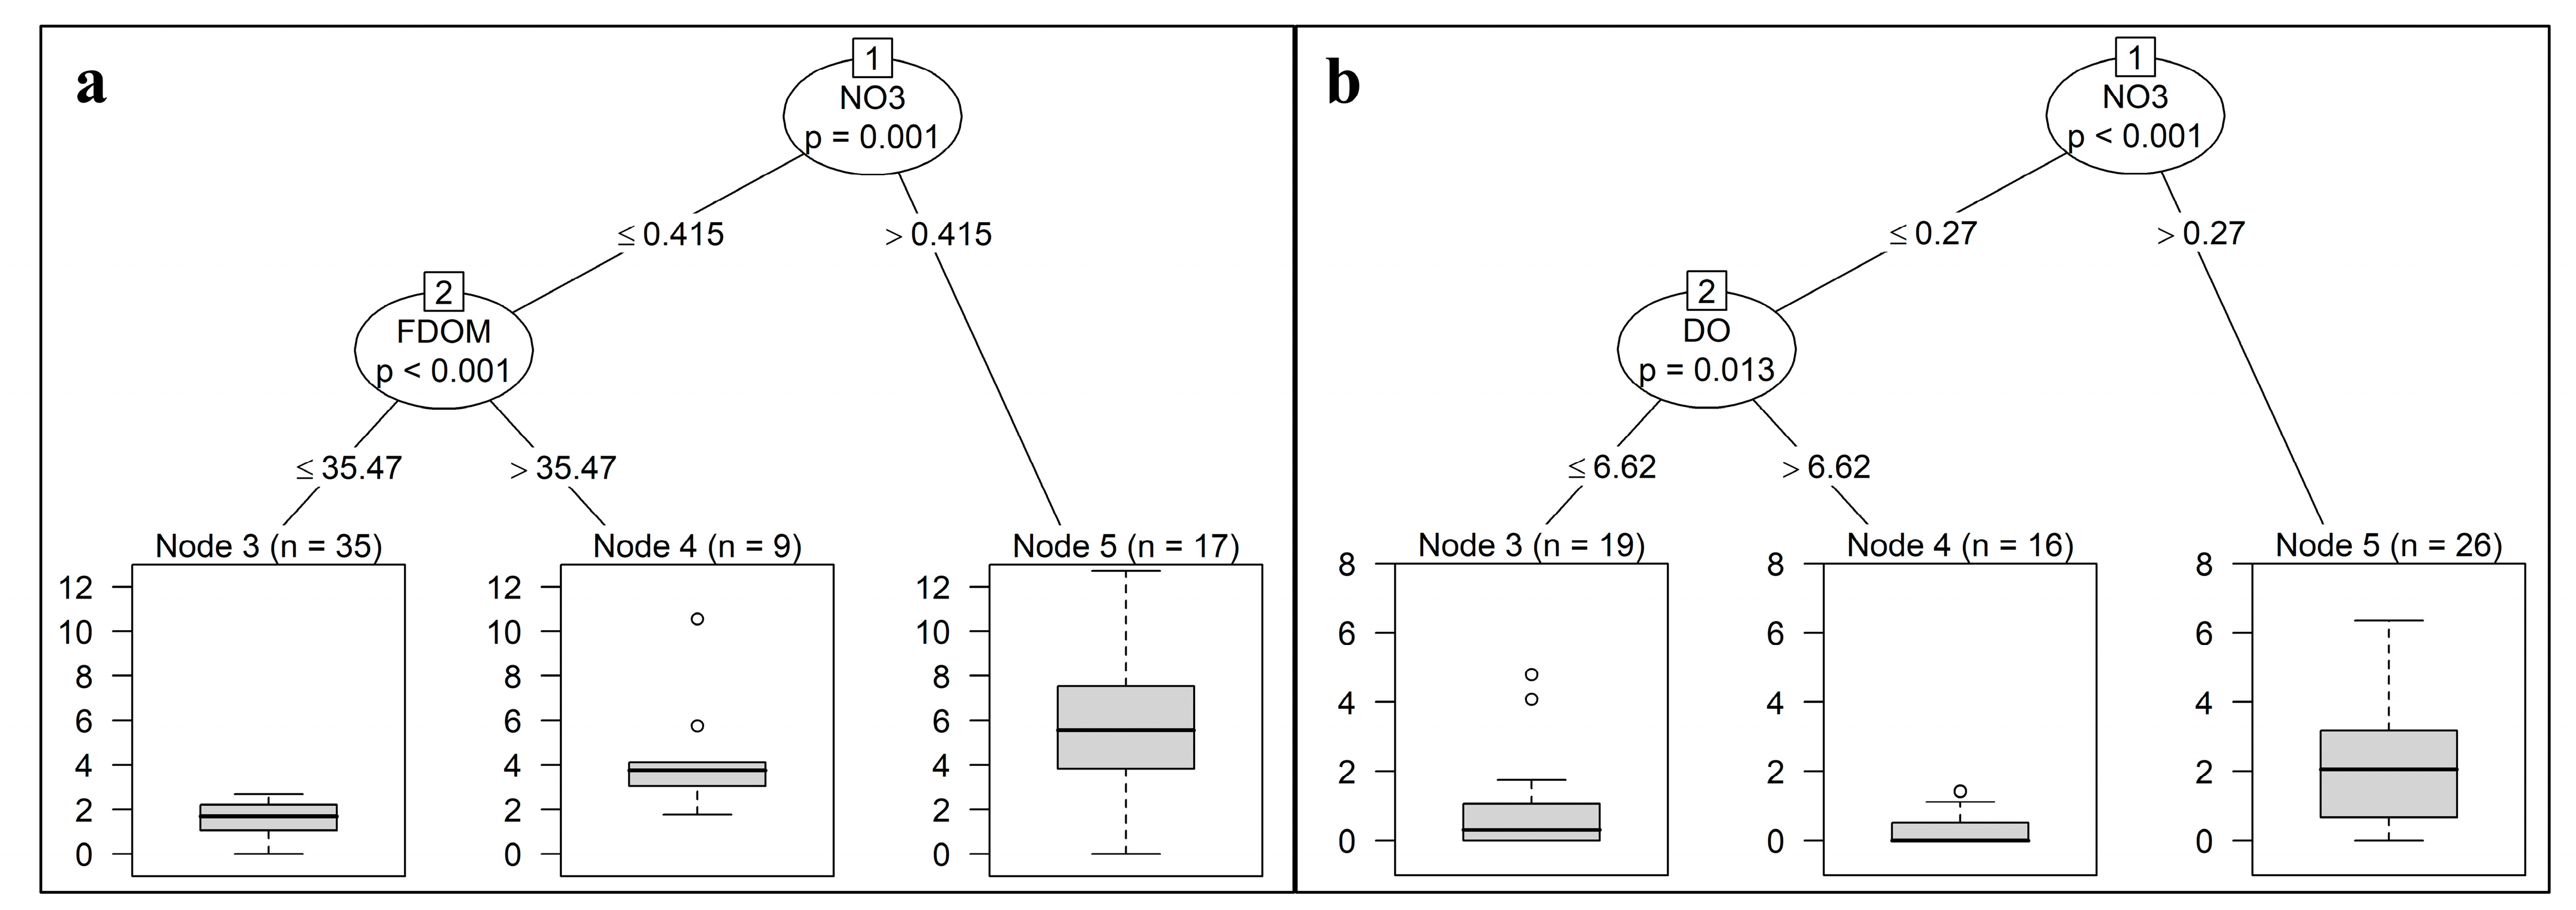
3.3. Relationships between Water Quality Variables and Percentage of Tetracycline-Resistant E. coli

Correlations between PRELt and PREHt and water quality variables were computed (Supplementary Table S3). The strength and signs of correlations were very similar between the low and high doses (rs = 0.763, p < 0.001). For the PRELt, FDOM (rs = 0.544), PHYC (rs = −0.368), NO3 (rs = 0.459), and NN (rs = 0.326) were all significantly correlated (p < 0.05). For the PREHt, °C (rs = −0.497), CHL (rs = 0.596), FDOM (rs = 0.476), INV (rs = 0.576), CDOM (rs = −0.547), NO3 (rs = 0.462), and NN (rs = 0.417) were significantly correlated.
A principal component analysis was performed using both concentrations of resistant E. coli and ratios of resistance. The first three principal components (PCs) accounted for 71% of the variability in the dataset (36.2, 22.6, and 12.5% for PC1, PC2, and PC3, respectively). Similar measurements showed similar directionality on the biplot and loadings plot (Supplementary Figures S4 and S5). For example, phytoplankton-related measurements (PHY, BGA, CHL, INV), fluorescent dissolved organics (CDOM and FDOM), forms of carbon (TC, TOC, TIC), radiation measurements (PAR, TSR), and nitrates (NO3 and NN) all showed tight biplot grouping. E. coli resistance ratios showed the most similar direction with nitrate measurements, while concentrations of resistant E. coli were aligned with phytoplankton, fluorescent dissolved organics, and turbidity.
The cTree analysis showed that for the PRELt the concentration of nitrate (NO3) present determined the leading split of the dataset with a threshold value of 0.415 mg L−1 (Figure 4). When nitrate values were higher than 0.415 mg L−1 the average percentage of E. coli surviving the low dose was 5.52% of the total population. When concentrations of nitrate were lower than this value the concentration of fluorescent dissolved organic matter (FDOM) was found to be the next best splitter of the dataset, with a value of 35.47 μg L−1. Below this threshold the average PRELt was 1.57%, and above the threshold the percentage was 4.24%. The cTree for the PREHt also had the level of NO3 create the first split of the dataset, with a value of 0.270 mg L−1. When nitrate levels were higher than this the average PREHt was 2.17%. If NO3 was below 0.27 mg L−1 the concentration of DO created the next best split, with a threshold of 6.17 mg L−1. If DO was less than this the average PREHt was 0.86%, and if DO was higher the average value was 0.31%.

4. Discussion

The average concentrations of E. coli in the pond water showed correlations with days since rainfall and with rainfall amounts in the previous 72 h. The effect of precipitation on concentrations of fecal indicator bacteria in agricultural ponds has been documented by several researchers, and the positive correlation is most often attributed to runoff containing high concentrations of indicators entering the pond waters [30,31,32,33] and sediment resuspension [34,35,36]. However, poor correlations between indicator or pathogen concentrations and rainfall have also been reported, which may be attributed to dilution effects especially in the absence of fecal matter present [36,37,38,39,40]. The authors of the present study agree with the conclusions of Draper et al. [41] in regard to precipitation effects in that any single factor may not explain the underlying cause of changes in concentrations (e.g., precipitation volume, intensity, frequency, fecal microorganisms present or available for release/transport etc.).
Concentrations of E. coli measured at the 0 and 1 m depths were on average similar, and positive correlations between sampling depths were observed on all dates except 24 August 2022 (Figure 1; Supplementary Table S2). The effect of the sampling depth has not been extensively explored in studies focusing on the microbial quality of irrigation ponds. In studies where sampling has been performed at multiple depths there have been inconsistent results; on some sampling dates concentrations of fecal microorganisms are higher at the surface, and on others the concentrations are higher at depth [39,42,43]. For example, a recent study of a large irrigation pond in Turkey showed that in six of 11 sampling dates from June to November 2018 concentrations of E. coli were higher at the surface than in samples collected 30 cm above the pond bottom [33]. Interestingly, in the same study when differences in water quality parameters by depth (e.g., temperature, pH, and DO) were reduced in the colder months, the concentrations of E. coli in the surface and subsurface were on average about the same. This finding agrees with the results of Brissaud et al. [44] and He et al. [45], both of whom found stratification in pond water quality parameters, particularly temperature, to be a major driver of creating differences in fecal microbe concentrations between water sampling depths. The average depth of the pond in the present study was only 1.22 m, which may explain the lack of differences between concentrations measured at each depth. Additionally, examination of the water quality parameter data shows that on most dates differences in measurements were not large, with the exception of light-related parameters (PAR & TSR) (Supplementary Table S2). This is similar to a recent study performed on three irrigation ponds in Maryland which showed significant differences in E. coli concentrations at different depths when water quality parameters differed appreciably between those depths [43]. In that study the shallowest pond (1.5 m depth) did not show large differences in water quality parameters between sampling depths, and E. coli concentrations were never found to significantly differ by depth, potentially due to well mixed conditions.
Concentrations of tetracycline-resistant E. coli did not significantly differ between sampling depths on any individual date or when the results of all dates were pooled together. However, on 24 August 2022 resistant E. coli were detected only in samples collected at 1 m depth while all 10 surface samples showed no resistance to the 16 μg mL−1 dose of tetracycline. The importance of this finding is that if only surface samples were collected one may conclude that the E. coli populations in this waterbody are not resistant to a single or multiple antibiotics depending on the antibiotic(s) tested. In many studies samples are collected close to the water surface (~0–20 cm) and close to the irrigation intake. The present study highlights the need to expand the spatial component of sampling or incorporating composite sampling if resources do not allow for processing many samples. More work is needed to compare the results of composite samples to those obtained from averaging the result of multiple samples.
Correlations between water quality parameters and percentages of resistant E. coli revealed several significant relationships for both tetracycline levels, which interestingly differed in strength and in some cases in sign (Supplementary Table S3). Of common importance across the correlation and cTREE analysis were the concentrations of NO3 and FDOM (Figure 4). Dissolved organic and inorganic nutrients have commonly shown positive associations with fecal bacteria concentrations in ponds [43,46,47,48] and lakes [49,50,51]. Two possible reasons for this include the simple availability of nutrients used for growth and persistence [52,53,54] and the cooccurrence of nutrients with precipitation events which can transport nutrients to waterways along with fecal bacteria [51,55,56]. Additionally, the role of dissolved organic matter has been acknowledged as an important factor governing the fate and transport of antibiotics in the environment by way of electrochemical interactions [22].
Dissolved oxygen was found to be important in the PREHt cTREE, with higher DO associated with lower resistance ratios. In a review of mechanisms controlling the survival of fecal microorganisms in ponds, Dias et al. [57] detail that survival is poorer with higher DO, especially in the presence of sunlight. Solar radiation can act upon dissolved oxygen and create radical species which can cause photooxidative damage to planktonic cells. Significant positive correlations between tetracycline-resistant E. coli and phytoplankton pigments, especially chlorophyll, may indicate that resistance may be related to the abundance of phytoplankton. More work is needed to elucidate relationships in antibiotic resistance between fecal microbes and phytoplankton existing in the same waterbodies, as the transfer of genes between groups appears possible [58,59,60].
Of important note is that not only were the strengths of the relationships between E. coli and water quality parameters different when using resistance percentages versus concentration data, but with some parameters so too were the signs of the relationships (Supplementary Table S3). This highlights the need to take caution when comparing relationships between studies as well as to have researchers present the results both ways or provide the data to allow readers to do so. We could find only one publication that reported correlation results using both antibiotic resistance ratio as well as concentration data. In the report by Duff et al. [12] E. coli and tetracycline-resistant E. coli concentrations in coastal streams were studied and related to water quality measurements. Their work showed positive and negative relationships between E. coli concentrations and orthophosphate and ammonium, respectively, but different signs of relationships were observed when the percentage of resistant E. coli was used in the analysis. More work is needed to evaluate if the levels of certain water quality variables, or combinations of them, can be used as predictors of either the absolute concentrations of ARB or percentages of resistant bacteria.
Many studies involving ARB in surface waters include the measurement of water quality parameters, but this appears to be rarely compared to the resistance percentage or resistant concentrations such that predictive relationships can be developed or compared. In numerous cases isolates are drawn from samples collected across a waterbody, but in later steps of the analysis the spatial information is not used or not reported (e.g., Yoneda et al., [9]). This highlights a glaring lack of information on the interaction between ARB and water quality parameters as well as providing grounds for future research into the topic. Correlations or multivariate analysis with water quality parameters seem to be more commonly reported in studies focusing on ARGs, which appear to show consistency in a positive relationship with nutrient concentrations [61,62,63], although the available literature revolves heavily around waste waters or waters which receive or are affected by these effluents. More work is needed to study ARB/ARGs and their associations with water quality variables in irrigation sources disconnected from direct anthropogenic effects as well as continued efforts exploring ARB/ARG dynamics in reclaimed waters used for irrigation [22].
The prevalence of resistant E. coli may be expected to increase after recent or heavy rainfalls [1,60]. The 29 September 2022 sampling date contained the largest proportions of tetracycline-resistant E. coli in the surface samples, and this date had the greatest separation from rainfall (17 days), which may indicate that another process such as horizontal gene transfer may be responsible for higher resistance percentages [60]. Future research would benefit from incorporating sampling conducted in both wet and dry conditions as well as expanding the selection of study sites, incorporating the study of additional antibiotics, and assessing resistance to clinically relevant antibiotics such as cefotaxime or vancomycin. It would also be worthwhile to examine differences in antibiotic resistance levels between E. coli and a larger group of aquatic bacteria such as total heterotrophs to better assess the representability of E. coli as an indicator of the overall resistance present. At least one such study has found disagreement between E. coli resistance and that of total coliforms and total cultivable cells in surface waters [64]. Aquatic sediments appear to be an understudied reservoir of ARB/ARG in the environment, and future work is needed to determine to what extent they may propagate or influence ARB/ARG in the overlying water column [65].
There are a wide range of antibiotic doses used in surface water studies that assess antibiotic resistance. While it appears that most are chosen based on well-established breakpoint values such as those presented by the Clinical and Laboratory Standards Institute or The European Committee on Antimicrobial Susceptibility Testing (EUCAST) [66], many studies worldwide use different standards or do not report why a certain level was chosen. The results of this pilot study show that (1) the relationships between water quality parameters and antibiotic-resistant E. coli may differ depending on the dose used and (2) the 3-dimensional spatial structure of antibiotic-resistant E. coli may differ depending on dose. Both points highlight the need for a standardized framework for analyzing antibiotic resistance in surface waters [4]. Another point to consider is that high doses may affect our ability to determine relationships between water quality and antibiotic resistance. Care should be taken when determining relationships or comparing the results between studies. Perhaps a higher dose would be suitable for wastewater-affected surface waters but may be too high for anthropogenically less affected surface waters. This indicates that a one-size-fits-all criterion may negatively affect our ability to surveil antibiotic resistance in aquatic environments.

5. Conclusions

E. coli concentrations were correlated with precipitation occurrence and volume. Concentrations of generic E. coli were similar between the 0 and 1 m depths, and concentrations between the two depths were positively correlated on most dates. The percentages of tetracycline-resistant E. coli did not significantly differ between sampling depths; however, subsurface sampling revealed resistant E. coli that surface sampling alone would have otherwise missed. Spatial variability in tetracycline-resistant E. coli was also noted for locations across the pond on each sampling date. On average, the low dose of tetracycline resulted in two times more E. coli in the same sample than the high dose when the concentration difference between low and high was fourfold. Water quality parameters were significantly correlated with both concentrations of antibiotic resistant E. coli and ratios of resistance in the low and high dosages. Nitrate and fluorescent dissolved organic matter were identified as important parameters in both correlations and conditional regression trees, with both showing positive associations with tetracycline resistance. Overall, this work provides insight into the spatiotemporal variability of antibiotic-resistant E. coli in irrigation waters which may be used to improve the design of monitoring centered around addressing the major global issue of antibiotic resistance associated with the food supply.

Supplementary Materials

The following supporting information can be downloaded at: https://www.mdpi.com/article/10.3390/applmicrobiol3020036/s1, Supplementary Figure S1: Results of the linear regression analysis between concentrations of E. coli measured in surface and subsurface samples by date. The black line and bold R2 value show the result from pooling all dates together; Supplementary Figure S2: Linear regressions between the logarithms of total E. coli population and the low (blue) and high (red) tetracycline-resistant E. coli populations. Circles and squares indicate samples taken at the water surface and sub-surface, respectively; Supplementary Figure S3: Cumulative probability distributions of tetracycline-resistant E. coli. Blue and red colors indicate E. coli resistant to the low and high doses, respectively.; Supplementary Figure S4: Linear regressions of the concentration of E. coli in water samples plotted against the ratio of tetracycline-resistant E. coli at the low (blue) and high (red) doses. Circles and squares indicate samples taken at the water surface and subsurface, respectively; Supplementary Figure S5: Scattergram created from performing a principal component analysis on the tetracycline-resistant E. coli dataset. mpn = concentration of E. coli in unamended samples (MPN 100 mL−1), mpnL = concentrations of E. coli in low dose tetracycline amended samples (MPN 100 mL−1), mpnH = concentrations of E. coli in high dose tetracycline amended samples (MPN 100 mL−1), %L = percentage of low dose tetracycline concentration to total E. coli population (%), %H = percentage of high dose tetracycline concentration to total E. coli population (%), C = water temperature (°C), DO = dissolved oxygen (mg L−1), SPC = specific conductivity (μS cm−1), NTU = turbidity (NTU), BGA = phycocyanin (RFU), CHL = chlorophyll-a (RFU), FDOM = fluorescent dissolved organic matter (μg L−1), PHYC = phycocyanin laboratory (μg L−1), INV = laboratory chlorophyll (RFU), CDOM = colored dissolved organic matter (μg L−1), NH3 = ammonia (mg L−1), NO3 = nitrate (mg L−1), PO4 = orthophosphate (mg L−1), TC = total carbon (mg L−1), TIC = inorganic carbon (mg L−1), TN = total nitrogen (mg L−1), NN = nitrate nitrogen (mg L−1), TOC = organic carbon (mg L−1), PAR = photosynthetic active radiation (W m−2), TSR = total solar radiation (W m−2); Supplementary Figure S6: Loadings plot of PC1 from the principal component analysis. mpn = concentration of E. coli in unamended samples (MPN 100 mL−1), mpnL = concentrations of E. coli in low dose tetracycline amended samples (MPN 100 mL−1), mpnH = concentrations of E. coli in high dose tetracycline amended samples (MPN 100 mL−1), %L = percentage of low dose tetracycline concentration to total E. coli population (%), %H = percentage of high dose tetracycline concentration to total E. coli population (%), C = water temperature (°C), DO = dissolved oxygen (mg L−1), SPC = specific conductivity (μS cm−1), NTU = turbidity (NTU), BGA = phycocyanin (RFU), CHL = chlorophyll-a (RFU), FDOM = fluorescent dissolved organic matter (μg L−1), PHYC = phycocyanin laboratory (μg L−1), INV = laboratory chlorophyll (RFU), CDOM = colored dissolved organic matter (μg L−1), NH3 = ammonia (mg L−1), NO3 = nitrate (mg L−1), PO4 = orthophosphate (mg L−1), TC = total carbon (mg L−1), TIC = inorganic carbon (mg L−1), TN = total nitrogen (mg L−1), NN = nitrate nitrogen (mg L−1), TOC = organic carbon (mg L−1), PAR = photosynthetic active radiation (W m−2), TSR = total solar radiation (W m−2); Supplementary Table S1: Concentrations of total coliform bacteria (MPN 100 mL−1) in unamended, low-tetracycline (4 μg mL−1), and high-tetracycline (16 μg mL−1) amended samples; Supplementary Table S2: Averages and standard errors of E. coli concentrations, percentages of tetracycline resistant E. coli, and water quality variables measured across the entire study; Supplementary Table S3: Spearman correlation coefficients (rs) between E. coli concentrations or ratios and measured water quality variables Cell colors depict the direction of the relationship with green and red cells indicating positive and negative values, respectively. Weak correlations are shown in yellow. The strength of the relationship determines the intensity of the coloring.

Author Contributions

Conceptualization, M.S. and Y.P.; methodology, M.S. and J.S.; formal analysis, M.S.; resources, Y.P.; writing—original draft preparation, M.S., J.S. and Y.P.; funding acquisition, Y.P. All authors have read and agreed to the published version of the manuscript.

Funding

This research was funded through the USDA’s Agricultural Research Service project number 8042-12630-011-00D.

Data Availability Statement

Data may be readily available by request to the corresponding author.

Acknowledgments

We would like to acknowledge the support of Billie Morgan for procuring supplies and Billie and Lauren Wyatt-Brown for assistance with the field and laboratory work.

Conflicts of Interest

The authors declare no conflict of interest.

References

  1. Larsson, D.J.; Flach, C.F. Antibiotic resistance in the environment. Nat. Rev. Microbiol. 2022, 20, 257–269. [Google Scholar] [CrossRef] [PubMed]
  2. Gekenidis, M.T.; Qi, W.; Hummerjohann, J.; Zbinden, R.; Walsh, F.; Drissner, D. Antibiotic-resistant indicator bacteria in irrigation water: High prevalence of extended-spectrum beta-lactamase (ESBL)-producing Escherichia coli. PLoS ONE 2018, 13, e0207857. [Google Scholar] [CrossRef]
  3. World Health Organization. WHO Integrated Global Surveillance on ESBL-Producing E. coli Using a “One Health” Approach: Implementation and Opportunities. 2021. Available online: https://www.who.int/publications/i/item/9789240021402 (accessed on 7 March 2023).
  4. Liguori, K.; Keenum, I.; Davis, B.C.; Calarco, J.; Milligan, E.; Harwood, V.J.; Pruden, A. Antimicrobial resistance monitoring of water environments: A framework for standardized methods and quality control. Environ. Sci. Technol. 2022, 56, 9149–9160. [Google Scholar] [CrossRef] [PubMed]
  5. Pachepsky, Y.A.; Allende, A.; Boithias, L.; Cho, K.; Jamieson, R.; Hofstra, N.; Molina, M. Microbial water quality: Monitoring and modeling. J. Environ. Qual. 2018, 47, 931–938. [Google Scholar] [CrossRef] [PubMed]
  6. Thaker, M.; Spanogiannopoulos, P.; Wright, G.D. The tetracycline resistome. Cell. Mol. Life Sci. 2010, 67, 419–431. [Google Scholar] [CrossRef]
  7. European Centre for Disease Prevention and Control (ECDC); European Food Safety Authority (EFSA); European Medicines Agency (EMA). ECDC/EFSA/EMA second joint report on the integrated analysis of the consumption of antimicrobial agents and occurrence of antimicrobial resistance in bacteria from humans and food-producing animals: Joint Interagency Antimicrobial Consumption and Resistance Analysis (JIACRA) Report. EFSA J. 2017, 15, e04872. [Google Scholar]
  8. Berglund, F.; Böhm, M.E.; Martinsson, A.; Ebmeyer, S.; Österlund, T.; Johnning, A.; Larsson, D.G.J.; Kristiansson, E. Comprehensive screening of genomic and metagenomic data reveals a large diversity of tetracycline resistance genes. Microb. Genom. 2020, 6, e000455. [Google Scholar] [CrossRef]
  9. Yoneda, I.; Rozanah, U.N.; Nishiyama, M.; Mith, H.; Watanabe, T. Detection and genetic analysis of Escherichia coli from Tonle Sap Lake and its tributaries in Cambodia: Spatial distribution, seasonal variation, pathogenicity, and antimicrobial resistance. Environ. Pollut. 2022, 315, 120406. [Google Scholar] [CrossRef]
  10. Dang, B.; Mao, D.; Xu, Y.; Luo, Y. Conjugative multi-resistant plasmids in Haihe River and their impacts on the abundance and spatial distribution of antibiotic resistance genes. Water Res. 2017, 111, 81–91. [Google Scholar] [CrossRef]
  11. Suzuki, Y.; Hashimoto, R.; Xie, H.; Nishimura, E.; Nishiyama, M.; Nukazawa, K.; Ishii, S. Growth and antibiotic resistance acquisition of Escherichia coli in a river that receives treated sewage effluent. Sci. Total Environ. 2019, 690, 696–704. [Google Scholar] [CrossRef]
  12. Duff, J.A.; Aslan, A.; Cohen, R.A. Land Use and Environmental Variables Influence Tetracycline-Resistant Bacteria Occurrence in Southeastern Coastal Plain Streams. J. Environ. Qual. 2019, 48, 1809–1816. [Google Scholar] [CrossRef]
  13. Dungan, R.S.; Bjorneberg, D.L. Antimicrobial resistance in escherichia coli and enterococcal isolates from irrigation return flows in a high-desert watershed. Front. Microbiol. 2021, 12, 660697. [Google Scholar] [CrossRef]
  14. Satoh, H.; Nagahashi, N.; Kikuchi, K.; Hirano, R. Screening Antibiotic-Resistant Escherichia coli in Wastewater and River Water Using a Novel Simple Phenotypic Antibiotic-Susceptibility Testing Method. ACS EST Water 2022, 2, 1301–1308. [Google Scholar] [CrossRef]
  15. Wang, C.; Gu, X.; Zhang, S.; Wang, P.; Guo, C.; Gu, J.; Hou, J. Characterization of Antibiotic-Resistance Genes in Antibiotic Resistance Escherichia coli Isolates From a Lake. Arch. Environ. Contam. Toxicol. 2013, 65, 635–641. [Google Scholar] [CrossRef]
  16. Pang, Y.C.; Xi, J.Y.; Li, G.Q.; Shi, X.J.; Hu, H.Y. Prevalence of antibiotic-resistant bacteria in a lake for the storage of reclaimed water before and after usage as cooling water. Environ. Sci. Process. Impacts 2015, 17, 1182–1189. [Google Scholar] [CrossRef]
  17. Li, B.; Vellidis, G.; Liu, H.; Jay-Russell, M.; Zhao, S.; Hu, Z.; Wright, A.; Elkins, C.A. Diversity and antimicrobial resistance of Salmonella enterica isolates from surface water in southeastern United States. Appl. Environ. Microbiol. 2014, 80, 6355–6365. [Google Scholar] [CrossRef] [PubMed]
  18. Harmon, D.E.; Miranda, O.A.; McCarley, A.; Eshaghian, M.; Carlson, N.; Ruiz, C. Prevalence and characterization of carbapenem-resistant bacteria in water bodies in the Los Angeles–Southern California area. Microbiologyopen 2019, 8, e00692. [Google Scholar] [CrossRef]
  19. Hiller, C.X.; Hübner, U.; Fajnorova, S.; Schwartz, T.; Drewes, J.E. Antibiotic microbial resistance (AMR) removal efficiencies by conventional and advanced wastewater treatment processes: A review. Sci. Total Environ. 2019, 685, 596–608. [Google Scholar] [CrossRef]
  20. Craddock, H.A.; Chattopadhyay, S.; Rjoub, Y.; Rosen, D.; Greif, J.; Lipchin, C.; Mongodin, E.F.; Sapkota, A.R. Antibiotic-resistant Escherichia coli and Klebsiella spp. in greywater reuse systems and pond water used for agricultural irrigation in the West Bank, Palestinian Territories. Environ. Res. 2020, 188, 109777. [Google Scholar] [CrossRef] [PubMed]
  21. Nnadozie, C.F.; Odume, O.N. Freshwater environments as reservoirs of antibiotic resistant bacteria and their role in the dissemination of antibiotic resistance genes. Environ. Pollut. 2019, 254, 113067. [Google Scholar] [CrossRef]
  22. Christou, A.; Agüera, A.; Bayona, J.M.; Cytryn, E.; Fotopoulos, V.; Lambropoulou, D.; Manaia, C.M.; Michael, C.; Revitt, M.; Schröder, P.; et al. The potential implications of reclaimed wastewater reuse for irrigation on the agricultural environment: The knowns and unknowns of the fate of antibiotics and antibiotic resistant bacteria and resistance genes—A review. Water Res. 2017, 123, 448–467. [Google Scholar] [CrossRef]
  23. Amato, M.; Dasí, D.; González, A.; Ferrús, M.A.; Castillo, M.Á. Occurrence of antibiotic resistant bacteria and resistance genes in agricultural irrigation waters from Valencia city (Spain). Agric. Water Manag. 2021, 256, 107097. [Google Scholar] [CrossRef]
  24. Galvin, S.; Boyle, F.; Hickey, P.; Vellinga, A.; Morris, D.; Cormican, M. Enumeration and characterization of antimicrobial-resistant Escherichia coli bacteria in effluent from municipal, hospital, and secondary treatment facility sources. Appl. Environ. Microbiol. 2010, 76, 4772–4779. [Google Scholar] [CrossRef] [PubMed]
  25. Weinstein, M.P.; Lewis, J.S.; Bobenchik, A.M.; Campeau, S.; Cullen, S.K.; Galas, M.F.; Gold, H.; Humphries, R.M.; Kirn, T.J.; Limbago, B.; et al. M100 Performance Standards for Antimicrobial Susceptibility Testing A CLSI Supplement for Global Application. Performance Standards for Antimicrobial Susceptibility Testing Performance Standards for Antimicrobial Susceptibility Testing. Sci. Rep. 2020. Available online: https://www.nih.org.pk/wp-content/uploads/2021/02/CLSI-2020.pdf (accessed on 7 March 2023).
  26. Hammer, Ø.; Harper, D.A.; Ryan, P.D. PAST: Paleontological statistics software package for education and data analysis. Palaeontol. Electron. 2001, 4, 9. [Google Scholar]
  27. Hothorn, T.; Hornik, K.; Zeileis, A. Unbiased recursive partitioning: A conditional inference framework. J. Comput. Graph. Stat. 2006, 15, 651–674. [Google Scholar] [CrossRef]
  28. R Core Team. R: A Language and Environment for Statistical Computing; R Foundation for Statistical Computing: Vienna, Austria, 2018; Available online: http://www.R-project.org/ (accessed on 7 March 2023).
  29. Hothorn, T.; Seibold, H.; Zeileis, A. Package ‘Partykit’ a Toolkit for Recursive Partitioning v1.2-20. Available online: https://cran.r-project.org/web/packages/partykit/index.html (accessed on 15 April 2023).
  30. Steele, M.; Mahdi, A.; Odumeru, J. Microbial assessment of irrigation water used for production of fruit and vegetables in Ontario, Canada. J. Food Prot. 2005, 68, 1388–1392. [Google Scholar] [CrossRef] [PubMed]
  31. Harris, C.S.; Tertuliano, M.; Rajeev, S.; Vellidis, G.; Levy, K. Impact of storm runoff on Salmonella and Escherichia coli prevalence in irrigation ponds of fresh produce farms in southern Georgia. J. Appl. Microbiol. 2018, 124, 910–921. [Google Scholar] [CrossRef]
  32. Stocker, M.D.; Pachepsky, Y.A.; Smith, J.; Morgan, B.; Hill, R.L.; Kim, M.S. Persistent Patterns of E. coli Concentrations in Two Irrigation Ponds from 3 Years of Monitoring. Water Air Soil Pollut. 2021, 232, 492. [Google Scholar] [CrossRef]
  33. Zeki, S. A preliminary evaluation of microbial water quality in the irrigation pond. Water Environ. Res. 2022, 94, e10757. [Google Scholar] [CrossRef]
  34. Ferguson, C.M.; Coote, B.G.; Ashbolt, N.J.; Stevenson, I.M. Relationships between indicators, pathogens and water quality in an estuarine system. Water Res. 1996, 30, 2045–2054. [Google Scholar] [CrossRef]
  35. Cho, K.H.; Pachepsky, Y.A.; Kim, J.H.; Guber, A.K.; Shelton, D.R.; Rowland, R. Release of Escherichia coli from the bottom sediment in a first-order creek: Experiment and reach-specific modeling. J. Hydrol. 2010, 391, 322–332. [Google Scholar] [CrossRef]
  36. Santiago-Rodriguez, T.M.; Tremblay, R.L.; Toledo-Hernandez, C.; Gonzalez-Nieves, J.E.; Ryu, H.; Santo Domingo, J.W.; Toranzos, G.A. 2012. Microbial quality of tropical inland waters and effects of rainfall events. Appl. Environ. Microbiol. 2012, 78, 5160–5169. [Google Scholar] [CrossRef] [PubMed]
  37. McEgan, R.; Mootian, G.; Goodridge, L.D.; Schaffner, D.W.; Danyluk, M.D. Predicting Salmonella populations from biological, chemical, and physical indicators in Florida surface waters. Appl. Environ. Microbiol. 2013, 79, 4094–4105. [Google Scholar] [CrossRef] [PubMed]
  38. Durham, B.W.; Porter, L.; Webb, A.; Thomas, J. Seasonal influence of environmental variables and artificial aeration on Escherichia coli in small urban lakes. J. Water Health 2016, 14, 929–941. [Google Scholar] [CrossRef] [PubMed]
  39. Antaki, E.M.; Vellidis, G.; Harris, C.; Aminabadi, P.; Levy, K.; Jay-Russell, M.T. Low concentration of Salmonella enterica and generic Escherichia coli in farm ponds and irrigation distribution systems used for mixed produce production in southern Georgia. Foodborne Pathog. Dis. 2016, 13, 551–558. [Google Scholar] [CrossRef]
  40. Topalcengiz, Z.; Strawn, L.K.; Danyluk, M.D. Microbial quality of agricultural water in Central Florida. PLoS ONE 2017, 12, e0174889. [Google Scholar] [CrossRef]
  41. Draper, A.D.; Doores, S.; Gourama, H.; Laborde, L.F. Microbial Survey of Pennsylvania Surface Water Used for Irrigating Produce Crops. J. Food Prot. 2016, 79, 902–912. [Google Scholar] [CrossRef]
  42. Lee, D.; Tertuliano, M.; Vellidis, G.; Harris, C.; Grossman, M.K.; Rajeev, S.; Levy, K. Evaluation of grower-friendly, science-based sampling approaches for the detection of Salmonella in ponds used for irrigation of fresh produce. Foodborne Pathog. Dis. 2018, 15, 627–636. [Google Scholar] [CrossRef]
  43. Stocker, M.D.; Smith, J.E.; Pachepsky, Y.A. Depth-Dependent Concentrations of E. coli in Agricultural Irrigation Ponds. Water 2022, 14, 2276. [Google Scholar]
  44. Brissaud, F.; Tournoud, M.G.; Drakides, C.; Lazarova, V. Mixing and its impact on faecal coliform removal in a stabilisation pond. Water Sci. Technol. 2003, 48, 75–80. [Google Scholar] [CrossRef]
  45. He, J.; Valeo, C.; Chu, A. Variation in water quality of a stormwater pond from diurnal thermal stratification. J. Water Resour. Hydraul. Eng. 2015, 4, 181–190. [Google Scholar] [CrossRef]
  46. Gu, G.; Luo, Z.; Cevallos-Cevallos, J.M.; Adams, P.; Vellidis, G.; Wright, A.; van Bruggen, A.H. Occurrence and population density of Campylobacter jejuni in irrigation ponds on produce farms in the Suwannee River Watershed. Can. J. Microbiol. 2013, 59, 339–346. [Google Scholar] [CrossRef]
  47. Jenkins, M.B.; Endale, D.M.; Fisher, D.S.; Adams, M.P.; Lowrance, R.; Newton, G.L.; Vellidis, G. Survival dynamics of fecal bacteria in ponds in agricultural watersheds of the Piedmont and Coastal Plain of Georgia. Water Res. 2012, 46, 176–186. [Google Scholar] [CrossRef]
  48. Valenca, R.; Garcia, L.; Espinosa, C.; Flor, D.; Mohanty, S.K. Can water composition and weather factors predict fecal indicator bacteria removal in retention ponds in variable weather conditions? Sci. Total Environ. 2022, 838, 156410. [Google Scholar] [CrossRef]
  49. Skarbøvik, E.; Perović, A.; Shumka, S.; Nagothu, U.S. Nutrient inputs, trophic status and water management challenges in the transboundary Lake Skadar/Shkodra, Western Balkans. Arch. Biol. Sci. 2014, 66, 667–681. [Google Scholar] [CrossRef]
  50. Mallin, M.A.; McIver, M.R.; Wambach, E.J.; Robuck, A.R. Algal blooms, circulators, waterfowl, and eutrophic Greenfield Lake, North Carolina. Lake Reserv. Manag. 2016, 32, 168–181. [Google Scholar] [CrossRef]
  51. Aura, C.M.; Odoli, C.O.; Musa, S. Microbial dynamics within Lake Victoria Basin in relation to human activities. In Lakes of Africa; Elsevier: Amsterdam, The Netherlands, 2023; pp. 455–473. [Google Scholar]
  52. Chudoba, E.A.; Mallin, M.A.; Cahoon, L.B.; Skrabal, S.A. Stimulation of fecal bacteria in ambient waters by experimental inputs of organic and inorganic phosphorus. Water Res. 2013, 47, 3455–3466. [Google Scholar] [CrossRef]
  53. Zhang, Y.; Wu, R.; Zhang, Y.; Wang, G.; Li, K. Impact of nutrient addition on diversity and fate of fecal bacteria. Sci. Total Environ. 2018, 636, 717–726. [Google Scholar] [CrossRef]
  54. Korajkic, A.; Wanjugi, P.; Brooks, L.; Cao, Y.; Harwood, V.J. Persistence and decay of fecal microbiota in aquatic habitats. Microbiol. Mol. Biol. Rev. 2019, 83, e00005-19. [Google Scholar] [CrossRef] [PubMed]
  55. An, Y.J.; Kampbell, D.H.; Breidenbach, G.P. Escherichia coli and total coliforms in water and sediments at lake marinas. Environ. Pollut. 2002, 120, 771–778. [Google Scholar] [CrossRef]
  56. Borowski, W.S.; Aguiar, T.A.; Jolly, E.C.; Hunter, J.; Stockwell, R.D.; Albright, M.S.; Godbey, S.E.; West, B.E. Characteristics and environmental problems of a eutrophic, seasonally-stratified lake, Wilgreen Lake, Madison County, Kentucky. J. Ky. Acad. Sci. 2012, 73, 41–69. [Google Scholar] [CrossRef]
  57. Dias, D.F.C.; Passos, R.G.; von Sperling, M. A review of bacterial indicator disinfection mechanisms in waste stabilisation ponds. Rev. Environ. Sci. Bio/Technol. 2017, 16, 517–539. [Google Scholar] [CrossRef]
  58. Olanrewaju, T.O. The Emergence and Transfer of Antibiotic Resistance in Aquatic Environments: Effects of Plankton Interactions. Ph.D. Thesis, Ulster University, Coleraine, UK, 2020. [Google Scholar]
  59. Zhang, Q.; Zhang, Z.; Lu, T.; Peijnenburg, W.J.G.M.; Gillings, M.; Yang, X.; Chen, J.; Penuelas, J.; Zhu, Y.-G.; Zhou, N.-Y.; et al. Cyanobacterial blooms contribute to the diversity of antibiotic-resistance genes in aquatic ecosystems. Commun. Biol. 2020, 3, 737. [Google Scholar] [CrossRef] [PubMed]
  60. Cho, K.H.; Wolny, J.; Kase, J.A.; Unno, T.; Pachepsky, Y. Interactions of E. coli with algae and aquatic vegetation in natural waters. Water Res. 2022, 209, 117952. [Google Scholar]
  61. Beattie, R.E.; Walsh, M.; Cruz, M.C.; McAliley, L.R.; Dodgen, L.; Zheng, W.; Hristova, K.R. Agricultural contamination impacts antibiotic resistance gene abundances in river bed sediment temporally. FEMS Microbiol. Ecol. 2018, 94, fiy131. [Google Scholar] [CrossRef] [PubMed]
  62. Zhou, Z.C.; Zheng, J.; Wei, Y.Y.; Chen, T.; Dahlgren, R.A.; Shang, X.; Chen, H. Antibiotic resistance genes in an urban river as impacted by bacterial community and physicochemical parameters. Environ. Sci. Pollut. Res. 2017, 24, 23753–23762. [Google Scholar] [CrossRef] [PubMed]
  63. Tong, L.; Qin, L.; Guan, C.; Wilson, M.E.; Li, X.; Cheng, D.; Ma, J.; Liu, H.; Gong, F. Antibiotic resistance gene profiling in response to antibiotic usage and environmental factors in the surface water and groundwater of Honghu Lake, China. Environ. Sci. Pollut. Res. 2020, 27, 31995–32005. [Google Scholar] [CrossRef] [PubMed]
  64. Somerville, C.C.; Sweeney, A.P.; Chadwick, S.L.; Dotson, T. Antibiotic Resistant Bacteria in the Ohio River are not a Subset of Fecal Indicator Bacteria. In Proceedings of the 107th General Meeting of the American Society for Microbiological, Toronto, ON, Canada, 21 May 2007; pp. 21–25. [Google Scholar]
  65. Devarajan, N.; Laffite, A.; Graham, N.D.; Meijer, M.; Prabakar, K.; Mubedi, J.I.; Elongo, V.; Mpiana, P.T.; Ibelings, B.W.; Wildi, W.; et al. Accumulation of clinically relevant antibiotic-resistance genes, bacterial load, and metals in freshwater lake sediments in Central Europe. Environ. Sci. Technol. 2015, 49, 6528–6537. [Google Scholar] [CrossRef]
  66. EUCAST. The European Committee on Antimicrobial Susceptibility Testing. Breakpoint Tables for Interpretation of MICs and Zone Diameters. Version 13.0, 2023. Available online: http://www.eucast.org (accessed on 4 April 2023).
Figure 1. Map of the study site and sampling locations. Location 10 is where the irrigation intake pipe is located.
Applmicrobiol 03 00036 g001
Figure 2. Average concentrations of E. coli measured across locations on each sampling date. The blue and yellow bars show concentration averages on the surface and at the 1 m depth, respectively, and grey bars show precipitation amounts.
Applmicrobiol 03 00036 g002
Figure 3. Linear regressions between the total E. coli population and the low (blue) and high (red) tetracycline-resistant E. coli populations. Circles and squares indicate samples taken at the water surface and sub-surface, respectively.
Applmicrobiol 03 00036 g003
Figure 4. Conditional trees for the low (a) and high (b) tetracycline-amended sub-samples. The y-axes show the percentage of resistant E. coli.
Applmicrobiol 03 00036 g004
Table 1. Summary of the percentages of tetracycline-resistant E. coli by date, location, depth, and dosage.
24 August 20221 September 20228 September 202229 September 2022
LocationLowHighLowHighLowHighLowHigh
1-1N.M.0.01.20.23.81.49.03.0
1-2N.M.0.9N.M.N.M.2.51.18.91.4
2-1N.M.0.01.90.21.81.41.80.0
2-2N.M.4.8N.M.N.M.2.51.21.60.8
3-1N.M.0.02.70.53.32.50.00.0
3-2N.M.0.0N.M.N.M.6.64.11.90.9
4-1N.M.0.01.00.410.65.01.90.9
4-2N.M.0.0N.M.N.M.N.M.N.M.N.M.N.M.
5-1N.M.0.01.10.44.11.812.76.3
5-2N.M.4.1N.M.N.M.N.M.N.M.4.72.3
6-1N.M.0.00.60.32.11.83.80.0
6-2N.M.0.0N.M.N.M.N.M.N.M.N.M.N.M.
7-1N.M.0.01.51.33.11.07.56.3
7-2N.M.0.0N.M.N.M.N.M.N.M.4.20.7
8-1N.M.0.02.50.23.81.46.43.3
8-2N.M.0.0N.M.N.M.N.M.N.M.5.64.4
9-1N.M.0.01.90.05.83.24.82.4
9-2N.M.0.0N.M.N.M.N.M.N.M.6.52.5
10-1N.M.0.00.50.01.90.60.00.0
10-2N.M.0.0N.M.N.M.9.30.00.00.0
x surfaceN.M.0.01.50.44.02.04.82.2
x sub-surfaceN.M.1.0N.MN.M.5.21.64.21.6
x combinedN.M.0.51.50.44.41.94.52.0
Low and high refer to the tetracycline dosage of 4 μg mL−1 and 16 μg mL−1, respectively. N.M. = not measured, Surface and subsurface describe the water sampling depths of 0–20 cm and 1-m, respectively.
Disclaimer/Publisher’s Note: The statements, opinions and data contained in all publications are solely those of the individual author(s) and contributor(s) and not of MDPI and/or the editor(s). MDPI and/or the editor(s) disclaim responsibility for any injury to people or property resulting from any ideas, methods, instructions or products referred to in the content.

