Article

The Baseline Gut Microbiota Enterotype Directs Lifestyle-Induced Amelioration of Pollen Allergy Severity: A Self Controlled Case-Series Study

1
Cykinso, Inc., Tokyo 151-0053, Japan
2
Sompo Health Support Inc., Tokyo 101-0063, Japan
3
Sompo Japan Insurance Inc., Tokyo 160-8338, Japan
*
Author to whom correspondence should be addressed.
Appl. Microbiol. 2022, 2(4), 905-920; https://doi.org/10.3390/applmicrobiol2040069
Submission received: 13 September 2022 / Revised: 10 October 2022 / Accepted: 19 October 2022 / Published: 10 November 2022

Abstract

:
Deciphering the key factors underlying individual responses to a habitual diet is important in implementing personalized nutrition strategies to treat allergic diseases. This prospective randomized cohort study aimed to identify key factors determining individual pollen allergy (PA) trajectories in a natural setting. Baseline data on fecal microbiota composition, lifestyle activities, and diet habits of 190 participants with PA and 92 healthy controls were collected, followed by a SOMPO-guided intestinal activity program. Three enterotypes enriched in Bacteroides, Prevotella, and Ruminococcus and four subenterotypes for enterotypes Bacteroides and Prevotella enriched with Faecalibacterium, Megamonas, and Fusobacterium were identified at baseline. PA severity was significantly negatively correlated with the daily intake of fermented plants and no weekly intake of meat, but positively correlated with poor sleep quality. Interactions between enterotype and lifestyle factors affected PA severity, and intestinal activity intervention based on the baseline enterotype reduced the PA severity score. In conclusion, the findings of this study demonstrated that the baseline gut enterotype plays a crucial role in PA. This study suggests combining enterotype data with habitual diet can improve PA severity.

1. Introduction

Allergic rhinitis (AR), an inflammatory nasal mucosa disease induced by exposure to an allergen [1], is characterized by sneezing, nasal itching, nasal congestion, and rhinorrhea [2,3]. AR is a common global disease [4] and affects 21.7–36.8% of adults and approximately 22.5–36.6% of children [3,4]. Although AR is not considered a severe illness, its symptoms occur in all facets of daily life, leading to reduced quality of life [5,6,7]. The reduced work performance because of AR and the expense of AR treatment incur heavy costs for both individuals and society. In Japan, the expense of AR treatment has been estimated at ¥1560 billion per year in 2003, which imposes a huge burden on the national healthcare system [8]. Individuals with AR visit general practitioners more often, which may trigger many other complications, for example, asthma [9,10]. Epidemiological data suggest that most patients with asthma have concomitant AR, and the occurrence of AR increases the risk of developing asthma [11].
AR triggered by several allergens can be classified as seasonal (intermittent) or perennial (chronic) [12]. Pollen is one of the most common triggers of seasonal allergies. Except for monogenic pollen allergy (PA), common PA is associated with multiple factors, including genetic predisposition and environmental factors. In Japan, seasonal AR elicited by Japanese cedar pollen has been on the rise in recent years, increasing hospital visits and costs. Therefore, the identification of alternative therapeutic options is essential.
An increased incidence of AR is associated with changes in dietary habits [13,14]. Therefore, dietary interventions have been explored as potential and effective treatment strategies to reduce AR [15,16]. However, the results of the studies reporting the association between the intake of probiotics or prebiotics and AR incidence are highly variable and inconsistent [17]. Furthermore, the gut microbiota is recognized as an integrated immune factor that forms part of the host immune network. A healthy gut microbiota comprises a plethora of commensal microorganisms with diverse functions. A well-functioning gut microbiota regulates the energy balance and equilibrium via the fermentation of dietary fibers and conversion of dietary components into metabolically bioactive molecules, respectively. Several studies have reported an association between respiratory allergies and dysbiosis of the gut microbiota. Sagar et al. [18] reported that the Bifidobacterium breve and non-digestible oligosaccharides mixture inhibited the inflammation of the pulmonary airway by modulating the regulatory T cell response. These findings are also supported by clinical studies. A comparative study involving 489 school-aged children from rural and urban areas in Germany identified several bacteria, such as Acinetobacter, Lactobacillus, and Staphylococcus. The abundance of these bacteria was inversely related to the incidence of asthma and hay fever [19]. It has also been shown that the consumption of dairy products containing L. gasseri (TMC0356) and L. rhamnosus GG (ATCC53103), for approximately three months, modified the gut microbiota composition in Japanese patients with cedar allergy [20].
Given the association of the gut microbiota with allergic diseases and its involvement in the host immune response, the information on the gut microbiota composition of an individual could determine the immune status of the host. However, whether the gut microbiota influences the long-term consequences of pro-/prebiotics in PA remains elusive. Because long-term intervention programs are often self-managed, we hypothesized that (i) the association between lifestyle factors and PA shows inter-individual variation and is dependent on the enterotype of the baseline gut microbiota, and (ii) lifestyle interventions according to the baseline enterotype of an individual can predict changes in the severity of PA.
To test this hypothesis, in this prospective randomized cohort study, we investigated real-life data, including dietary habits, fecal metagenomics, and severity of PA, during a one-month lifestyle intervention program. We deciphered the baseline gut microbiota enterotype of individual participants to predict the relationships between the gut microbiota enterotype, lifestyle factors, and PA severity.

2. Materials and Methods

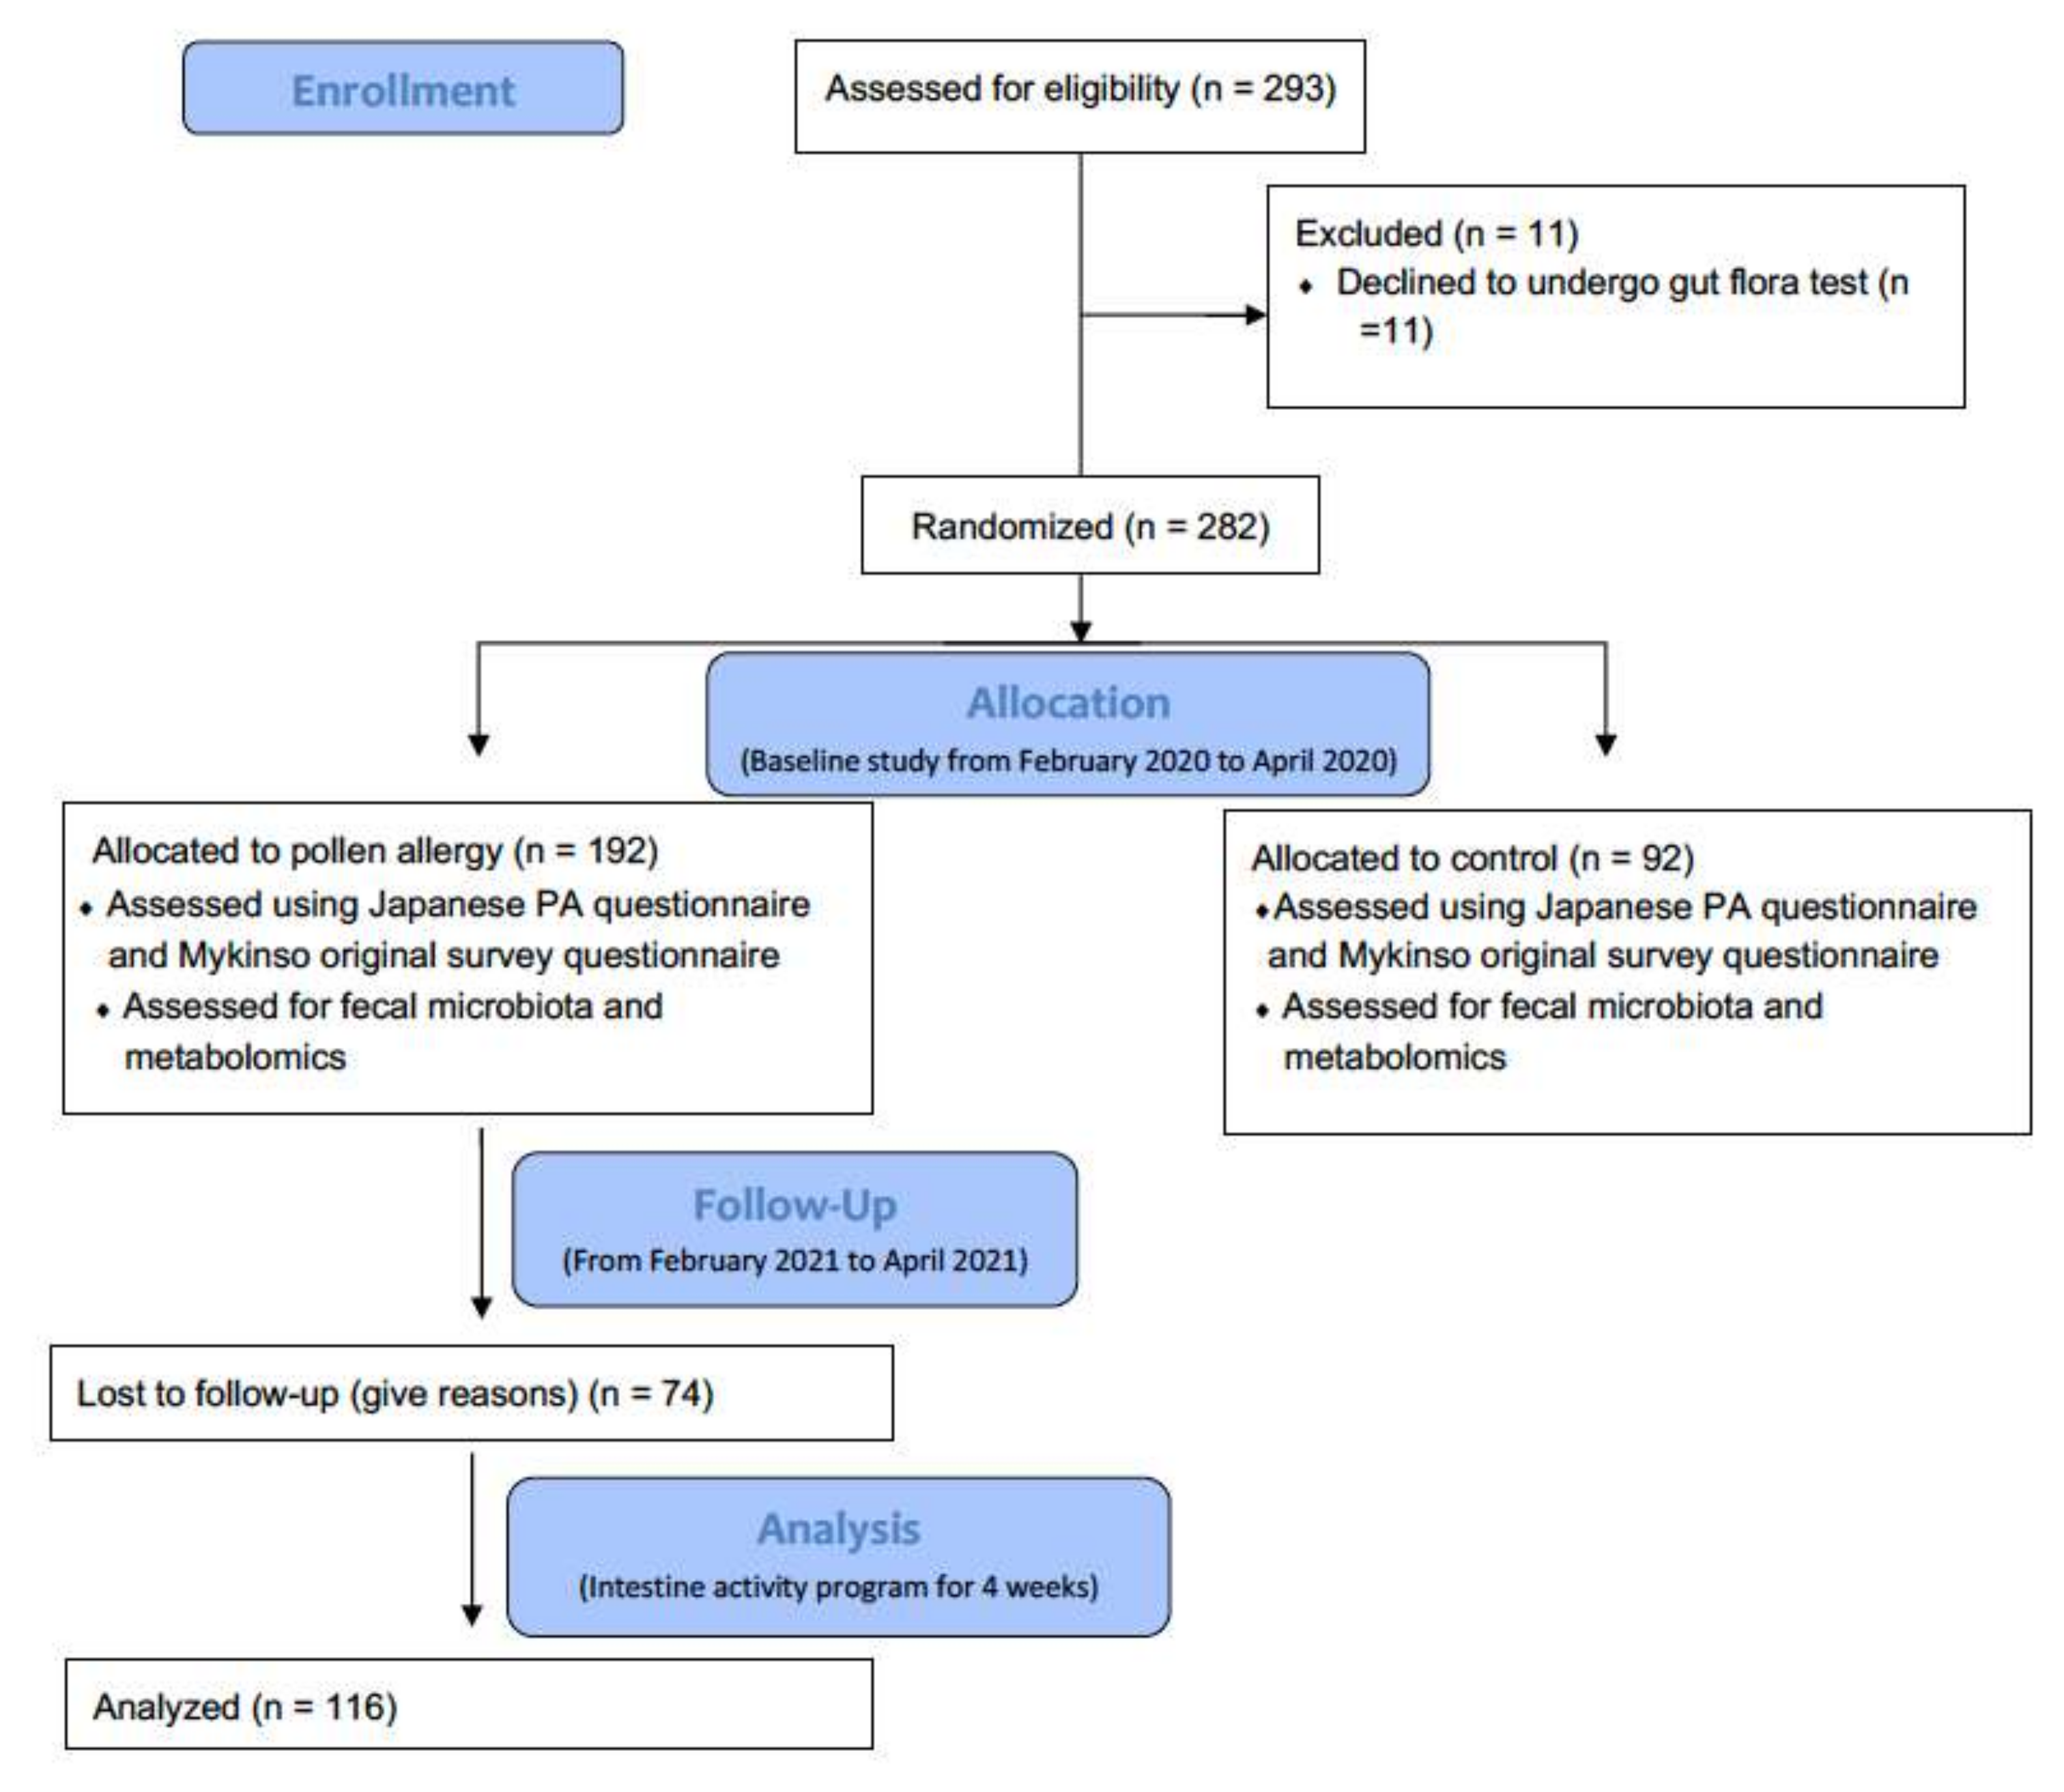
2.1. Study Design and Participant Enrollment

2.1.1. Design

This prospective study involved a SOMPO-Cykinso collaborative cohort. The study spanned one year and two months, comprising one month of the baseline study, one month of follow-up, and 1 month of an advisory intestinal activity intervention program following a nine-month gap after the baseline study. The influence of lifestyle factors, dietary habits, and gut microbiota on the severity of PA when adopting enterotype-guided individualized intestinal activity was investigated as a primary outcome.

2.1.2. Study Population

The study participants were recruited prospectively at the Gut Flora Utilization Promotion Secretariat set up by Sompo Japan Insurance, Inc. First, a baseline study was conducted among the employees of the company between February 2020 and April 2020. The employees were recruited via e-mail, and those who showed an interest in participating in the intestinal activity program and gut flora test were selected. Upon confirmation of their participation, they were asked to visit the center and answer the Japanese PA questionnaire [21] and the Mykinso original survey questionnaire [22]. Participants who had used antibiotics in the month prior to entry were excluded. Participants with diseases other than constipation, asthma, or atopic dermatitis were also excluded. Participants who causative antigens were cedar pollen were only included. After the assessment, 293 adult employees aged 20–60 years were recruited. Of these 293 participants, 11 dropped out because they did not undergo a gut flora test. The remaining 282 participants were randomized into a control group (without PA symptoms) and a PA group (with PA symptoms). Of the 282 volunteers, 74 were lost to follow-up. Finally, 116 participants were assessed for symptoms of PA and recruited for the follow-up study conducted between February 2021 and April 2021. Participants who used antibiotics in the month prior to the start of the follow-up were excluded. All participants were informed about the study through e-mail, and informed consent was obtained electronically. The procedures complied with the principles of the Declaration of Helsinki and were approved by the Ethical Review Board of Cykinso Inc. (IRB No. RN-202002-1-01). A flowchart of the study is shown in Figure 1.

2.1.3. Measurement and Evaluation

The participants in the baseline and follow-up studies were instructed to answer a Japanese PA questionnaire [21] and a Mykinso original survey questionnaire [22]. The Japanese PA questionnaire allows participants to self-assess and score the frequency of nasal symptoms, sneezes, rhinorrhea, and nasal congestion (numbers/day) on a five-point scale (0 = none, 1 = mild, 2 = moderate, 3 = severe, and 4 = very severe). The original Mykinso survey included questions related to lifestyle, bowel habits, and diseases. Participants who replied yes to any original survey question scored positively for the respective feature. Participants were scored negatively if they replied no, and unknown if the data were unavailable across all original surveys (Table S6).

2.2. Interventions

The participants who participated in the follow-up session (n = 116) were provided with advice to improve their lifestyle for four weeks (March 2021). An intestinal activity program was initiated depending on the enterotype of the individuals assessed in the baseline study. The intestinal activity program aimed to ensure three meals per day, improve sleep quality, and intake of fermented plants, dairy products, and animal proteins.

2.3. Fecal Sampling, DNA Extraction, Sequencing, and Data Analysis

Brush-type collection kits containing guanidine thiocyanate solution (TechnoSuruga Laboratory, Shizuoka, Japan) were used to collect fecal samples for the baseline study. The samples were then transported at ambient temperature and stored at 4 °C following the procedures described in a previous study [23]. DNeasy PowerSoil Kit (Qiagen, Hilden, Germany) was used to extract DNA from fecal samples following the manufacturer’s protocol. The 16S V1–V2 region was amplified by polymerase chain reaction [23] using the following primers: 16S_27F-mod, TCGGCAGCGTCAGATGTGTATAAGAGACAG AGRGTTTGATYMTGGCTCAG and 16S_338R, GTCTCGTGGGCTCGGAGATGTGTATAAGAGACAGTGCTGCCTCCCGTAGGAGT. The 16S library preparation protocol of Illumina (San Diego, CA, USA) was followed to prepare the sequencing libraries. The prepared libraries were sequenced in a 250 bp paired-end run (500 cycles) using a MiSeq Reagent Kit v2 (Illumina, San Diego, CA, USA). Sequencing data were analyzed following the protocol described by Kameoka et al. [23].

2.4. Taxonomic Identification

Data analysis was performed using the QIIME2 pipeline (version 2020.8) [24]. Joining paired-end reads, filtering, and denoising sequencing reads were performed using the DADA2 algorithm. Taxonomic information for each amplicon sequence variant was assigned using a naive Bayes classifier in the QIIME2 [25].

2.5. Data Analysis

The counts normalized to the total sum of each sample were used to assess the differences in abundance. For abundance testing, the genera with a relative abundance of 0.1% in at least 50% of the samples of the PA group were used. All data manipulation, analyses, and graphics were conducted using R and RStudio (version 4.1.0 and 2022.02.3, respectively, Vienna, Austria).

2.5.1. Enterotyping

Core genera were log10 transformed and entered into the PA group. The transformed genera were clustered using k-means clustering (R package tidymodels [26]). The elbow method was used to set the optimal number of clusters, which was set to K = 3 based on the sum of the squared errors and the number of clusters. Enterotypes were assigned based on the centering values of cluster centroids, encoded as enterotype B (Bacteroides enriched), enterotype P (Prevotella enriched), and enterotype R (Ruminococcus enriched). Furthermore, for high β-diversity in enterotypes B and P, sub-enterotyping was performed using the k-means method. The centering values of the clusters were used to assign the subenterotypes, encoded as enterotype BF (Faecalibacterium enriched in enterotype B), enterotype BM (Megamonas and Fusobacterium enriched in enterotype B), enterotype PF (Faecalibacterium enriched in enterotype P), and enterotype PM (Megamonas and Fusobacterium enriched in enterotype P).

2.5.2. Regression Analysis

To analyze the relationship between lifestyle factors, enterotype of the gut microbiome, and PA scores, the generalized Poisson regression model (R package glm2 [27]) was used to adjust for confounding by covariates (sex and age). Interaction analysis included interaction terms between lifestyle factors (including sleep scores, exercise scores, and food types) and microbiome features (including enterotypes of genera clustering). Statistical significance was accepted at a covariate-adjusted p-value of less than 0.05.

2.5.3. Difference-in-Differences Analysis

The trends of each enterotype among pre- and post-intestinal activity programs were compared using a difference-in-differences approach (R package glm2 [27]). This method isolates changes in intestinal activity-related outcomes while controlling for time-invariant allergy type differences and yearly time trends common to all enterotypes. The difference-in-differences model is based on two main assumptions: outcomes would continue to follow yearly time trends in the absence of the intervention and these time trends are similar between pre- and post-intervention. Difference-in-differences analyses compared the 2020 and 2021 phases before and after the initiation of the intestinal activity program. In total, three phases were tested. Surveys conducted in 2020 were designated as baseline, those in the pre-intervention period in 2021 were designated as controls, and those in the post-intervention period in 2021 were classified as treated. We used linear probability models (Equation (1)) with an interaction term between time point (year) and binary indicators of whether the observation was made after the intervention (post) as the main predictor variable. Statistical significance was accepted at two-tailed, and p-value of less than 0.05.
Y i t c =   b 0 + b 1 intervention _ c + b 2 year _ t + b 3 intervention _ c   ×   year _ t + eit _ c
where the subscripts i, t, and c refer to individual, year, and intervention, respectively. Yitc is the severity score, b0 is the intercept coefficient, b1 is the coefficient of the intervention term, b2 is the coefficient of the year term, b3 is the coefficient of the interaction term, and eit is an error.

3. Results

3.1. Characteristics
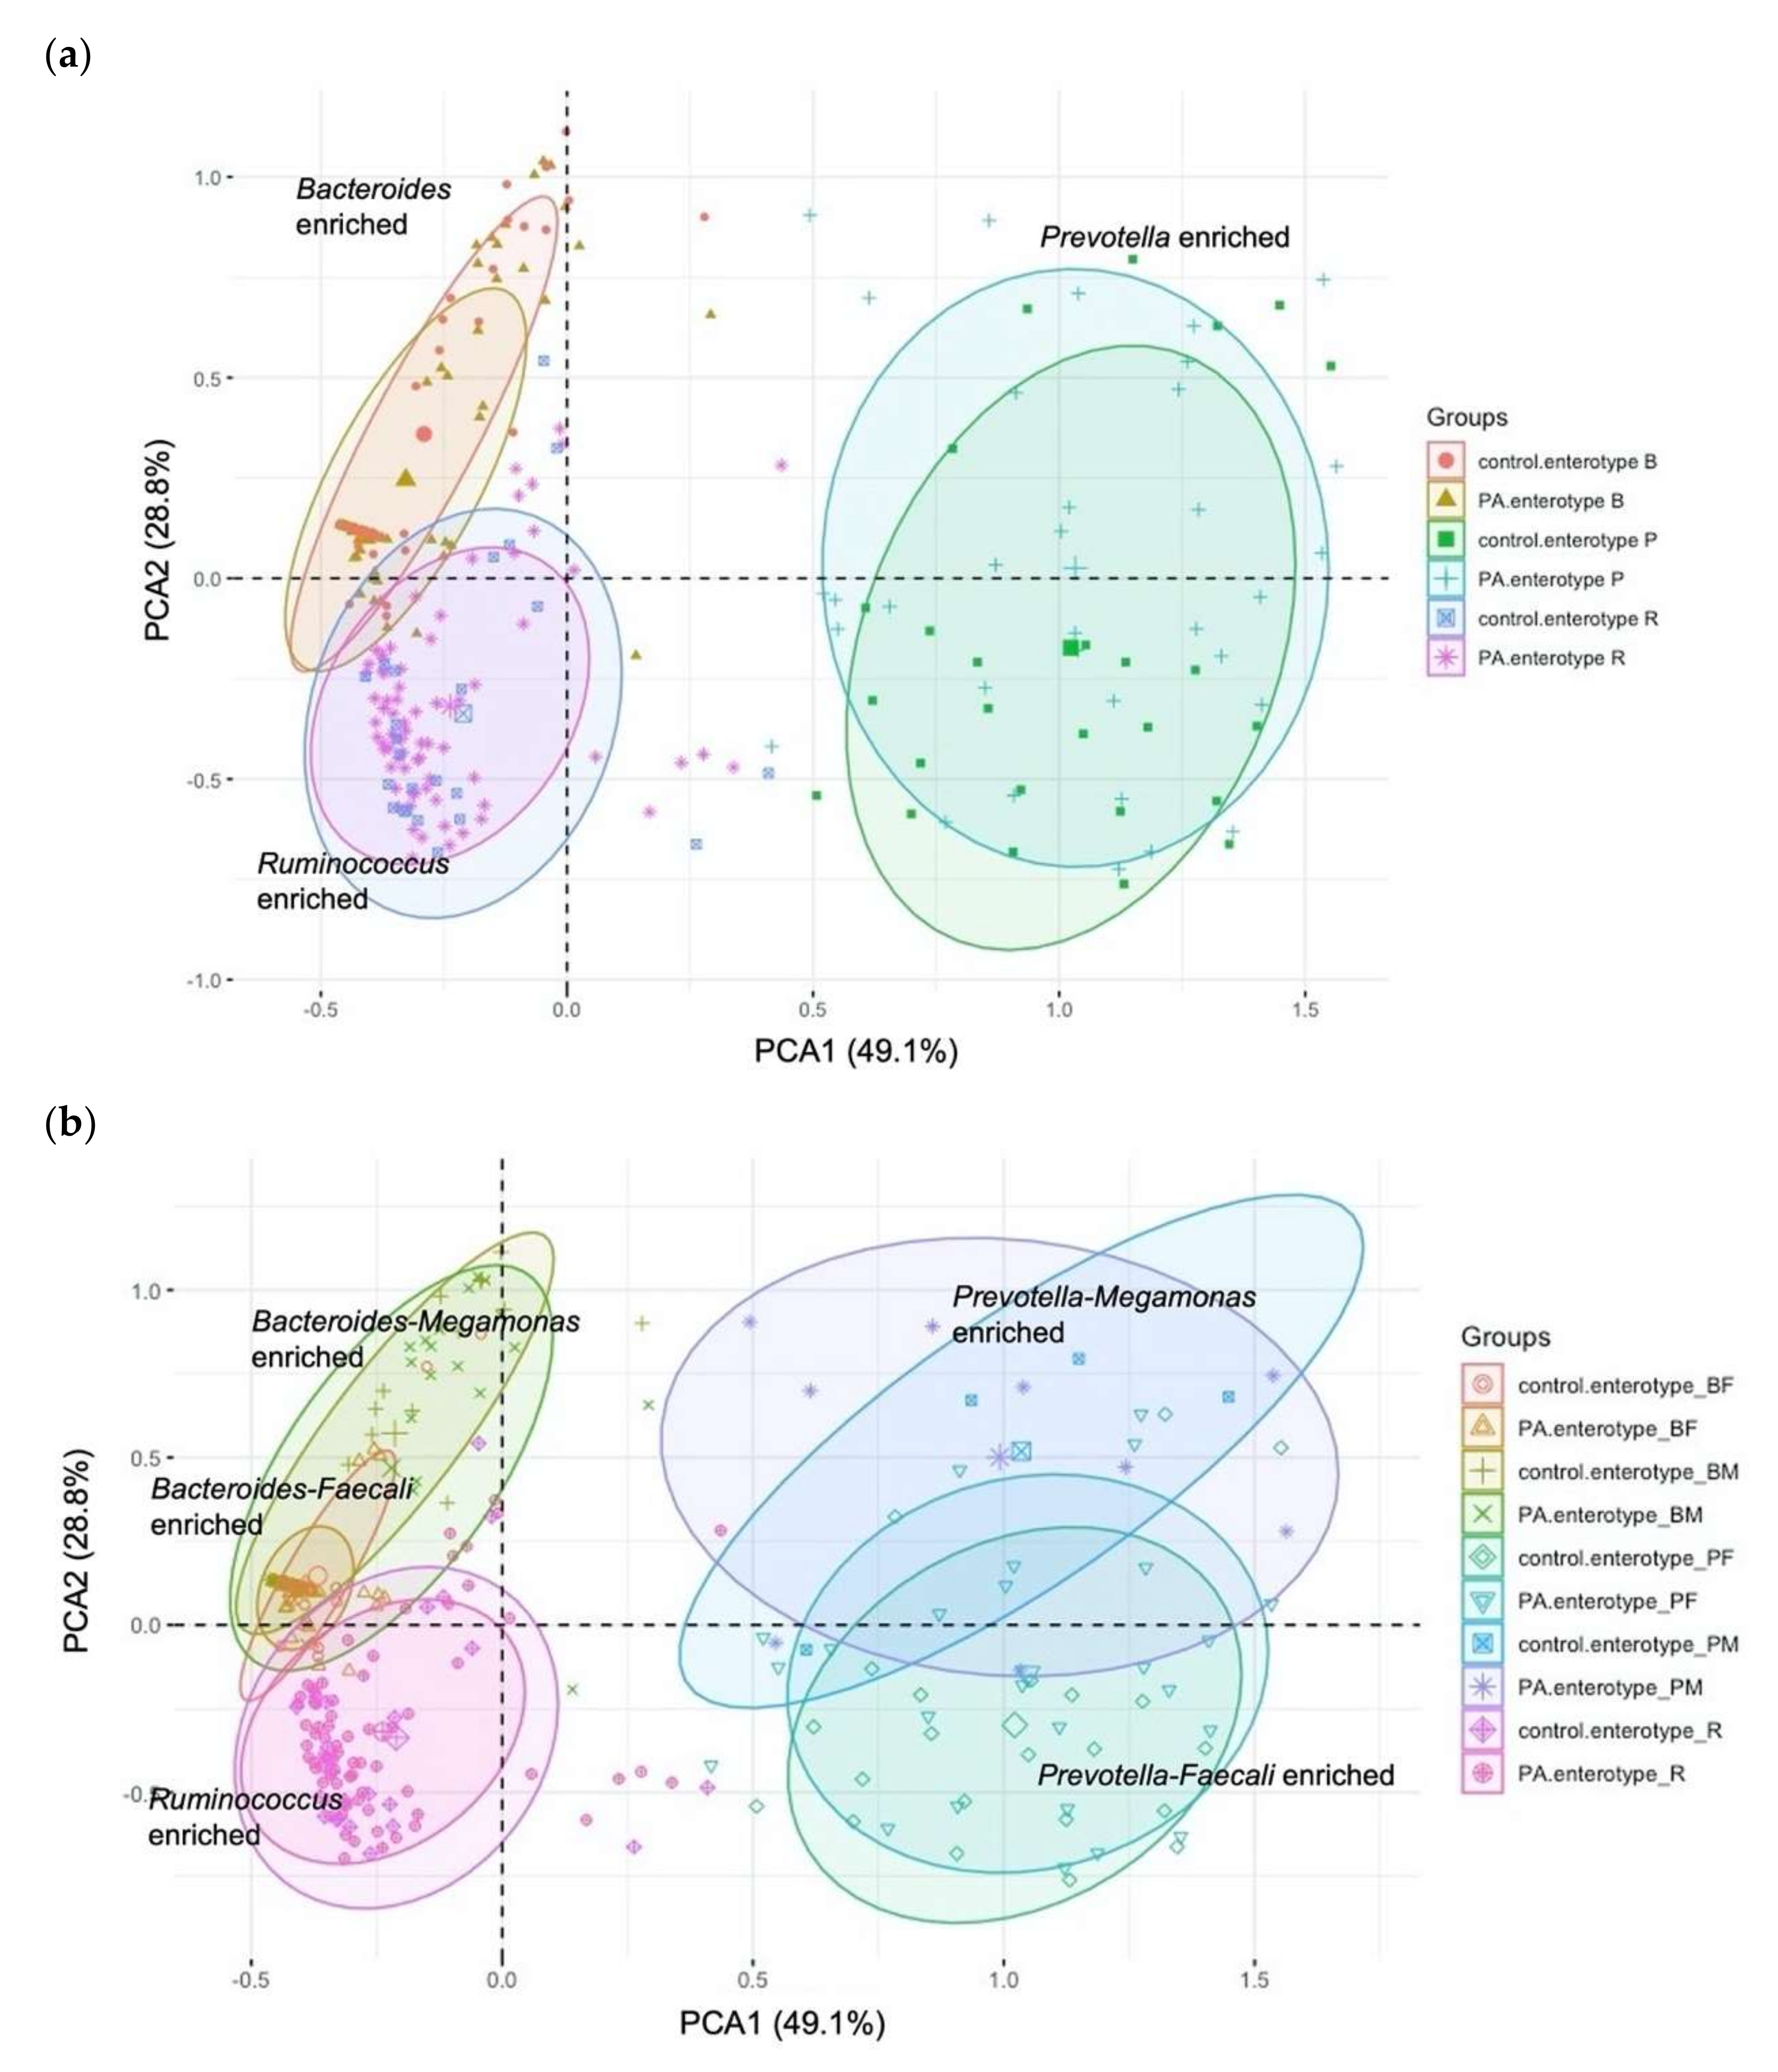
The characteristics of the participants are listed in Table 1. After excluding 11 participants who denied undergoing gut flora tests, 282 participants were divided into a control group (n = 92) and a group with symptoms of PA (n = 190) at the baseline study. The mean ages of the participants in the PA and control groups were 35.42 and 36.41 years, respectively, and the percentages of male and female participants were similar in both groups. The severity score of PA was very severe in 56% (n = 106) of participants, while 17% (n = 32) and 27% (n = 52) of participants had moderate and severe AR scores, respectively (Table 1 and Table S4).

3.2. Enterotyping

At baseline, the samples collected from the participants in the control group (n = 92) and PA group (n = 190) were clustered using their genus abundance profiles. Bacteroides (enterotype B), Prevotella (enterotype P), and Ruminococcus (enterotype R) were the major drivers of the three enterotypes (Figure 2a). In the PA group dataset, 82, 34, and 74 participants had enterotypes B, P, and R, respectively. In the control group dataset, 42, 26, and 24 subjects possessed enterotypes B, P, and R, respectively (Figure 2b). Furthermore, by subenterotyping in the PA group, 51, 31, 25, and 9 participants possessed the BF, BM, PF, and PM enterotypes, respectively. Subenterotyping of the control group identified 21, 21, 22, and 4 participants enriched with enterotypes BF, BM, PF, and PM, respectively (Figure 2b, Table 2 and Table S5).

3.3. Associations between Baseline Enterotype and Severity of PA

PA severity was negatively correlated with enterotype PF (coefficient = −0.394; p = 0.005) in reference to enterotype BF (Table 3). However, other enterotypes did not correlate with PA severity (Table 3). This result indicates that the baseline enterotype itself might not be superior to other factors in predicting PA severity.

3.4. Associations between Demographic, Lifestyle Factors and Severity of PA

The study found that higher PA severity was observed among males than females but the coefficient of gender was not significant (coefficient = 0.160; p = 0.099), and age had no significant effect (Table 4). PA severity was significantly negatively correlated with the daily intake of fermented plants (coefficient = −0.320; p = 0.006) and no weekly intake of meat (coefficient = −1.333; p = 0.024). In contrast, it was significantly positively correlated with poor sleep quality (coefficient = 0.195, p = 0.046). PA severity did not correlate with the daily intake of other foods (Table S1). However, the frequency of smoking (coefficient = −0.449; p = 0.005) was negatively correlated with PA severity, wherein frequency of alcohol intake had no significant effect on PA score (Table S1). These results indicate that immune responses to PA vary among individuals according to their lifestyle and dietary habits.

3.5. Interaction between Lifestyle Factors and Baseline Gut Microbiota Enterotype Is Superior as an Explanatory Factor of Severity of PA

Next, we assessed the role of different gut microbiota enterotypes at baseline in determining interpersonal differences in the relation to diet and PA. Using the generalized Poisson regression model to regress PA severity and including the interaction terms between lifestyle factors and the five enterotypes in the model, we identified that PA severity was modulated by the interaction between enterotypes and several lifestyle factors (Table 5). The negative association between PA severity and three meals a day was higher among individuals with a predominant enterotype BM (coefficient = −0.395; p = 0.071), but not for enterotype BF (coefficient = 0.374; p = 0.092). However, the difference in the association was not significant. Similarly, animal protein intake in enterotype PM was significantly negatively associated with PA severity (coefficient = −1.179; p = 0.029), while that in enterotype R showed a positive association (coefficient = 0.271; p = 0.098). The positive association between PA severity and daily intake of dairy products was higher among enterotype R (coefficient = 0.357; p = 0.053), but not for other enterotypes (Table S2). However, the difference in the association was not significant.
To further investigate the effect of lifestyle factors on the incidence of PA, we examined the influence of lifestyle factors and enterotypes (Table S3). To unravel enterotype-dependent relationships, the association between lifestyle factors and PA prevalence in each enterotype (BF [n = 72], BM [n = 52], PF [n = 47], PM [n = 13], and R [n = 98]) was evaluated. As shown in Table 6 and Table S3, the association between sleep quality and PA was highest in enterotype BF (odds ratio (OR) = 3.36 [1.06–14.99]). The OR of no weekly intake of fermented plants was high in enterotype R (OR = 1.98 [0.91–4.48]), whereas Both the OR of daily intake of dairy products and fermented plants was low in enterotype PF (OR = 0.44 [0.15–1.28] and 0.21 [0.05–0.72], respectively).

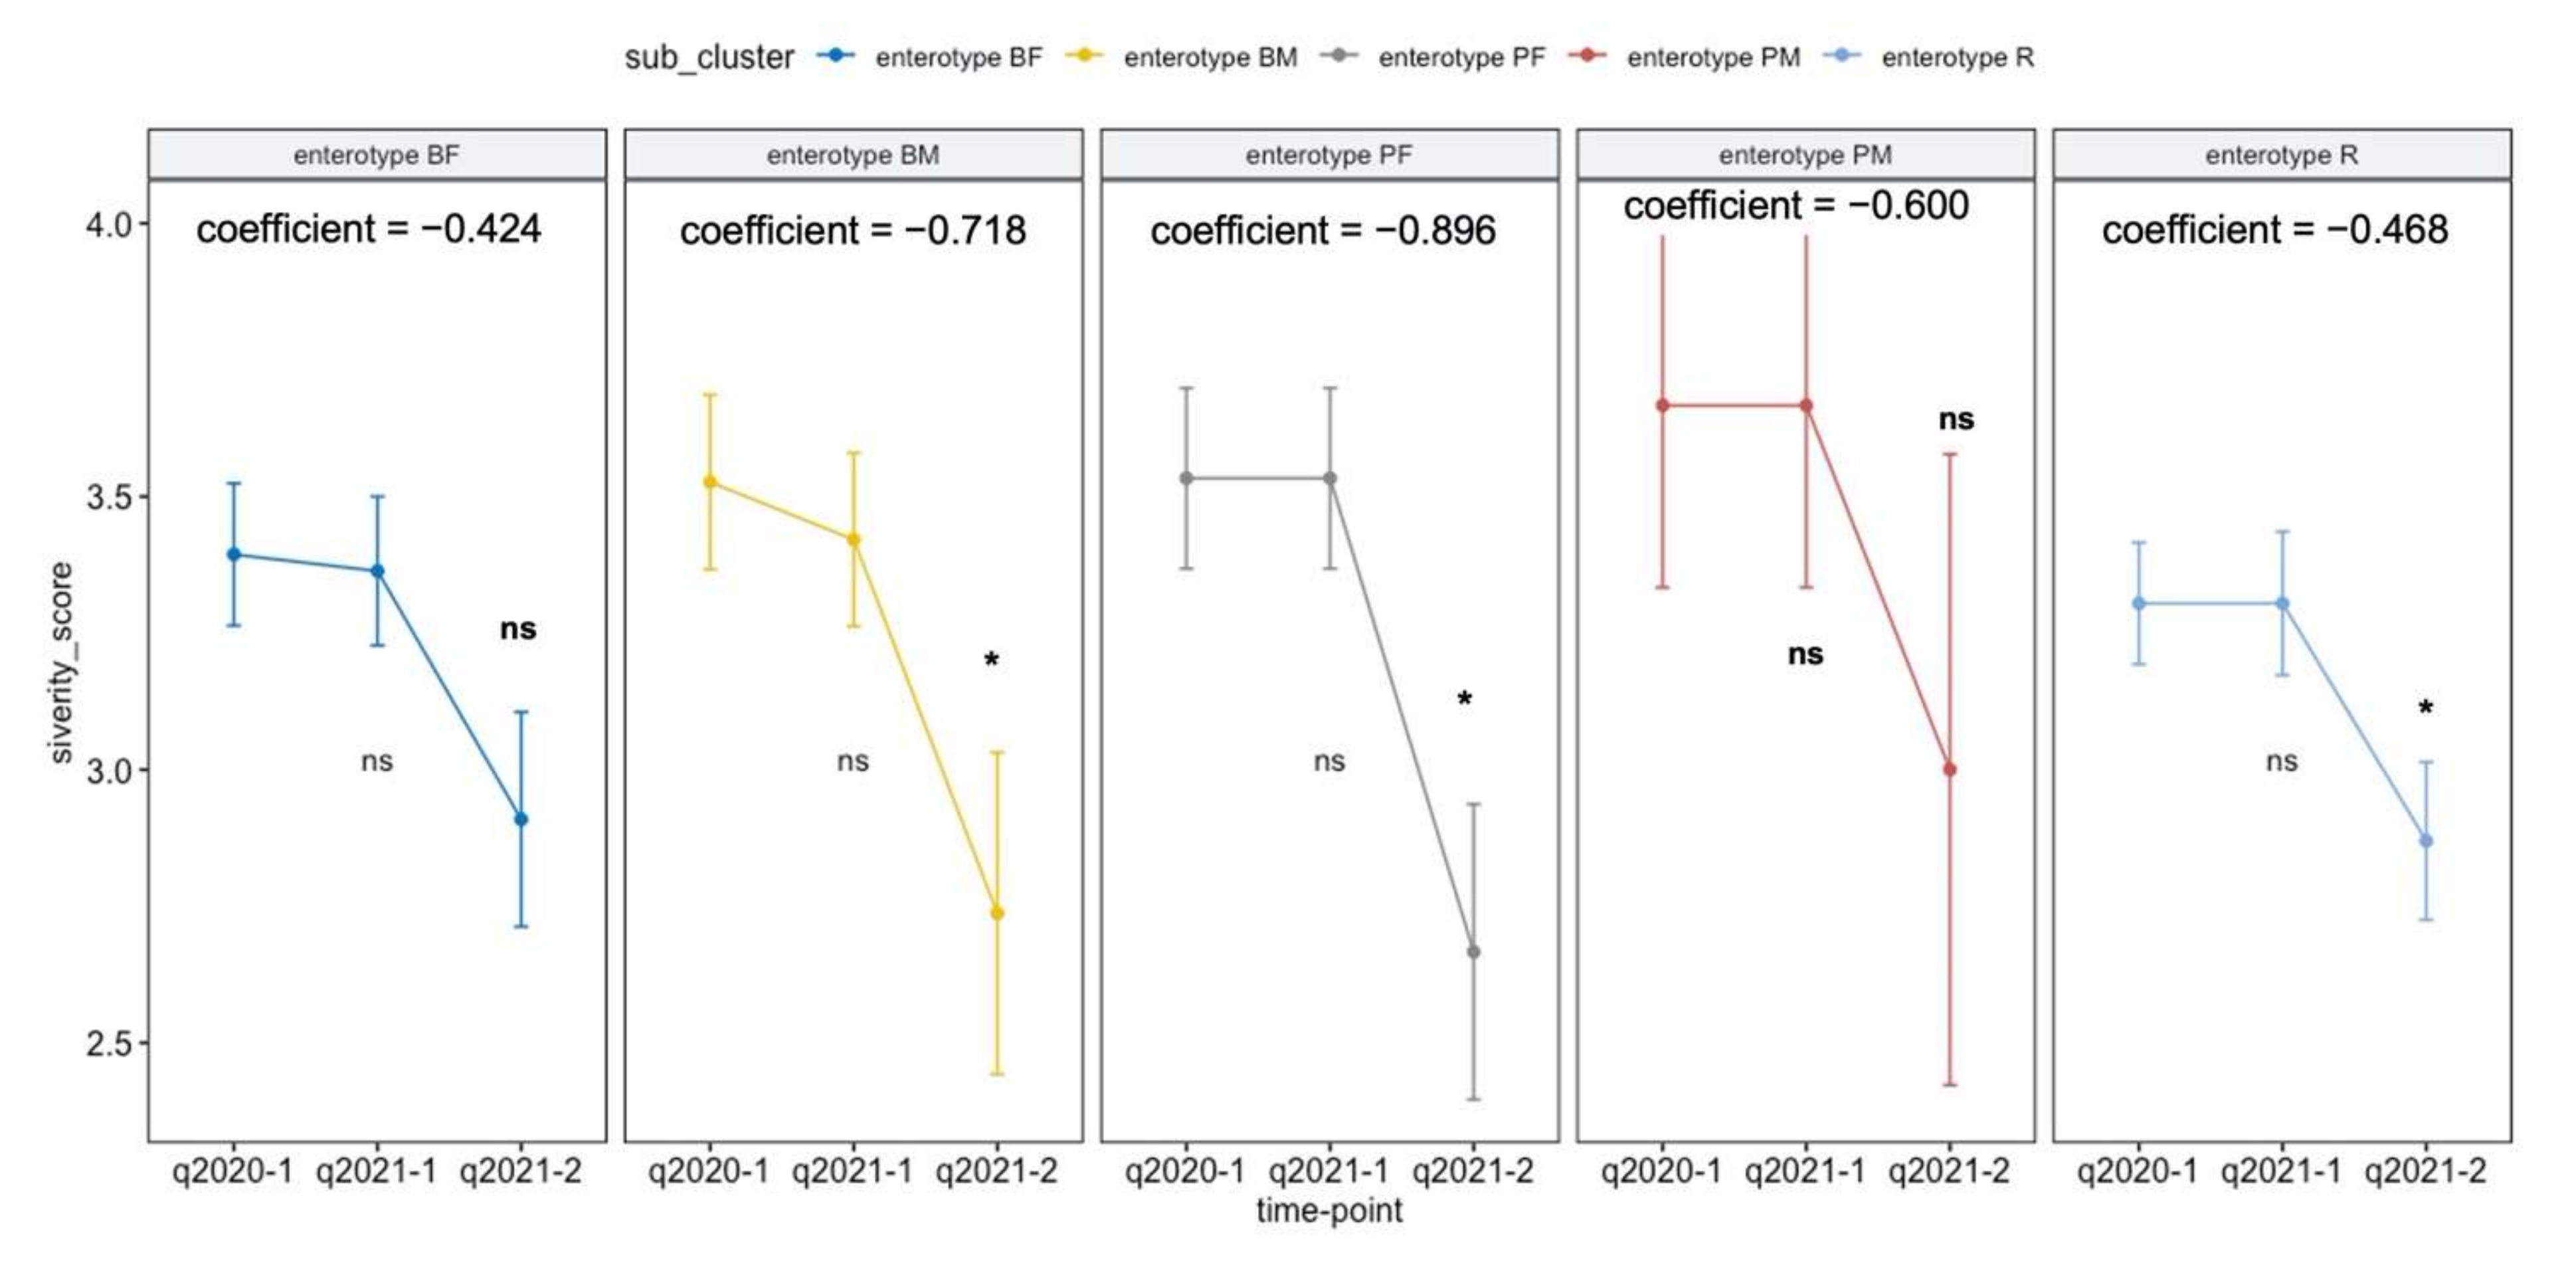
3.6. Intestinal Activity Intervention Program Depending on Enterotype Affect the PA Trajectory

Based on the baseline study results, the intestinal activity program aimed at ensuring three meals a day for enterotype BM, improved sleep quality for enterotype BF, intake of fermented plants for enterotype R, dairy products for enterotype PF, and animal proteins for enterotype PM. Therefore, we first analyzed the effects of the intestinal activity intervention program on the PA severity score. As shown in Figure 3, the severity score was reduced by two points from that in the initial phase in 18 participants. Thirty-one participants had a reduction of one point, while seventy-seven had a reduction of less than one point during the one-month program. The average severity reduction in all participants was 0.54 ± 0.92 (mean ± standard deviation (SD)) at the end of the study.
Next, we determined whether any enterotype-dependent intestinal activity intervention was associated with PA severity change during the one-month program across each enterotype group. The adjusted regression analysis revealed a significant reduction in the PA severity score in enterotypes BM, PF, and R, but not in enterotypes BF and PM (Table 7). After adjusting for covariates and year, the intestinal activity program reduced the PA severity score in enterotypes BM, BF, and R (−0.7177, SD = 0.3298; −0.8958, SD = 0.4036; and −0.4637, SD = 0.2158, respectively).

4. Discussion

In this prospective cohort study, we investigated how the adoption of enterotype-guided, individualized lifestyle recommendations affected the severity of PA symptoms. These findings demonstrated that the baseline enterotype might not be the strongest indicator of PA severity on its own. The associations between dietary variables and PAs were highly specific and dependent on the enterotype of the initial gut microbiota. Furthermore, lifestyle factors and the baseline gut microbiota enterotype were significant predictors of variations in PA severity over the course of a one-month-long intestinal intervention program. Recent reports have indicated individual differences in the immune response, which has led to a greater emphasis on individualized strategies [28]. PRACTALL, an initiative of the European Academy of Allergy and Clinical Immunology and the American Academy of Allergy, Asthma, & Immunology, endorsed several essential steps, including extensive evaluation of inflammatory components and functional effects, for application in precision medicine in patients with AR [29]. However, the effective implementation of such approaches requires a comprehensive understanding of the causal factors that determine both pro- and anti-inflammatory immune responses of the individuals. Our study focused on habitual diet-induced alleviation of PA sampled longitudinally for one month, with extensive use of tests and surveys of the gut microbiota and lifestyle data, as well as a pamphlet-guided intestinal activity program, whereas the previous studies have assessed the short-term effects of such strategies.
The development of allergic diseases can be partially prevented by prenatal and infant dietary exposure [30]. Numerous epidemiological studies have documented the beneficial effects of consuming specific nutrients [16] and foods [31] in later childhood. Because dietary patterns can, in some cases, reflect the interactions between various foods or nutrients, they may be helpful in studies examining the relationship between diet and health outcomes [32]. For instance, westernized lifestyles and diets have been linked to an increase in the prevalence of allergic diseases. For instance, a lack of fiber and several vitamins in Western diets reduces the protective effects of diet against systemic inflammation [30]. Similarly, we found a negative association between no weekly intake of meat and AR symptoms. In addition, our findings suggest that intake of fermented plant products, as well as non-intake of meat, may attenuate AR symptoms. Concordantly, a previous study in a mouse model of Japanese PA demonstrated that fermented plant products can alleviate the number of sneezes to major Japanese cedar pollen allergens without modifying systemic immunological characteristics [33]. It has also been shown that fermented plant products or their metabolites may prevent mast cell degranulation or accumulation at an inflammatory locus, either directly or indirectly [33]. Similarly, the consumption of vegetables, fruits, beans, fish, and specific nutrients has been associated with reduced odds of AR in Japanese adults, especially in females [34].
Several studies have reported an association between dietary habits and the composition of gut microbiota. For instance, enterotype B was more prevalent in people who regularly consumed a Western diet rich in protein and animal fat [35]. Vegetarian and Mediterranean diets mainly comprising fruits and vegetables, correlate positively with enterotype P [36,37]. A cross-sectional study showed that although reduced gut microbiota diversity and abundance of microbial taxa are associated with AR in adults, the most abundant genera in both the AR and control groups were Bacteroides and Faecalibacterium [38]. Lower bacterial diversity has also been observed in the early microbiota of children who later developed allergies, with a predominance of Firmicutes, a higher count of Bacteroidaceae, and a higher prevalence of Bacteroides fragilis, Escherichia coli, Clostridium difficile, Bifidobacterium catenulatum, Bifidobacterium bifidum, and other Bifidobacterium [39]. In contrast, Zhu et al. [40] showed that bacterial diversity was significantly higher in adult patients with AR than in those without AR. The study demonstrated enrichment of Firmicutes, Fusobacteria, Actinobacteria, Cyanobacteria, and Chloroflexi phyla and Prevotella, Phascolarctobacterium, Roseburia, Megamonas, Alistipes, Lachnoclostridium, and Fusobacterium genera in patients with AR [40]. Our study demonstrated that the enrichment of Prevotella and Faecalibacterium in the participants (enterotype PF) was associated with less severe PA. Previous studies showed that there was cross-feeding between acetate-producing and butyrate-producing bacteria, especially Faecalibacterium produce butyrate and Bacteroidetes phylum (both Bacteroides and Prevotella) produce acetate [41,42]; therefore, their increased abundance may protect disruption of the gut barrier integrity by increasing both production of butyrate and consumption of acetate [42]. Song et al. [43] reported that reduced butyrate and propionate levels attributed to an intraspecies compositional change in F. prausnitzii in fecal samples from patients with atopic dermatitis impaired the gut epithelial barrier, leading to the chronic progression of atopic dermatitis. Short-chain-fatty-acids (SCFAs) production by probiotics or dietary fiber has been shown to reduce allergic inflammation in allergic diseases [44].
The present study showed that the interaction between enterotypes and several lifestyle factors affected PA severity; however, the effect’s size differed among enterotypes. Our data demonstrated that baseline gut enterotypes outperformed other predictive factors in their ability to predict personalized responses to lifestyle changes concerning the interaction effects between enterotypes, lifestyle changes during the intervention, and PA severity trajectories. Furthermore, interaction analysis in our study revealed that animal protein intake was negatively associated with PA severity among enterotype PM, but not enterotype R. Further differential relationships across enterotypes demonstrated that the association between poor sleep quality and PA was highest in enterotype BF, the consumption of three meals per day was relatively strong in enterotype BM, and the intake of dairy products and fermented plant products was relatively strong in enterotype PF. Intestinal activity intervention dependent on enterotypes reduced the PA severity score in individuals with PA. The adjusted regression analysis revealed a significant reduction in the PA severity score in enterotypes BM, PF, and R, but not in enterotypes BF and PM. Nonetheless, after adjusting for covariates and years, the PA severity score was reduced in enterotypes BM, BF, and R. Taken together, these findings demonstrate that associations between lifestyle factors and PA severity are highly dependent on the baseline gut microbiota enterotype of an individual.
A previous study has shown that a lower diversity of intestinal Bifidobacterium species could be a potential indicator for using probiotics in managing Japanese cedar pollinosis (JCP) [45]. A recent cross-sectional study showed that nutrients, such as retinol, vitamin A, cryptoxanthin, and copper, as well as the abundance of Prevotella and Escherichia in the gut microbiome, were linked to the age- and gender-adjusted odds of AR. Furthermore, retinol and Prevotella have a combined protective effect, indicating an intricate relationship between dietary nutrients, gut microbiota, intestinal immune systems, and the development of AR [46]. Therefore, we must identify the key determinants of the interaction between enterotypes and lifestyle to solve the inconsistency in the effects of intestinal activity. Recent studies on the immunological impacts of diet and dietary metabolites have primarily focused on asthma and food allergies. However, several other allergic diseases are associated with diet and microbiota [47]. For example, a Mediterranean diet consisting of large amounts of fruits and vegetables has been shown to alleviate the clinical symptoms of AR [48]. Both probiotics and a combination of probiotics and prebiotics, particularly with heterogeneous mixtures of Lactobacillus species, have been shown to reduce the severity of atopic dermatitis [49]. These studies further highlight the role of diet and microbiota not only in the pathogenesis of allergic diseases but also in treating such diseases once they are established. Moreover, a multi-strain probiotic used to prevent eczema in high-risk infants has successfully limited the severity of allergic responses [50,51]. However, more studies are required to assess the efficacy of these probiotics to prevent other allergies. In children and adults with rhinitis, the administration of probiotics from Lactobacillus species has been shown to relieve nasal and ocular symptoms and improve the quality of life. The altered gut microbiota induced by Lactobacillus GG (LGG) and L. gasseri TMC0356-fermented milk has been reported as a potential treatment for JCP, with beneficial effects on blood lipid levels [20]. A randomized trial has shown that L. casei Shirota-containing fermented milk may delay the onset of allergy symptoms in individuals with moderate to severe nasal symptom ratings, but it does not prevent allergic responses in individuals sensitive to JCP [17]. However, several studies have provided conflicting evidence regarding the effectiveness of probiotics or prebiotics in lowering the risk of allergic diseases [52,53]. Therefore, more research is required to determine how probiotics or prebiotics might be used to modify intestinal bacteria to treat allergic disorders.
One of the limitations of our study was that AR was self-assessed. Routine clinical diagnosis is required to obtain more accurate AR information. Nevertheless, it is unlikely that the classification of participants based on self-reported symptoms could have affected our findings, and it is assumed that misclassification by self-reported symptoms is unlikely related to potential risk factors [54]. Second, we identified the exclusion criteria for medications that used antibiotics in the month prior to the start of the study. Therefore, the study participants may have taken some medication that affected gut microbiota. Third, the enterotype was derived from a baseline survey conducted one year ago. Since there was an eight-month gap between the baseline and follow-up surveys, the possibility that the enterotype had changed cannot be ruled out. Moreover, as the gut enterotype varies by race and ethnicity and in response to dietary habits, the findings may not be generalizable to other populations of different ethnicities and may need further analyses. Fourth, data from the 16S rRNA amplicon sample could not provide functional information. The mechanism by which the gut enterotype promotes the interventional effect of some intestinal activities on PA severity needs to be further studied, with a focus on key pathways such as gut barrier integrity function, bacterial metabolic pathways and functional metabolites that are related to immunological impact.

5. Conclusions

Our findings indicate an inverse association between lifestyle choices and PA, which depends on the baseline gut microbiota enterotype in Japanese adults. This study suggests that the intestinal gut microbiota of BM, PF, and R enterotypes could be a potential target for using prebiotics or probiotics in managing AR in Japanese adults. Moreover, real-world evidence from AR patients emphasizes the need for cost-effective healthcare as well as prospects for developing novel therapies [55]. Based on the findings of this study, we developed a novel testing approach using the five enterotypes and a habitual diet to identify treatments that can lessen or improve the severity of AR. The tool could potentially be used to increase labor productivity, lessen the economic burden, and direct businesses and health insurance provider services, such as health management.

6. Patents

The data reported in this article have been used to apply for a patent under Japanese Patent Application No. 2022-118307 (Patent applied for).

Supplementary Materials

The following supporting information can be downloaded at: https://www.mdpi.com/article/10.3390/applmicrobiol2040069/s1, Table S1: Lifestyle factors and their associations with pollen allergy (PA) severity score; Table S2: Interactions between five enterotypes (BF, BM, PF, PM, and R) and lifestyle factors in relation to PA severity; Table S3: Interactions between five enterotypes (BF, BM, PF, PM, and R) and lifestyle factors in relation to PA prevalence; Table S4: Demographics for each subject in this study; Table S5: Enterotypes for each subject in this study; Table S6: Mykinso original survey items.

Author Contributions

Conceptualization, project administration, T.F., T.M., T.D., K.F. and Y.S.; data curation, formal analysis, investigation, methodology, software, and visualization, S.W. and Y.M.; writing—original draft preparation, S.W.; writing—review and editing, S.W., T.F. and T.M.; resources, T.D., K.F. and Y.S. All authors have read and agreed to the published version of the manuscript.

Funding

This research received no external funding.

Institutional Review Board Statement

The procedures complied with the principles of the Declaration of Helsinki and were approved by the Ethical Review Board of Cykinso Inc. (IRB No. RN-202002-1-01).

Informed Consent Statement

All participants were informed about the study through e-mail, and informed consent was obtained electronically.

Data Availability Statement

All sequencing data have been deposited in the NCBI Sequence Read Archive under the project PRJNA873247 and are publicly available as of the date of publication. All codes are fully accessible from the referenced sources in program R. Additional information required to reanalyze the data reported in this work is available from the corresponding author upon request.

Acknowledgments

We express our deepest gratitude to all participants of the Mykinso cohort who provided valuable data for our research. We thank Kimihiro Okubo (Department of Basic Science of Nippon Medical School) for support with assessment of pollen allergy.

Conflicts of Interest

The authors declare no conflict of interest.

References

  1. Pawankar, R. Allergic rhinitis and its impacts on asthma: An evidence-based treatment strategy for allergic rhinitis. Asian Pac. J. Allergy Immunol. 2002, 20, 43–52. [Google Scholar] [PubMed]
  2. Seidman, M.D.; Gurgel, R.K.; Lin, S.Y.; Schwartz, S.R.; Baroody, F.M.; Bonner, J.R.; Dawson, D.E.; Dykewicz, M.S.; Hackell, J.M.; Han, J.K.; et al. Clinical practice guideline: Allergic rhinitis. Otolaryngol. Head Neck Surg. 2015, 152, S1–S43. [Google Scholar] [CrossRef] [PubMed]
  3. Okubo, K.; Kurono, Y.; Ichimura, K.; Enomoto, T.; Okamoto, Y.; Kawauchi, H.; Suzaki, H.; Fujieda, S.; Masuyama, K. Japanese guidelines for allergic rhinitis 2017. Allergol. Int. 2017, 66, 205–219. [Google Scholar] [CrossRef]
  4. Bousquet, J.; Khaltaev, N.; Cruz, A.A.; Denburg, J.; Fokkens, W.J.; Togias, A.; Zuberbier, T.; Baenacagnani, C.E.; Canonica, G.W.; Van, W.C.; et al. Allergic rhinitis and its impact on asthma (ARIA) 2008 update (in collaboration with the World Health Organization, GA(2)LEN and AllerGen). Allergy 2008, 63, 8–160. [Google Scholar] [CrossRef]
  5. Han, M.W.; Kim, S.H.; Oh, I.; Kim, Y.H.; Lee, J. Serum IL-1beta can be a biomarker in children with severe persistent allergic rhinitis. Allergy Asthma Clin. Immunol. 2019, 15, 58. [Google Scholar] [CrossRef] [Green Version]
  6. Minami, Y.; Shiozaki, Y.; Kato, C.; Ito, M.; Takeuchi, N.; Koyanagi, M.; Ogino, S. Japanese cedar pollinosis impact on work productivity, quality of life, and symptoms 2008 vs. 2009. Nihon Jibika Gakkai Kaishi 2010, 49, 481–489. [Google Scholar] [CrossRef] [Green Version]
  7. Kakutani, C.; Ogino, S.; Ikeda, H.; Enomoto, T. Impact of allergic rhinitis on work productivity: A pilot study. Allergy 2005, 54, 627–635. [Google Scholar]
  8. Kakutani, C.; Ogino, S.; Ikeda, H.; Enomoto, T. Comparison of clinical efficacy and cost-quality of antihistamines in early treatment for Japanese cedar pollinosis. Arerugi = [Allergy] 2006, 55, 554–565. [Google Scholar]
  9. Kakli, H.A.; Riley, T.D. Allergic Rhinitis. Prim. Care 2016, 43, 465–475. [Google Scholar] [CrossRef]
  10. Brożek, J.L.; Bousquet, J.; Agache, I.; Agarwal, A.; Bachert, C.; Bosnic-Anticevich, S.; Brignardello-Petersen, R.; Canonica, G.W.; Casale, T.; Chavannes, N.H.; et al. Allergic Rhinitis and its Impact on Asthma (ARIA) guidelines-2016 revision. J. Allergy Clin. Immunol. 2017, 140, 950–958. [Google Scholar] [CrossRef] [Green Version]
  11. Khan, D.A. Allergic rhinitis and asthma: Epidemiology and common pathophysiology. Allergy Asthma Proc. 2014, 35, 357–361. [Google Scholar] [CrossRef] [PubMed]
  12. Skoner, D.P. Allergic rhinitis: Definition, epidemiology, pathophysiology, detection, and diagnosis. J. Allergy Clin. Immunol. 2001, 108, S2–S8. [Google Scholar] [CrossRef] [PubMed]
  13. McKeever, T.M.; Britton, J. Diet and asthma. Am. J. Respir. Crit. Care Med. 2004, 170, 725–729. [Google Scholar] [CrossRef]
  14. Garcia-Larsen, V.; Del Giacco, S.R.; Moreira, A.; Bonini, M.; Charles, D.; Reeves, T.; Carlsen, K.H.; Haahtela, T.; Bonini, S.; Fonseca, J.; et al. Asthma and dietary intake: An overview of systematic reviews. Allergy 2016, 71, 433–442. [Google Scholar] [CrossRef] [PubMed] [Green Version]
  15. Moreno-Macias, H.; Romieu, I. Effects of antioxidant supplements and nutrients on patients with asthma and allergies. J. Allergy Clin. Immunol. 2014, 133, 1237–1244. [Google Scholar] [CrossRef]
  16. Nurmatov, U.; Devereux, G.; Sheikh, A. Nutrients and foods for the primary prevention of asthma and allergy: Systematic review and meta-analysis. J. Allergy Clin. Immunol. 2011, 127, 724–733. [Google Scholar] [CrossRef]
  17. Tamura, M.; Shikina, T.; Morihana, T.; Hayama, M.; Kajimoto, O.; Sakamoto, A.; Kajimoto, Y.; Watanabe, O.; Nonaka, C.; Shida, K.; et al. Effects of probiotics on allergic rhinitis induced by Japanese cedar pollen: Randomized, double-blind, placebo-controlled clinical trial. Int. Arch. Allergy Immunol. 2007, 143, 75–82. [Google Scholar] [CrossRef]
  18. Sagar, S.; Vos, A.P.; Morgan, M.E.; Garssen, J.; Georgiou, N.A.; Boon, L.; Kraneveld, A.D.; Folkerts, G. The combination of Bifidobacterium breve with non-digestible oligosaccharides suppresses airway inflammation in a murine model for chronic asthma. Biochim. Biophys. Acta 2014, 1842, 573–583. [Google Scholar] [CrossRef] [Green Version]
  19. Ege, M.J.; Mayer, M.; Schwaiger, K.; Mattes, J.; Pershagen, G.; van Hage, M.; Scheynius, A.; Bauer, J.; von Mutius, E. Environmental bacteria and childhood asthma. Allergy 2012, 67, 1565–1571. [Google Scholar] [CrossRef]
  20. Harata, G.; Kumar, H.; He, F.; Miyazawa, K.; Yoda, K.; Kawase, M.; Kubota, A.; Hiramatsu, M.; Rautava, S.; Salminen, S. Probiotics modulate gut microbiota and health status in Japanese cedar pollinosis patients during the pollen season. Eur. J. Nutr. 2017, 56, 2245–2253. [Google Scholar] [CrossRef]
  21. Fujieda, S.; Kurono, Y.; Okubo, K.; Ichimura, K.; Enomoto, T.; Kawauchi, H.; Masuyama, K.; Goto, M.; Suzaki, H.; Okamoto, Y.; et al. Examination, diagnosis and classification for Japanese allergic rhinitis: Japanese guideline. Auris Nasus Larynx 2012, 39, 553–556. [Google Scholar] [CrossRef] [PubMed]
  22. Watanabe, S.; Kameoka, S.; Shinozaki, N.O.; Kubo, R.; Nishida, A.; Kuriyama, M.; Takeda, A.K. A cross-sectional analysis from the Mykinso Cohort Study: Establishing reference ranges for Japanese gut microbial indices. Biosci. Microbiota Food Health 2021, 40, 123–134. [Google Scholar] [CrossRef] [PubMed]
  23. Kameoka, S.; Motooka, D.; Watanabe, S.; Kubo, R.; Jung, N.; Midorikawa, Y.; Shinozaki, N.O.; Sawai, Y.; Takeda, A.K.; Nakamura, S. Benchmark of 16S rRNA gene amplicon sequencing using Japanese gut microbiome data from the V1–V2 and V3–V4 primer sets. BMC Genom. 2021, 22, 527. [Google Scholar] [CrossRef] [PubMed]
  24. Bolyen, E.; Rideout, J.R.; Dillon, M.R.; Bokulich, N.A.; Abnet, C.C.; Al-Ghalith, G.A.; Alexander, H.; Alm, E.J.; Arumugam, M.; Asnicar, F.; et al. Reproducible, interactive, scalable and extensible microbiome data science using QIIME 2. Nat. Biotechnol. 2019, 37, 852–857. [Google Scholar] [CrossRef] [PubMed]
  25. Yoshida, N.; Watanabe, S.; Yamasaki, H.; Sakuma, H.; Takeda, A.K.; Yamashita, T.; Hirata, K.I. Average gut flora in healthy Japanese subjects stratified by age and body mass index. Biosci. Microbiota Food Health 2022, 41, 45–53. [Google Scholar] [CrossRef]
  26. Kuhn, M.; Wickham, H. Tidymodels: A Collection of Packages for Modeling and Machine Learning Using Tidyverse Principles. 2020. Available online: https://www.tidymodels.org (accessed on 12 September 2022).
  27. Marschner, I.C. glm2: Fitting generalized linear models with convergence problems. R J. 2011, 3, 12–15. [Google Scholar] [CrossRef] [Green Version]
  28. Zenil, H.; Uthamacumaran, A.; Saeb-Parsy, K. The immune system in health and disease: The need for personalised longitudinal monitoring. In Cancer, Complexity, Computation. Emergence, Complexity and Computation; Balaz, I., Adamatzky, A., Eds.; Springer: Cham, Switzerland, 2022; Volume 46, pp. 333–348. [Google Scholar]
  29. Muraro, A.; Lemanske, R.F., Jr.; Hellings, P.W.; Akdis, C.A.; Bieber, T.; Casale, T.B.; Jutel, M.; Ong, P.Y.; Poulsen, L.K.; Schmid-Grendelmeier, P.; et al. Precision medicine in patients with allergic diseases: Airway diseases and atopic dermatitis-PRACTALL document of the European Academy of Allergy and Clinical Immunology and the American Academy of Allergy, Asthma & Immunology. J. Allergy Clin. Immunol. 2016, 137, 1347–1358. [Google Scholar]
  30. Julia, V.; Macia, L.; Dombrowicz, D. The impact of diet on asthma and allergic diseases. Nat. Rev. Immunol. 2015, 15, 308–322. [Google Scholar] [CrossRef]
  31. Yang, Z.; Zheng, W.; Yung, E.; Zhong, N.; Wong, G.W.; Li, J. Frequency of food group consumption and risk of allergic disease and sensitization in schoolchildren in urban and rural China. Clin. Exp. Allergy 2015, 45, 1823–1832. [Google Scholar] [CrossRef]
  32. Mozaffarian, D. Foods, nutrients, and health: When will our policies catch up with nutrition science? Lancet Diabetes Endocrinol. 2017, 5, 85–88. [Google Scholar] [CrossRef]
  33. Fujimura, T.; Hori, A.; Torii, H.; Kishida, S.; Matsuura, Y.; Kawamoto, S. Intake of a fermented plant product attenuates allergic symptoms without changing systemic immune responses in a mouse model of Japanese cedar pollinosis. World Allergy Organ. J. 2018, 11, 31. [Google Scholar] [CrossRef] [PubMed]
  34. Nakamoto, M.; Omine, M.; Yun, Y.; Shuto, E.; Nakamoto, A.; Hata, A.; Aki, N.; Shikama, Y.; Bando, Y.; Ichihara, T.; et al. Associations of dietary diversity with allergic diseases in Japanese workers: A cross-sectional study. Asia Pac. J. Clin. Nutr. 2019, 28, 857–869. [Google Scholar] [PubMed]
  35. Wu, G.D.; Chen, J.; Hoffmann, C.; Bittinger, K.; Chen, Y.Y.; Keilbaugh, S.A.; Bewtra, M.; Knights, D.; Walters, W.A.; Knight, R.; et al. Linking long-term dietary patterns with gut microbial enterotypes. Science 2011, 334, 105–108. [Google Scholar] [CrossRef] [PubMed]
  36. De Filippis, F.; Pellegrini, N.; Vannini, L.; Jeffery, I.B.; La Storia, A.; Laghi, L.; Serrazanetti, D.I.; Di Cagno, R.; Ferrocino, I.; Lazzi, C.; et al. High-level adherence to a Mediterranean diet beneficially impacts the gut microbiota and associated metabolome. Gut 2016, 65, 1812–1821. [Google Scholar] [CrossRef]
  37. Christensen, L.; Roager, H.M.; Astrup, A.; Hjorth, M.F. Microbial enterotypes in personalized nutrition and obesity management. Am. J. Clin. Nutr. 2018, 108, 645–651. [Google Scholar] [CrossRef] [Green Version]
  38. Watts, A.M.; West, N.P.; Zhang, P.; Smith, P.K.; Cripps, A.W.; Cox, A.J. The gut microbiome of adults with allergic rhinitis is characterised by reduced diversity and an altered abundance of key microbial taxa compared to controls. Int. Arch. Allergy Immunol. 2021, 182, 94–105. [Google Scholar] [CrossRef]
  39. Melli, L.C.; do Carmo-Rodrigues, M.S.; Araújo-Filho, H.B.; Solé, D.; de Morais, M.B. Intestinal microbiota and allergic diseases: A systematic review. Allergol. Immunopathol. 2016, 44, 177–188. [Google Scholar] [CrossRef]
  40. Zhu, L.; Xu, F.; Wan, W.; Yu, B.; Tang, L.; Yang, Y.; Du, Y.; Chen, Z.; Xu, H. Gut microbial characteristics of adult patients with allergy rhinitis. Microb. Cell Fact. 2020, 19, 171. [Google Scholar] [CrossRef]
  41. Den Besten, G.; van Eunen, K.; Groen, A.K.; Venema, K.; Reijngoud, D.J.; Bakker, B.M. The role of short-chain fatty acids in the interplay between diet, gut microbiota, and host energy metabolism. J. Lipid Res. 2013, 54, 2325–2340. [Google Scholar] [CrossRef] [Green Version]
  42. Duncan, S.H.; Holtrop, G.; Lobley, G.E.; Calder, A.G.; Stewart, C.S.; Flint, H.J. Contribution of acetate to butyrate formation by human faecal bacteria. Br. J. Nutr. 2004, 91, 915–923. [Google Scholar] [CrossRef] [Green Version]
  43. Song, H.; Yoo, Y.; Hwang, J.; Na, Y.C.; Kim, H.S. Faecalibacterium prausnitzii subspecies-level dysbiosis in the human gut microbiome underlying atopic dermatitis. J. Allergy Clin. Immunol. 2016, 137, 852–860. [Google Scholar] [CrossRef] [PubMed] [Green Version]
  44. Kontula, P.; von Wright, A.; Mattila-Sandholm, T. Oat bran β-gluco- and xylo-oligosaccharides as fermentative substrates for lactic acid bacteria. Int. J. Food Microbiol. 1998, 45, 163–169. [Google Scholar] [CrossRef]
  45. Kubota, A.; He, F.; Kawase, M.; Harata, G.; Hiramatsu, M.; Iino, H. Diversity of intestinal Bifidobacteria in patients with Japanese cedar pollinosis and possible influence of probiotic intervention. Curr. Microbiol. 2011, 62, 71–77. [Google Scholar] [CrossRef]
  46. Sahoyama, Y.; Hamazato, F.; Shiozawa, M.; Nakagawa, T.; Suda, W.; Ogata, Y.; Hachiya, T.; Kawakami, E.; Hattori, M. Multiple nutritional and gut microbial factors associated with allergic rhinitis: The Hitachi Health Study. Sci. Rep. 2022, 12, 3359. [Google Scholar] [CrossRef] [PubMed]
  47. McKenzie, C.; Tan, J.; Macia, L.; Mackay, C.R. The nutrition-gut microbiome-physiology axis and allergic diseases. Immunol. Rev. 2017, 278, 277–295. [Google Scholar] [CrossRef]
  48. Chatzi, L.; Apostolaki, G.; Bibakis, I.; Skypala, I.; Bibaki-Liakou, V.; Tzanakis, N.; Kogevinas, M.; Cullinan, P. Protective effect of fruits, vegetables and the Mediterranean diet on asthma and allergies among children in Crete. Thorax 2007, 62, 677–683. [Google Scholar] [CrossRef] [Green Version]
  49. Chang, Y.S.; Trivedi, M.K.; Jha, A.; Lin, Y.F.; Dimaano, L.; García-Romero, M.T. Synbiotics for Prevention and Treatment of Atopic Dermatitis: A Meta-analysis of Randomized Clinical Trials. JAMA Pediatr. 2016, 170, 236–242. [Google Scholar] [CrossRef] [Green Version]
  50. Allen, S.J.; Jordan, S.; Storey, M.; Thornton, C.A.; Gravenor, M.B.; Garaiova, I.; Plummer, S.F.; Wang, D.; Morgan, G. Probiotics in the prevention of eczema: A randomised controlled trial. Arch. Dis. Child. 2014, 99, 1014–1019. [Google Scholar] [CrossRef] [Green Version]
  51. Abrahamsson, T.R.; Jakobsson, T.; Böttcher, M.F.; Fredrikson, M.; Jenmalm, M.C.; Björkstén, B.; Oldaeus, G. Probiotics in prevention of IgE-associated eczema: A double-blind, randomized, placebo-controlled trial. J. Allergy Clin. Immunol. 2007, 119, 1174–1180. [Google Scholar] [CrossRef]
  52. Nadeem, I.; Rahman, M.Z.; Ad-Dab’bagh, Y.; Akhtar, M. Effect of probiotic interventions on depressive symptoms: A narrative review evaluating systematic reviews. Psychiatry Clin. Neurosci. 2019, 73, 154–162. [Google Scholar] [CrossRef]
  53. Sestito, S.; D’Auria, E.; Baldassarre, M.E.; Salvatore, S.; Tallarico, V.; Stefanelli, E.; Tarsitano, F.; Concolino, D.; Pensabene, L. The Role of Prebiotics and Probiotics in Prevention of Allergic Diseases in Infants. Front. Pediatr. 2020, 8, 583946. [Google Scholar] [CrossRef] [PubMed]
  54. Mai, X.M.; Chen, Y.; Camargo, C.A., Jr.; Langhammer, A. Serum 25-hydroxyvitamin D levels and self-reported allergic rhinitis in Norwegian adults: The HUNT Study. Allergy 2014, 69, 488–493. [Google Scholar] [CrossRef] [PubMed] [Green Version]
  55. Yoshisue, H.; Ito, C.; Okano, M. Clinical characteristics, health care resource utilization, and prescription patterns of Japanese patients with physician-diagnosed allergic rhinitis: A secondary use of database study. Int. Arch. Allergy Immunol. 2022, 183, 953–966. [Google Scholar] [CrossRef] [PubMed]
Figure 1. Study design and selection of participants following CONSORT (Consolidated Standards of Reporting Trials) guidelines for clinical trials.
Applmicrobiol 02 00069 g001
Figure 2. Clustering of samples based on genus abundance profiles of individual participants. Principal component analysis (PCA) plots of baseline gut microbiota indicating the clustering of (a) enterotypes and (b) subenterotypes.
Applmicrobiol 02 00069 g002
Figure 3. Comparison of average PA severity score across three study phases. Repeated measure ANOVA tests were performed to compare the means of the severity score between the different time points [Baseline (q2020), Control (during q2021-1), and Treated (during intestinal activity program, q2021-2)]. *; statistical significance (p-value < 0.05), ns; not significance.
Applmicrobiol 02 00069 g003
Table 1. Characteristics of the participants in the normal (cotrol) and pollen allergy (PA) groups at baseline study.
Normal (Control) Group (n = 92)PA Group
(n = 190)
p-Value
Gender, n (%) 0.5
Female49 (53%)93 (49%)
Male43 (47%)97 (51%)
Age (years) 0.8
20–2917 (18%)44 (23%)
30–3925 (27%)48 (25%)
40–4924 (26%)49 (26%)
50–5926 (28%)49 (26%)
Pollen allergy severity (n, %) <0.001
0, none92 (100%)0 (0%)
1, mild0 (0%)0 (0%)
2, moderate0 (0%)32 (17%)
3, severe0 (0%)52 (27%)
4, very severe0 (0%)106 (56%)
The p-values were calculated using the chi-square test for each categorical explanatory variable and the group as the dependent variable.
Table 2. The distribution of enterotypes and subenterotypes among the participants in the control and PA groups.
Normal (Control) Group (n = 92)PA Group
(n = 190)
p-Value
Enterotypes [n (%)] 0.059
Enterotype BF21 (23%)51 (27%)
Enterotype BM21 (23%)31 (16%)
Enterotype PF22 (24%)25 (13%)
Enterotype PM4 (4.3%)9 (4.7%)
Enterotype R24 (26%)74 (39%)
Enterotype BF; Faecalibacterium enriched in enterotype B, enterotype BM; Megamonas and Fusobacterium enriched in enterotype B, enterotype PF; Faecalibacterium enriched in enterotype P, enterotype PM; Megamonas and Fusobacterium enriched in enterotype P. The p-values were calculated using the chi-square test for enterotypes as categorical explanatory variables and group as the dependent variable.
Table 3. Enterotype and their associations with PA severity score.
EnterotypesCoefficientCovariate Adjusted
p-Value
Enterotype BF--
Enterotype BM−0.1610.196
Enterotype PF−0.3940.005
Enterotype PM−0.0040.984
Enterotype R0.0480.629
Statistical significance was determined at a covariate-adjusted p-value of <0.05; sex and age were adjusted as covariates. -; the reference level.
Table 4. Demographic, lifestyle factors and their associations with PA severity score.
Demographic, Lifestyle FactorsCoefficientCovariate Adjusted
p-Value
Gender: Male0.1600.099
Age−0.0020.659
Three meals a day−0.0190.852
Poor sleep quality0.1950.046
No weekly intake of meat−1.3330.024
Daily intake of animal protein−0.0160.845
Daily intake of fermented plant−0.3200.006
Statistical significance was determined at a covariate-adjusted p-value of <0.05; sex and age were adjusted as covariates. Animal protein; the food group included egg, meat, and fish. Fermented plant; the food group included natto and pickles.
Table 5. Interactions between the enterotypes and lifestyle factors in relation to PA severity.
EnterotypesLifestyle FactorsCoefficientCovariate-Adjusted
p-Value
BFThree meals a day0.3740.092
BFNo weekly intake of natto0.3030.099
BMThree meals a day−0.3950.071
BMNo weekly intake of fish0.7920.015
PFFish daily intake0.8590.007
PFSeaweed daily intake0.9430.067
PMAnimal protein daily intake−1.1790.029
PMEggs daily intake−1.2860.018
RAnimal protein daily intake0.2710.098
RDairy products daily intake0.3570.053
RNo weekly intake of dairy products −0.4560.033
B, enterotype B (Bacteroides enriched); P, enterotype P (Prevotella enriched); R, enterotype R (Ruminococcus enriched); BF, Faecalibacterium enriched in enterotype B; BM, Megamonas, and Fusobacterium enriched in enterotype B; PF, Faecalibacterium enriched in enterotype P; PM, Megamonas, and Fusobacterium enriched in enterotype P. Statistical significance was determined at a covariate-adjusted p-value of <0.05; sex and age were adjusted as covariates.
Table 6. Interactions between the enterotypes and lifestyle factors in relation to PA incidence.
Interaction Factor
EnterotypesLifestyle FactorsCovariate-Adjusted
Odds Ratio
Covariate-Adjusted
p-Value
BFSleep quality poor3.36 [1.06–14.99]0.064
BMThree meals a day0.47 [0.19–1.15]0.101
PFThree meals a day0.38 [0.16–0.90]0.029
PFDairy products daily intake0.44 [0.15–1.28]0.126
PFFermented plant daily intake0.21 [0.05–0.72]0.015
PMAnimal protein daily intake0.15 [0.01–1.28]0.114
RAnimal protein daily intake2.59 [1.06–7.02]0.046
RFermented plant daily intake0.77 [0.30–2.03]0.584
RNo weekly intake of fermented plant 1.98 [0.91–4.48]0.091
B, enterotype B (Bacteroides enriched); P, enterotype P (Prevotella enriched); R, enterotype R (Ruminococcus enriched); BF, Faecalibacterium enriched in enterotype B; BM, Megamonas, and Fusobacterium enriched in enterotype B; PF, Faecalibacterium enriched in enterotype P; PM, Megamonas, and Fusobacterium enriched in enterotype P. Statistical significance was determined at a covariate-adjusted p-value of <0.05; sex and age were adjusted as covariates.
Table 7. Estimating the association between the intestinal activity program and PA severity score using the adjusted regression model.
EnterotypeTermsCoefficientCovariate-Adjusted p-Value
BFIntervention: sleep quality × year−0.42420.1024
BMIntervention: three meals a day × year−0.71770.0319
PFIntervention: dairy products daily intake × year−0.89580.0294
PMIntervention: animal protein daily intake × year−0.60000.2108
RIntervention: fermented plant daily intake × year−0.46370.0326
B, enterotype B (Bacteroides enriched); P, enterotype P (Prevotella enriched); R, enterotype R (Ruminococcus enriched); BF, Faecalibacterium enriched in enterotype B; BM, Megamonas, and Fusobacterium enriched in enterotype B; PF, Faecalibacterium enriched in enterotype P; PM, Megamonas, and Fusobacterium enriched in enterotype P. Statistical significance was determined at a covariate-adjusted p-value < 0.05; year was adjusted as a covariate.
Publisher’s Note: MDPI stays neutral with regard to jurisdictional claims in published maps and institutional affiliations.

