
Comparison of Fourteen Rapid Point-of-Care Antigen Tests for SARS-CoV-2: Use and Sensitivity
 , and
, and
Abstract
:1. Introduction
2. Material and Methods
- Panbio COVID-19 Ag rapid test device (Abbott, Wiesbaden, Germany).
- SIMPLE/STICK AG SARS-CoV-2 (COVID-19) (Operon, Zaragoza, Spain).
- PCL COVID-19 Ag Gold Saliva (PCL, Seoul, South Korea).
- SARS-CoV-2 Antigen Detection Kit (Assut Europe, Rome, Italy).
- CLINITEST Rapid COVID-19 Antigen Test (Siemens Healthineers, Erlangen, Germany).
- SARSCoV2 Rapid Antigen test (Roche, Mannheim, Germany).
- Test Rapido de Antigenos de SARS-CoV-2 (Oro coloidal) (Cahnos, Madrid, Spain).
- Test rápido de antígenos COVID-19 (hisopado nasofaríngeo) (Beright, Madrid, Spain).
- NADAL® COVID-19 antigen rapid test (nal von minden, Moers, Germany).
- Coronavirus (SARS-CoV-2) Rapid Tests Reagents (Tody Laboratories, Bucarest, Romania).
- CerTest SARS-CoV-2 Card Test (CerTest Biotec, Zaragoza, Spain).
- Test Rápido COVID-19 Ag (Lambra, Madrid, Spain).
- STANDARD F COVID-19 AG FIA (SD Biosensor, Suwon, South Korea).
- ESPLINE® SARS-CoV-2 (Fujirebio, Tokyo, Japan).
3. Results
4. Discussion
Author Contributions
Funding
Institutional Review Board Statement
Informed Consent Statement
Data Availability Statement
Conflicts of Interest
References
- WHO. Coronavirus disease (COVID-19) Situation Report. 11 March 2020. Available online: https://www.who.int/docs/default-source/coronaviruse/situation-reports/20200311-sitrep-51-covid-19.pdf?sfvrsn%201ba62e57810 (accessed on 15 July 2022).
- COVID-19 Situation Update Worldwide, as of Week 11, Updated 25 March 2021. Available online: https://www.ecdc.europa.eu/en/geographical-distribution-2019-ncov-cases (accessed on 15 July 2022).
- Tang, Y.W.; Schmitz, J.E.; Persing, D.H.; Stratton, C.W. Laboratory diagnosis of COVID-19: Current issues and challenges. J. Clin. Microbiol. 2020, 58, e00512–e00520. [Google Scholar] [CrossRef] [PubMed] [Green Version]
- Yamayoshi, S.; Sakai-Tagawa, Y.; Koga, M.; Akasaka, O.; Nakachi, I.; Koh, H.; Maeda, K.; Adachi, E.; Saito, M.; Nagai, H.; et al. Comparison of Rapid Antigen Tests for COVID-19. Viruses 2020, 12, 1420. [Google Scholar] [CrossRef] [PubMed]
- Toptan, T.; Eckerman, L.; Pfeiffer, A.E.; Hoehl, S.; Ciesek, S.; Drosten, C.; Corman, V.M. Evaluation of a SARS-CoV-2 rapid antigen test: Potential to help reduce community spread? J. Clin. Virol. 2021, 135, 104713. [Google Scholar] [CrossRef] [PubMed]
- Wang, W.; Xu, Y.; Gao, R.; Lu, R.; Han, K.; Wu, G.; Tan, W. Detection of SARS-CoV-2 in Different Types of Clinical Specimens. JAMA 2020, 323, 1843–1844. [Google Scholar] [CrossRef] [PubMed] [Green Version]
- Mohammadi, A.; Esmaeilzadeh, E.; Li, Y.; Bosch, R.J.; Li, J.Z. SARS-CoV-2 detection in different respiratory sites: A systematic review and meta-analysis. EBioMedicine 2020, 59, 102903. [Google Scholar] [CrossRef] [PubMed]
- Sethuraman, N.; Jeremiah, S.S.; Ryo, A. Interpreting Diagnostic Tests for SARS-CoV-2. JAMA 2020, 323, 2249–2251. [Google Scholar] [CrossRef] [PubMed]
- Kim, M.; Cui, C.; Shin, K.R.; Bae, J.Y.; Kweon, O.J.; Lee, M.K.; Choi, S.H.; Jung, S.Y.; Park, M.S.; Chung, J.W. Duration of Culturable SARS-CoV-2 in Hospitalized Patients with Covid-19. N. Engl. J. Med. 2021, 384, 671–673. [Google Scholar] [CrossRef] [PubMed]
- Walsh, K.A.; Jordan, K.; Clyne, B.; Rohde, D.; Drummond, L.; Byrne, P.; Ahern, S.; Carty, P.G.; O’Brien, K.K.; O’Murchu, E.; et al. SARS-CoV-2 detection, viral load and infectivity over the course of an infection. J. Infect. 2020, 81, 357–371. [Google Scholar] [CrossRef] [PubMed]
- CDC Primers and Probes. Available online: https://www.cdc.gov/coronavirus/2019-ncov/lab/rt-pcr-panel-primer-probes.html (accessed on 15 July 2022).
- Martín, G.; Rojo-Alba, S.; Castelló-Abietar, C.; Abreu-Salinas, F.; Costales, I.; Boga, J.A.; Melón, S.; Álvarez-Argüelles, M.E. Comparison of in-house SARS-CoV-2 genome extraction procedures. A need for COVID-19 pandemic. J. Virol. Methods 2021, 300, 114415. [Google Scholar] [CrossRef] [PubMed]
- Torrientes, M.S.; Abietar, C.C.; Riveiro, J.B.; Álvarez-Argüelles, M.E.; Rojo-Alba, S.; Salinas, F.A.; González, I.C.; Martínez, Z.P.; Rodríguez, G.M.; de Oña, J.G.; et al. A novel single nucleotide polymorphism assay for the detection of N501Y SARS-CoV-2 variants. J. Virol. Methods 2021, 294, 114143. [Google Scholar] [CrossRef] [PubMed]
- Corman, V.M.; Haage, V.C.; Bleicker, T.; Schmidt, M.L.; Mühlemann, B.; Zuchowski, M.; Jo, W.K.; Tscheak, P.; Möncke-Buchner, E.; Müller, M.A.; et al. Comparison of seven commercial SARS-CoV-2 rapid point-of-care antigen tests:a single-centre laboratory evaluation study. Lancet Microbe 2021, 2, e311–e319. [Google Scholar] [CrossRef]
- Bullard, J.; Dust, K.; Funk, D.; Strong, J.E.; Alexander, D.; Garnett, L.; Boodman, C.; Bello, A.; Hedley, A.; Schiffman, Z.; et al. Predicting Infectious Severe Acute Respiratory Syndrome Coronavirus 2 From Diagnostic Samples. Clin. Infect. Dis. 2020, 71, 2663–2666. [Google Scholar] [CrossRef] [PubMed]
- La Scola, B.; Le Bideau, M.; Andreani, J.; Hoang, V.T.; Grimaldier, C.; Colson, P.; Gautret, P.; Raoult, D. Viral RNA load as determined by cell culture as a management tool for discharge of SARS-CoV-2 patients from infectious disease wards. Eur. J. Clin. Microbiol. Infect. Dis. 2020, 39, 1059–1061. [Google Scholar] [CrossRef] [PubMed]
- Fenollar, F.; Bouam, A.; Ballouche, M.; Fuster, L.; Prudent, E.; Colson, P.; Tissot-Dupont, H.; Million, M.; Drancourt, M.; Raoult, D.; et al. Evaluation of the Panbio COVID-19 Rapid Antigen Detection Test Device for the Screening of Patients with COVID-19. J. Clin. Microbiol. 2021, 59. [Google Scholar] [CrossRef] [PubMed]
- Krüttgen, A.; Cornelissen, C.G.; Dreher, M.; Hornef, M.W.; Imöhl, M.; Kleines, M. Comparison of the SARS-CoV-2 Rapid antigen test to the real star Sars-CoV-2 RT PCR kit. J. Virol. Methods 2021, 288, 114024. [Google Scholar] [CrossRef] [PubMed]
- Albert, E.; Torres, I.; Bueno, F.; Huntley, D.; Molla, E.; Fernández-Fuentes, M.Á.; Martínez, M.; Poujois, S.; Forqué, L.; Valdivia, A.; et al. Field evaluation of a rapid antigen test (Panbio™ COVID-19 Ag Rapid Test Device) for COVID-19 diagnosis in primary healthcare centres. Clin. Microbiol. Infect. 2021, 27, 472.e7–472.e10. [Google Scholar] [CrossRef] [PubMed]


| Target | Design | Function | Name | Sequence (5′-3′) | Position |
|---|---|---|---|---|---|
| Forward primer | CoV-2-OVI-S | ATCAAGTTAATGGTTACCCTAACATGT | |||
| SARS-CoV-2 | In-house | Reverse primer | CoV-2-OVI-A | AACCTAGCTGTAAAGGTAAATTGGTACC | ORF1ab |
| MGB FAM probe | CoV-2-OVI-FAM | CCGCGAAGAAGCTA | |||
| Forward primer | 2019-nCoV_N1-F | GACCCCAAAATCAGCGAAAT | |||
| SARS-CoV-2 | CDC 1 | Reverse primer | 2019-nCoV_N1-R | TCTGGTTACTGCCAGTTGAATCTG | Gen N |
| MGB VIC probe | 2019-nCoV_N1-P-VIC | CCGCATTACGTTTGGT 2 | |||
| Forward primer | Beta-TR-S | ACACAACTGTGTTCACTAGC | |||
| β-globin | In-house | Reverse primer | Beta-TR-A | CCAACTTCATCCACGTTCACC | β-globin |
| MGB Cy5 probe | Beta-Cy5 | TGCATCTGACTCCTGAGGA |
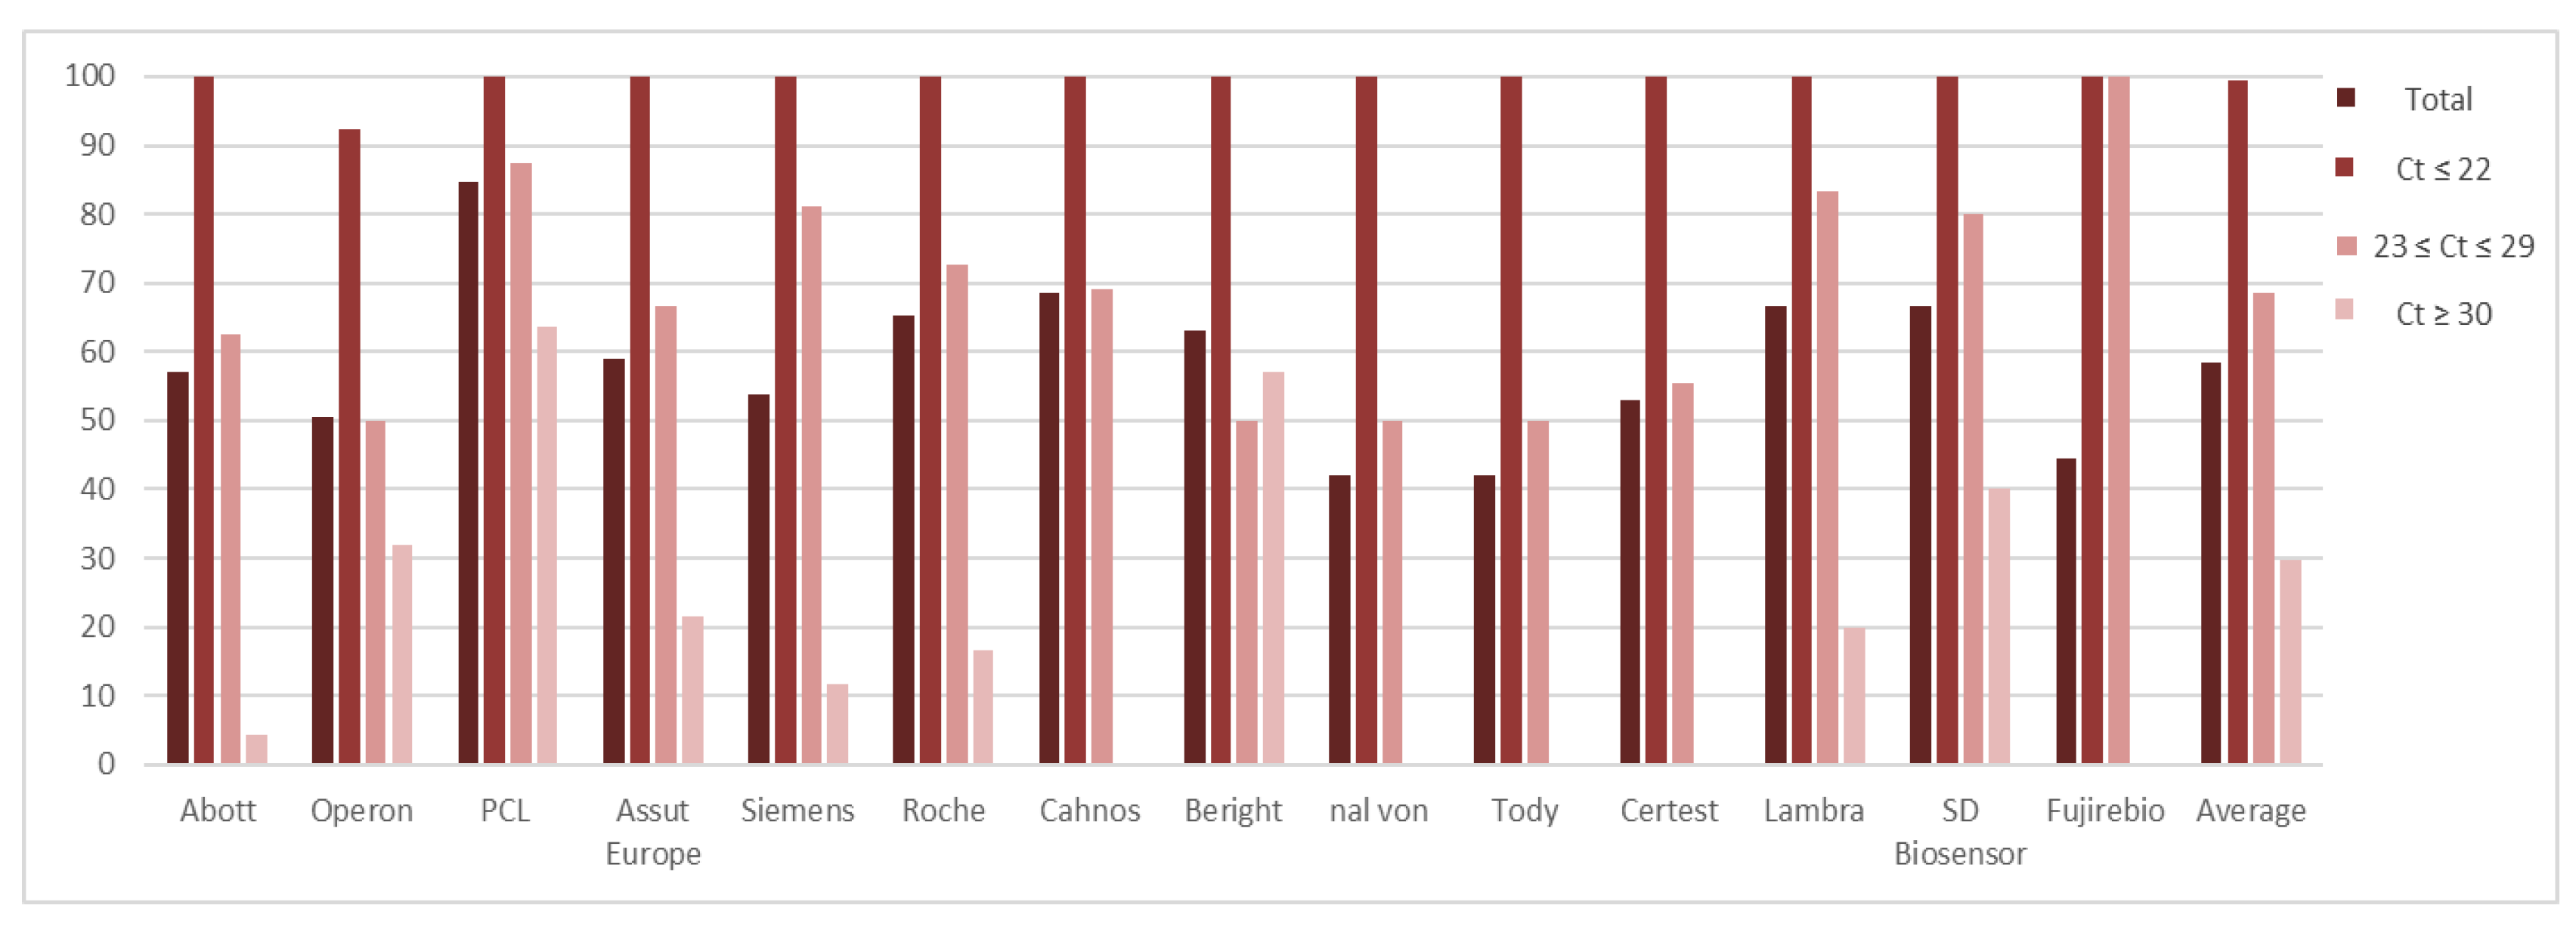
| Total | Ct ≤ 22 | 23 ≤ Ct ≤ 29 | Ct ≥ 30 | |||||||||||||
|---|---|---|---|---|---|---|---|---|---|---|---|---|---|---|---|---|
| Test | Samples | Sensitivity | ± σ | CI 95% | Samples | Sensitivity | ± σ | CI 95% | Samples | Sensitivity | ± σ | CI 95% | Samples | Sensitivity | ± σ | CI 95% |
| Abott | 84 | 48 (57.14%) | 23.28 ± 3.91 | (22.17–24.39) | 22 | 22 (100%) | 19.72 ± 1.42 | (19.13–20.31) | 40 | 25 (62.50%) | 25.92 ± 2.23 | (25.05–26.79) | 23 | 1 (4.35%) | 33 3 | - |
| Operon | 79 | 40 (50.63%) | 25.27 ± 4.64 | (23.83–26.71) | 13 | 12 (92.30%) | 20.00 ± 1.48 | (19.16–20.84) | 38 | 19 (50.00%) | 25.47 ± 1.87 | (24.63–26.31) | 28 | 9 (32.00%) | 31.84 ± 1.76 | (31.48–32.20) |
| PCL | 46 | 39 (84.78%) | 25.07 ± 4.06 | (23.80–26.34) | 11 | 11 (100%) | 20.82 ± 1.54 | (19.91–21.73) | 24 | 21 (87.50%) | 25.00 ± 1.67 | (24.28–25.72) | 11 | 7 (63.63%) | 32.00 ± 1.41 | (30.95–33.05) |
| Assut Europe | 39 | 23 (58.97%) | 23.78 ±4.67 | (21.87–25.69) | 10 | 10 (100%) | 19.60 ± 2.12 | (18.29–20.91) | 15 | 10 (66.67%) | 25.70 ± 2.41 | (24.21–27.19) | 14 | 3 (21.43%) | 31.33 ± 1.53 | (29.60–33.06) |
| Siemens | 39 | 21 (53.84%) | 25.00 ± 3.92 | (23.32–26.68) | 6 | 6 (100%) | 20.17 ± 1.72 | (18.79–21.55) | 16 | 13 (81.25%) | 26.23 ± 1.92 | (25.19–27.27) | 17 | 2 (11.76%) | 31.50 ± 2.12 | (28.86–34.14) |
| Roche | 23 | 15 (65.21%) | 23.00 ± 3.84 | (21.06–24.94) | 6 | 6 (100%) | 19.16 ± 2.04 | (17.53–20.79) | 11 | 8 (72.72%) | 25.00 ± 1.51 | (23.67–26.33) | 6 | 1 (16.67%) | 30 3 | - |
| Cahnos | 19 | 13 (68.42%) | 23.85 ± 2.12 | (22.70–25.00) | 4 | 4 (100%) | 21.50 ± 0.58 | (20.93–22.07) | 13 | 9 (69.23%) | 24.88 ± 1.62 | (23.82–25.94) | 2 | 0 (0%) | - | - |
| Beright | 19 | 12 (63.15%) | 25.00 ± 5.54 | (21.84–28.16) | 4 | 4 (100%) | 19.50 ± 2.38 | (17.17–21.83) | 8 | 4 (50.00%) | 24.25 ± 1.89 | (22.39–26.11) | 7 | 4 (57.14%) | 31.25 ± 1.50 | (29.78–32.72) |
| nal von | 19 | 8 (42.10%) | 21.12 ± 3.83 | (18.46–23.78) | 5 | 5 (100%) | 19.00 ± 2.92 | (16.44–21.56) | 6 | 3 (50.00%) | 24.67 ± 2.08 | (22.31–27.03) | 8 | 0 (0%) | - | - |
| Tody | 19 | 8 (42.10%) | 21.37 ± 4.31 | (18.39–24.35) | 5 | 5 (100%) | 19.00 ± 2.92 | (16.44–21.56) | 6 | 3 (50.00%) | 25.33 ± 3.21 | (22.29–28.37) | 8 | 0 (0%) | - | - |
| Certest | 17 | 9 (52.94%) | 23.67 ± 3.81 | (21.18–26.16) | 4 | 4 (100%) | 20.25 ± 2.22 | (18.08–22.42) | 9 | 5 (55.56%) | 26.40 ± 2.07 | (24.58–28.22) | 4 | 0 (0%) | - | - |
| Lambra | 15 | 10 (66.67%) | 23.80 ± 3.58 | (21.58–26.02) | 4 | 4 (100%) | 20.50 ± 1.91 | (18.62–22.38) | 6 | 5 (83.33%) | 25.20 ± 1.79 | (23.63–26.77) | 5 | 1 (20.00%) | 30 3 | - |
| SD Biosensor | 12 | 8 (66.67%) | 25.50 ± 3.89 | (22.80–28.20) | 2 | 2 (100%) | 21.00 ± 1.41 | (19.04–22.96) | 5 | 4 (80.00%) | 25.25 ± 2.06 | (23.23–27.27) | 5 | 2 (40.00%) | 30.50 ± 0.71 | (29.52–31.48) |
| Fujirebio | 9 | 4 (44.44%) | 23.75 ± 2.63 | (21.17–26.33) | 2 | 2 (100%) | 21.50 ± 0.71 | (20.52–22.48) | 2 | 2 (100%) | 26.00 ± 0.00 1 | - 2 | 5 | 0 (0%) | - | - |
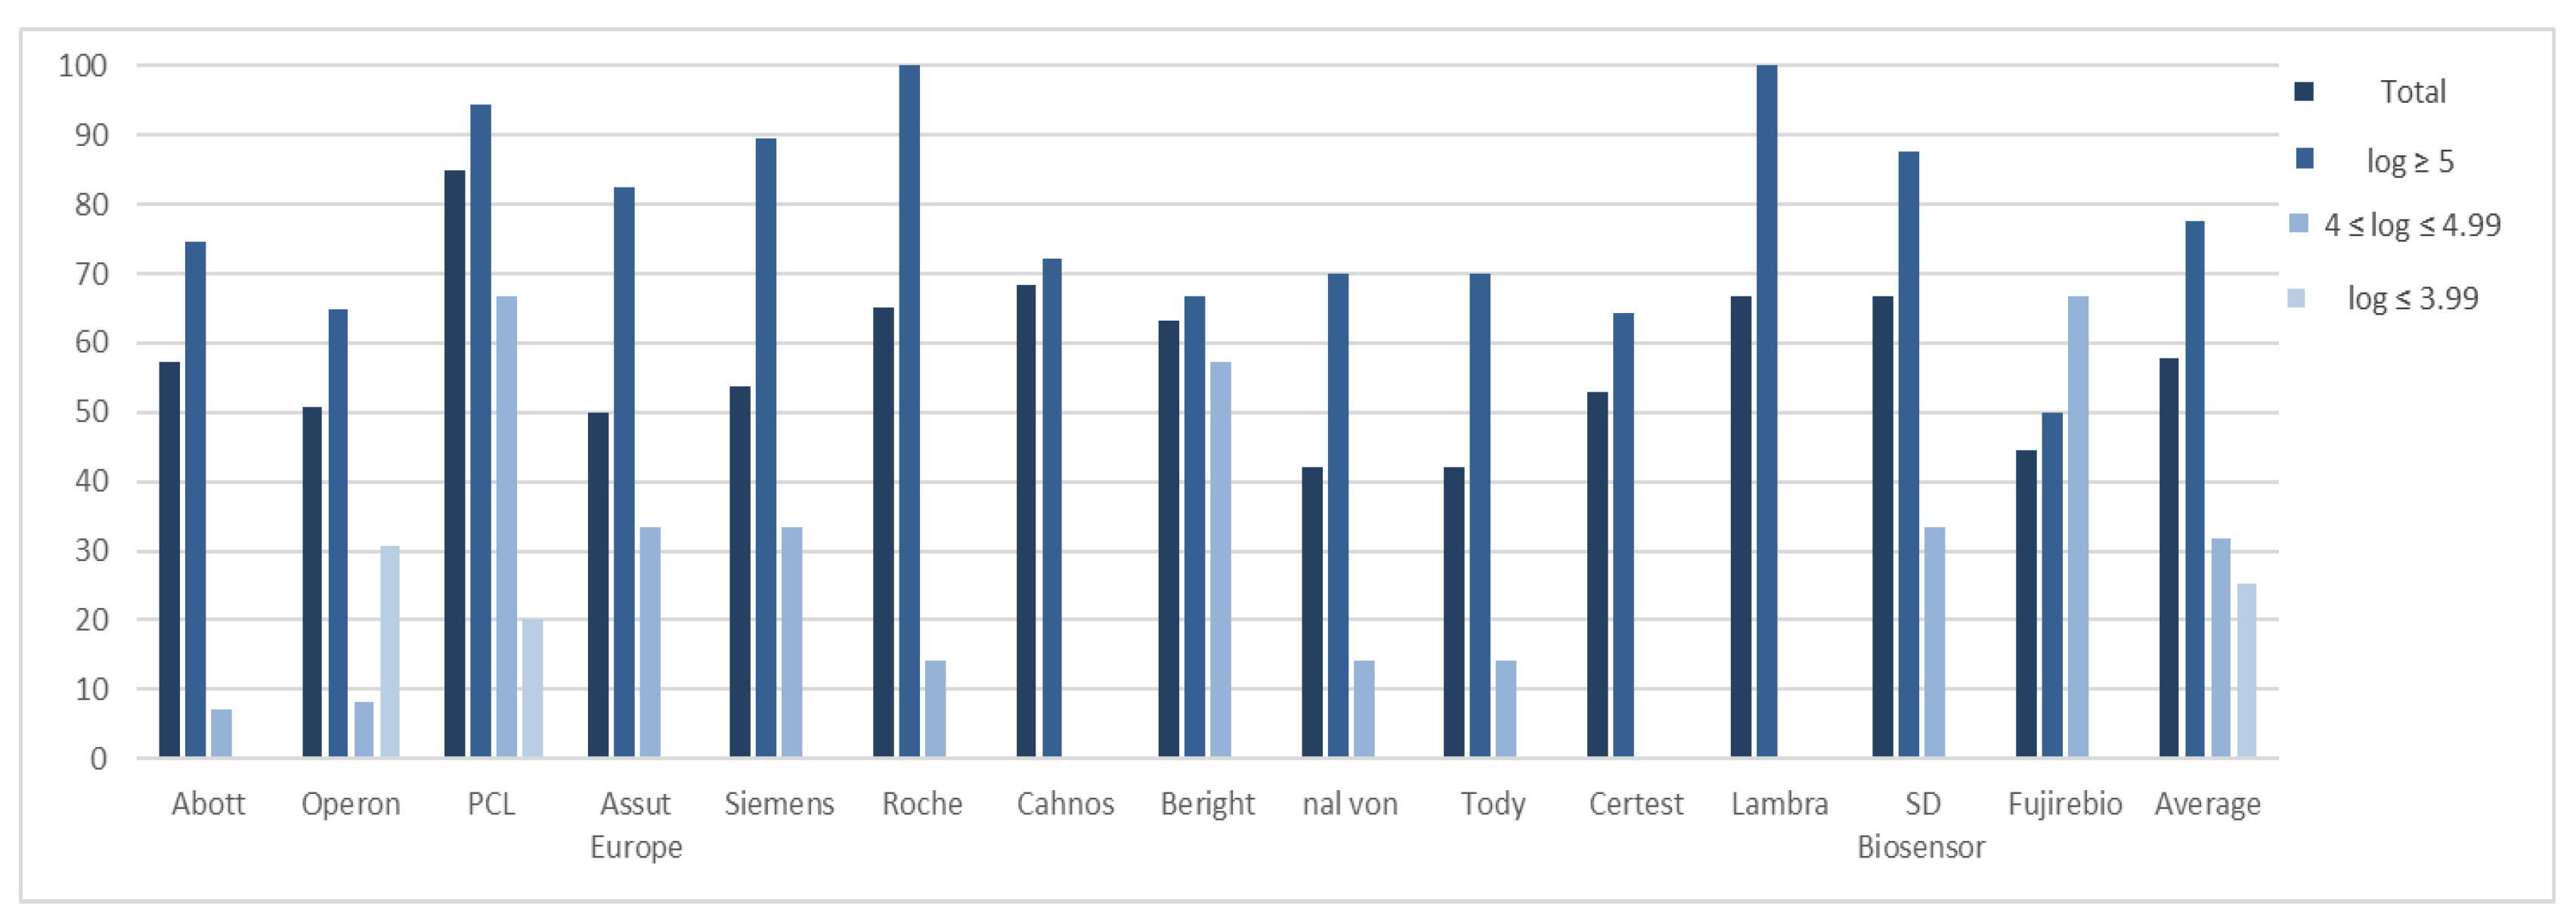
| Total | log ≥ 5 | 4 ≤ log ≤ 4.99 | log ≤ 3.99 | |||||||||||||
|---|---|---|---|---|---|---|---|---|---|---|---|---|---|---|---|---|
| Test | Samples | Sensitivity | ± σ | CI 95% | Samples | Sensitivity | ± σ | CI 95% | Samples | Sensitivity | ± σ | CI 95% | Samples | Sensitivity | ± σ | CI 95% |
| Abott | 84 | 48 (57.14%) | 6.47 ± 1.08 | (6.16–6.78) | 63 | 47 (74.60%) | 6.62 ± 1.04 | (6.32–6.92) | 14 | 1 (7.14%) | 4.77 1 | - | 8 | 0 (0%) | - | - |
| Operon | 79 | 40 (50.63%) | 6.72 ± 1.72 | (6.19–7.25) | 54 | 35 (64.81%) | 7.17 ± 1.30 | (6.64–7.70) | 12 | 1 (8.33%) | 4.76 1 | - | 13 | 4 (30.77%) | 3.32 ± 0.48 | (2.85–3.79) |
| PCL | 46 | 39 (84.78%) | 6.25 ± 1.36 | (5.82–6.68) | 35 | 33 (94.28%) | 6.62 ± 1.12 | (6.24–7.00) | 6 | 4 (66.67%) | 4.59 ± 0.33 | (4.27–4.91) | 5 | 2 (20.00%) | 3.51 ± 0.01 | (3.50–3.52) |
| Assut Europe | 39 | 23 (50.00%) | 6.47 ± 1.52 | (5.85–7.09) | 23 | 19 (82.60%) | 6.81 ± 1.44 | (6.16–7.46) | 12 | 4 (33.33%) | 4.82 ± 0.13 | (4.70–4.94) | 4 | 0 (0%) | - | - |
| Siemens | 39 | 21 (53.84%) | 6.13 ± 1.43 | (5.52–6.74) | 19 | 17 (89.47%) | 6.55 ± 1.27 | (5.95–7.15) | 12 | 4 (33.33%) | 4.37 ± 0.10 | (4.27–4.47) | 8 | 0 (0%) | - | - |
| Roche | 23 | 15 (65.21%) | 6.73 ± 1.26 | (6.09–7.37) | 15 | 14 (93.33%) | 6.88 ± 1.17 | (6.27–7.49) | 7 | 1 (14.28%) | 4.70 1 | - | 1 | 0 (0%) | - | - |
| Cahnos | 19 | 13 (68.42%) | 6.04 ± 0.51 | (5.76–6.32) | 18 | 13 (72.22%) | 6.04 ± 0.51 | (5.76–6.32) | 1 | 0 (0%) | - | - | 0 | - | - | - |
| Beright | 19 | 12 (63.15%) | 6.31 ± 1.42 | (5.51–7.11) | 12 | 8 (66.67%) | 7.16 ± 0.82 | (6.34–7.98) | 7 | 4 (57.14%) | 4.60 ± 0.22 | (4.38–4.82) | 0 | - | - | - |
| nal von | 19 | 8 (42.10%) | 6.61 ± 1.50 | (4.97–8.25) | 10 | 7 (70.00%) | 6.85 ± 1.45 | (5.77–7.93) | 7 | 1 (14.28%) | 4.98 1 | - | 2 | 0 (0%) | - | - |
| Tody | 19 | 8 (42.10%) | 6.82 ± 1.35 | (5.88–7.76) | 10 | 7 (70.00%) | 7.08 ± 1.22 | (6.18–7.98) | 7 | 1 (14.28%) | 4.98 1 | - | 2 | 0 (0%) | - | - |
| Certest | 17 | 9 (52.94%) | 6.11 ± 0.99 | (5.46–6.76) | 14 | 9 (64.28%) | 6.11 ± 0.99 | (5.46–6.76) | 2 | 0 (0%) | - | - | 1 | 0 (0%) | - | - |
| Lambra | 15 | 10 (66.67%) | 6.80 ± 1.22 | (6.11–7.49) | 10 | 10 (100%) | 6.80 ± 1.22 | (6.11–7.49) | 4 | 0 (0%) | - | - | 1 | 0 (0%) | - | - |
| SD Biosensor | 12 | 8 (66.67%) | 6.26 ± 1.15 | (5.46–7.06) | 8 | 7 (87.50%) | 6.57 ± 0.82 | (5.96–7.18) | 3 | 1 (33.33%) | 4.11 1 | - | 1 | 0 (0%) | - | - |
| Fujirebio | 9 | 4 (44.44%) | 6.02 ± 1.92 | (4.14–7.90) | 4 | 2 (50.00%) | 7.65 ± 0.57 | (6.86–8.44) | 3 | 2 (66.67%) | 4.39 ± 0.25 | (4.05–4.73) | 2 | 0 (0%) | - | - |
Publisher’s Note: MDPI stays neutral with regard to jurisdictional claims in published maps and institutional affiliations. |
© 2022 by the authors. Licensee MDPI, Basel, Switzerland. This article is an open access article distributed under the terms and conditions of the Creative Commons Attribution (CC BY) license (https://creativecommons.org/licenses/by/4.0/).
Share and Cite
Pérez-Martínez, Z.; Martín, G.; Sandoval, M.; Castelló-Abiétar, C.; Rojo-Alba, S.; Boga, J.A.; Melón, S.; Álvarez-Argüelles, M.E. Comparison of Fourteen Rapid Point-of-Care Antigen Tests for SARS-CoV-2: Use and Sensitivity. Appl. Microbiol. 2022, 2, 855-860. https://doi.org/10.3390/applmicrobiol2040065
Pérez-Martínez Z, Martín G, Sandoval M, Castelló-Abiétar C, Rojo-Alba S, Boga JA, Melón S, Álvarez-Argüelles ME. Comparison of Fourteen Rapid Point-of-Care Antigen Tests for SARS-CoV-2: Use and Sensitivity. Applied Microbiology. 2022; 2(4):855-860. https://doi.org/10.3390/applmicrobiol2040065
Chicago/Turabian StylePérez-Martínez, Zulema, Gabriel Martín, Marta Sandoval, Cristian Castelló-Abiétar, Susana Rojo-Alba, Jose Antonio Boga, Santiago Melón, and Marta Elena Álvarez-Argüelles. 2022. "Comparison of Fourteen Rapid Point-of-Care Antigen Tests for SARS-CoV-2: Use and Sensitivity" Applied Microbiology 2, no. 4: 855-860. https://doi.org/10.3390/applmicrobiol2040065