Article

Genetic Diversity Assessment of Winged Bean [Psophocarpus tetragonolobus (L.) DC.] Accessions Using Agronomic and Seed Morphometric Traits

1
International Institute of Tropical Agriculture, PMB 5320, Oyo Road, Ibadan 200001, Nigeria
2
Department of Plant Breeding and Seed Technology, Federal University of Agriculture, PMB 2240, Abeokuta 111101, Nigeria
*
Author to whom correspondence should be addressed.
Crops 2023, 3(2), 170-183; https://doi.org/10.3390/crops3020017
Submission received: 13 March 2023 / Revised: 9 May 2023 / Accepted: 19 May 2023 / Published: 7 June 2023

Abstract

:
Winged bean [Psophocarpus tetragonolobus (L.) DC.] is an underutilized legume with the potential to contribute to nutrition and food security globally, particularly in sub-Saharan Africa (SSA). However, more attention needs to be paid to exploiting its full potential due to a lack of adequate knowledge of the existing genetic diversity in the available winged bean germplasm. To bridge this gap, thirty accessions of winged beans sourced from the Gene Bank of the International Institute of Tropical Agriculture (IITA), Ibadan, were evaluated for seed morphometric and selected agro-morphological traits at three agro-ecological zones in Nigeria. The data obtained were subjected to analysis of variance (ANOVA), principal component (PC) analysis, cluster analysis, and correlation analysis. Significant differences (p < 0.05) were observed among the accessions for all measured traits. The first two PCs accounted for 88.2% of the variation observed among the accessions for all measured traits. Accessions were grouped into three clusters based on the agro-morphological traits and three clusters under the multi-spectral imaging (MSI) system. TPt-31 had the highest seed yield per plant, pod weight per plant, and early maturity, while TPt-7 had an extended flowering and maturity period, the highest number of pods per peduncle and pods per plant, as well as the lowest seed yield. These accessions could be a good resource for future winged bean improvement programs. The result also confirmed that the MSI system is an invaluable tool for discriminating among accessions of the same crop species. The findings of this study provide insight into the genetic diversity of winged bean germplasm, which could contribute to improving its yield and quality in SSA and globally.

1. Introduction

The winged bean (Psophocarpus tetragonolobus (L.) DC.) is a neglected and underutilized legume that thrives well in hot, humid, equatorial countries [1]. It belongs to the family Fabaceae. It is predominantly grown in Papua New Guinea, Malaysia, Thailand, Bangladesh, Indonesia, Ghana, and to a lesser extent, Nigeria [2]. It is nutritious, with an exceptionally high number of proteins, vitamins, and fatty oils that could play a significant role in the diet improvement of people in sub-Saharan Africa (SSA) countries [3]. It is a multipurpose legume grown for its edible seeds, vegetable, and root tuber. The dried tubers and mature seeds contain about 17–19% and 28–45% proteins, respectively, and a high oil content of about 14–20.4%, similar to soybean [4,5,6,7]. Winged bean flour has the potential to reduce dietary deficiency in children and adults of SSA when blended and prepared into different meals [4,8]. Due to the increasing global food demand, the winged bean is a prospective crop that, when cultivated and utilized, could enhance nutrition and food security, especially in the developing countries of SSA [2,9].
Despite the nutritional potentials of the winged bean, very little attention is paid to exploiting it due to its long maturation period, indeterminate growth habit, low seed yield, and the need for a stake to support the vigorously growing vines, as well as the presence of anti-nutritive factors, including chymotrypsin inhibitors, hemagglutinins, and trypsin inhibitors [5]. In addition, there is limited information about the genetic diversity among the available winged bean germplasm [10]. Understanding the genetic diversity of existing landraces from various geographical regions is critical for their conservation and, subsequently, their utilization in breeding efforts [2]. Information on genetic diversity is needed by plant breeders to develop effective approaches, as well as provide information on heterotic combinations in crop improvement programs [11]. Researchers have made several efforts to assess the genetic diversity of winged beans using agro-morphological traits [12,13,14,15]. For example, Yulianah et al. [12] assessed the genetic diversity of 21 Indonesian winged bean accessions based on morphological characters. They reported that phenotypic traits, including pod length, number of pods per plant, and total pod weight per plant, are useful in discriminating among the winged bean accessions. Similarly, Wong et al. [15] evaluated 24-winged bean accessions sourced from Nigeria, Malaysia, Bangladesh, Papua New Guinea, Indonesia, Sri Lanka, and Liberia based on their yield-related traits. Apart from agro-morphological traits, molecular tools have also been employed to assess the genetic diversity of winged bean accessions using molecular markers. Mohanty et al. [7] used Inter Simple Sequence Repeat (ISSR) and Random Amplified Polymorphic DNA (RAPD) markers to assess the genetic diversity of 24-winged bean accessions. In another study, Laosatit et al. [10] employed 14 simple sequence repeats (SSR) markers to assess the genetic diversity and the population structure in 457 accessions of winged beans collected from six geographical regions in Thailand. However, it is important to assess the genetic diversity of newly collected winged accessions and already existing accessions in the IITA-Gene bank.
The multi–Spectral Imaging (MSI) system is an integrated computer-aided image analysis system for assessing morphometry and distinguishing seed variation [16]. It measures a variety of seed morphometric features and provides a more accurate assessment of the seed features such as size, color, shape, and texture to discriminate among different accessions quantitatively [17]. Additionally, it replaces subjective and perception-based evaluation with a more accurate objective quantification in the analysis of seed morphometric variation [16,17]. Venora et al. [18] used an image analysis system for varietal identification of 15 Italian common bean landraces based on the seed size and color descriptors. Similarly, Kilic et al. [19] developed a computer vision system and artificial neural network based on seed size and color for the classification of 69 common bean samples. In addition, Geetha et al. [20] used a seed image analyzer to characterize the shape descriptors of nine mustard genotypes. They found most seed geometric features, including area, perimeter, circularity, and length, useful in discriminating the genotypes. However, the application and effectiveness of the MSI system in assessing the genetic diversity among winged bean accessions are yet to be reported. The MSI system offers to be an invaluable tool in the phenotypic characterization of winged bean accessions in the IITA-Gene bank. Hence, this study aimed to assess the genetic diversity of thirty-winged bean accessions using agro-morphological traits and seed morphometric traits derived from a MSI system.

2. Materials and Methods

2.1. Genetic Materials, Experimental Locations and Experimental Design

The genetic materials used in this study comprised thirty-winged bean accessions sourced from the available collections of landraces being conserved at the Genetic Resources Center of the International Institute of Tropical Agriculture, Ibadan, Oyo State, Nigeria (Table 1). This study was conducted at three locations in the Southwest region of Nigeria. The locations were the Federal Department of Agriculture (FDA), Ubiaja, Edo State, in the humid forest (latitude 6.66° N and longitude 6.39° E at an altitude of 221 m above sea level) in June 2020; Institute of Agricultural Research and Training (IAR&T) station, Ikenne, Ogun State in the high rainforest (latitude 6.86° N and longitude 6.33° E at an altitude of 144 m above sea level) in July 2020; and at IITA, Ibadan in the derived savanna (latitude 7.38° N and longitude 3.89° E at an altitude of 227 m above sea level) in August 2020. The experimental design was a randomized complete block design (RCBD) with three replications. The experimental unit consisted of a single-row plot of 14 m long with a spacing of 1 m between rows. The coat of the seeds was scarified mechanically using a surgical blade. The seeds were scarified to break their dormancy, allow for water absorption, seedling emergence, and obtain uniform germination. The scarified seeds were coated with mancozeb, a fungicide, to prevent the seeds from fungal attack before their seedlings emerged. One seed was sown per hole and 1 m apart on the ridges. The trials were evaluated under rainfed conditions with supplementary irrigation when required. Weeding was performed manually to obtain a clean field throughout the experiment. Staking was conducted three weeks after planting (WAP) at the inception of twining to support the plants due to their vigorous vining nature and to obtain optimum growth and yield. At 6 WAP, 5 g per pellet of Triple Super Phosphate (TSP) was applied to individual plants by side-dress method to provide additional nutrients. Other necessary management practices, such as regular weeding, twining, and insect-pest control, were carried out when necessary. Data on yield and other seed traits were collected on ten randomly selected plants per plot using the Bioversity revised descriptor list for the winged bean as a guide https://www.bioversityinternational.org/e-library/publications/detail/winged-bean-descriptors-revised/ (accessed on 14 May 2020).

Data Analyses

The agro-morphological data were subjected to Analysis of Variance (ANOVA) using the ‘lme4’ package in R (R Core Team, 2022) [21]. Phenotypic and genotypic correlation analyses of traits were carried out using the ‘variability’ package in R to determine the level of association among the traits measured [22]. The Principal component analysis was carried out and visualized using the ‘factoextra’ package in R to obtain information on the traits that mostly contributed to the overall variability observed among the accessions. Finally, clustering analysis was carried out using STAR v. 2.0.1 [23] to group accessions with similarity in their agro-morphological traits based on the ward minimum variance method [24].

2.2. Multi-Spectral Imaging Analysis

VideometerLab4TM (Videometer A/S, Herlev, Denmark) was used to capture images of ten seeds from each of the thirty-winged bean accessions with three replications. Feature information was extracted from the scanned images with the aid of the Videometer lab software version 3.14.9, as described by Galetti et al. [25]. Data on seed morphometric traits, including size and shape features such as seed length, width, seed area, seed perimeter, seed form factor, seed eccentricity, seed rectangularity, seed compactness, and seed hue, were captured. Other seed shapes parameters, such as seed circularity index and seed eccentricity index, were estimated from the measured features using methods from Cervantes et al. [26], Daniel et al. [27], and Adewale et al. [28] (Table 2). The means from the ten individual samples in the three replicates for each accession were computed for the eleven morphometric traits. Pearson’s correlation analysis was performed to determine the level of association among seed morphometric characters. Clustering was based on Ward minimum variance using seed morphometric data. Morphometric data were subjected to descriptive statistics.

3. Results

3.1. Analysis of Variance

The combined analysis of variance revealed significant differences (p < 0.05 and <0.01) among the accessions and environments for all the measured traits (Table 3). Coefficients of variation were low (<21%) for all measured traits except seed yield per plant (SYD) at 43.8%, pod weight per plant (PWT) at 42.4%, number of pods per peduncle (NPd) at 30.8% and number of pods per plant (NPP) at 39.3%.

3.2. Average Performance of the Accessions

The average performance among accessions (Table 4) for seed yield per plant (SYD) was highest in TPt-31 (99.76 g) and lowest in TPt-7 (16.72 g), with an average seed yield of 61.57 g. The weight of hundred seeds (HSW) ranged from 14.07 g in TPt-7 to 37.62 g in TPt-12, with an overall mean of 30.98 g. Days to 50% flowering (D50F) ranged from 69.67 days in TPt-126 to 102.00 days in TPt-7, with an average of 74.60 days. TPt-22 recorded maturity (DPM) earliest at 83.67 days, while TPt-7 recorded an extended maturity period of 140.78 days after sowing (DAS) with an average maturity period of 93.70 days. TPt-7 (5.33 cm) and TPt-153 (22.55 cm) had the shortest and longest pods (PL), respectively, with an average pod length of 19.53 cm. The lowest number of pods per plant (NPP) was recorded by TPt-33 (13.56) TPt-7 (48.0) recorded the highest number of pods per plant with an average of 25.63 pods. The number of seeds per pod (NSP) was lowest in TPt-7 (5.33) and highest in TPt-53 (14.56). The weight of pods per plant (PWT) varied from 47.09 g in TPt-7 to 197.50 g in TPt-31.

3.3. Correlation Analysis

The genotypic (rg) (Table 5) and phenotypic (rp) (Table 6) correlation between the agro-morphological traits studied revealed a positive significant phenotypic and genotypic correlation between SYD and HSW (rp = 0.45 **, rg = 0.52 **); SYD and PWT (rp = 0.95 **, rg = 0.99 **); SYD and NLP (rp = 0.68 **, rg = 0.76 **); SYD and NSP (rp = 0.69 **, rg = 0.76 **); SYD and PL (rp = 0.52 **, rg = 0.57 **); SYD and PW (rp = 0.41 **, rg = 0.45 **); SYD and SL (rp = 0.48 **, rg = 0.55 **); SYD and SW (rp = 0.45 **, rg = 0.49 **); and SYD and ST (rp = 0.47 **, rg = 0.52 **). However, the correlation between SYD with D50P, DFF, D50F, DPM, D50M and NPd was negative but significant. HSW had a significant positive phenotypic and genotypic relationship with the three seed metric traits; SL (rp = 0.91 **, rg = 0.99 **); SW (rp = 0.88 **, rg = 0.95 **); and ST (rp = 0.81 **, rg = 0.78 **). There was also a significant positive association observed between PWT and NLP (rp = 0.70 **, rg = 0.79 **) as well as NSP (rp = 0.71 **, rg = 0.81 **) at both phenotypic and genotypic levels. NPP had a significant positive phenotypic association with PWT (rp = 0.14 **); however, it recorded a negative and non-significant genotypic relationship (rg = −0.03). At both phenotypic and genotypic levels, the correlation between SYD and NPP was positive but non-significant (rp = 0.17, rg = 0.11). D50F was significant and positively correlated with D50M at (rp = 0.95 **, rg = 1.00 **). Significant but negative correlations were observed for D50F with SYD (rp = −0.58 **, rg = −0.62 **) at phenotypic and genotypic levels.

3.4. Principal Component Analysis (PCA)

The PCA based on agro-morphological traits revealed that the first three PCs accounted for 92.99% of the total observed variation among the accessions. The first and second PCs accounted for 88.17% of the total variances observed. The biplot revealed that D50P, DFF, D50F, DPM, D50M, NPd, and NPP had positive contributions to the first PC. The major contributing traits to the second PC were PL, PW, SL, SW, and ST while the contributions of SYD, PWT, NLP, NSP, D50P, DFF, D50F, DPM, D50M, NPd, and NPP were negative (Table 7, Figure 1).

3.5. Hierarchical Clustering of Winged Bean Accessions

Clustering based on the agro-morphological traits showed that the 30 accessions of winged beans were grouped into three major clusters (Figure 2). The first cluster consists of a singleton, TPt-7 was characterized by the longest duration to flowering and extended days to maturity. In addition, TPt-7 had the highest number of pods per peduncle and the number of pods per plant. Its pods and seeds were smaller than the other twenty-nine accessions, therefore, had the lowest seed yield. It is of an unknown origin. Group II consists of eight accessions (TPt-10, TPt-12, TPt-31, TPt-22, TPt-26, TPt-2, TPt-18, and TPt-48). These accessions were characterized by early flowering and, consequently, early maturity, a high number of pods per plant, high pod weight per plant, and seed yield per plant. Cluster III consisted of t21 accessions with mid-number days to flowering and long pods.
The clustering pattern from the mean of seed morphometric traits revealed three major clusters (Figure 3). The first cluster had a singleton (TPt-7), and it is the accession with the least seed length, seed width, seed perimeter and seed area, thereby making it have the smallest seed size. Seven accessions (TPt-12, TPt-22, TPt-6, TPt-10, TPt-153, TPt-2, and TPt-32) were grouped in the second cluster. The accessions in this group had bigger seed sizes. The third cluster comprised of twenty-two accessions (TPt-43, TPt-11, TPt-5, TPt-15, TPt-3, TPt-31, TPt-9, TPt-126, TPt-53, TPt-19, TPt-33, TPt-16, TPt-154, TPt-17, TPt-18, TPt-4, TPt-51, TPt-14, TPt-21, TPt-26, TPt-30, and TPt-48) with moderate seed size.

3.6. Correlation among Seed Morphometric Traits

The red colors indicate negative associations, while the blue colors indicate positive associations (Figure 4). A strong positive correlation was seen between seed length and seed area (0.99), seed width and seed area (0.98), and seed perimeter and seed area (0.99). The positive correlation observed between seed circularity index and seed area (0.50) was moderate; however, the relationship between seed form factor and seed area (0.38), and compactness and area (0.39) were positive but weak. A negative but strong correlation was observed between seed hue and seed area (−0.65), seed hue and seed width (−0.72), seed hue and seed length (−0.64), and seed perimeter and seed hue (−0.66). Seed rectangularity and seed area (−0.54) and seed eccentricity index and seed area (−0.42) were moderately correlated.

3.7. Descriptive Statistics of Seed Morphometric Traits from the Multi-Spectral Imaging System

The phenotypic values for seed morphometric traits indicated substantial phenotypic variation in the winged bean germplasm (Table 8). Averagely, TPt-10 had the highest seed length and seed width of 9.63 mm and 8.53 mm, respectively. TPt-7 recorded the least seed length and seed width of 6.18 mm and 5.18 mm, respectively. Seed size based on seed length, seed width, seed area, and seed perimeter was highest in TPt-10, TPt-12, TPt-22, and TPt-32 and least in TPt-7. On the contrary, the range of other seed shape characteristics among the accessions did not show a regular trend with other seed metrics. Seed eccentricity index, seed eccentricity, and seed rectangularity were highest in TPt-7 but least in TPt-126. TPt-7 had the highest value in the seed shape characteristics; however, it had the least value in seed compactness, while TPt-126 had the lowest value. The seed circularity index also showed a regular trend with the seed area, seed length, seed width, and seed perimeter as TPt-7 had the lowest value while TPt-154, TPt-126, TPt-31, TPt-14, and TPt-4 had the highest values.

4. Discussion

The significant variations observed among the accessions for seed yield per plant and all other agro-morphological traits revealed that adequate variation existed among the accessions. This implied that the accessions expressed variation for each trait, which could enable effective selection among the accessions. Additionally, the observed variation among the accessions could be used in possible combinations in crop improvement programs. Yulianah et al. and Wong et al. [12,15] reported similar findings in their study on winged bean accessions characterized based on their phenotypic traits. The observed significant mean squares for the environment for all traits suggest the distinctiveness of the environments in discriminating among the accessions. It, however, still suggests the need for more evaluation in different environments to ascertain the genotypic integrity of the accessions. The non-significant differences observed for the interaction between the accessions and the environments implied that the performance of the winged bean accessions was consistent across the study environments.
In this study, higher genotypic correlation coefficients were observed than phenotypic correlation. This denotes that genes largely influence trait expressions. The significant and positive phenotypic and genotypic correlation observed between seed yield per plant and hundred seed weight, pod weight per plant, number of locules per pod, and the number of seeds per pod implied that these traits could be substituted for seed yield during selection in crop improvement. In addition, the correlation recorded between these desirable traits implied that the improvement of one trait simultaneously improves the other trait [29,30]. These results agree with the findings of previous authors on the association between seed yield per plant and hundred seed weight in winged beans [29] and AYB [31]. In addition, seed yield per plant and pod weight per plant in AYB [31]; seed yield per plant and number of seeds per pod in common bean [32]; days to flowering and days to maturity in winged bean [29]. The positive phenotypic and genotypic significant correlations among the yield-related traits suggested that these traits could be considered for selection to improve seed yield in the winged bean. The non-significant correlation observed between the number of pods per plant and seed yield per plant indicates that the seed yield is independent of the number of pods produced by the plant.
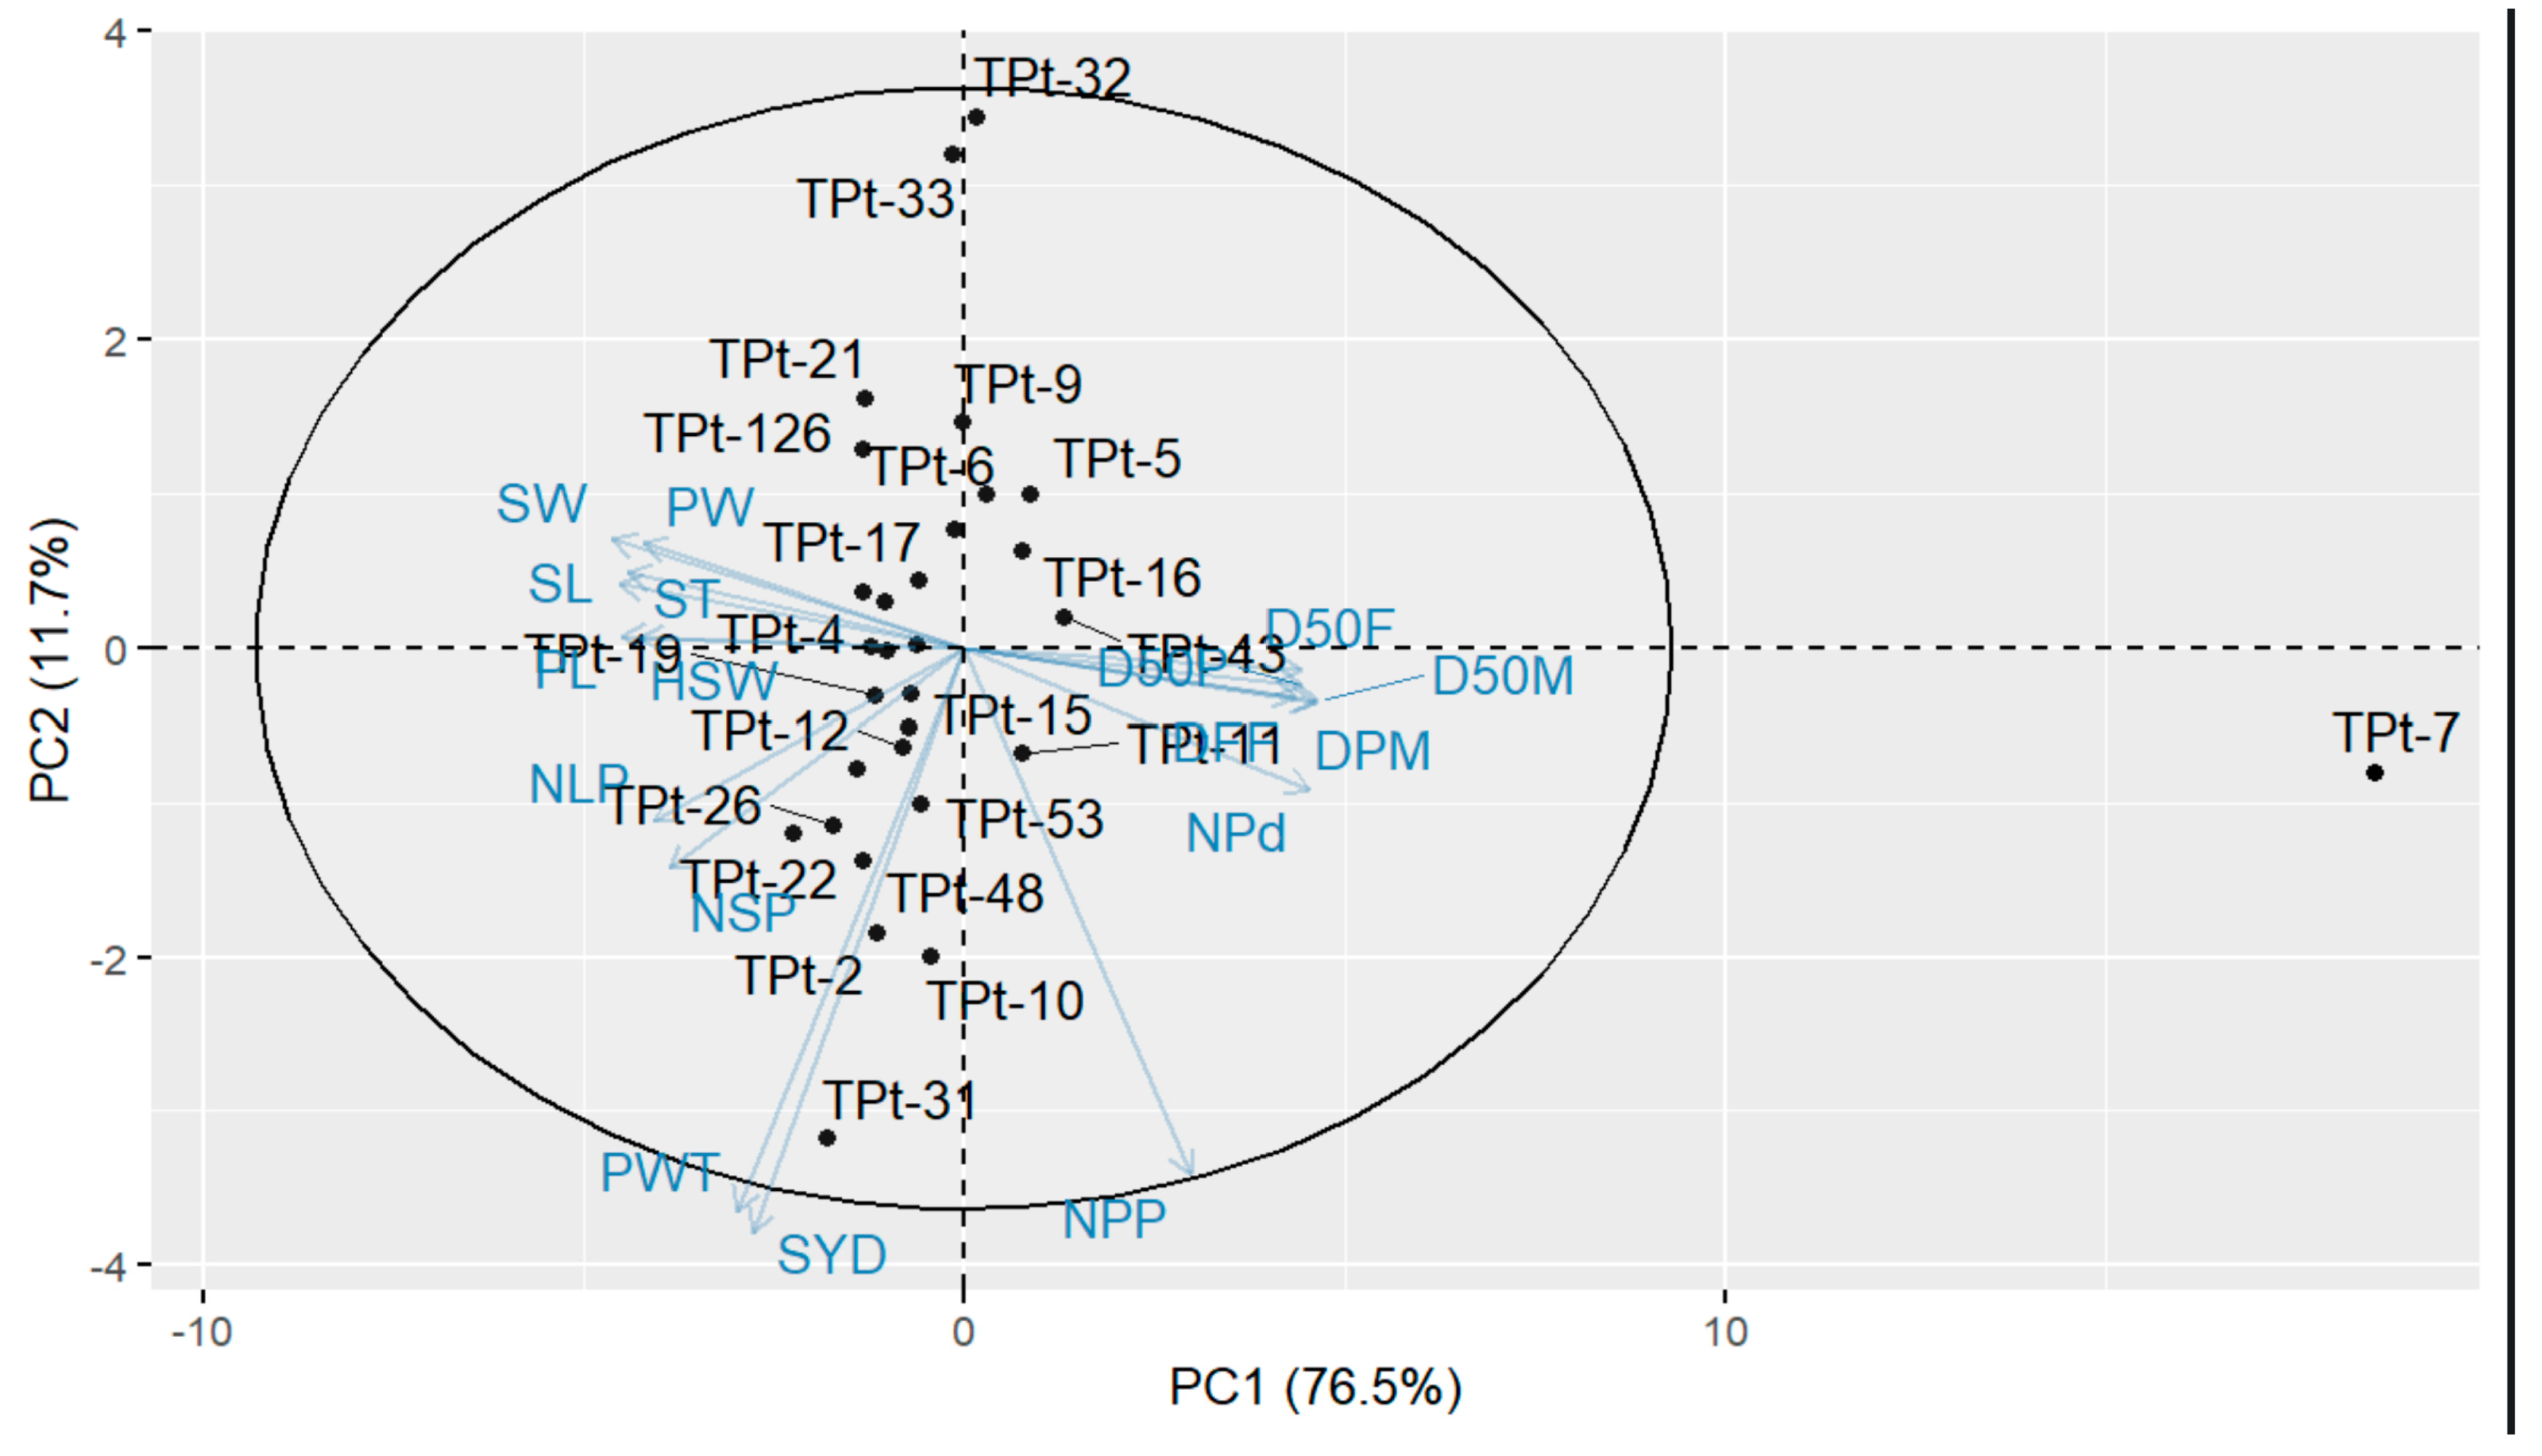
All the 17 agro-morphological traits measured were found to be relevant in discriminating the winged bean accessions based on the contribution of each of the measured traits to the most informative principal components. This implied that the traits with high coefficients in the three components could be used to select or characterize other winged bean collections [33]. Furthermore, these traits could be considered for genetic improvement in winged beans [31].
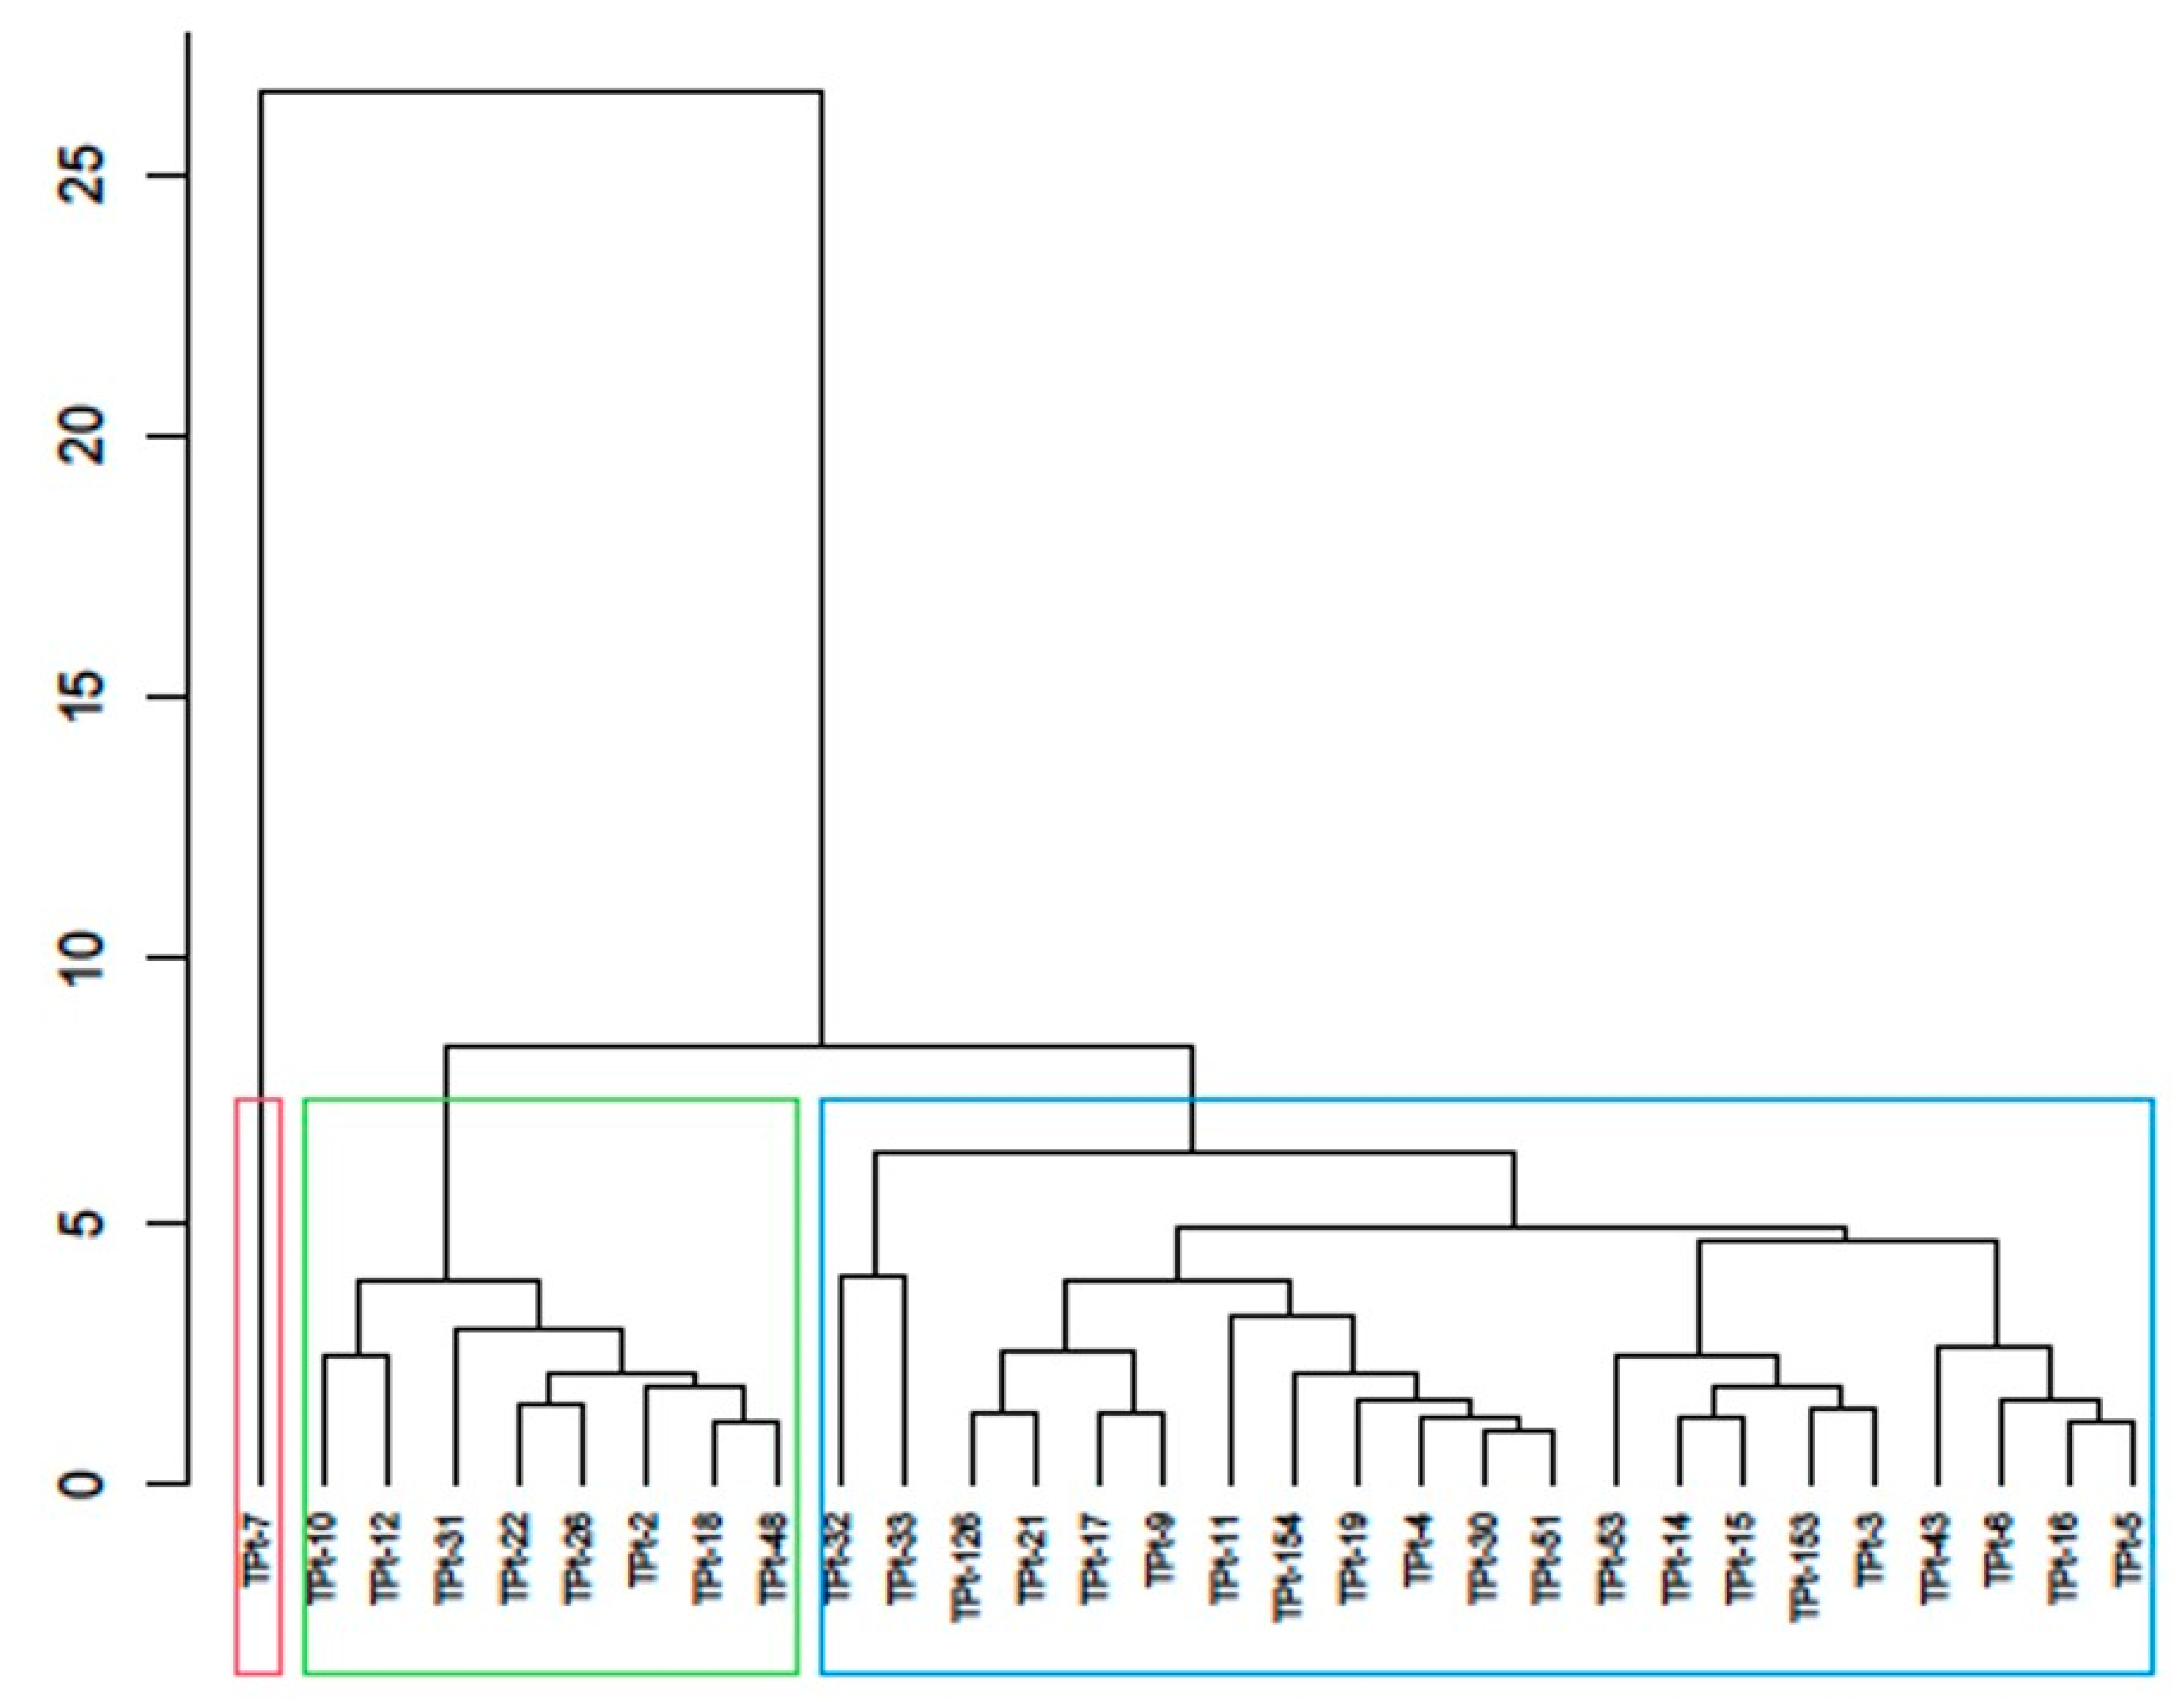
To assess the existing diversity among the winged bean accessions, the dendrogram generated from cluster analysis classified the 30 accessions into three distinct groups. The classification was based on their similarity for one or more agro-morphological traits studied, irrespective of their geographical origin. TPt-7 was placed in cluster I and characterized by the longest duration to flowering, longest days to maturity, the highest number of pods per peduncle, and the highest number of pods per plant. This implied that TPt-7 possesses unique characteristics that could be harnessed in crop improvement programs. Accessions in cluster II possess earliness to flowering and maturity, a high number of pods per plant, high pod weight, and high seed yield, while accessions in cluster III have early to mid-number of days to flowering with a high number of pods. This result suggests that accessions were grouped based on their distinct features and could be a reliable source for hybridization when improving for reduced days to flowering and high seed yield in the winged bean. This further suggests that heterosis could be exploited by selecting and hybridizing distinct accessions belonging to different groups [31,33].
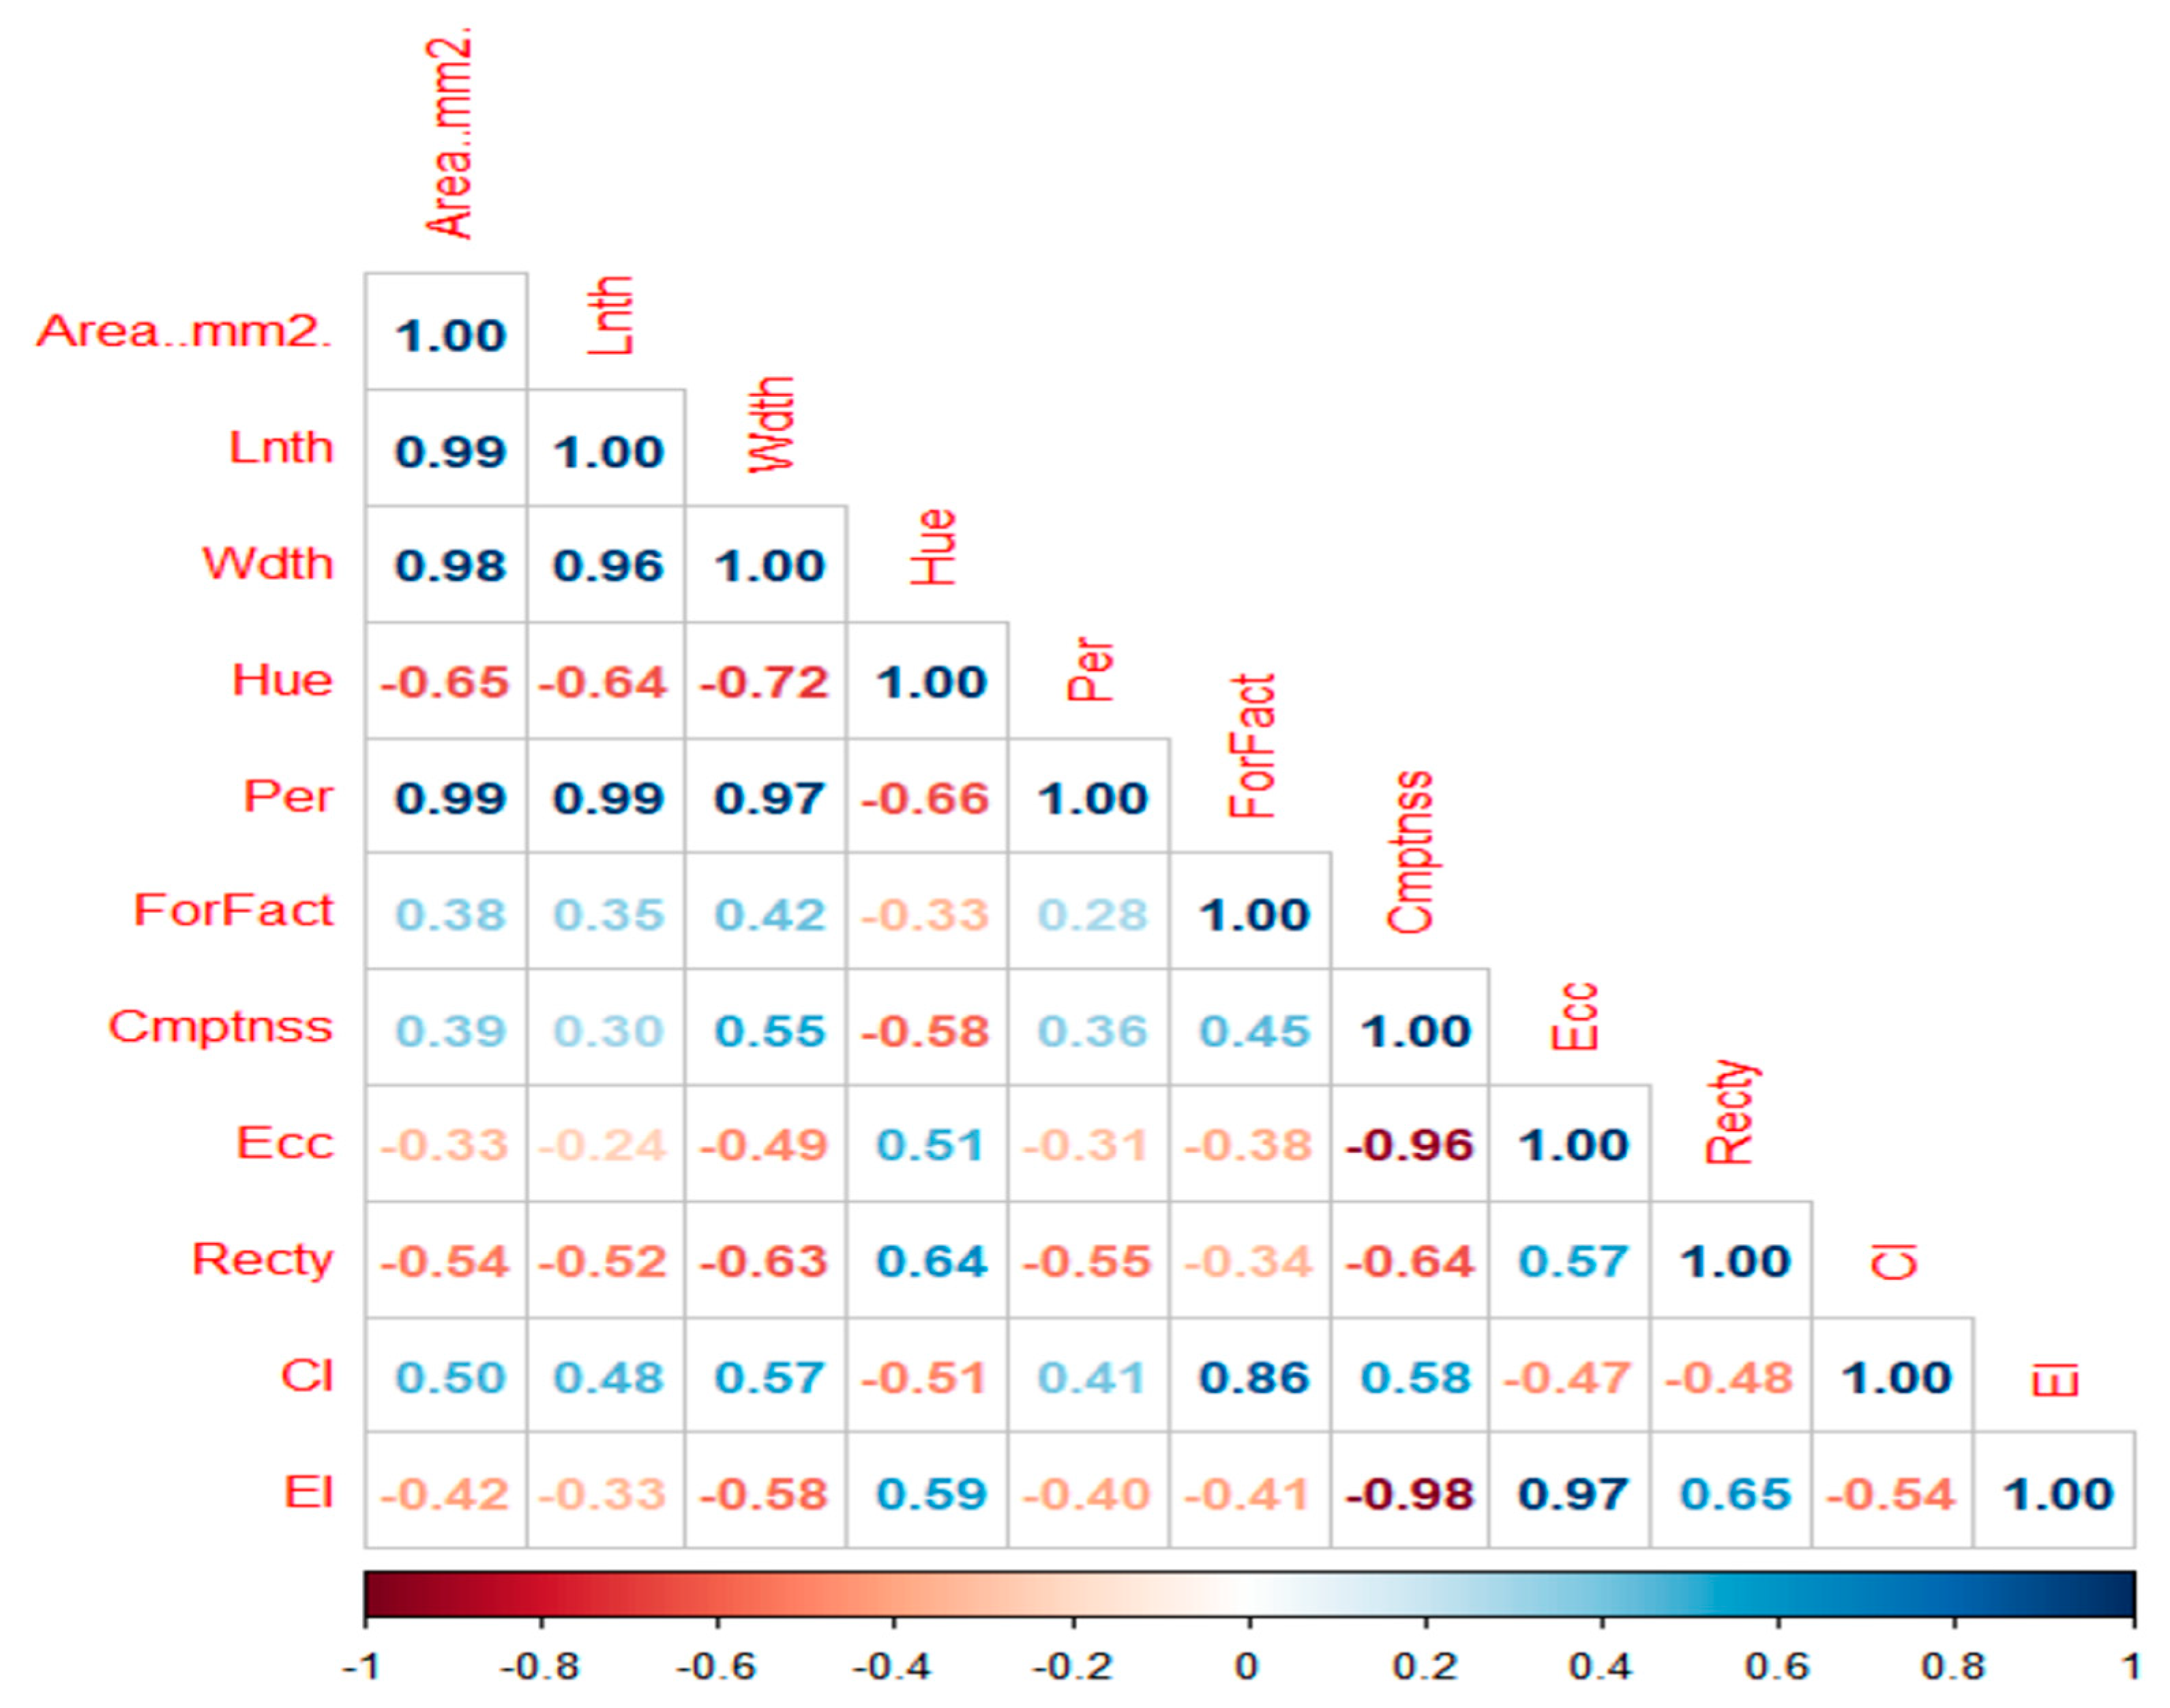
A positive correlation was observed between seed length and seed area; seed width and seed area; seed perimeter and seed area, implying that an increase in one trait simultaneously improves the other. On the other hand, a negative association was recorded between seed hue and seed area, seed eccentricity and seed area, seed rectangularity and seed area, and seed eccentricity index and seed area, which denotes that if one trait increases, the other trait decreases. This result agrees with Daniel et al. and Adewale et al. [27,28], who reported similar findings for AYB and maize seeds, respectively. Adewale et al. [28] recommended using six seed traits, including seed length and width, as unique parameters of AYB based on the wide variability between them and using the four seed shape indices, including eccentricity index, as a complement for seed shape description in AYB.
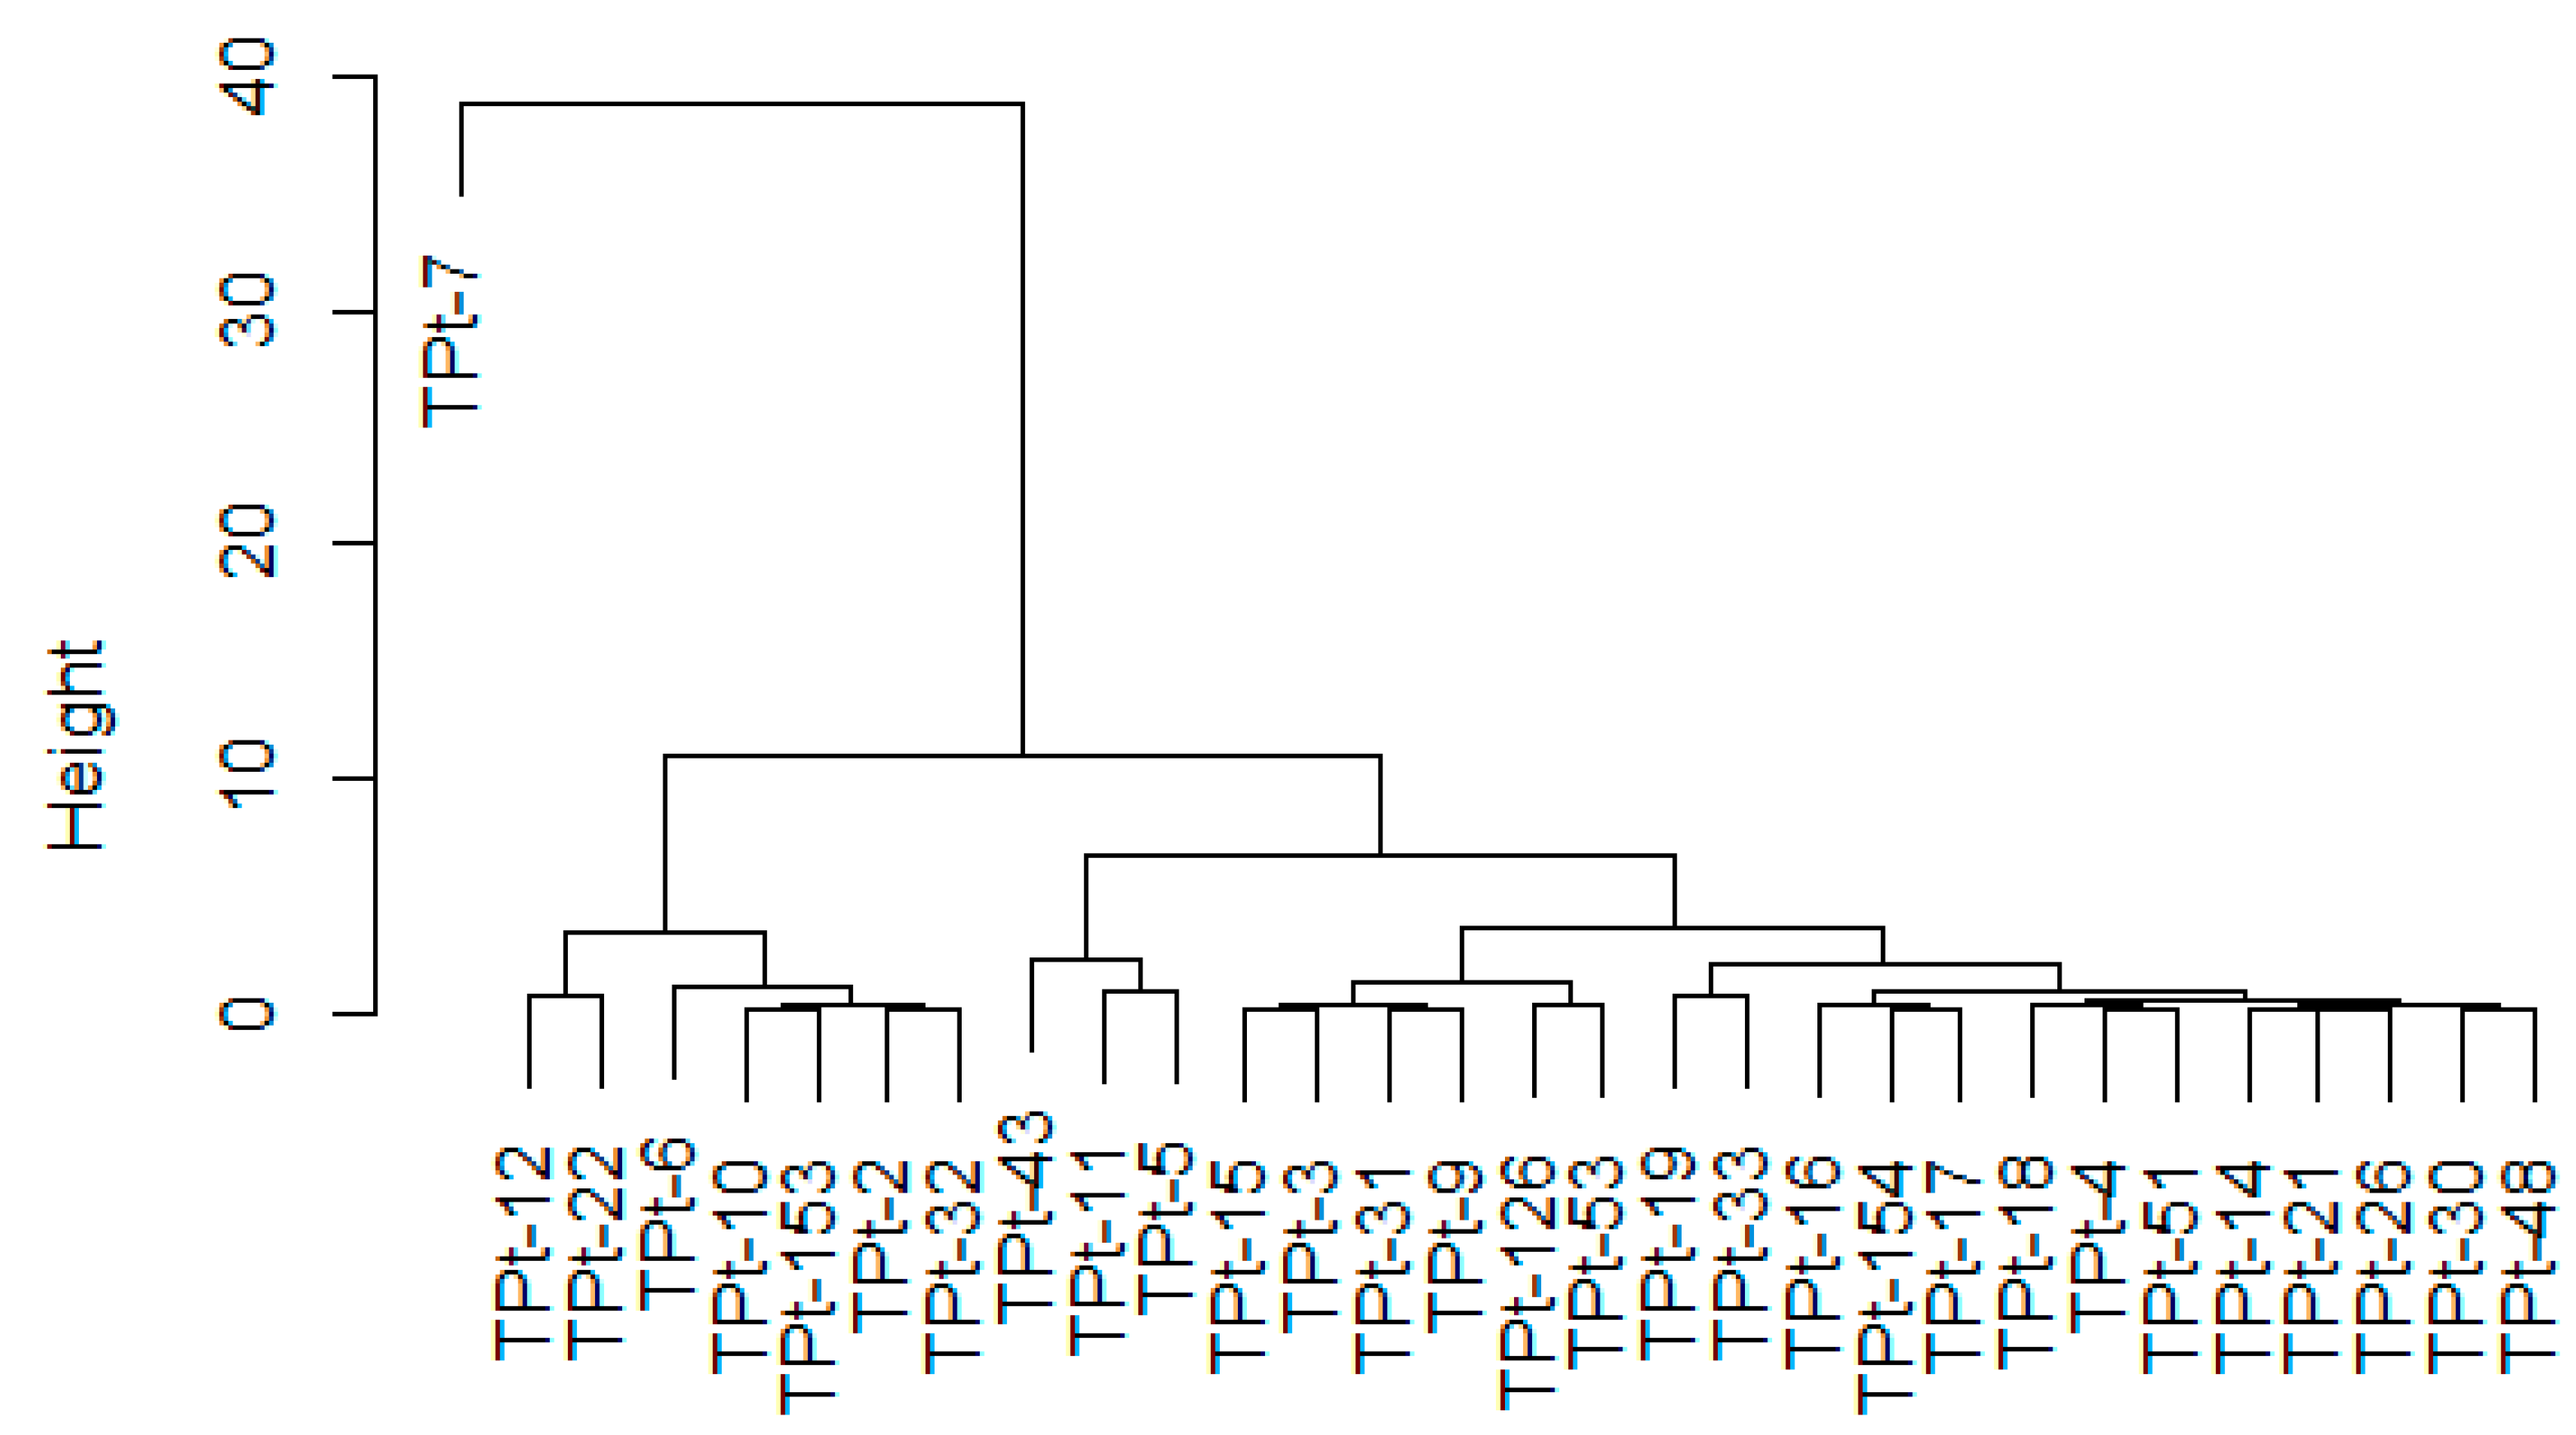
The dendrogram generated from the seed morphometry showed that the accessions clustered based on similarities between one or more seed morphometric traits. This implied that the classification formed a basis for grouping parental lines based on seed morphometric measurements. This constitutes background data for future evaluation of crosses involving these parents. The grouping pattern in the agro-morphological and seed morphometric clusters showed the solitary clustering of TPt-7due to its distinct features. This implied that TPt-7 might belong to the species scandens, as reported by Yang et al. [34]. They reported a successful hybridization between Psophocarpus tetragonolobus and Psophocarpus scandens. Accessions (TPt-10, TPt-12, TPt-22, TPt-2); (TPt-33, TPt-126, TPt-21, TPt-17, TPt-9, TPt-11, TPt-154, TPt-19, TPt-4, TPt-30, TPt-51, TPt-53, TPt-14, TPt-15, TPt-3, TPt-43, TPt-16, and TPt-5) were grouped in the same clusters in the two dendrograms generated from this study. This implied that the accessions were closely related, and the differences observed could be a result of environmental influence.

5. Conclusions

This study suggests the availability of ample genetic variation in the winged bean germplasm collection at GRC-IITA, Ibadan, Nigeria. The agro-morphological analysis clearly reflected the existence of genetic variation. The positive and significant associations recorded among agro-morphological traits indicated the possibility of simultaneous trait improvement. Accessions characterized by high seed yield per plant, high pod weight per plant, early flowering, and maturity days are potential sources of gene diversity for developing desirable varieties. TPt-31 was identified as the accession with the highest seed yield, early flowering time, and maturity period. In contrast, TPt-7 had the highest number of pods per peduncle and the number of pods per plant. Its pods and seed sizes were small, so it had the lowest seed yield per plant and lowest pod weight per plant with a long flowering duration and an extended maturity period. The MSI system is a fast and reliable method for characterizing winged bean accessions. The genetic diversity revealed in this study within the winged bean germplasm will serve as invaluable resources to facilitate winged bean breeding in the near future.

Author Contributions

Conceptualization, A.B., E.I. and O.O.; Data curation, A.B. and U.E.; Formal analysis, A.B. and U.E.; Funding acquisition, M.A.; Investigation, A.B.; Methodology, A.B.; Project administration, M.A.; Supervision, M.A., E.I., R.P. and O.O.; Writing—original draft, A.B.; Writing—review & editing, A.B., M.A., E.I., U.E., R.P. and O.O. All authors have read and agreed to the published version of the manuscript.

Funding

This research is funded by the Global Crop Diversity Trust and Consortium of International Agricultural Research Centers (CGIAR) through GRC-IITA.

Data Availability Statement

https://doi.org/10.25502/h26e-hn17/d (accessed on 12 March 2023).

Acknowledgments

The authors express their gratitude to seed bank staff at the GRC-IITA, Ibadan and the cassava breeding unit, IITA, Ubiaja, for their technical assistance.

Conflicts of Interest

The authors disclose that there are no conflict of interest. The funders had no role in the design of this study; in the collection, analyses, or interpretation of data; in the writing of the manuscript; or in the decision to publish the results.

References

  1. Ojuederie, O.B.; Nkang, N.A.; Odesola, K.A.; Igwe, D.O. Genetic diversity assessment of winged bean (Psophorcarpus tetragonolobus) accessions revealed by Inter-Simple Sequence Repeat (ISSR) markers. J. Plant Biol. Crop Res. 2020, 3, 1014. [Google Scholar]
  2. Sriwichai, S.; Monkham, T.; Sanitchon, J.; Jogloy, S.; Chankaew, S. Dual-Purpose of the Winged Bean (Psophocarpus tetragonolobus (L.) DC.), the Neglected Tropical Legume Based on Pod and Tuber Yields. Plants 2021, 10, 1746. [Google Scholar] [CrossRef] [PubMed]
  3. Tanzi, A.S.; Ho, W.K.; Massawe, F.; Mayes, S. Development and interaction between plant architecture and yield-related traits in winged bean (Psophocarpus tetragonolobus (L.) DC.). Euphytica 2019, 215, 36. Available online: https://rdcu.be/c4ca4 (accessed on 12 October 2022). [CrossRef]
  4. Bepary, R.H.; Roy, A.; Pathak, K.; Deka, S.C. Biochemical composition, bioactivity, processing, and food applications of winged bean (Psophocarpus tetragonolobus): A review. Legume Sci. 2023, e187. [Google Scholar] [CrossRef]
  5. Lepcha, P.; Egan, A.N.; Doyle, J.J.; Sathyanarayana, N. A review on current status and future prospects of winged bean (Psophocarpus tetragonolobus) in tropical agriculture. Plant Foods Hum. Nutr. 2017, 72, 225–235. [Google Scholar] [CrossRef]
  6. Mohtar, W.A.A.-Q.I.W.; Hamid, A.A.; Abd-Aziz, S.; Muhamad, S.K.S.; Saari, N. Preparation of bioactive peptides with high angiotensin converting enzyme inhibitory activity from winged bean [Psophocarpus tetragonolobus (L.) DC.] seed. J. Food Sci. Technol. 2014, 51, 3658–3668. [Google Scholar] [CrossRef] [PubMed] [Green Version]
  7. Mohanty, C.S.; Verma, S.; Singh, V.; Khan, S.; Gaur, P.; Gupta, P.; Niranjan, A.; Rana, T.S. Characterization of winged bean (Psophocarpus tetragonolobus (L.) DC.) based on molecular, chemical and physiological parameters. Am. J. Mol. Biol. 2013, 3, 187. [Google Scholar] [CrossRef] [Green Version]
  8. Amoo, I.A.; Adebayo, O.T.; Oyeleye, A.O. Chemical evaluation of Winged beans (Psophocarpus tetragonolobus), Pitanga cherries (Eugenia uniflora) and Orchid fruit (Orchid fruit myristica). Afr. J. Food Agric. Nutr. Dev. 2006, 6, 1–12. [Google Scholar] [CrossRef] [Green Version]
  9. Makeri, M.; Sahri, M.M.; Ghazali, H.M.; Ahmad, K.; Muhammad, K. Polymorphism, textural and crystallization properties of winged bean (Psophocarpus tetragonolobus, DC) oil-based trans-fatty acids free ternary margarine blends. LWT 2019, 100, 158–166. [Google Scholar] [CrossRef]
  10. Laosatit, K.; Amkul, K.; Chankaew, S.; Somta, P. Molecular Genetic Diversity of Winged Bean Gene Pool in Thailand Assessed by SSR Markers. Hortic. Plant J. 2022, 10, 9–10. [Google Scholar] [CrossRef]
  11. Laido, G.; Mangini, G.; Taranto, F.; Gadaleta, A.; Blanco, A.; Cattivelli, L.; Marone, D.; Mastrangelo, A.M.; Papa, R.; De Vita, P. Genetic Diversity and Population Structure of Tetraploid Wheats (Triticum turgidum L.) estimated by SSR, DArT and pedigree Data. PLoS ONE 2013, 8, e67280. [Google Scholar] [CrossRef] [Green Version]
  12. Yulianah, I.; Waluyo, B.; Ashari, S.; Kuswanto. Variation in morphological traits of a selection of Indonesian winged bean accessions (Psophocarpus tetragonolobus) and its analysis to assess genetic diversity among accessions. Biodiversitas 2020, 21, 2991–3000. [Google Scholar] [CrossRef]
  13. Akeem, L.B.; Azeez, M.A.; Godfrey, E.; Akintunde, R.I.; Omogoye, A.M.; Kayode, A.E. Screening Winged Bean (Psophocarpus tetragonolobus (L.) DC.) Accessions Using Agronomic Characters. Asian J. Soil Sci. Plant Nutri. 2019, 4, 1–10. [Google Scholar] [CrossRef]
  14. Kant, A.; Nandan, R. Performance and variability evaluation in some genotypes of winged bean [Psophocarpus tetragonolobus (L.) DC.]. Int. J. Curr. Microbiol. App. Sci. 2018, 7, 2104–2108. [Google Scholar] [CrossRef]
  15. Wong, Q.N.; Massawe, F.; Mayes, S. Improving winged bean (Psophocarpus tetragonolobus) productivity: An analysis of the determinants of productivity. Acta Hortic. 2014, 1102, 83–88. [Google Scholar] [CrossRef]
  16. Hansen, M.A.E.; Hay, F.R.; Carstensen, J.M. A virtual seed file: The use of multispectral image analysis in the management of genebank seed accessions. Plant Genet. Resour. 2016, 14, 238–241. [Google Scholar] [CrossRef] [Green Version]
  17. Bianco, M.L.; Grillo, O.; Cremonini, R.; Sarigu, M.; Venora, V. Characterisation of Italian bean landraces (‘Phaseolus vulgaris’ L.) using seed image analysis and texture descriptors. Aust. J. Crop Sci. 2015, 9, 1022. Available online: http://www.cropj.com/search.html?q=Characterisation%20of%20Italian%20bean%20landraces%20(%E2%80%98Phaseolus%20vulgaris%E2%80%99%20L.)%20using%20seed%20image%20analysis%20and%20texture%20descriptors (accessed on 27 October 2022).
  18. Venora, G.; Grillo, O.; Ravalli, C.; Cremonini, R. Identification of Italian landraces of bean (Phaseolus vulgaris L.) using an image analysis system. Sci. Hortic. 2009, 121, 410–418. [Google Scholar] [CrossRef]
  19. Kılıç, K.; Boyacı, I.H.; Köksel, H.; Küsmenoğlu, I. A classification system for beans using computer vision system and artificial neural networks. J. Food Eng. 2007, 78, 897–904. [Google Scholar] [CrossRef]
  20. Geetha, V.V.; Balamurugan, P.; Bhaskaran, M. Characterization of mustard genotypes through image analysis. Res. J. Seed Sci. 2011, 4, 192–198. Available online: https://scialert.net/abstract/?doi=rjss.2011.192.198 (accessed on 27 October 2022). [CrossRef] [Green Version]
  21. Bates, D.; Mächler, M.; Bolker, B.; Walker, S. Fitting linear mixed-effects models using lme4. J. Stat. Softw. 2015, 67, 1–48. [Google Scholar] [CrossRef]
  22. Raj, P.; Rumit, P.; Dinesh, P. Variability: Genetic Variability Analysis for Plant Breeding Research. R Package Version 0.1.0. 2020. Available online: https://cran.r-project.org/package=variability (accessed on 25 August 2022).
  23. International Rice Research Institute (IRRI). Statistical Tool for Agricultural Research (STAR) v. 2.0.1. 2014. Available online: http://bbi.irri.org (accessed on 25 August 2022).
  24. Ward, J.H., Jr. Hierarchical grouping to optimize an objective function. J. Am. Stat. Assoc. 1963, 58, 236–244. [Google Scholar] [CrossRef]
  25. Galletti, P.A.; Carvalho, M.E.; Hirai, W.Y.; Brancaglioni, V.A.; Arthur, V.; Barboza da Silva, C. Integrating optical imaging tools for rapid and non-invasive characterization of seed quality: Tomato (Solanum lycopersicum L.) and carrot (Daucus carota L.) as study cases. Front. Plant Sci. 2020, 11, 577851. [Google Scholar] [CrossRef]
  26. Cervantes, E.; Martín, J.; Saadaoui, E. Updated methods for seed shape analysis. Scientifica 2016, 2016, 5691825. [Google Scholar] [CrossRef] [PubMed] [Green Version]
  27. Daniel, I.O.; Adeboye, K.A.; Oduwaye, O.O.; Porbeni, J. Digital seed morpho-metric characterization of tropical maize. Int. J. Plant Breed. 2012, 6, 245–251. [Google Scholar] [CrossRef] [Green Version]
  28. Adewale, B.D.; Kehinde, O.B.; Aremu, C.O.; Popoola, J.O.; Dumet, D.J. Seed metrics for genetic and shape determinations in African yam bean [Fabaceae] (Sphenostylis stenocarpa Hochst. Ex. A. Rich.) harms. Afri. J. Plant Sci. 2010, 4, 107–115. Available online: https://www.researchgate.net/publication/266184996_Seed_metrics_for_genetic_and_shape_determinations_in_African_yam_bean_Fabaceae_Sphenostylis_stenocarpa_Hochst_Ex_A_Rich_harms (accessed on 28 October 2022).
  29. Yadav, R.K. Co-heritability and correlation of yield and associated characters in winged bean (Psophocarpus tetragonolobus L. DC.). JFL 2021, 34, 225–227. [Google Scholar]
  30. Alake, C.O.; Porbeni, B.J. Genetic variation and intraspecific diversity for agro-morphological and nutritional traits in African yam bean. J. Crop Improv. 2020, 34, 139–163. [Google Scholar] [CrossRef]
  31. Olomitutu, O.E.; Abe, A.; Oyatomi, O.A.; Paliwal, R.; Abberton, M.T. Assessing Intraspecific Variability and Diversity in African Yam Bean Landraces Using Agronomic Traits. Agronomy 2022, 12, 884. Available online: https://www.mdpi.com/2073-4395/12/4/884#B31-agronomy-12-00884 (accessed on 27 June 2022). [CrossRef]
  32. Nadeem, M.A.; Karaköy, T.; Yeken, M.Z.; Habyarimana, E.; Hatipoğlu, R.; Çiftçi, V.; Nawaz, M.A.; Sönmez, F.; Shahid, M.Q.; Yang, S.H.; et al. Phenotypic Characterization of 183 Turkish Common Bean Accessions for Agronomic, Trading, and Consumer-Preferred Plant Characteristics for Breeding Purposes. Agronomy 2020, 10, 272. [Google Scholar] [CrossRef] [Green Version]
  33. Olanrewaju, O.S.; Oyatomi, O.; Babalola, O.O.; Abberton, M. Genetic diversity and environmental influence on growth and yield parameters of Bambara groundnut. Front. Plant Sci. 2021, 12, 2967. [Google Scholar] [CrossRef] [PubMed]
  34. Yang, S.Y.; Grall, A.; Chapman, M.A. Origin and diversification of winged bean (Psophocarpus tetragonolobus (L. DC.), a multipurpose underutilized legume. Am. J. Bot. 2018, 105, 888–897. [Google Scholar] [CrossRef] [PubMed]
Figure 1. PCA biplot using the 17 quantitative trait scores of the 30-winged bean accessions. SYD—seed yield per plant, HSW—100-seeds weight, PWT—pod weight per plant, NLP—number of locules per pod, NSP—number of seeds per pod, D50P—days to fifty percent peduncle initiation, DFF—days to first flowering, D50F—days to fifty percent flowering, DPM—days to first pod maturity, D50M—days to fifty percent maturity, NPd—number of pods per peduncle, NPP—number of pods per plant, PL—pod length, PW—pod width, SL—seed length, SW—seed width, ST—seed thickness.
Crops 03 00017 g001
Figure 2. A cluster of the 30-winged bean accessions derived from 17 agro-morphological data of traits studied.
Crops 03 00017 g002
Figure 3. Dendrogram based on the 11 seed morphometric traits generated from the Videometer MSI system.
Crops 03 00017 g003
Figure 4. Correlation coefficients among seed morphometric traits of the winged bean accessions. Lnth—seed length, Wdth—seed width, Hue—seed hue, Per—seed perimeter, ForFact—seed form factor, Cmptnss—seed compactness, Ecc—seed eccentricity, Recty—seed rectangularity, CI—seed circularity index, EI—seed eccentricity index.
Crops 03 00017 g004
Table 1. List of the winged bean accessions used for this study and their countries of origin.
S/NAccession NumberSources
1TPt-2Nigeria
2TPt-3Nigeria
3TPt-4Trinidad and Tobago
4TPt-5Nigeria
5TPt-6Nigeria
6TPt-7Unknown
7TPt-9Unknown
8TPt-10Papua New Guinea
9TPt-11Costa Rica
10TPt-12Liberia
11TPt-14Indonesia
12TPt-15Indonesia
13TPt-16Indonesia
14TPt-17Indonesia
15TPt-18Unknown
16TPt-19Nigeria
17TPt-21Papua New Guinea
18TPt-22Papua New Guinea
19TPt-26Nigeria
20TPt-30Unknown
21TPt-31Indonesia
22TPt-32Unknown
23TPt-33Unknown
24TPt-43Unknown
25TPt-48Unknown
26TPt-51Bangladesh
27TPt-53Bangladesh
28TPt-126Unknown
29TPt-153Unknown
30TPt-154Unknown
Table 2. The descriptions of the seed morphometric features measured.
S/NParametersDescriptions/Mode of Estimation
1Seed length (mm)Longest dimension of the seed taken at the base of the seed.
2Seed width (mm)Cross section taken at the right angle to the length of the seed.
3Seed area (mm2)Product of seed length and seed width.
4Seed Perimeter (mm)The number of pixels in the boundary of the object.
5Seed Rectangularity (mm)The ratio of the object to the area of the minimum bounding rectangle.
6Seed hueColor appearance parameter.
7Seed compactnessThe ratio of the area of an object to the area of a circle with the same perimeter.
8Seed circularity index (CI)This is how alike a circle the shape of the seed is. CI = 4πArea/(Perimeter)2
9Seed eccentricity index-ratio (EI)The measure of aspect ratio. EI = SL/SW.
mm-millimeter, mm2-square millimeters.
Table 3. Combined mean squares for yield traits of thirty-winged bean accessions evaluated across the three environments.
SOVEnvAccnRep (Env)Accn*EnvErrorCV (%)
DF229658174.00
SYD (g)27,165.29 **2676.63 **6658.00 **612.77521.0443.8
HSW (g)301.32 **102.06 **24.0728.48 *23.4215.5
PWT112,784.02 **9480.81 **31,057.73 **2339.60 **2438.0942.4
NLP52.34 **22.57 **7.05 **2.601.989.0
NSP1.11 **0.58 **0.13 **0.050.0312.5
D50P8017.31 **150.30 **24.6827.38 *18.407.5
DFF5987.73 **223.16 **3.2420.3419.936.7
D50F8782.07 **302.19 **43.1618.3523.846.6
DPM11,124.58 **815.00 **154.82 *86.44 *60.848.5
D50M13,027.07 **867.75 **389.78 **144.00 **72.268.6
NPd1.74 **3.36 **0.420.44 **0.2030.8
NPP2164.70 **334.32 **845.66 **69.8875.8139.3
PL (cm)5.67 *78.63 **4.19 *1.511.456.4
PW (mm)47.58 **24.24 **14.14 **1.351.839.5
SL (mm)3.70 **3.36 **0.110.159 *0.113.7
SW (mm)8.02 **3.19 **0.110.070.073.3
ST (mm)9.47 **1.66 **0.26 *0.120.094.5
*, ** significant at 5% and 1% levels, respectively. SOV—source of variation, Env—environment, Accn—accession, Rep—replicates, CV—coefficient of variation, DF—degree of freedom, g—grams, cm—centimeter, mm—millimeter, SYD—seed yield per plant, HSW—100-seeds weight, PWT—pod weight per plant, NLP—number of locules per pod, NSP—number of seeds per pod, D50P—days to fifty percent peduncle initiation, DFF—days to first flowering, D50F—days to fifty percent flowering, DPM—days to first pod maturity, D50M—days to fifty percent maturity, NPd—number of pods per peduncle, NPP—number of pods per plant, PL—pod length, PW—pod width, SL—seed length, SW—seed width, ST—seed thickness.
Table 4. Average performance of the 30-winged bean accessions with respect to the traits evaluated across three environments.
ACCNSYDHSWPWTNLPNSPD50PDFFD50FDPMD50MNPdNPPPLPWSLSWST
TPt-1083.2235.52173.7512.4412.3360.5669.1177.2295.56105.331.4432.4419.6616.068.988.147.01
TPt-1176.9628.02139.3010.5610.3357.3365.6770.5694.22107.001.5631.1117.3215.758.627.916.83
TPt-1272.4737.62157.7711.0010.8957.3365.4472.3395.11106.001.5630.0018.3817.159.368.326.87
TPt-12649.8231.41123.8611.7811.3353.2258.0069.6787.7898.781.4421.3320.5015.668.818.166.86
TPt-1465.6031.19141.0812.8912.6757.8966.2272.2291.78102.221.1123.0021.0117.318.888.166.89
TPt-1570.5529.54146.3013.2212.7859.2267.3374.8996.67107.671.2224.7821.3216.968.908.286.96
TPt-15359.7332.09137.1512.8912.3356.3364.0073.7890.22102.221.5621.6722.5516.219.038.186.78
TPt-15466.4731.82154.1911.3311.1156.7862.2270.3392.00103.001.2227.6717.9615.788.668.197.24
TPt-1653.0930.04122.9111.5611.2260.8968.3374.8995.33107.561.4425.0019.3216.298.897.966.64
TPt-1755.9027.37120.8311.7811.6755.4464.6773.7891.56102.111.1123.4418.8014.888.868.216.98
TPt-1871.8831.86157.1212.8912.5655.1163.7872.1190.44101.561.2226.4419.5316.829.008.036.78
TPt-1969.0731.24152.1412.1111.8956.8961.8975.0088.67102.331.2226.0020.5016.378.788.237.04
TPt-277.7933.03190.4112.2212.3355.4463.7874.3394.67105.561.6731.1121.2216.359.148.306.72
TPt-2150.4530.60105.5312.2212.1155.3360.4470.6789.2299.671.4418.7820.1915.798.848.257.09
TPt-2276.7731.34172.0113.0012.7857.1162.3370.5683.6797.001.4427.5620.9215.899.258.537.09
TPt-2670.1834.47174.9913.0012.6757.5663.1172.3389.33101.561.3328.3321.5916.678.978.296.90
TPt-360.9729.64134.7313.3313.1158.3364.6774.0094.44105.781.2221.8921.4815.908.798.076.65
TPt-3061.8931.73131.6611.6711.4456.3363.4473.2288.78100.781.2223.8919.1615.898.838.136.83
TPt-3199.7630.90197.5013.4413.2255.0063.3372.0086.1198.331.5634.2220.8715.458.708.166.86
TPt-3227.6533.6881.899.118.8956.7864.7872.8992.33104.221.1120.2218.2715.949.188.577.26
TPt-3330.5830.9079.8911.8911.6760.0068.7878.8993.44104.781.1113.5621.4518.438.938.306.78
TPt-463.7932.43136.3212.1111.7855.7865.2271.7893.44102.441.1122.7820.9616.749.098.106.66
TPt-4356.9130.59123.8412.2212.1158.5669.8980.6798.56113.441.2223.0019.4013.948.557.846.67
TPt-4879.1930.88165.5112.6712.6754.7864.7872.2291.78104.001.6728.6720.7816.539.168.026.88
TPt-545.1930.50120.2812.0011.6759.7867.8977.0094.78107.111.5622.1118.7016.018.508.026.60
TPt-5165.1334.14144.9311.8911.7856.6763.6772.1190.56104.001.2224.5620.0315.849.058.146.88
TPt-5370.6131.10153.4313.2214.5659.2264.5677.5696.44107.001.5624.0020.1915.338.598.086.95
TPt-649.5632.04125.8911.0010.7857.7865.4474.4494.67107.891.5623.0019.6915.629.008.126.67
TPt-716.7214.0747.095.445.3377.2288.11102.00140.78154.224.5648.005.338.275.765.024.71
TPt-949.1629.53108.8611.8911.2257.1164.1174.6788.56101.561.3320.3318.8415.498.738.096.73
mean61.5730.98137.3711.8911.7157.8665.5074.6093.70105.501.4725.6319.5315.848.808.066.79
LSD25.067.8054.180.991.364.014.094.607.448.470.429.371.151.390.310.250.29
SYD—seed yield per plant, HSW—100-seeds weight, PWT—pod weight per plant, NLP—number of locules per pod, NSP—number of seeds per pod, D50P—days to fifty percent peduncle initiation, DFF—days to first flowering, D50F—days to fifty percent flowering, DPM—days to first pod maturity, D50M—days to fifty percent maturity, NPd—number of pods per peduncle, NPP—number of pods per plant, PL—pod length, PW—pod width, SL—seed length, SW—seed width, ST—seed thickness, LSD—least significant difference.
Table 5. Genotypic correlation coefficients among 17 agro-morphological traits of 30-winged bean accessions evaluated across the three environments.
TraitsSYDHSWPWTNLPNSPD50PDFFD50FDPMD50MNPdNPPPLPWSLSW
HSW0.52 *
PWT0.99 **0.60 **
NLP0.76 **0.81 **0.79 **
NSP0.76 **0.75 **0.81 **1.00 **
D50P−0.60 **−0.81 **−0.62 **−0.81 **−0.77 **
DFF−0.56 **−0.82 **−0.64 **−0.77 **−0.75 **1.00 **
D50F−0.62 **−0.86 **−0.65 **−0.72 **−0.67 **1.00 **0.99 **
DPM−0.61 **−0.93 **−0.69 **−0.85 **−0.81 **1.00 **1.00 **1.00 **
D50M−0.63 **−1.00 **−0.71 **−0.89 **−0.84 **1.00 **1.00 **1.00 **1.00 **
NPd−0.48 **−0.94 **−0.50 **−0.84 **−0.82 **0.94 **0.89 **0.95 **1.00 **1.00 **
NPP0.11−0.57 **−0.03−0.58−0.55 *0.79 **0.71 **0.63 **0.77 **0.80 **0.91 **
PL0.57 **0.91 **0.63 **0.92 **0.90 **−0.92 **−0.86 **−0.83 **−0.94 **−0.98 **−0.93 **−0.79 **
PW0.45 **1.00 **0.51 **0.76 **0.73 **−0.85 **−0.77 **−0.86 **−0.88 **−0.94 **−0.94 **−0.78 **0.89 **
SL0.55 **0.99 **0.63 **0.77 **0.74 **−0.99 **−0.88 **−0.94 **−0.97 **−1.00 **−0.97 **−0.71 **0.91 **0.95 **
SW0.49 **0.95 **0.56 **0.78 **0.76 **−0.98 **−0.93 **−0.93 **−1.00 **−1.00 **−1.00 **−0.80 **0.91 **0.91 **0.97 **
ST0.52 **0.78 **0.56 **0.73 **0.72 **−0.97 **−0.94 **−0.94 **−0.99 **−1.00 **−0.97 **−0.73 **0.83 **0.84 **0.91 **0.97 **
*, ** significant at 0.05 and 0.01 levels of probability, respectively. SYD—seed yield per plant, HSW—100-seeds weight, PWT—pod weight per plant, NLP—number of locules per pod, NSP—number of seeds per pod, D50P—days to fifty percent peduncle initiation, DFF—days to first flowering, D50F—days to fifty percent flowering, DPM—days to first pod maturity, D50M—days to fifty percent maturity, NPd—number of pods per peduncle, NPP—number of pods per plant, PL—pod length, PW—pod width, SL—seed length, SW—seed width, ST—seed thickness.
Table 6. Phenotypic correlation coefficients among 17 agro-morphological traits of 30-winged bean accessions evaluated across the three environments.
TraitsSYDHSWPWTNLPNSPD50PDFFD50FDPMD50MNPdNPPPLPWSLSW
HSW0.45 *
PWT0.95 **0.56 **
NLP0.68 **0.62 **0.7 **
NSP0.69 **0.6 **0.71 **0.98 **
D50P−0.56 **−0.8 **−0.59 **−0.72 **−0.68 **
DFF−0.52 *−0.79 **−0.57 **−0.71 **−0.68 **0.95 **
D50F−0.58 **−0.81 **−0.59 **−0.69 **−0.63 **0.94 **0.94 **
DPM−0.53 **−0.81 **−0.56 **−0.78 **−0.73 **0.93 **0.94 **0.93 **
D50M−0.53 *−0.81 **−0.56 **−0.79 **−0.74 **0.94 **0.95 **0.95 **0.99 **
NPd−0.38 *−0.8 **−0.4 *−0.74 **−0.69 **0.85 **0.81 **0.85 **0.9 **0.9 **
NPP0.17−0.55 *0.14 **−0.51 **−0.46 **0.57 **0.57 *0.53 **0.64 **0.66 **0.78 **
PL0.52 *0.8 **0.58 **0.91 **0.87 **−0.83 **−0.81 **−0.8 **−0.88 **−0.89 **−0.86 **−0.69 **
PW0.41 *0.83 **0.46 *0.72 **0.67 **−0.75 **−0.72 **−0.8 **−0.82 **−0.84 **−0.85 **−0.67 **0.87 **
SL0.48 **0.91 **0.55 **0.72 **0.68 **−0.89 **−0.84 **−0.9 **−0.9 **−0.91 **−0.89 **−0.64 **0.89 **0.9 **
SW0.45 *0.88 **0.51 **0.74 **0.71 **−0.89 **−0.88 **−0.9 **−0.94 **−0.95 **−0.93 **−0.7 **0.9 **0.88 **0.96 **
ST0.47 **0.81 **0.49 **0.68 **0.66 **−0.88 **−0.89 **−0.9 **−0.91 **−0.92 **−0.9 **−0.64 **0.81 **0.8 **0.89 **0.95 **
*, ** significant at 0.05 and 0.01 levels of probability, respectively. SYD—seed yield per plant, HSW—100-seeds weight, PWT—pod weight per plant, NLP—number of locules per pod, NSP—number of seeds per pod, D50P—days to fifty percent peduncle initiation, DFF—days to first flowering, D50F—days to fifty percent flowering, DPM—days to first pod maturity, D50M—days to fifty percent maturity, NPd—number of pods per peduncle, NPP—number of pods per plant, PL—pod length, PW—pod width, SL—seed length, SW—seed width, ST—seed thickness.
Table 7. Principal components of the 30 winged bean accessions based on agro-morphological traits.
TraitsPC1PC2PC3
SYD (g)−0.16−0.560.06
HSW (g)−0.240.000.20
PWT (g)−0.17−0.540.08
NLP−0.24−0.18−0.49
NSP−0.23−0.22−0.52
D50P0.26−0.04−0.21
DFF0.25−0.05−0.21
D50F0.26−0.02−0.30
DPM0.27−0.05−0.09
D50M0.27−0.05−0.08
NPd0.26−0.170.06
NPP0.17−0.500.33
PL (cm)−0.260.01−0.29
PW (mm)−0.250.10−0.08
SL (mm)−0.260.060.12
SW (mm)−0.270.100.07
ST (mm)−0.260.070.18
Eigenvalues3.591.420.91
Percent variance (%)76.4811.704.82
Cumulative variance (%)76.4888.1792.99
PC—principal components, SYD—seed yield per plant, HSW—100-seeds weight, PWT—pod weight per plant, NLP—number of locules per pod, NSP—number of seeds per pod, D50P—days to fifty percent peduncle initiation, DFF—days to first flowering, D50F—days to fifty percent flowering, DPM—days to first pod maturity, D50M—days to fifty percent maturity, NPd—number of pods per peduncle, NPP—number of pods per plant, PL—pod length, PW—pod width, SL—seed length, SW—seed width, ST—seed thickness, mm—millimeter, cm—centimeter, g—gram, %—percentage. Eigenvectors ≥ 2.0, which largely controlled each principal component axes, are in bold.
Table 8. Descriptive statistics of eleven seed morphometric traits of winged bean.
ParametersMeanMinimumMaximumStandard DeviationCV
Seed area (mm2)56.425.1462.756.310.11
Seed circularity index1.181.081.190.020.02
Seed compactness0.900.830.920.020.02
Seed eccentricity0.420.360.520.030.07
Seed eccentricity index1.111.081.190.020.02
Seed form factor0.910.880.920.010.01
Seed hue0.990.941.250.060.06
Seed length (mm)8.946.189.630.560.06
Seed perimeter (mm)24.417.1125.971.480.06
Seed rectangularity0.800.790.830.010.01
Seed width (mm)8.075.188.530.570.07
Disclaimer/Publisher’s Note: The statements, opinions and data contained in all publications are solely those of the individual author(s) and contributor(s) and not of MDPI and/or the editor(s). MDPI and/or the editor(s) disclaim responsibility for any injury to people or property resulting from any ideas, methods, instructions or products referred to in the content.

